Iowa County, IA Map & Demographics
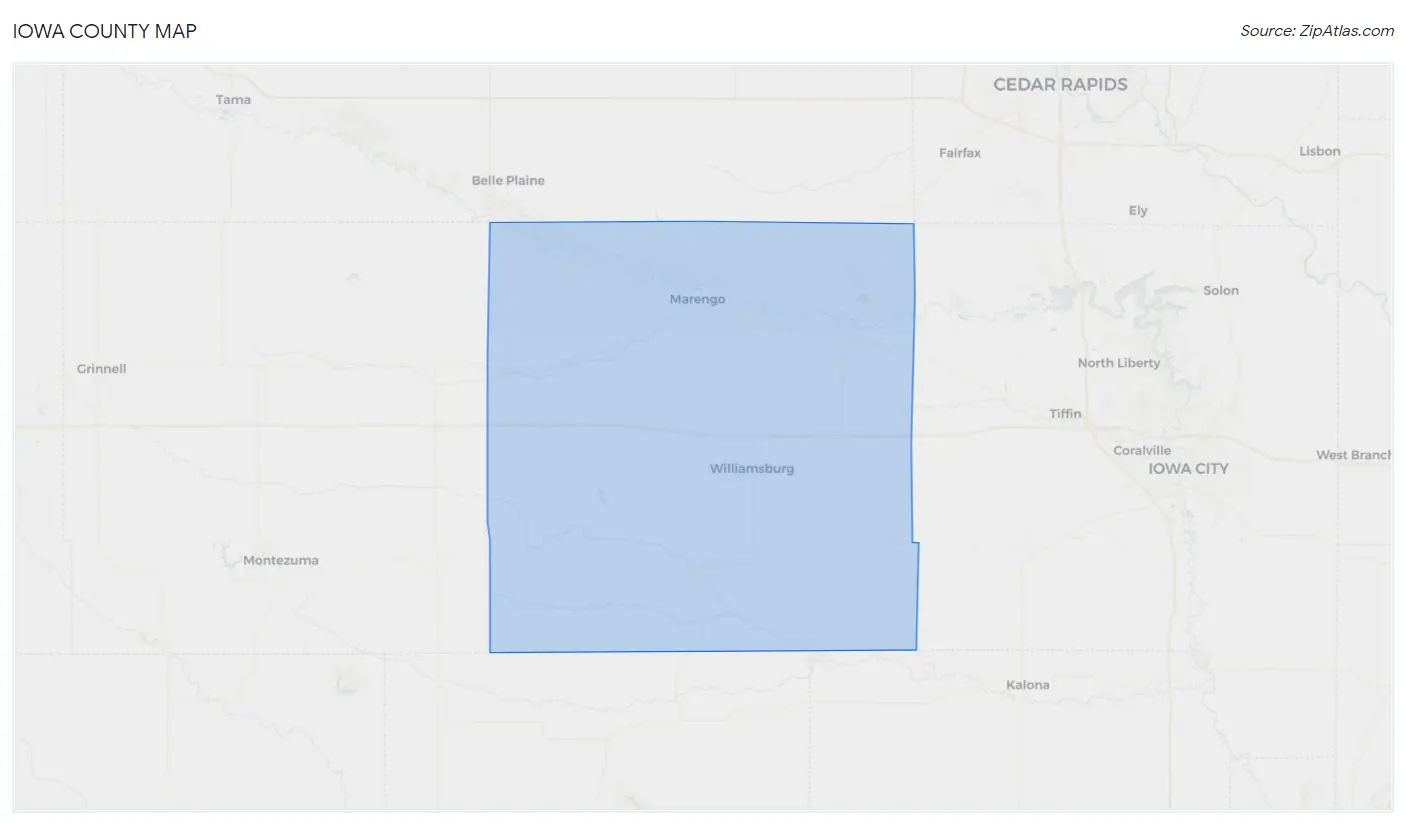
Iowa County Map
Iowa County Overview
$40,182
PER CAPITA INCOME
$90,301
AVG FAMILY INCOME
$69,787
AVG HOUSEHOLD INCOME
29.3%
WAGE / INCOME GAP [ % ]
70.7¢/ $1
WAGE / INCOME GAP [ $ ]
$10,555
FAMILY INCOME DEFICIT
0.45
INEQUALITY / GINI INDEX
16,575
TOTAL POPULATION
8,470
MALE POPULATION
8,105
FEMALE POPULATION
104.50
MALES / 100 FEMALES
95.69
FEMALES / 100 MALES
42.2
MEDIAN AGE
3.0
AVG FAMILY SIZE
2.4
AVG HOUSEHOLD SIZE
8,781
LABOR FORCE [ PEOPLE ]
66.8%
PERCENT IN LABOR FORCE
3.2%
UNEMPLOYMENT RATE
Iowa County Area Codes
Income in Iowa County
Income Overview in Iowa County
Per Capita Income in Iowa County is $40,182, while median incomes of families and households are $90,301 and $69,787 respectively.
| Characteristic | Number | Measure |
| Per Capita Income | 16,575 | $40,182 |
| Median Family Income | 4,379 | $90,301 |
| Mean Family Income | 4,379 | $120,234 |
| Median Household Income | 6,798 | $69,787 |
| Mean Household Income | 6,798 | $97,019 |
| Income Deficit | 4,379 | $10,555 |
| Wage / Income Gap (%) | 16,575 | 29.27% |
| Wage / Income Gap ($) | 16,575 | 70.73¢ per $1 |
| Gini / Inequality Index | 16,575 | 0.45 |
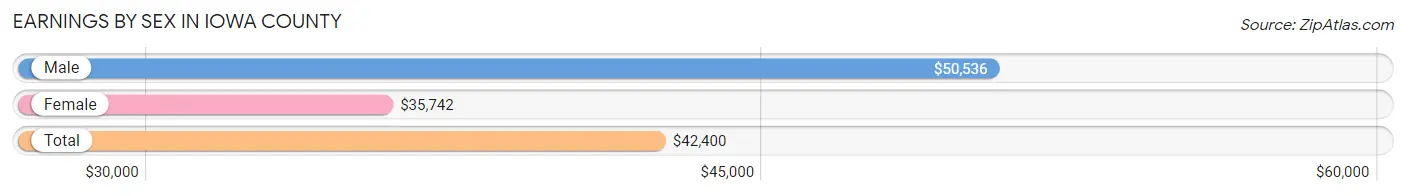
Earnings by Sex in Iowa County
Average Earnings in Iowa County are $42,400, $50,536 for men and $35,742 for women, a difference of 29.3%.
| Sex | Number | Average Earnings |
| Male | 4,969 (52.8%) | $50,536 |
| Female | 4,440 (47.2%) | $35,742 |
| Total | 9,409 (100.0%) | $42,400 |
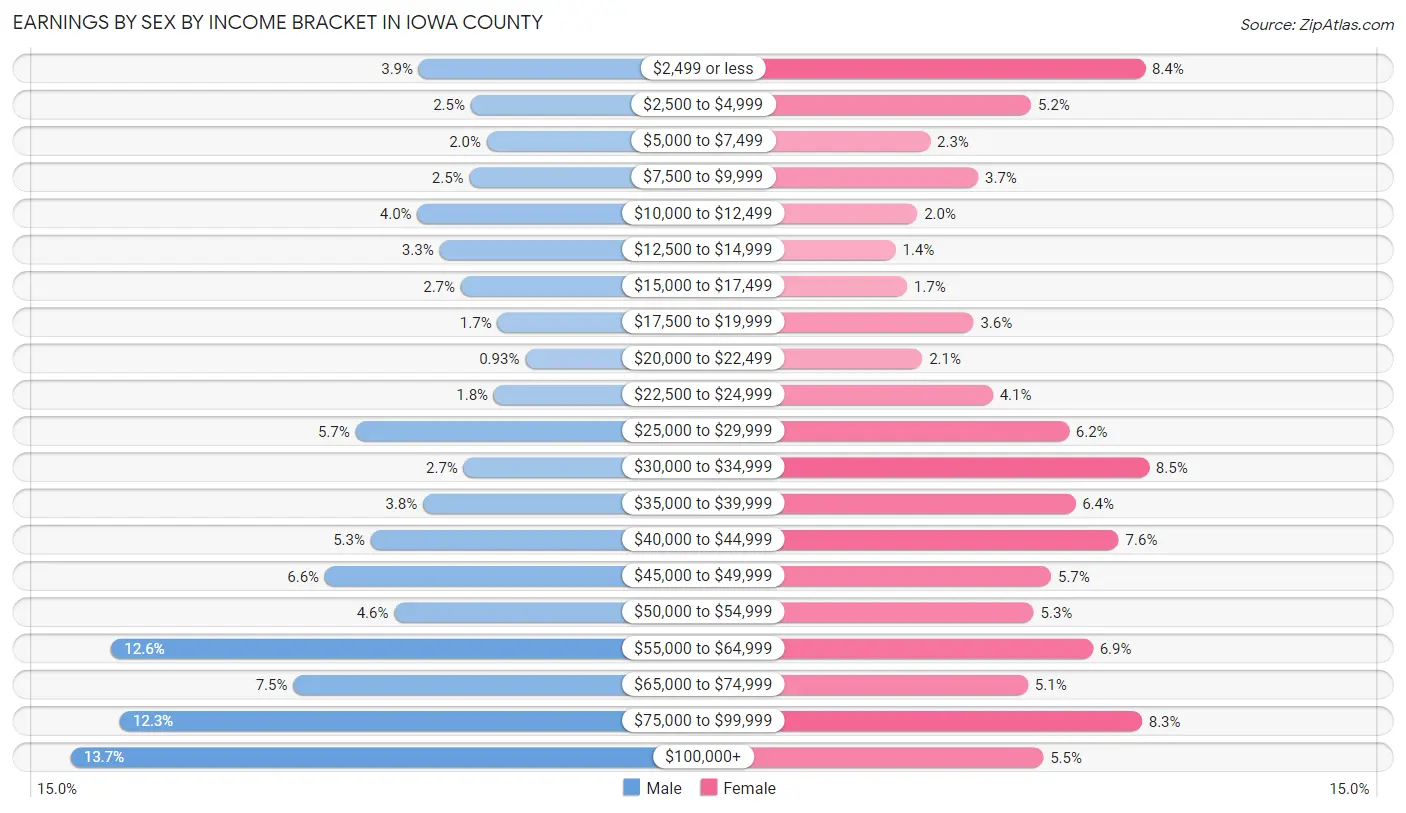
Earnings by Sex by Income Bracket in Iowa County
The most common earnings brackets in Iowa County are $100,000+ for men (681 | 13.7%) and $30,000 to $34,999 for women (377 | 8.5%).
| Income | Male | Female |
| $2,499 or less | 195 (3.9%) | 372 (8.4%) |
| $2,500 to $4,999 | 122 (2.5%) | 230 (5.2%) |
| $5,000 to $7,499 | 100 (2.0%) | 104 (2.3%) |
| $7,500 to $9,999 | 124 (2.5%) | 164 (3.7%) |
| $10,000 to $12,499 | 197 (4.0%) | 88 (2.0%) |
| $12,500 to $14,999 | 166 (3.3%) | 61 (1.4%) |
| $15,000 to $17,499 | 136 (2.7%) | 75 (1.7%) |
| $17,500 to $19,999 | 85 (1.7%) | 158 (3.6%) |
| $20,000 to $22,499 | 46 (0.9%) | 94 (2.1%) |
| $22,500 to $24,999 | 90 (1.8%) | 182 (4.1%) |
| $25,000 to $29,999 | 283 (5.7%) | 277 (6.2%) |
| $30,000 to $34,999 | 132 (2.7%) | 377 (8.5%) |
| $35,000 to $39,999 | 189 (3.8%) | 285 (6.4%) |
| $40,000 to $44,999 | 262 (5.3%) | 339 (7.6%) |
| $45,000 to $49,999 | 326 (6.6%) | 255 (5.7%) |
| $50,000 to $54,999 | 229 (4.6%) | 233 (5.2%) |
| $55,000 to $64,999 | 624 (12.6%) | 307 (6.9%) |
| $65,000 to $74,999 | 370 (7.4%) | 226 (5.1%) |
| $75,000 to $99,999 | 612 (12.3%) | 368 (8.3%) |
| $100,000+ | 681 (13.7%) | 245 (5.5%) |
| Total | 4,969 (100.0%) | 4,440 (100.0%) |
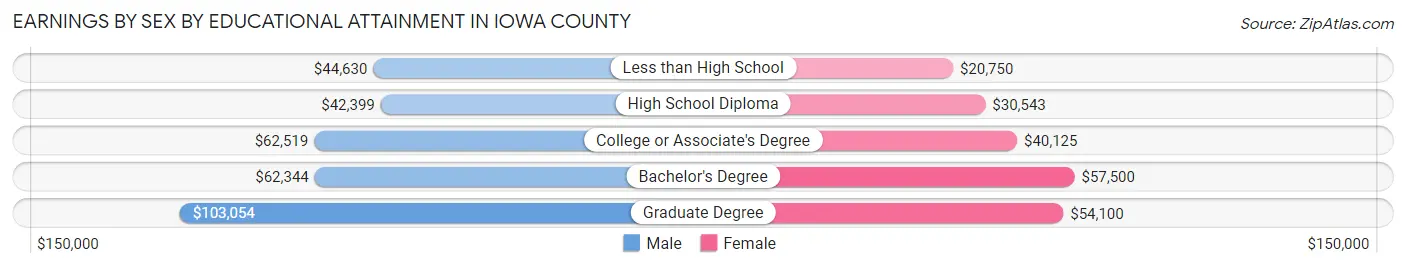
Earnings by Sex by Educational Attainment in Iowa County
Average earnings in Iowa County are $56,476 for men and $40,203 for women, a difference of 28.8%. Men with an educational attainment of graduate degree enjoy the highest average annual earnings of $103,054, while those with high school diploma education earn the least with $42,399. Women with an educational attainment of bachelor's degree earn the most with the average annual earnings of $57,500, while those with less than high school education have the smallest earnings of $20,750.
| Educational Attainment | Male Income | Female Income |
| Less than High School | $44,630 | $20,750 |
| High School Diploma | $42,399 | $30,543 |
| College or Associate's Degree | $62,519 | $40,125 |
| Bachelor's Degree | $62,344 | $57,500 |
| Graduate Degree | $103,054 | $54,100 |
| Total | $56,476 | $40,203 |
Family Income in Iowa County
Family Income Brackets in Iowa County
According to the Iowa County family income data, there are 946 families falling into the $100,000 to $149,999 income range, which is the most common income bracket and makes up 21.6% of all families. Conversely, the $10,000 to $14,999 income bracket is the least frequent group with only 70 families (1.6%) belonging to this category.
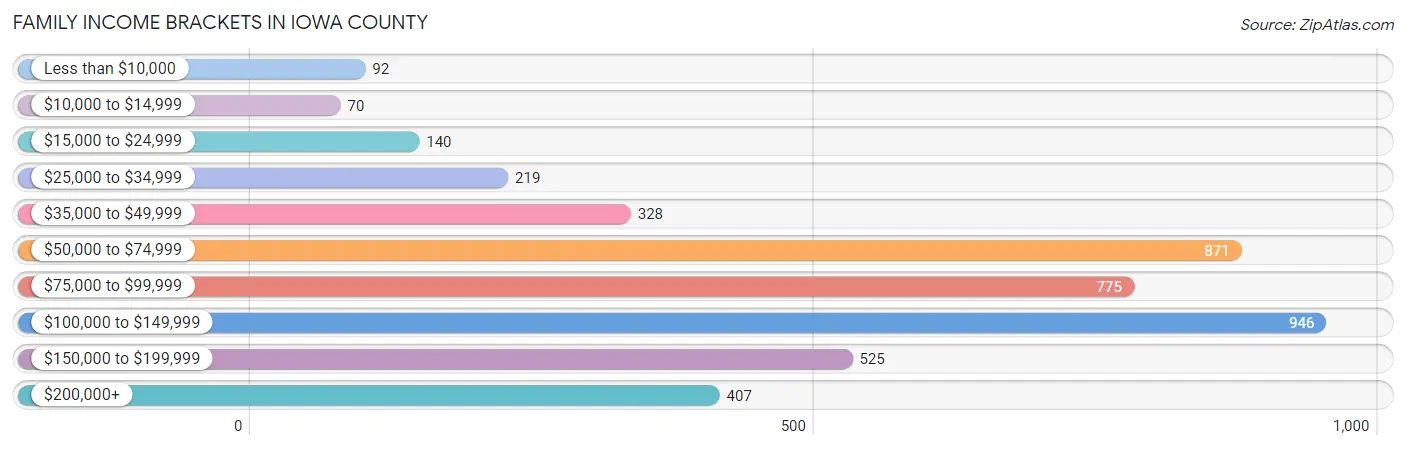
| Income Bracket | # Families | % Families |
| Less than $10,000 | 92 | 2.1% |
| $10,000 to $14,999 | 70 | 1.6% |
| $15,000 to $24,999 | 140 | 3.2% |
| $25,000 to $34,999 | 219 | 5.0% |
| $35,000 to $49,999 | 328 | 7.5% |
| $50,000 to $74,999 | 871 | 19.9% |
| $75,000 to $99,999 | 775 | 17.7% |
| $100,000 to $149,999 | 946 | 21.6% |
| $150,000 to $199,999 | 525 | 12.0% |
| $200,000+ | 407 | 9.3% |
Family Income by Famaliy Size in Iowa County
4-person families (883 | 20.2%) account for the highest median family income in Iowa County with $101,354 per family, while 2-person families (2,273 | 51.9%) have the highest median income of $41,443 per family member.
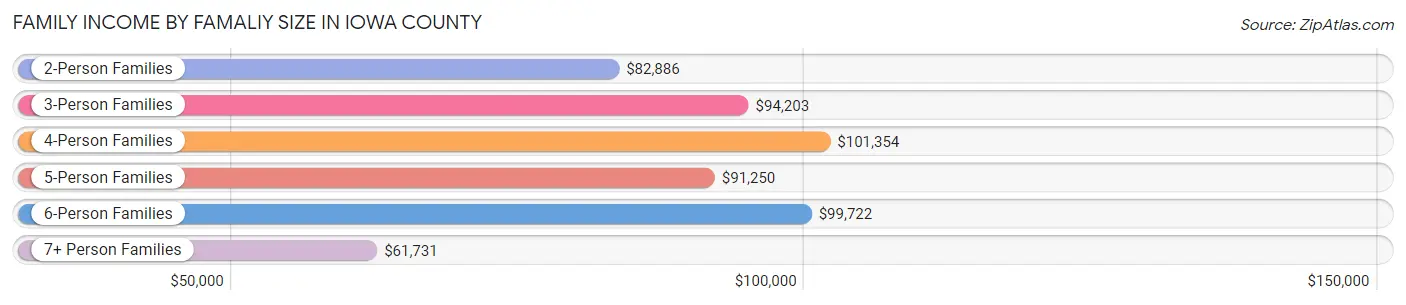
| Income Bracket | # Families | Median Income |
| 2-Person Families | 2,273 (51.9%) | $82,886 |
| 3-Person Families | 780 (17.8%) | $94,203 |
| 4-Person Families | 883 (20.2%) | $101,354 |
| 5-Person Families | 339 (7.7%) | $91,250 |
| 6-Person Families | 60 (1.4%) | $99,722 |
| 7+ Person Families | 44 (1.0%) | $61,731 |
| Total | 4,379 (100.0%) | $90,301 |
Family Income by Number of Earners in Iowa County
The median family income in Iowa County is $90,301, with families comprising 3+ earners (399) having the highest median family income of $114,293, while families with 1 earner (1,038) have the lowest median family income of $56,736, accounting for 9.1% and 23.7% of families, respectively.
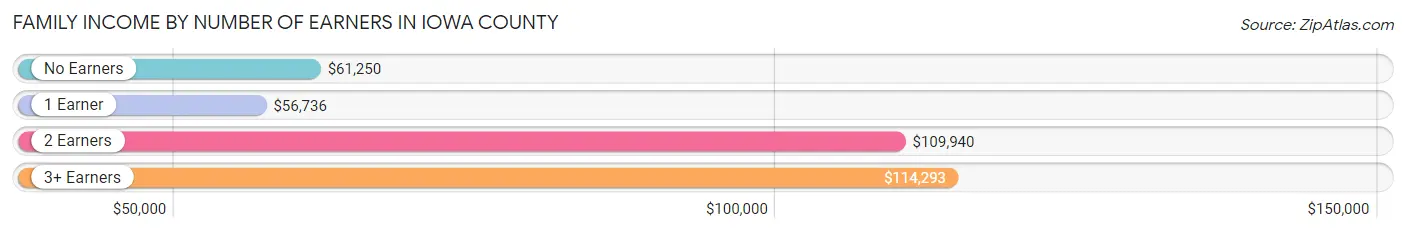
| Number of Earners | # Families | Median Income |
| No Earners | 616 (14.1%) | $61,250 |
| 1 Earner | 1,038 (23.7%) | $56,736 |
| 2 Earners | 2,326 (53.1%) | $109,940 |
| 3+ Earners | 399 (9.1%) | $114,293 |
| Total | 4,379 (100.0%) | $90,301 |
Household Income in Iowa County
Household Income Brackets in Iowa County
With 1,421 households falling in the category, the $50,000 to $74,999 income range is the most frequent in Iowa County, accounting for 20.9% of all households. In contrast, only 184 households (2.7%) fall into the $10,000 to $14,999 income bracket, making it the least populous group.
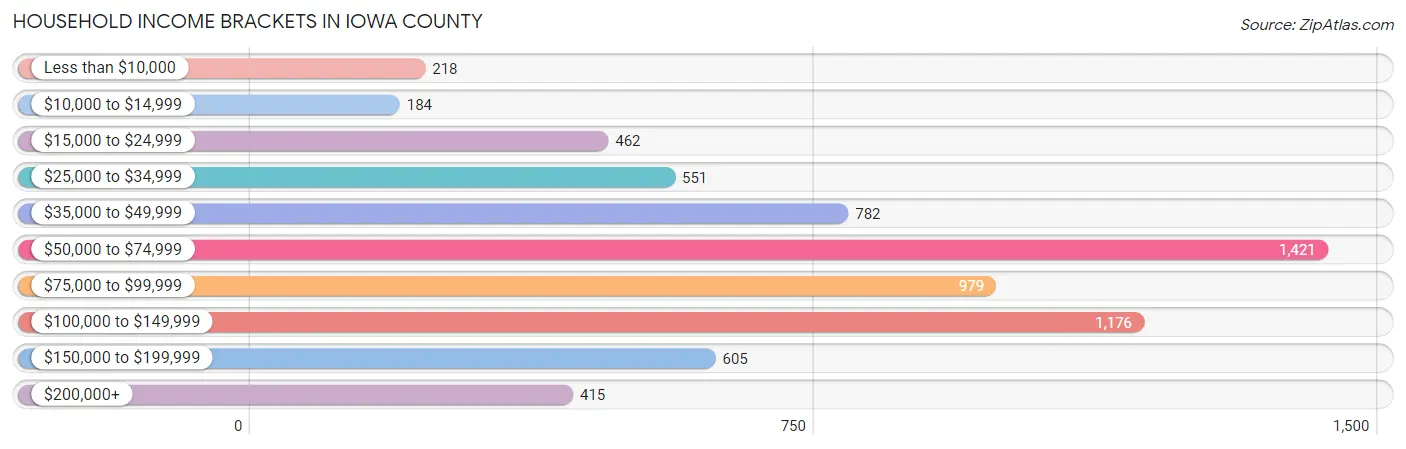
| Income Bracket | # Households | % Households |
| Less than $10,000 | 218 | 3.2% |
| $10,000 to $14,999 | 184 | 2.7% |
| $15,000 to $24,999 | 462 | 6.8% |
| $25,000 to $34,999 | 551 | 8.1% |
| $35,000 to $49,999 | 782 | 11.5% |
| $50,000 to $74,999 | 1,421 | 20.9% |
| $75,000 to $99,999 | 979 | 14.4% |
| $100,000 to $149,999 | 1,176 | 17.3% |
| $150,000 to $199,999 | 605 | 8.9% |
| $200,000+ | 415 | 6.1% |
Household Income by Householder Age in Iowa County
The median household income in Iowa County is $69,787, with the highest median household income of $92,585 found in the 45 to 64 years age bracket for the primary householder. A total of 2,502 households (36.8%) fall into this category. Meanwhile, the 15 to 24 years age bracket for the primary householder has the lowest median household income of $46,250, with 342 households (5.0%) in this group.
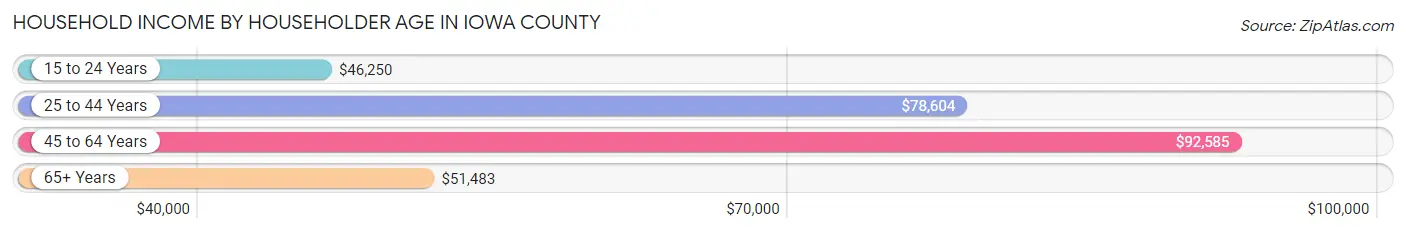
| Income Bracket | # Households | Median Income |
| 15 to 24 Years | 342 (5.0%) | $46,250 |
| 25 to 44 Years | 1,985 (29.2%) | $78,604 |
| 45 to 64 Years | 2,502 (36.8%) | $92,585 |
| 65+ Years | 1,969 (29.0%) | $51,483 |
| Total | 6,798 (100.0%) | $69,787 |
Poverty in Iowa County
Income Below Poverty by Sex and Age in Iowa County
With 8.8% poverty level for males and 9.5% for females among the residents of Iowa County, under 5 year old males and 6 to 11 year old females are the most vulnerable to poverty, with 124 males (24.3%) and 150 females (23.8%) in their respective age groups living below the poverty level.
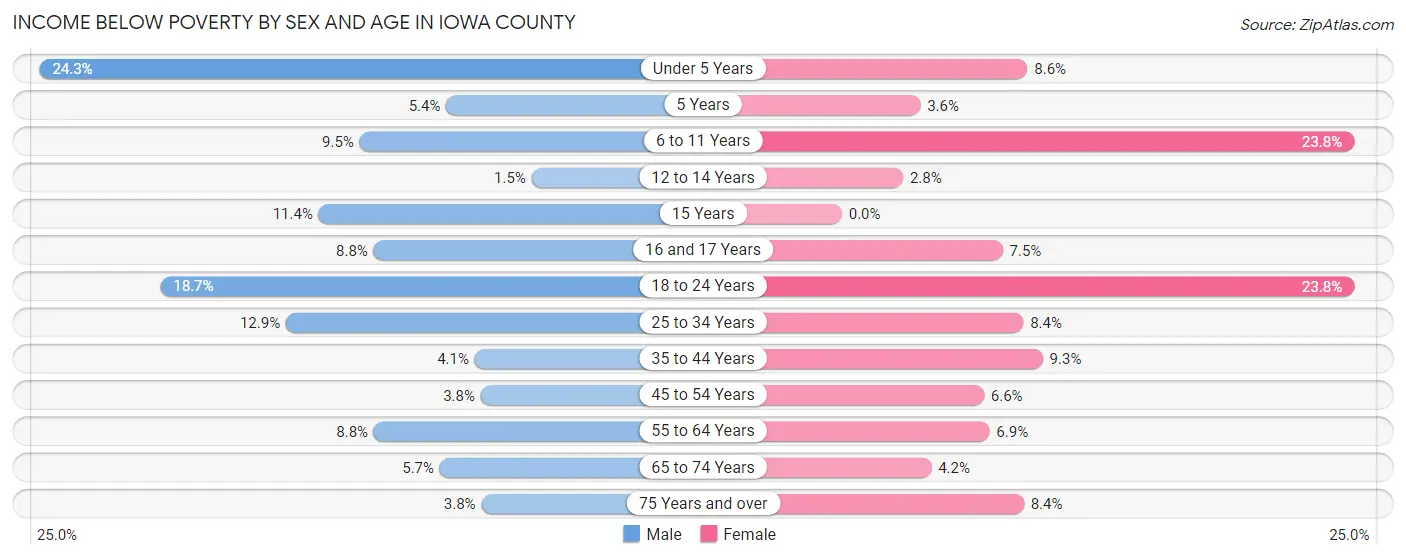
| Age Bracket | Male | Female |
| Under 5 Years | 124 (24.3%) | 36 (8.6%) |
| 5 Years | 5 (5.4%) | 2 (3.6%) |
| 6 to 11 Years | 70 (9.5%) | 150 (23.8%) |
| 12 to 14 Years | 5 (1.5%) | 11 (2.8%) |
| 15 Years | 16 (11.4%) | 0 (0.0%) |
| 16 and 17 Years | 19 (8.8%) | 17 (7.5%) |
| 18 to 24 Years | 109 (18.7%) | 135 (23.8%) |
| 25 to 34 Years | 118 (12.9%) | 70 (8.4%) |
| 35 to 44 Years | 42 (4.1%) | 92 (9.3%) |
| 45 to 54 Years | 42 (3.8%) | 60 (6.6%) |
| 55 to 64 Years | 116 (8.8%) | 84 (6.9%) |
| 65 to 74 Years | 50 (5.7%) | 35 (4.2%) |
| 75 Years and over | 21 (3.8%) | 61 (8.4%) |
| Total | 737 (8.8%) | 753 (9.5%) |
Income Above Poverty by Sex and Age in Iowa County
According to the poverty statistics in Iowa County, males aged 12 to 14 years and females aged 15 years are the age groups that are most secure financially, with 98.5% of males and 100.0% of females in these age groups living above the poverty line.
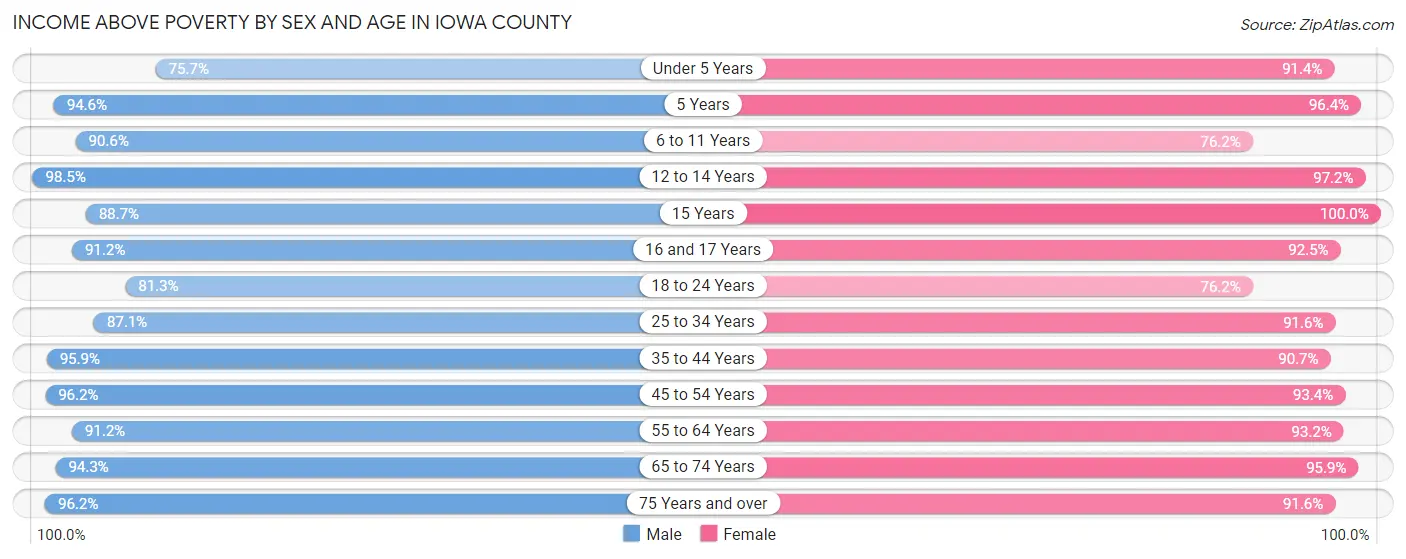
| Age Bracket | Male | Female |
| Under 5 Years | 386 (75.7%) | 382 (91.4%) |
| 5 Years | 87 (94.6%) | 53 (96.4%) |
| 6 to 11 Years | 671 (90.5%) | 481 (76.2%) |
| 12 to 14 Years | 334 (98.5%) | 376 (97.2%) |
| 15 Years | 125 (88.6%) | 109 (100.0%) |
| 16 and 17 Years | 197 (91.2%) | 211 (92.5%) |
| 18 to 24 Years | 474 (81.3%) | 433 (76.2%) |
| 25 to 34 Years | 799 (87.1%) | 761 (91.6%) |
| 35 to 44 Years | 981 (95.9%) | 895 (90.7%) |
| 45 to 54 Years | 1,056 (96.2%) | 850 (93.4%) |
| 55 to 64 Years | 1,204 (91.2%) | 1,142 (93.1%) |
| 65 to 74 Years | 822 (94.3%) | 809 (95.9%) |
| 75 Years and over | 532 (96.2%) | 662 (91.6%) |
| Total | 7,668 (91.2%) | 7,164 (90.5%) |
Income Below Poverty Among Married-Couple Families in Iowa County
The poverty statistics for married-couple families in Iowa County show that 2.0% or 72 of the total 3,553 families live below the poverty line. Families with 3 or 4 children have the highest poverty rate of 4.0%, comprising of 11 families. On the other hand, families with 5 or more children have the lowest poverty rate of 0.0%, which includes 0 families.
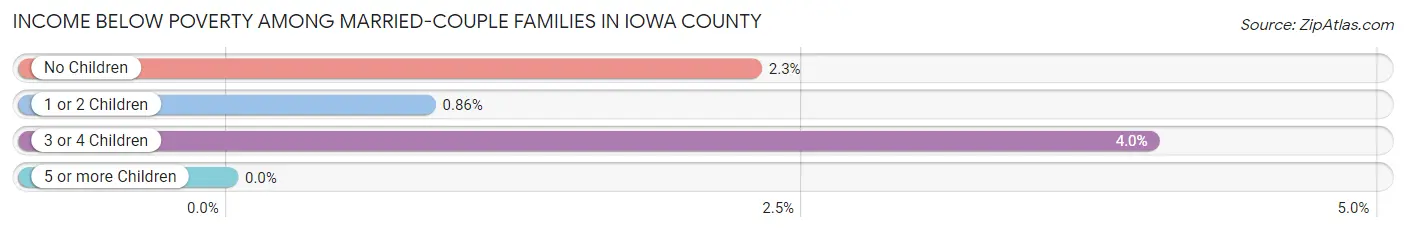
| Children | Above Poverty | Below Poverty |
| No Children | 2,270 (97.7%) | 53 (2.3%) |
| 1 or 2 Children | 917 (99.1%) | 8 (0.9%) |
| 3 or 4 Children | 263 (96.0%) | 11 (4.0%) |
| 5 or more Children | 31 (100.0%) | 0 (0.0%) |
| Total | 3,481 (98.0%) | 72 (2.0%) |
Income Below Poverty Among Single-Parent Households in Iowa County
According to the poverty data in Iowa County, 27.9% or 86 single-father households and 23.2% or 120 single-mother households are living below the poverty line. Among single-father households, those with 5 or more children have the highest poverty rate, with 13 households (100.0%) experiencing poverty. Likewise, among single-mother households, those with 1 or 2 children have the highest poverty rate, with 113 households (30.3%) falling below the poverty line.
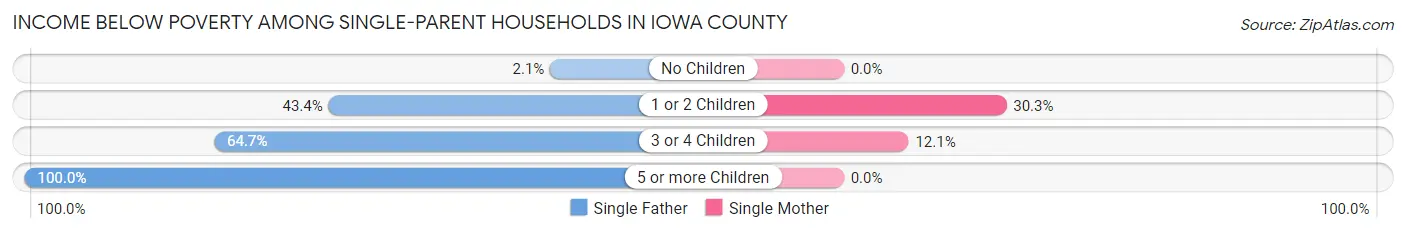
| Children | Single Father | Single Mother |
| No Children | 3 (2.1%) | 0 (0.0%) |
| 1 or 2 Children | 59 (43.4%) | 113 (30.3%) |
| 3 or 4 Children | 11 (64.7%) | 7 (12.1%) |
| 5 or more Children | 13 (100.0%) | 0 (0.0%) |
| Total | 86 (27.9%) | 120 (23.2%) |
Income Below Poverty Among Married-Couple vs Single-Parent Households in Iowa County
The poverty data for Iowa County shows that 72 of the married-couple family households (2.0%) and 206 of the single-parent households (24.9%) are living below the poverty level. Within the married-couple family households, those with 3 or 4 children have the highest poverty rate, with 11 households (4.0%) falling below the poverty line. Among the single-parent households, those with 5 or more children have the highest poverty rate, with 13 household (100.0%) living below poverty.
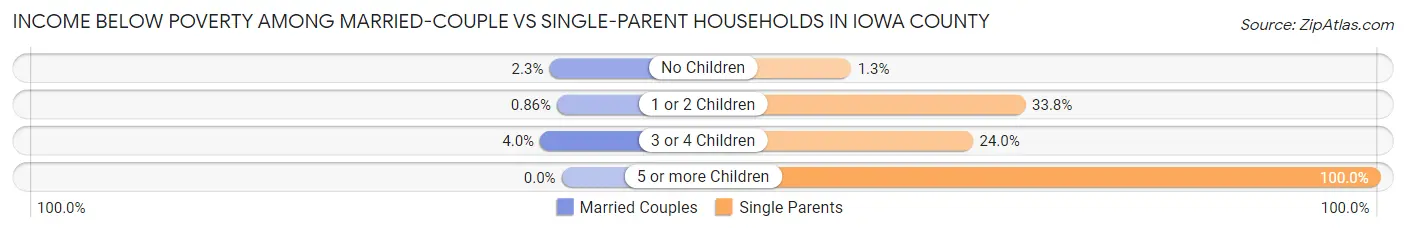
| Children | Married-Couple Families | Single-Parent Households |
| No Children | 53 (2.3%) | 3 (1.3%) |
| 1 or 2 Children | 8 (0.9%) | 172 (33.8%) |
| 3 or 4 Children | 11 (4.0%) | 18 (24.0%) |
| 5 or more Children | 0 (0.0%) | 13 (100.0%) |
| Total | 72 (2.0%) | 206 (24.9%) |
Race in Iowa County
The most populous races in Iowa County are White / Caucasian (15,771 | 95.2%), Hispanic or Latino (616 | 3.7%), and Two or more Races (571 | 3.4%).
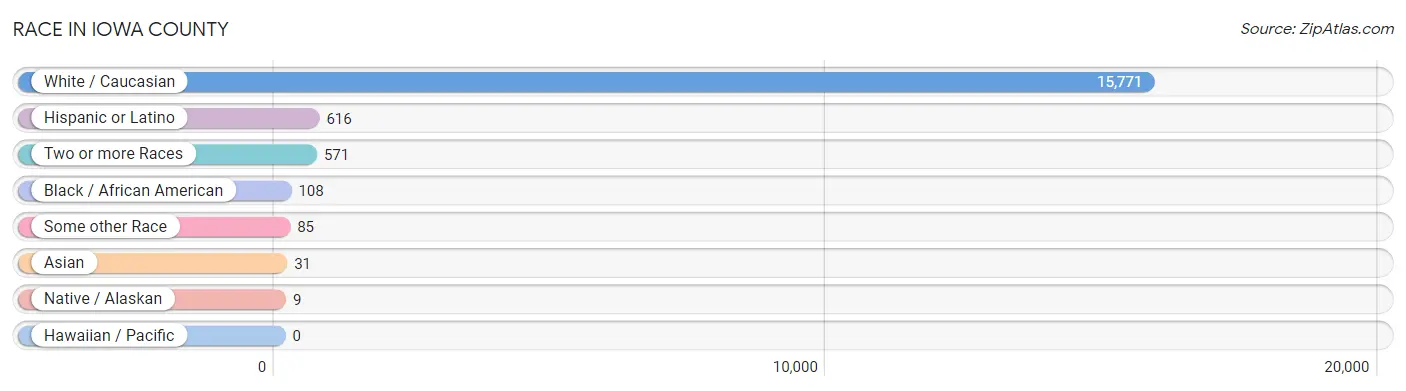
| Race | # Population | % Population |
| Asian | 31 | 0.2% |
| Black / African American | 108 | 0.6% |
| Hawaiian / Pacific | 0 | 0.0% |
| Hispanic or Latino | 616 | 3.7% |
| Native / Alaskan | 9 | 0.1% |
| White / Caucasian | 15,771 | 95.2% |
| Two or more Races | 571 | 3.4% |
| Some other Race | 85 | 0.5% |
| Total | 16,575 | 100.0% |
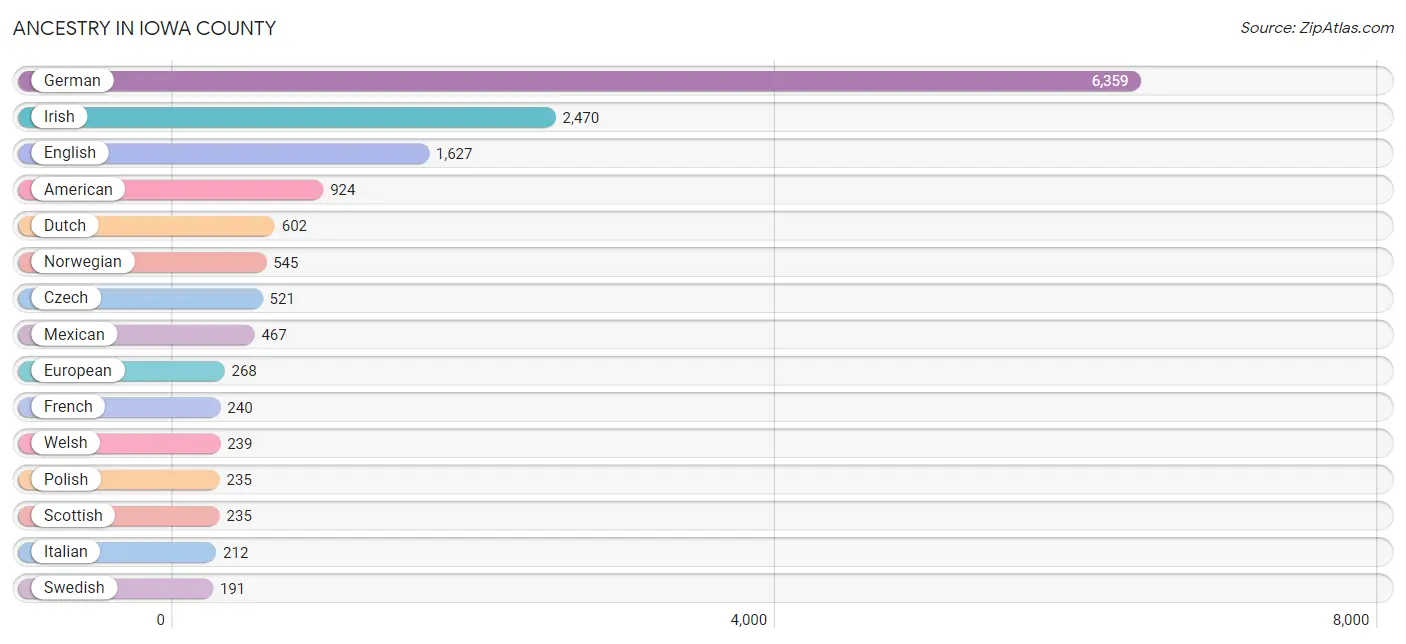
Ancestry in Iowa County
The most populous ancestries reported in Iowa County are German (6,359 | 38.4%), Irish (2,470 | 14.9%), English (1,627 | 9.8%), American (924 | 5.6%), and Dutch (602 | 3.6%), together accounting for 72.3% of all Iowa County residents.
| Ancestry | # Population | % Population |
| American | 924 | 5.6% |
| Austrian | 26 | 0.2% |
| Belgian | 139 | 0.8% |
| Bhutanese | 12 | 0.1% |
| British | 33 | 0.2% |
| Canadian | 24 | 0.1% |
| Central American | 18 | 0.1% |
| Cherokee | 29 | 0.2% |
| Chippewa | 6 | 0.0% |
| Cuban | 3 | 0.0% |
| Czech | 521 | 3.1% |
| Czechoslovakian | 35 | 0.2% |
| Danish | 177 | 1.1% |
| Dutch | 602 | 3.6% |
| Eastern European | 46 | 0.3% |
| English | 1,627 | 9.8% |
| Ethiopian | 2 | 0.0% |
| European | 268 | 1.6% |
| Finnish | 5 | 0.0% |
| French | 240 | 1.5% |
| French Canadian | 7 | 0.0% |
| German | 6,359 | 38.4% |
| German Russian | 3 | 0.0% |
| Guatemalan | 7 | 0.0% |
| Hungarian | 7 | 0.0% |
| Indonesian | 5 | 0.0% |
| Irish | 2,470 | 14.9% |
| Italian | 212 | 1.3% |
| Korean | 3 | 0.0% |
| Lithuanian | 18 | 0.1% |
| Mexican | 467 | 2.8% |
| Mexican American Indian | 13 | 0.1% |
| Northern European | 13 | 0.1% |
| Norwegian | 545 | 3.3% |
| Pakistani | 49 | 0.3% |
| Pennsylvania German | 31 | 0.2% |
| Polish | 235 | 1.4% |
| Portuguese | 6 | 0.0% |
| Puerto Rican | 30 | 0.2% |
| Russian | 14 | 0.1% |
| Salvadoran | 11 | 0.1% |
| Scandinavian | 103 | 0.6% |
| Scotch-Irish | 130 | 0.8% |
| Scottish | 235 | 1.4% |
| Serbian | 6 | 0.0% |
| Slovak | 4 | 0.0% |
| Spaniard | 28 | 0.2% |
| Spanish | 17 | 0.1% |
| Subsaharan African | 2 | 0.0% |
| Swedish | 191 | 1.1% |
| Swiss | 58 | 0.4% |
| Thai | 95 | 0.6% |
| Welsh | 239 | 1.4% |
| Yugoslavian | 15 | 0.1% | View All 54 Rows |
Immigrants in Iowa County
The most numerous immigrant groups reported in Iowa County came from Central America (94 | 0.6%), Latin America (94 | 0.6%), Mexico (87 | 0.5%), Europe (78 | 0.5%), and Eastern Europe (41 | 0.3%), together accounting for 2.4% of all Iowa County residents.
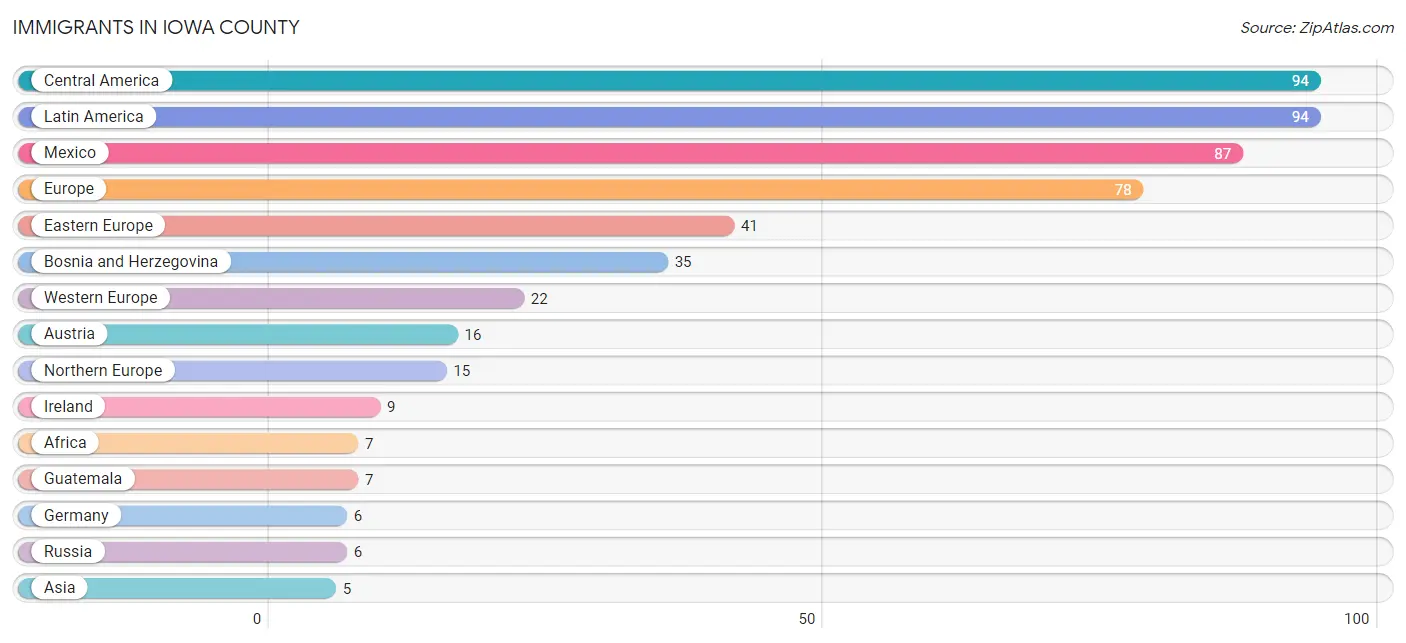
| Immigration Origin | # Population | % Population |
| Africa | 7 | 0.0% |
| Asia | 5 | 0.0% |
| Austria | 16 | 0.1% |
| Bosnia and Herzegovina | 35 | 0.2% |
| Canada | 5 | 0.0% |
| Central America | 94 | 0.6% |
| Congo | 5 | 0.0% |
| Eastern Africa | 2 | 0.0% |
| Eastern Europe | 41 | 0.3% |
| Eritrea | 2 | 0.0% |
| Europe | 78 | 0.5% |
| Germany | 6 | 0.0% |
| Guatemala | 7 | 0.0% |
| Ireland | 9 | 0.1% |
| Latin America | 94 | 0.6% |
| Mexico | 87 | 0.5% |
| Middle Africa | 5 | 0.0% |
| Northern Europe | 15 | 0.1% |
| Russia | 6 | 0.0% |
| South Eastern Asia | 5 | 0.0% |
| Sweden | 1 | 0.0% |
| Western Europe | 22 | 0.1% | View All 22 Rows |
Sex and Age in Iowa County
Sex and Age in Iowa County
The most populous age groups in Iowa County are 60 to 64 Years (735 | 8.7%) for men and 10 to 14 Years (677 | 8.4%) for women.
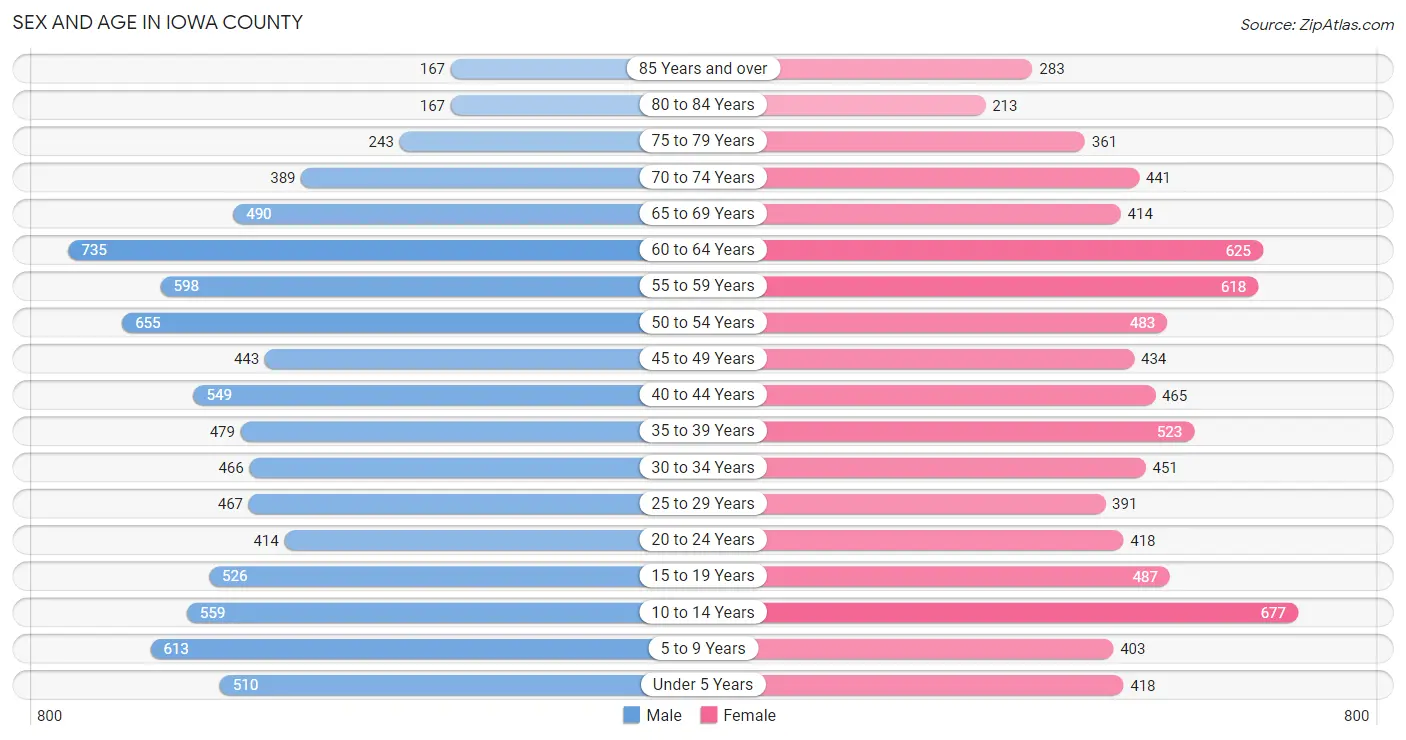
| Age Bracket | Male | Female |
| Under 5 Years | 510 (6.0%) | 418 (5.2%) |
| 5 to 9 Years | 613 (7.2%) | 403 (5.0%) |
| 10 to 14 Years | 559 (6.6%) | 677 (8.4%) |
| 15 to 19 Years | 526 (6.2%) | 487 (6.0%) |
| 20 to 24 Years | 414 (4.9%) | 418 (5.2%) |
| 25 to 29 Years | 467 (5.5%) | 391 (4.8%) |
| 30 to 34 Years | 466 (5.5%) | 451 (5.6%) |
| 35 to 39 Years | 479 (5.7%) | 523 (6.5%) |
| 40 to 44 Years | 549 (6.5%) | 465 (5.7%) |
| 45 to 49 Years | 443 (5.2%) | 434 (5.3%) |
| 50 to 54 Years | 655 (7.7%) | 483 (6.0%) |
| 55 to 59 Years | 598 (7.1%) | 618 (7.6%) |
| 60 to 64 Years | 735 (8.7%) | 625 (7.7%) |
| 65 to 69 Years | 490 (5.8%) | 414 (5.1%) |
| 70 to 74 Years | 389 (4.6%) | 441 (5.4%) |
| 75 to 79 Years | 243 (2.9%) | 361 (4.4%) |
| 80 to 84 Years | 167 (2.0%) | 213 (2.6%) |
| 85 Years and over | 167 (2.0%) | 283 (3.5%) |
| Total | 8,470 (100.0%) | 8,105 (100.0%) |
Families and Households in Iowa County
Median Family Size in Iowa County
The median family size in Iowa County is 2.97 persons per family, with single female/mother families (518 | 11.8%) accounting for the largest median family size of 3.01 persons per family. On the other hand, single male/father families (308 | 7.0%) represent the smallest median family size with 2.91 persons per family.
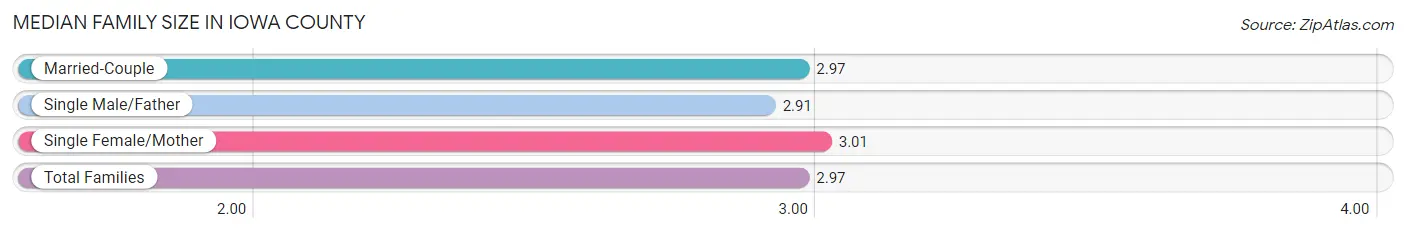
| Family Type | # Families | Family Size |
| Married-Couple | 3,553 (81.1%) | 2.97 |
| Single Male/Father | 308 (7.0%) | 2.91 |
| Single Female/Mother | 518 (11.8%) | 3.01 |
| Total Families | 4,379 (100.0%) | 2.97 |
Median Household Size in Iowa County
The median household size in Iowa County is 2.39 persons per household, with single male/father households (308 | 4.5%) accounting for the largest median household size of 3.37 persons per household. non-family households (2,419 | 35.6%) represent the smallest median household size with 1.16 persons per household.
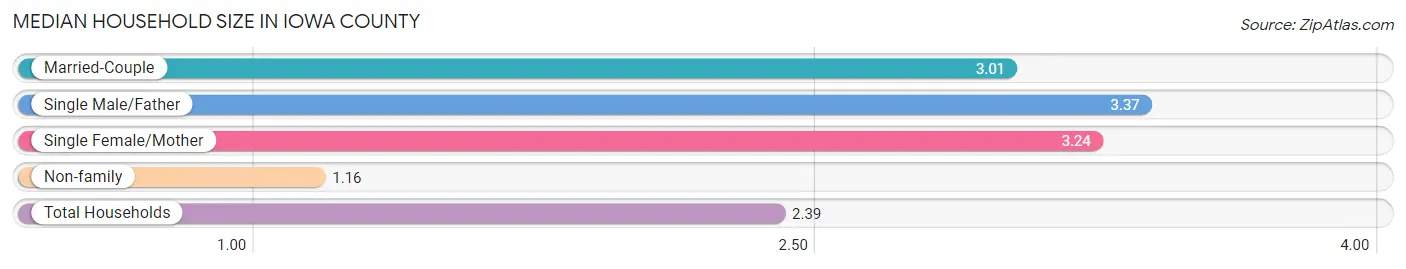
| Household Type | # Households | Household Size |
| Married-Couple | 3,553 (52.3%) | 3.01 |
| Single Male/Father | 308 (4.5%) | 3.37 |
| Single Female/Mother | 518 (7.6%) | 3.24 |
| Non-family | 2,419 (35.6%) | 1.16 |
| Total Households | 6,798 (100.0%) | 2.39 |
Household Size by Marriage Status in Iowa County
Out of a total of 6,798 households in Iowa County, 4,379 (64.4%) are family households, while 2,419 (35.6%) are nonfamily households. The most numerous type of family households are 2-person households, comprising 2,136, and the most common type of nonfamily households are 1-person households, comprising 2,026.
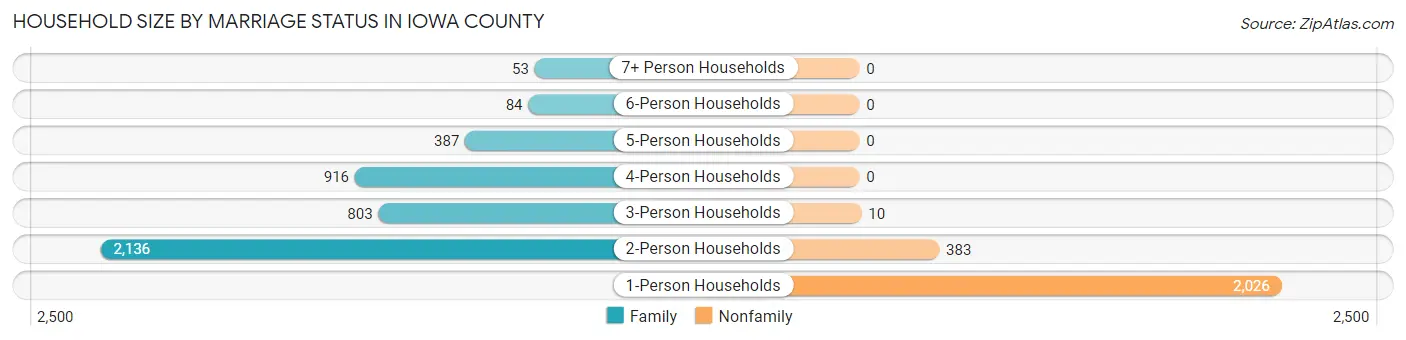
| Household Size | Family Households | Nonfamily Households |
| 1-Person Households | - | 2,026 (29.8%) |
| 2-Person Households | 2,136 (31.4%) | 383 (5.6%) |
| 3-Person Households | 803 (11.8%) | 10 (0.2%) |
| 4-Person Households | 916 (13.5%) | 0 (0.0%) |
| 5-Person Households | 387 (5.7%) | 0 (0.0%) |
| 6-Person Households | 84 (1.2%) | 0 (0.0%) |
| 7+ Person Households | 53 (0.8%) | 0 (0.0%) |
| Total | 4,379 (64.4%) | 2,419 (35.6%) |
Female Fertility in Iowa County
Fertility by Age in Iowa County
Average fertility rate in Iowa County is 47.0 births per 1,000 women. Women in the age bracket of 20 to 34 years have the highest fertility rate with 83.0 births per 1,000 women. Women in the age bracket of 20 to 34 years acount for 69.1% of all women with births.
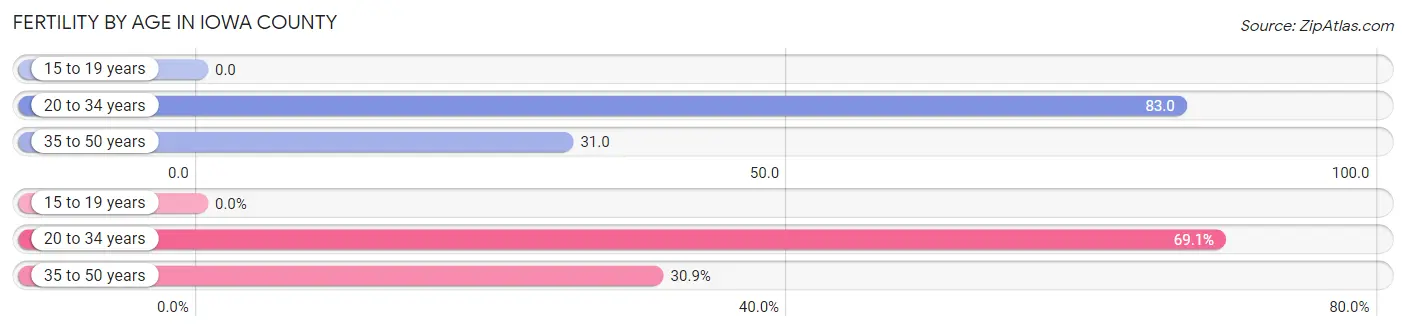
| Age Bracket | Women with Births | Births / 1,000 Women |
| 15 to 19 years | 0 (0.0%) | 0.0 |
| 20 to 34 years | 105 (69.1%) | 83.0 |
| 35 to 50 years | 47 (30.9%) | 31.0 |
| Total | 152 (100.0%) | 47.0 |
Fertility by Age by Marriage Status in Iowa County
70.4% of women with births (152) in Iowa County are married. The highest percentage of unmarried women with births falls into 20 to 34 years age bracket with 42.9% of them unmarried at the time of birth, while the lowest percentage of unmarried women with births belong to 35 to 50 years age bracket with 0.0% of them unmarried.
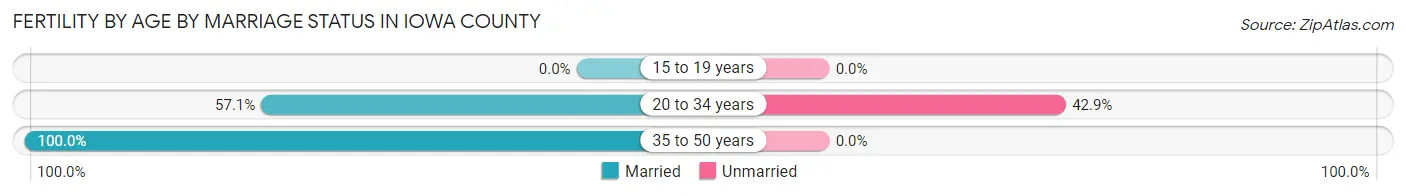
| Age Bracket | Married | Unmarried |
| 15 to 19 years | 0 (0.0%) | 0 (0.0%) |
| 20 to 34 years | 60 (57.1%) | 45 (42.9%) |
| 35 to 50 years | 47 (100.0%) | 0 (0.0%) |
| Total | 107 (70.4%) | 45 (29.6%) |
Fertility by Education in Iowa County
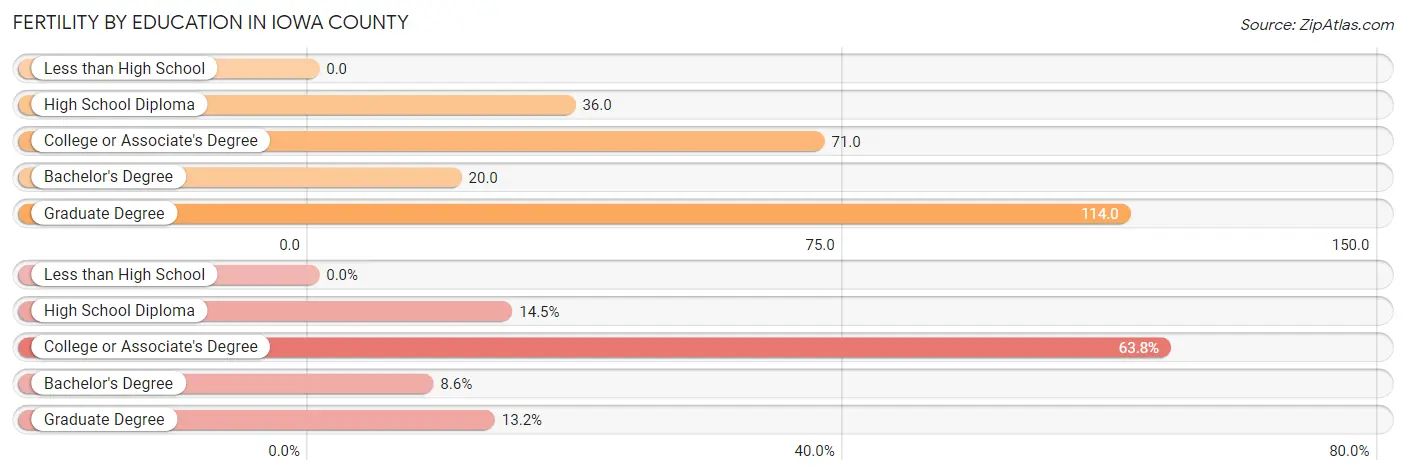
| Educational Attainment | Women with Births | Births / 1,000 Women |
| Less than High School | 0 (0.0%) | 0.0 |
| High School Diploma | 22 (14.5%) | 36.0 |
| College or Associate's Degree | 97 (63.8%) | 71.0 |
| Bachelor's Degree | 13 (8.6%) | 20.0 |
| Graduate Degree | 20 (13.2%) | 114.0 |
| Total | 152 (100.0%) | 47.0 |
Fertility by Education by Marriage Status in Iowa County
29.6% of women with births in Iowa County are unmarried. Women with the educational attainment of high school diploma are most likely to be married with 100.0% of them married at childbirth, while women with the educational attainment of college or associate's degree are least likely to be married with 46.4% of them unmarried at childbirth.
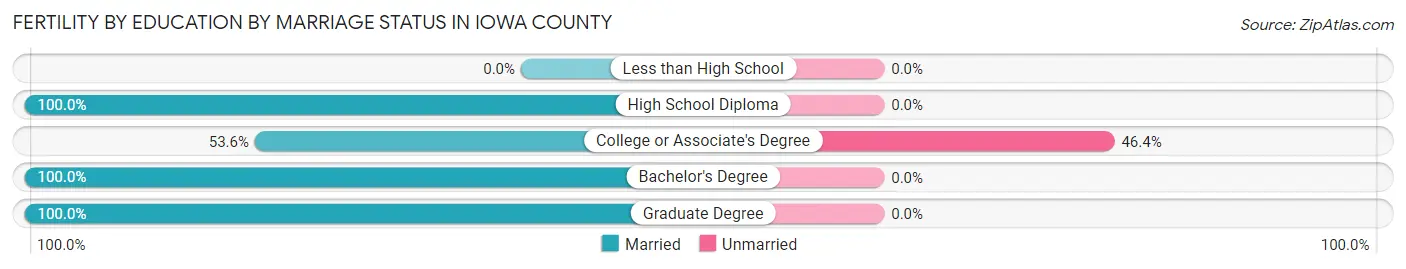
| Educational Attainment | Married | Unmarried |
| Less than High School | 0 (0.0%) | 0 (0.0%) |
| High School Diploma | 22 (100.0%) | 0 (0.0%) |
| College or Associate's Degree | 52 (53.6%) | 45 (46.4%) |
| Bachelor's Degree | 13 (100.0%) | 0 (0.0%) |
| Graduate Degree | 20 (100.0%) | 0 (0.0%) |
| Total | 107 (70.4%) | 45 (29.6%) |
Employment Characteristics in Iowa County
Employment by Class of Employer in Iowa County
Among the 8,302 employed individuals in Iowa County, private company employees (5,311 | 64.0%), local government employees (870 | 10.5%), and not-for-profit organizations (602 | 7.2%) make up the most common classes of employment.
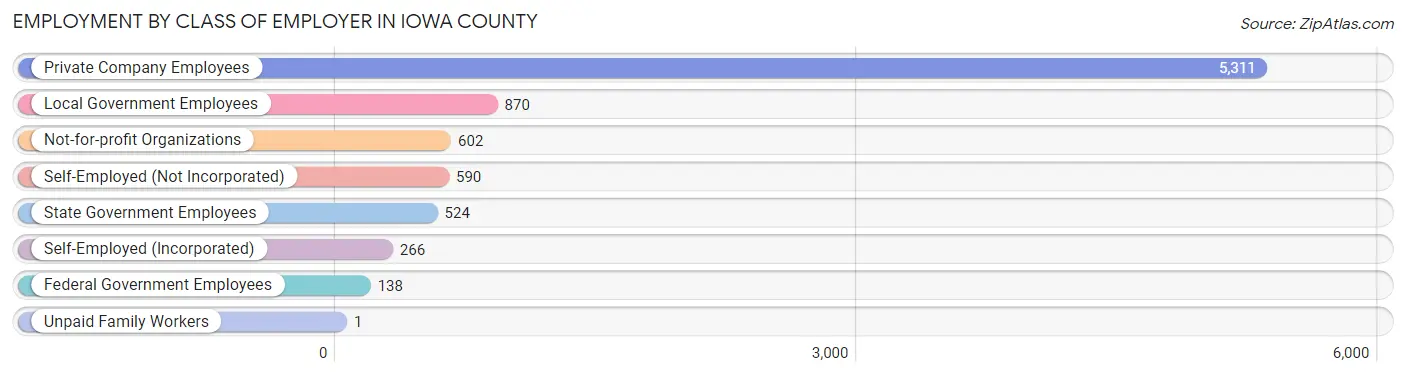
| Employer Class | # Employees | % Employees |
| Private Company Employees | 5,311 | 64.0% |
| Self-Employed (Incorporated) | 266 | 3.2% |
| Self-Employed (Not Incorporated) | 590 | 7.1% |
| Not-for-profit Organizations | 602 | 7.2% |
| Local Government Employees | 870 | 10.5% |
| State Government Employees | 524 | 6.3% |
| Federal Government Employees | 138 | 1.7% |
| Unpaid Family Workers | 1 | 0.0% |
| Total | 8,302 | 100.0% |
Employment Status by Age in Iowa County
According to the labor force statistics for Iowa County, out of the total population over 16 years of age (13,145), 66.8% or 8,781 individuals are in the labor force, with 3.2% or 281 of them unemployed. The age group with the highest labor force participation rate is 55 to 59 years, with 88.7% or 1,079 individuals in the labor force. Within the labor force, the 16 to 19 years age range has the highest percentage of unemployed individuals, with 19.0% or 91 of them being unemployed.
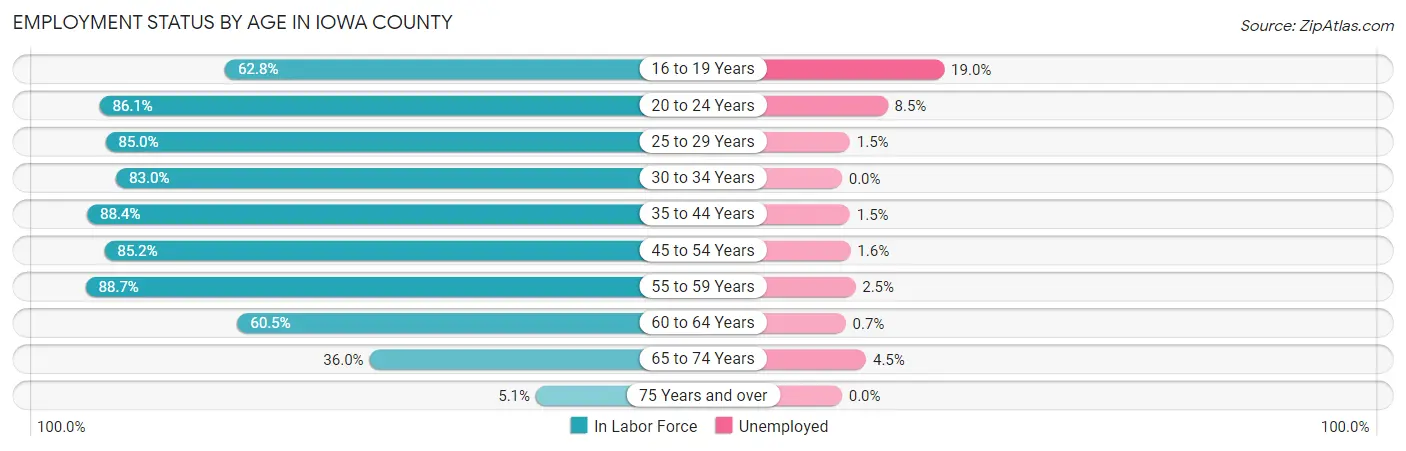
| Age Bracket | In Labor Force | Unemployed |
| 16 to 19 Years | 479 (62.8%) | 91 (19.0%) |
| 20 to 24 Years | 716 (86.1%) | 61 (8.5%) |
| 25 to 29 Years | 729 (85.0%) | 11 (1.5%) |
| 30 to 34 Years | 761 (83.0%) | 0 (0.0%) |
| 35 to 44 Years | 1,782 (88.4%) | 27 (1.5%) |
| 45 to 54 Years | 1,717 (85.2%) | 27 (1.6%) |
| 55 to 59 Years | 1,079 (88.7%) | 27 (2.5%) |
| 60 to 64 Years | 823 (60.5%) | 6 (0.7%) |
| 65 to 74 Years | 624 (36.0%) | 28 (4.5%) |
| 75 Years and over | 73 (5.1%) | 0 (0.0%) |
| Total | 8,781 (66.8%) | 281 (3.2%) |
Employment Status by Educational Attainment in Iowa County
According to labor force statistics for Iowa County, 82.2% of individuals (6,890) out of the total population between 25 and 64 years of age (8,382) are in the labor force, with 1.4% or 96 of them being unemployed. The group with the highest labor force participation rate are those with the educational attainment of bachelor's degree or higher, with 86.6% or 1,785 individuals in the labor force. Within the labor force, individuals with less than high school education have the highest percentage of unemployment, with 14.6% or 38 of them being unemployed.
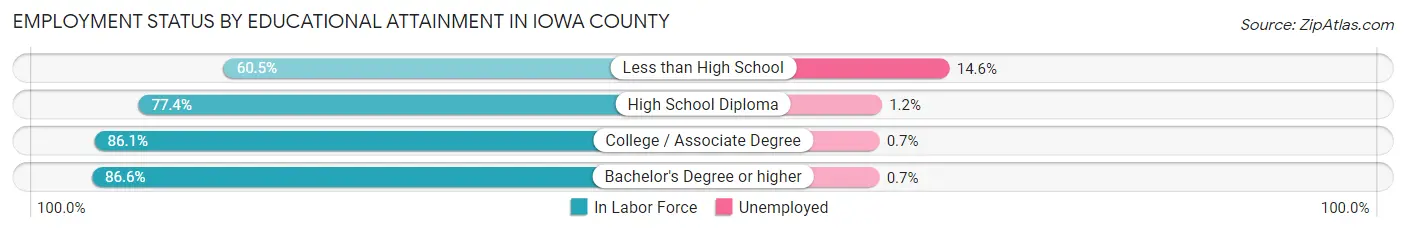
| Educational Attainment | In Labor Force | Unemployed |
| Less than High School | 260 (60.5%) | 63 (14.6%) |
| High School Diploma | 2,006 (77.4%) | 31 (1.2%) |
| College / Associate Degree | 2,840 (86.1%) | 23 (0.7%) |
| Bachelor's Degree or higher | 1,785 (86.6%) | 14 (0.7%) |
| Total | 6,890 (82.2%) | 117 (1.4%) |
Employment Occupations by Sex in Iowa County
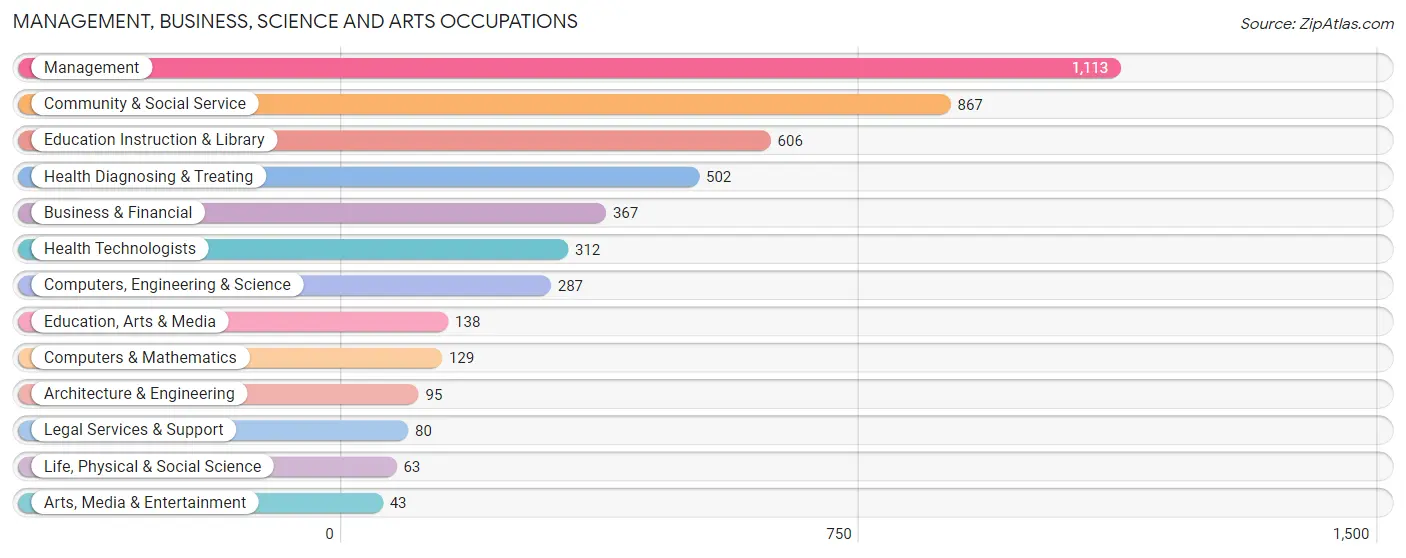
Management, Business, Science and Arts Occupations
The most common Management, Business, Science and Arts occupations in Iowa County are Management (1,113 | 13.1%), Community & Social Service (867 | 10.2%), Education Instruction & Library (606 | 7.1%), Health Diagnosing & Treating (502 | 5.9%), and Business & Financial (367 | 4.3%).
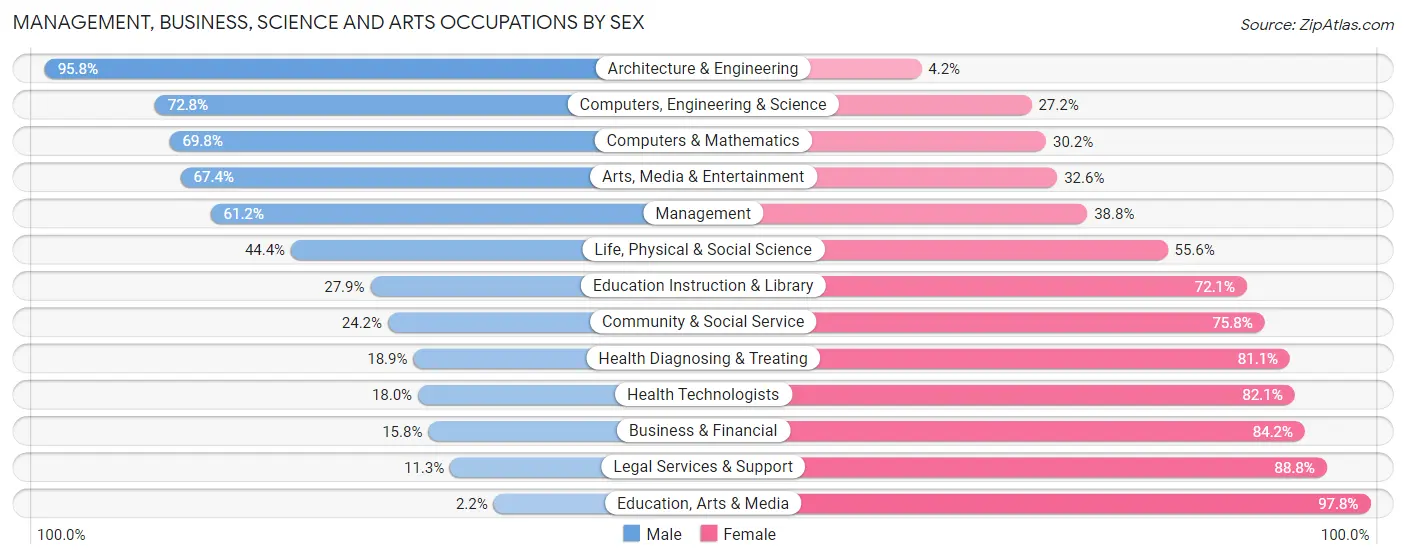
Management, Business, Science and Arts Occupations by Sex
Within the Management, Business, Science and Arts occupations in Iowa County, the most male-oriented occupations are Architecture & Engineering (95.8%), Computers, Engineering & Science (72.8%), and Computers & Mathematics (69.8%), while the most female-oriented occupations are Education, Arts & Media (97.8%), Legal Services & Support (88.7%), and Business & Financial (84.2%).
| Occupation | Male | Female |
| Management | 681 (61.2%) | 432 (38.8%) |
| Business & Financial | 58 (15.8%) | 309 (84.2%) |
| Computers, Engineering & Science | 209 (72.8%) | 78 (27.2%) |
| Computers & Mathematics | 90 (69.8%) | 39 (30.2%) |
| Architecture & Engineering | 91 (95.8%) | 4 (4.2%) |
| Life, Physical & Social Science | 28 (44.4%) | 35 (55.6%) |
| Community & Social Service | 210 (24.2%) | 657 (75.8%) |
| Education, Arts & Media | 3 (2.2%) | 135 (97.8%) |
| Legal Services & Support | 9 (11.3%) | 71 (88.7%) |
| Education Instruction & Library | 169 (27.9%) | 437 (72.1%) |
| Arts, Media & Entertainment | 29 (67.4%) | 14 (32.6%) |
| Health Diagnosing & Treating | 95 (18.9%) | 407 (81.1%) |
| Health Technologists | 56 (17.9%) | 256 (82.1%) |
| Total (Category) | 1,253 (40.0%) | 1,883 (60.0%) |
| Total (Overall) | 4,465 (52.6%) | 4,018 (47.4%) |
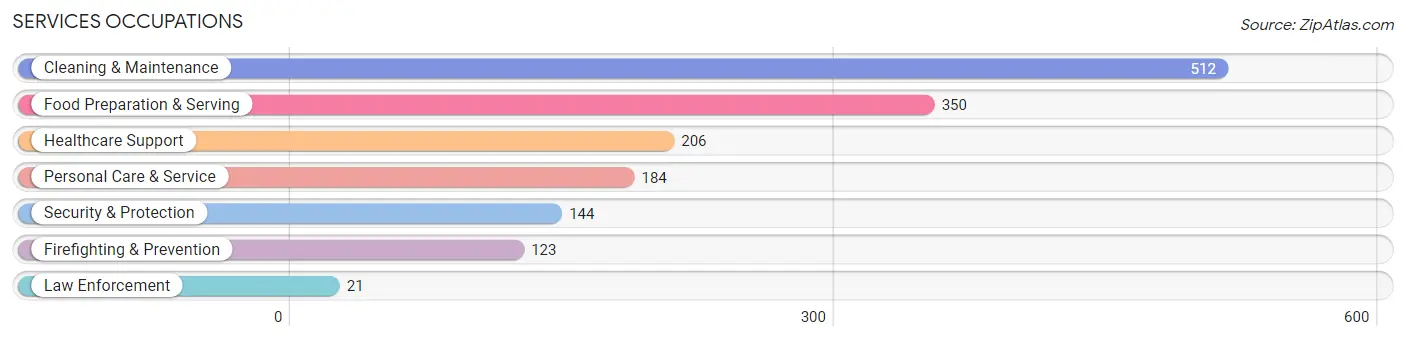
Services Occupations
The most common Services occupations in Iowa County are Cleaning & Maintenance (512 | 6.0%), Food Preparation & Serving (350 | 4.1%), Healthcare Support (206 | 2.4%), Personal Care & Service (184 | 2.2%), and Security & Protection (144 | 1.7%).
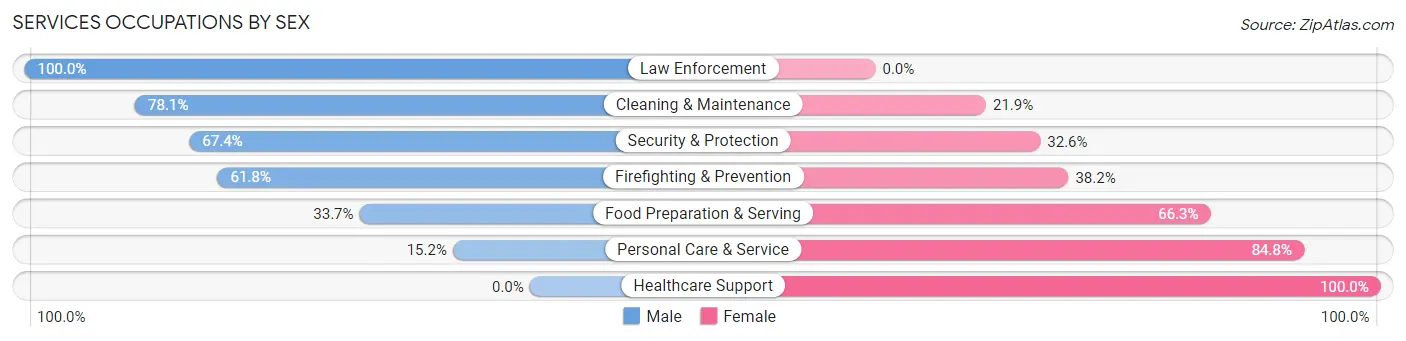
Services Occupations by Sex
Within the Services occupations in Iowa County, the most male-oriented occupations are Law Enforcement (100.0%), Cleaning & Maintenance (78.1%), and Security & Protection (67.4%), while the most female-oriented occupations are Healthcare Support (100.0%), Personal Care & Service (84.8%), and Food Preparation & Serving (66.3%).
| Occupation | Male | Female |
| Healthcare Support | 0 (0.0%) | 206 (100.0%) |
| Security & Protection | 97 (67.4%) | 47 (32.6%) |
| Firefighting & Prevention | 76 (61.8%) | 47 (38.2%) |
| Law Enforcement | 21 (100.0%) | 0 (0.0%) |
| Food Preparation & Serving | 118 (33.7%) | 232 (66.3%) |
| Cleaning & Maintenance | 400 (78.1%) | 112 (21.9%) |
| Personal Care & Service | 28 (15.2%) | 156 (84.8%) |
| Total (Category) | 643 (46.1%) | 753 (53.9%) |
| Total (Overall) | 4,465 (52.6%) | 4,018 (47.4%) |
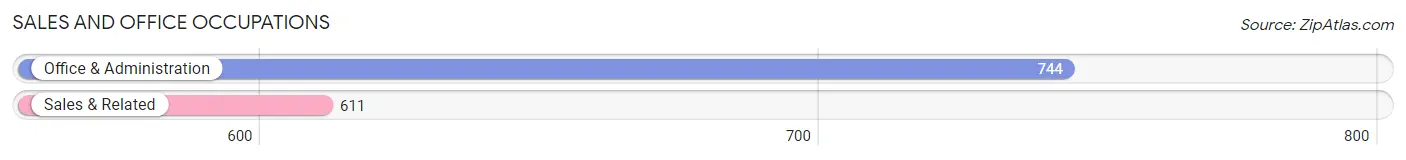
Sales and Office Occupations
The most common Sales and Office occupations in Iowa County are Office & Administration (744 | 8.8%), and Sales & Related (611 | 7.2%).
Sales and Office Occupations by Sex
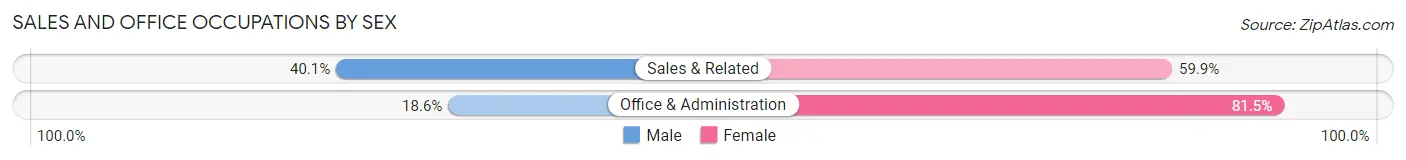
| Occupation | Male | Female |
| Sales & Related | 245 (40.1%) | 366 (59.9%) |
| Office & Administration | 138 (18.5%) | 606 (81.5%) |
| Total (Category) | 383 (28.3%) | 972 (71.7%) |
| Total (Overall) | 4,465 (52.6%) | 4,018 (47.4%) |
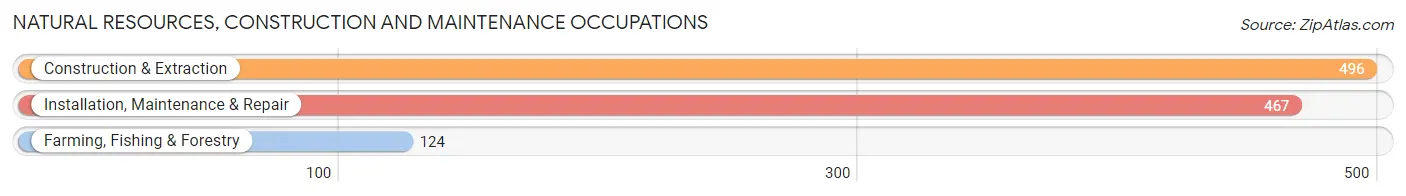
Natural Resources, Construction and Maintenance Occupations
The most common Natural Resources, Construction and Maintenance occupations in Iowa County are Construction & Extraction (496 | 5.9%), Installation, Maintenance & Repair (467 | 5.5%), and Farming, Fishing & Forestry (124 | 1.5%).
Natural Resources, Construction and Maintenance Occupations by Sex
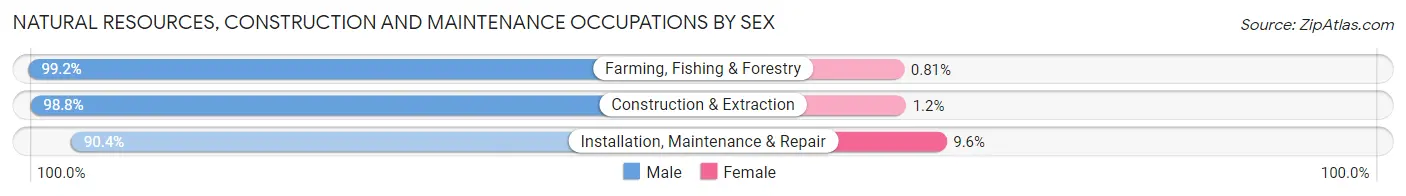
| Occupation | Male | Female |
| Farming, Fishing & Forestry | 123 (99.2%) | 1 (0.8%) |
| Construction & Extraction | 490 (98.8%) | 6 (1.2%) |
| Installation, Maintenance & Repair | 422 (90.4%) | 45 (9.6%) |
| Total (Category) | 1,035 (95.2%) | 52 (4.8%) |
| Total (Overall) | 4,465 (52.6%) | 4,018 (47.4%) |
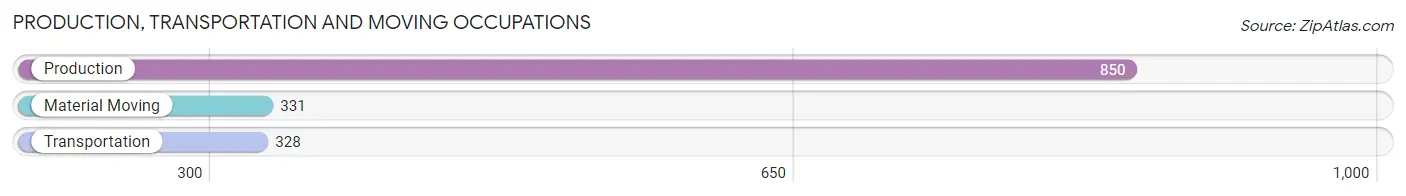
Production, Transportation and Moving Occupations
The most common Production, Transportation and Moving occupations in Iowa County are Production (850 | 10.0%), Material Moving (331 | 3.9%), and Transportation (328 | 3.9%).
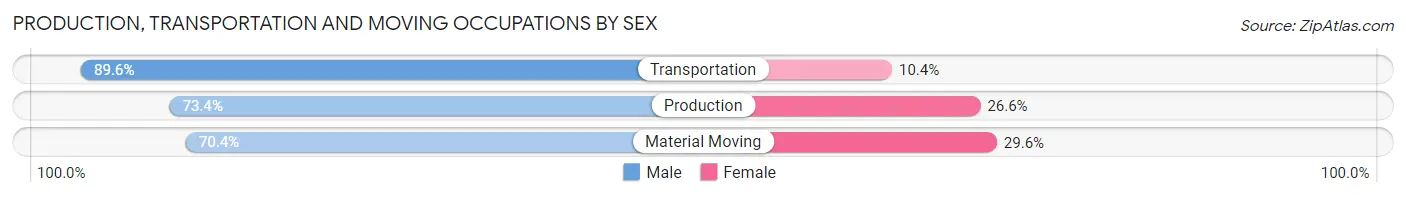
Production, Transportation and Moving Occupations by Sex
| Occupation | Male | Female |
| Production | 624 (73.4%) | 226 (26.6%) |
| Transportation | 294 (89.6%) | 34 (10.4%) |
| Material Moving | 233 (70.4%) | 98 (29.6%) |
| Total (Category) | 1,151 (76.3%) | 358 (23.7%) |
| Total (Overall) | 4,465 (52.6%) | 4,018 (47.4%) |
Employment Industries by Sex in Iowa County
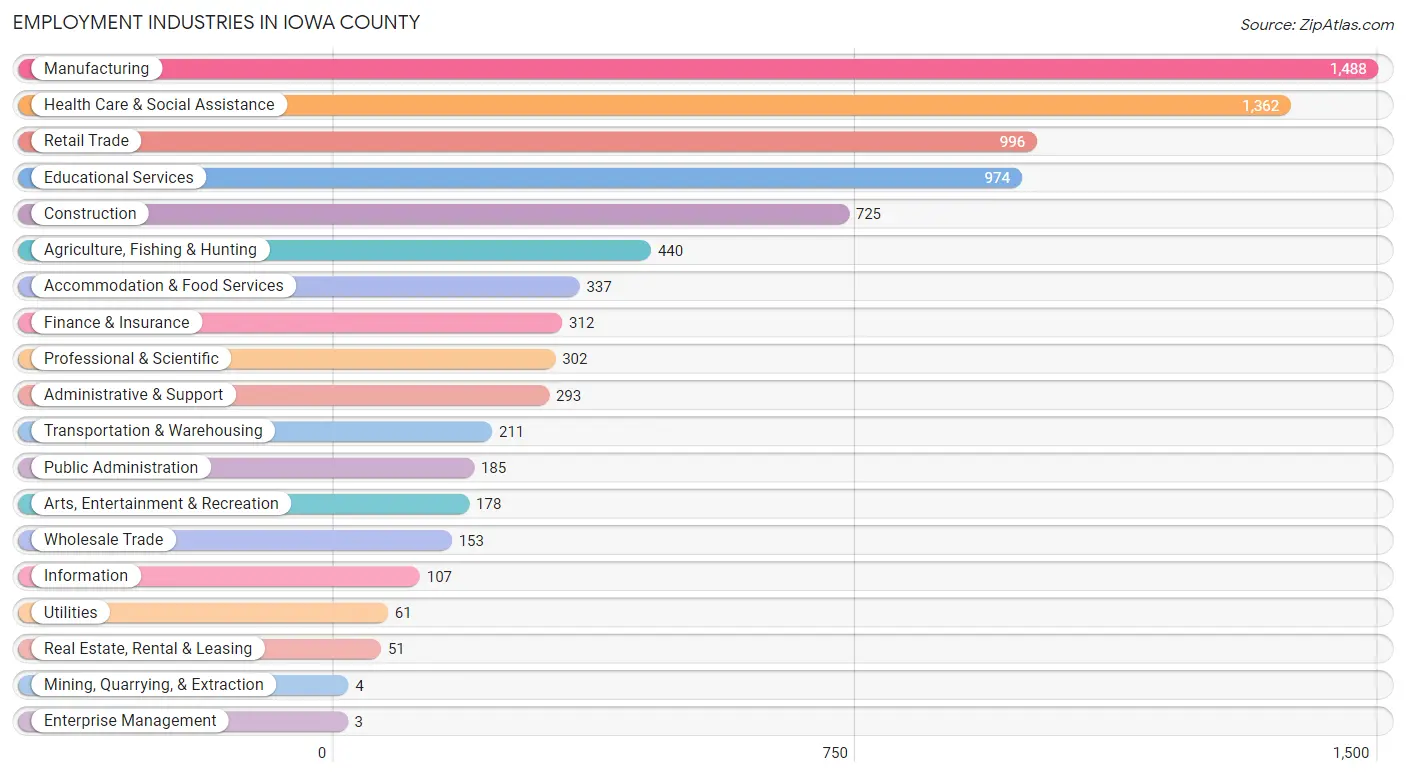
Employment Industries in Iowa County
The major employment industries in Iowa County include Manufacturing (1,488 | 17.5%), Health Care & Social Assistance (1,362 | 16.1%), Retail Trade (996 | 11.7%), Educational Services (974 | 11.5%), and Construction (725 | 8.6%).
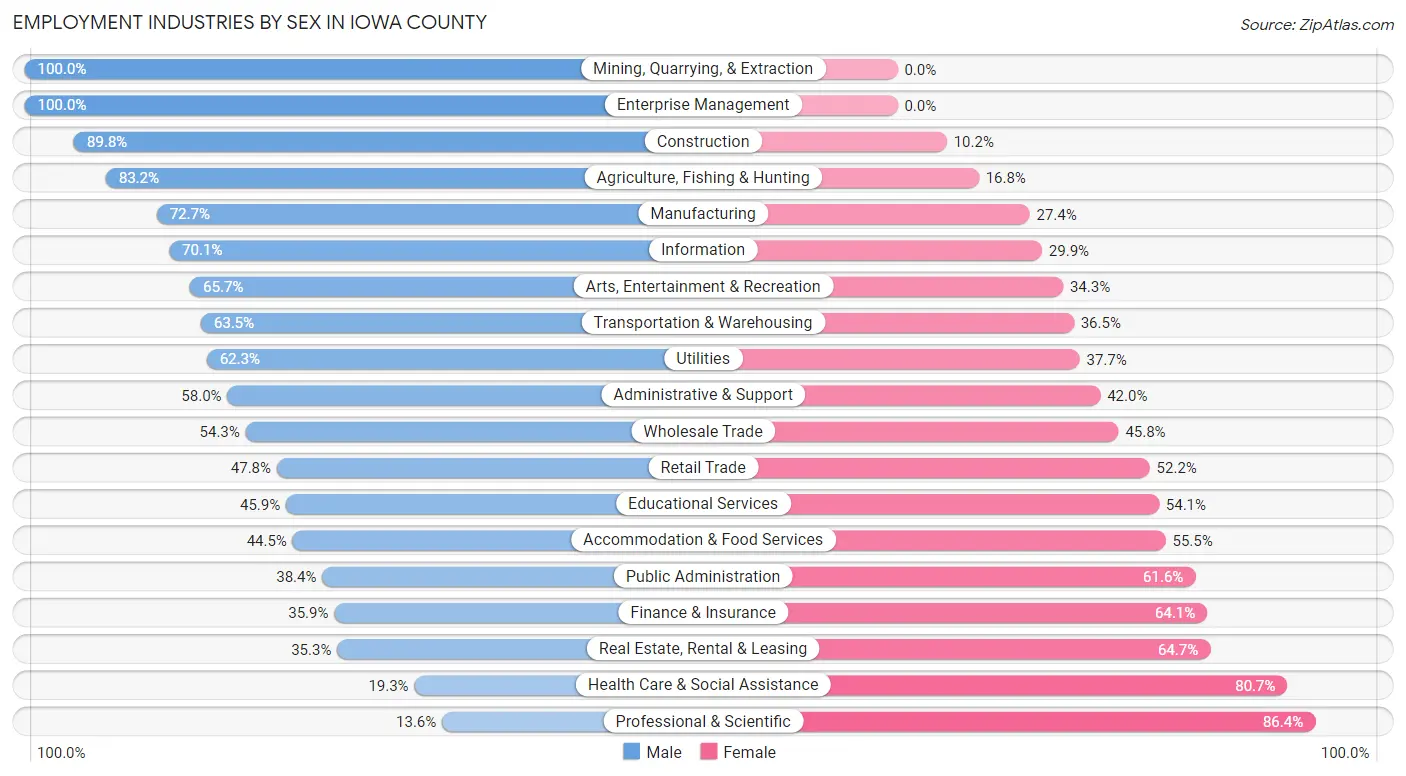
Employment Industries by Sex in Iowa County
The Iowa County industries that see more men than women are Mining, Quarrying, & Extraction (100.0%), Enterprise Management (100.0%), and Construction (89.8%), whereas the industries that tend to have a higher number of women are Professional & Scientific (86.4%), Health Care & Social Assistance (80.7%), and Real Estate, Rental & Leasing (64.7%).
| Industry | Male | Female |
| Agriculture, Fishing & Hunting | 366 (83.2%) | 74 (16.8%) |
| Mining, Quarrying, & Extraction | 4 (100.0%) | 0 (0.0%) |
| Construction | 651 (89.8%) | 74 (10.2%) |
| Manufacturing | 1,081 (72.7%) | 407 (27.4%) |
| Wholesale Trade | 83 (54.2%) | 70 (45.8%) |
| Retail Trade | 476 (47.8%) | 520 (52.2%) |
| Transportation & Warehousing | 134 (63.5%) | 77 (36.5%) |
| Utilities | 38 (62.3%) | 23 (37.7%) |
| Information | 75 (70.1%) | 32 (29.9%) |
| Finance & Insurance | 112 (35.9%) | 200 (64.1%) |
| Real Estate, Rental & Leasing | 18 (35.3%) | 33 (64.7%) |
| Professional & Scientific | 41 (13.6%) | 261 (86.4%) |
| Enterprise Management | 3 (100.0%) | 0 (0.0%) |
| Administrative & Support | 170 (58.0%) | 123 (42.0%) |
| Educational Services | 447 (45.9%) | 527 (54.1%) |
| Health Care & Social Assistance | 263 (19.3%) | 1,099 (80.7%) |
| Arts, Entertainment & Recreation | 117 (65.7%) | 61 (34.3%) |
| Accommodation & Food Services | 150 (44.5%) | 187 (55.5%) |
| Public Administration | 71 (38.4%) | 114 (61.6%) |
| Total | 4,465 (52.6%) | 4,018 (47.4%) |
Education in Iowa County
School Enrollment in Iowa County
The most common levels of schooling among the 3,632 students in Iowa County are high school (1,028 | 28.3%), middle school (1,006 | 27.7%), and elementary school (709 | 19.5%).
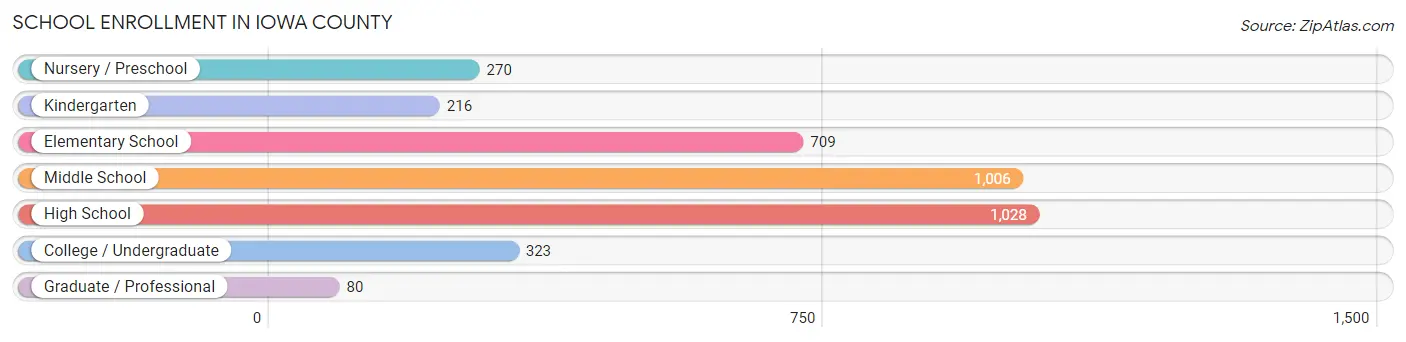
| School Level | # Students | % Students |
| Nursery / Preschool | 270 | 7.4% |
| Kindergarten | 216 | 5.9% |
| Elementary School | 709 | 19.5% |
| Middle School | 1,006 | 27.7% |
| High School | 1,028 | 28.3% |
| College / Undergraduate | 323 | 8.9% |
| Graduate / Professional | 80 | 2.2% |
| Total | 3,632 | 100.0% |
School Enrollment by Age by Funding Source in Iowa County
Out of a total of 3,632 students who are enrolled in schools in Iowa County, 247 (6.8%) attend a private institution, while the remaining 3,385 (93.2%) are enrolled in public schools. The age group of 25 to 34 year olds has the highest likelihood of being enrolled in private schools, with 31 (57.4% in the age bracket) enrolled. Conversely, the age group of 15 to 17 year olds has the lowest likelihood of being enrolled in a private school, with 690 (100.0% in the age bracket) attending a public institution.
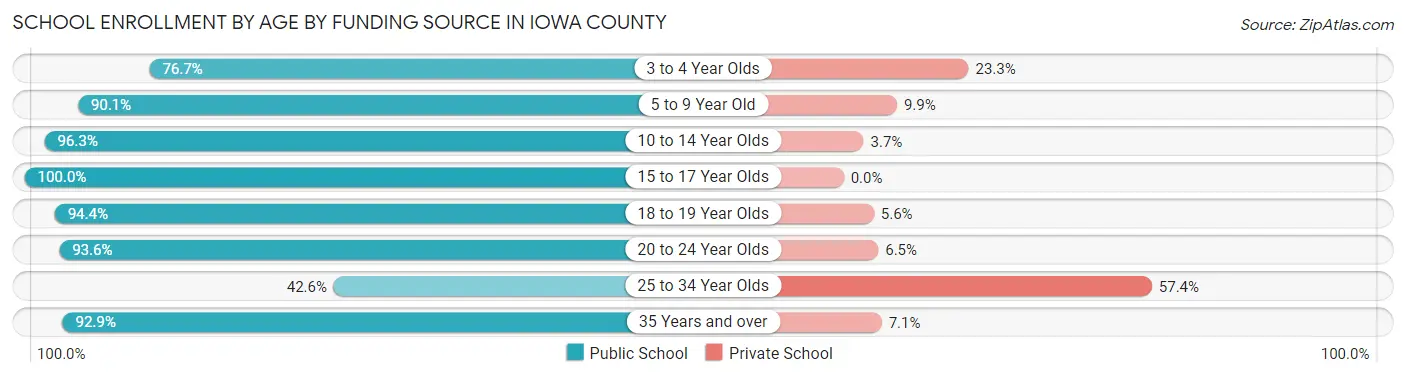
| Age Bracket | Public School | Private School |
| 3 to 4 Year Olds | 132 (76.7%) | 40 (23.3%) |
| 5 to 9 Year Old | 862 (90.1%) | 95 (9.9%) |
| 10 to 14 Year Olds | 1,169 (96.3%) | 45 (3.7%) |
| 15 to 17 Year Olds | 690 (100.0%) | 0 (0.0%) |
| 18 to 19 Year Olds | 168 (94.4%) | 10 (5.6%) |
| 20 to 24 Year Olds | 145 (93.5%) | 10 (6.5%) |
| 25 to 34 Year Olds | 23 (42.6%) | 31 (57.4%) |
| 35 Years and over | 197 (92.9%) | 15 (7.1%) |
| Total | 3,385 (93.2%) | 247 (6.8%) |
Educational Attainment by Field of Study in Iowa County
Education (534 | 18.1%), bio, nature & agricultural (499 | 17.0%), business (449 | 15.3%), science & technology (262 | 8.9%), and arts & humanities (187 | 6.4%) are the most common fields of study among 2,942 individuals in Iowa County who have obtained a bachelor's degree or higher.
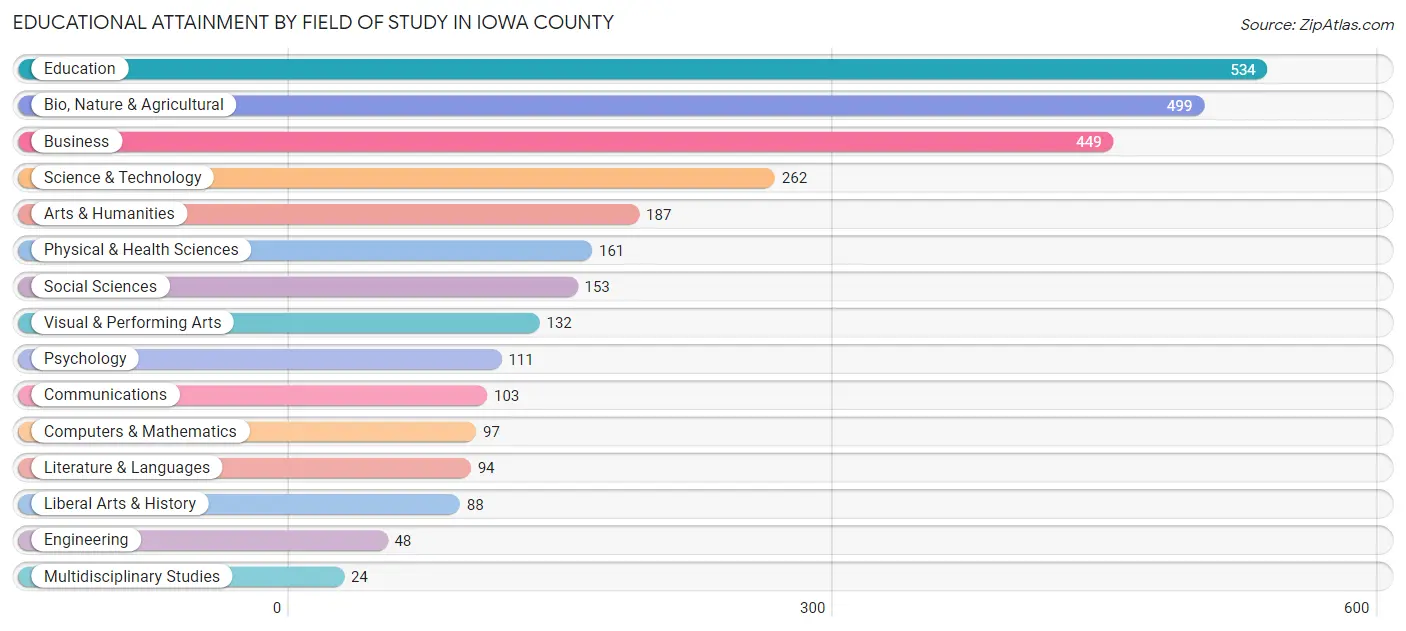
| Field of Study | # Graduates | % Graduates |
| Computers & Mathematics | 97 | 3.3% |
| Bio, Nature & Agricultural | 499 | 17.0% |
| Physical & Health Sciences | 161 | 5.5% |
| Psychology | 111 | 3.8% |
| Social Sciences | 153 | 5.2% |
| Engineering | 48 | 1.6% |
| Multidisciplinary Studies | 24 | 0.8% |
| Science & Technology | 262 | 8.9% |
| Business | 449 | 15.3% |
| Education | 534 | 18.1% |
| Literature & Languages | 94 | 3.2% |
| Liberal Arts & History | 88 | 3.0% |
| Visual & Performing Arts | 132 | 4.5% |
| Communications | 103 | 3.5% |
| Arts & Humanities | 187 | 6.4% |
| Total | 2,942 | 100.0% |
Transportation & Commute in Iowa County
Vehicle Availability by Sex in Iowa County
The most prevalent vehicle ownership categories in Iowa County are males with 2 vehicles (1,585, accounting for 36.4%) and females with 2 vehicles (1,419, making up 40.3%).
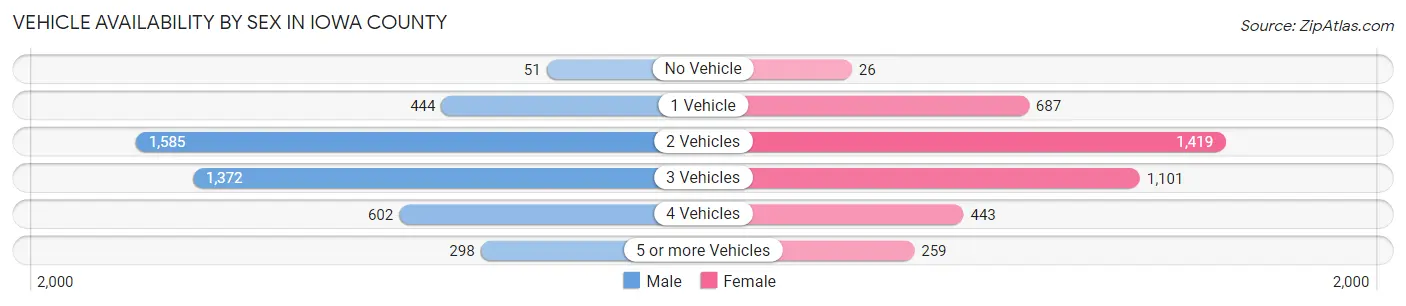
| Vehicles Available | Male | Female |
| No Vehicle | 51 (1.2%) | 26 (0.7%) |
| 1 Vehicle | 444 (10.2%) | 687 (17.5%) |
| 2 Vehicles | 1,585 (36.4%) | 1,419 (36.1%) |
| 3 Vehicles | 1,372 (31.5%) | 1,101 (28.0%) |
| 4 Vehicles | 602 (13.8%) | 443 (11.3%) |
| 5 or more Vehicles | 298 (6.9%) | 259 (6.6%) |
| Total | 4,352 (100.0%) | 3,935 (100.0%) |
Commute Time in Iowa County
The most frequently occuring commute durations in Iowa County are 5 to 9 minutes (1,483 commuters, 19.3%), 15 to 19 minutes (926 commuters, 12.0%), and 30 to 34 minutes (868 commuters, 11.3%).
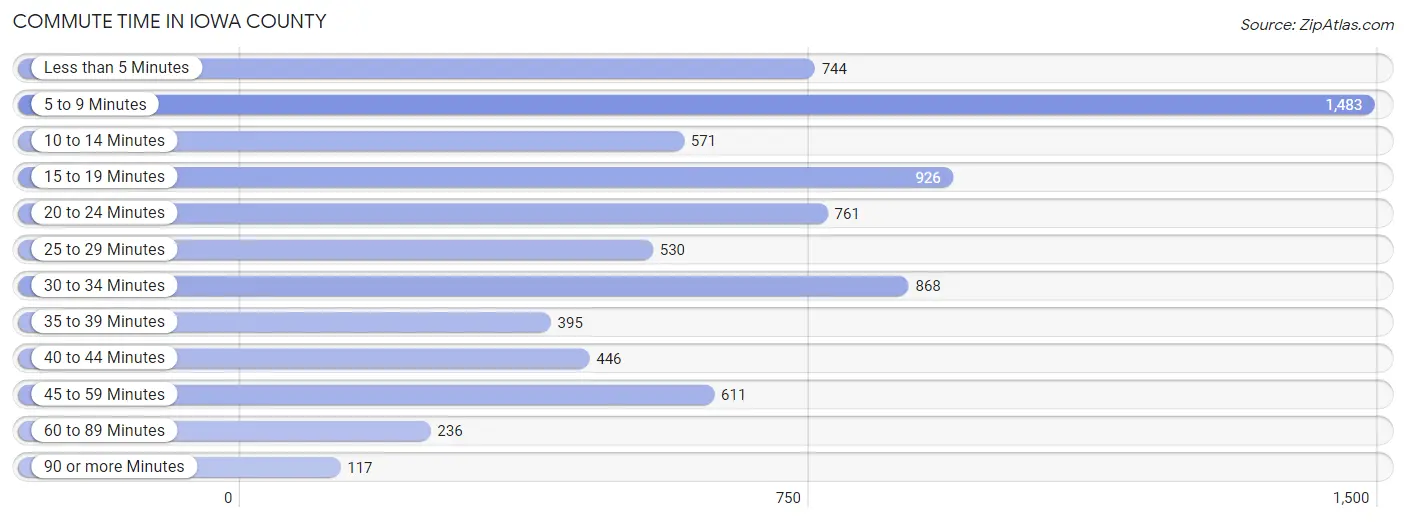
| Commute Time | # Commuters | % Commuters |
| Less than 5 Minutes | 744 | 9.7% |
| 5 to 9 Minutes | 1,483 | 19.3% |
| 10 to 14 Minutes | 571 | 7.4% |
| 15 to 19 Minutes | 926 | 12.0% |
| 20 to 24 Minutes | 761 | 9.9% |
| 25 to 29 Minutes | 530 | 6.9% |
| 30 to 34 Minutes | 868 | 11.3% |
| 35 to 39 Minutes | 395 | 5.1% |
| 40 to 44 Minutes | 446 | 5.8% |
| 45 to 59 Minutes | 611 | 8.0% |
| 60 to 89 Minutes | 236 | 3.1% |
| 90 or more Minutes | 117 | 1.5% |
Commute Time by Sex in Iowa County
The most common commute times in Iowa County are 5 to 9 minutes (818 commuters, 19.6%) for males and 5 to 9 minutes (665 commuters, 19.0%) for females.

| Commute Time | Male | Female |
| Less than 5 Minutes | 359 (8.6%) | 385 (11.0%) |
| 5 to 9 Minutes | 818 (19.6%) | 665 (19.0%) |
| 10 to 14 Minutes | 416 (10.0%) | 155 (4.4%) |
| 15 to 19 Minutes | 404 (9.7%) | 522 (14.9%) |
| 20 to 24 Minutes | 406 (9.7%) | 355 (10.1%) |
| 25 to 29 Minutes | 232 (5.6%) | 298 (8.5%) |
| 30 to 34 Minutes | 569 (13.6%) | 299 (8.5%) |
| 35 to 39 Minutes | 154 (3.7%) | 241 (6.9%) |
| 40 to 44 Minutes | 274 (6.6%) | 172 (4.9%) |
| 45 to 59 Minutes | 362 (8.7%) | 249 (7.1%) |
| 60 to 89 Minutes | 119 (2.9%) | 117 (3.3%) |
| 90 or more Minutes | 67 (1.6%) | 50 (1.4%) |
Time of Departure to Work by Sex in Iowa County
The most frequent times of departure to work in Iowa County are 6:00 AM to 6:29 AM (695, 16.6%) for males and 7:00 AM to 7:29 AM (706, 20.1%) for females.
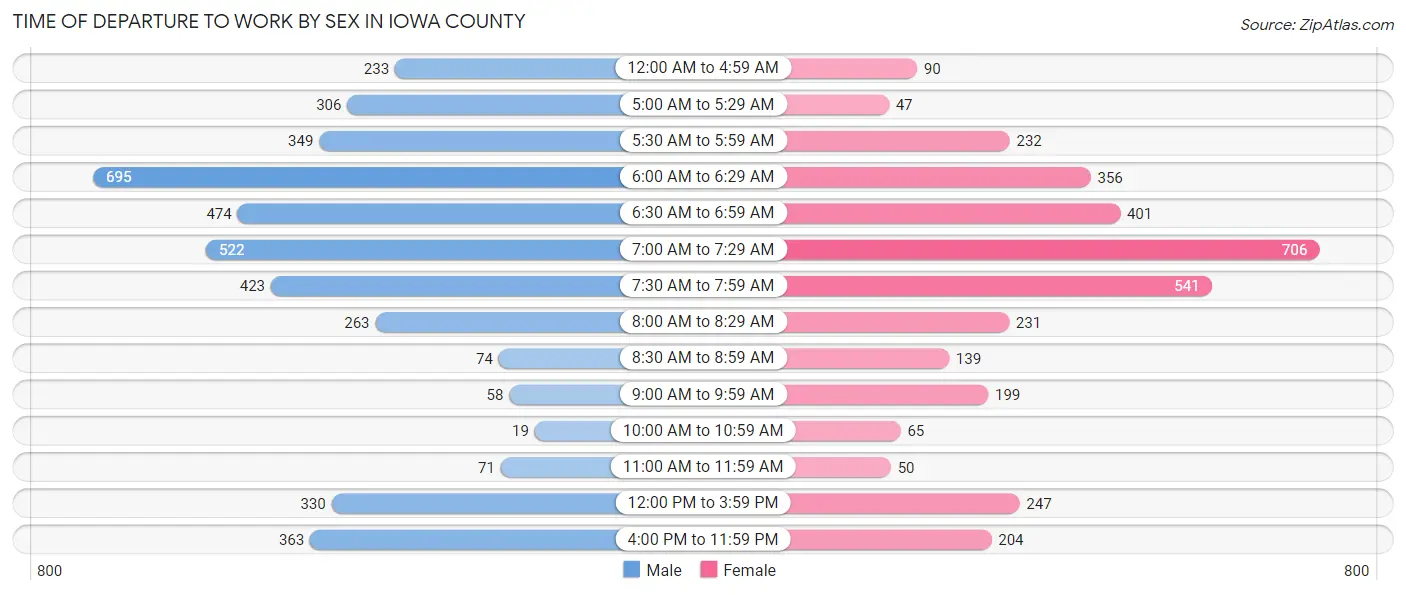
| Time of Departure | Male | Female |
| 12:00 AM to 4:59 AM | 233 (5.6%) | 90 (2.6%) |
| 5:00 AM to 5:29 AM | 306 (7.3%) | 47 (1.3%) |
| 5:30 AM to 5:59 AM | 349 (8.4%) | 232 (6.6%) |
| 6:00 AM to 6:29 AM | 695 (16.6%) | 356 (10.2%) |
| 6:30 AM to 6:59 AM | 474 (11.3%) | 401 (11.4%) |
| 7:00 AM to 7:29 AM | 522 (12.5%) | 706 (20.1%) |
| 7:30 AM to 7:59 AM | 423 (10.1%) | 541 (15.4%) |
| 8:00 AM to 8:29 AM | 263 (6.3%) | 231 (6.6%) |
| 8:30 AM to 8:59 AM | 74 (1.8%) | 139 (4.0%) |
| 9:00 AM to 9:59 AM | 58 (1.4%) | 199 (5.7%) |
| 10:00 AM to 10:59 AM | 19 (0.4%) | 65 (1.8%) |
| 11:00 AM to 11:59 AM | 71 (1.7%) | 50 (1.4%) |
| 12:00 PM to 3:59 PM | 330 (7.9%) | 247 (7.0%) |
| 4:00 PM to 11:59 PM | 363 (8.7%) | 204 (5.8%) |
| Total | 4,180 (100.0%) | 3,508 (100.0%) |
Housing Occupancy in Iowa County
Occupancy by Ownership in Iowa County
Of the total 6,798 dwellings in Iowa County, owner-occupied units account for 5,281 (77.7%), while renter-occupied units make up 1,517 (22.3%).
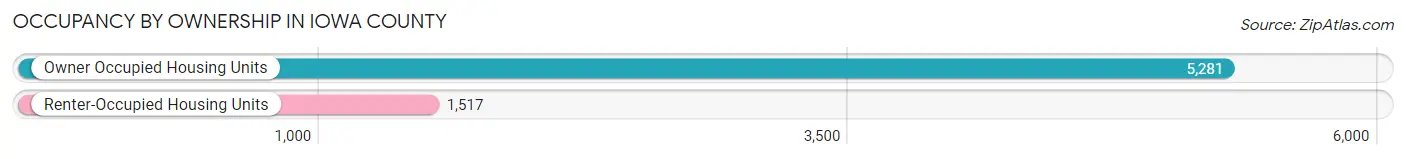
| Occupancy | # Housing Units | % Housing Units |
| Owner Occupied Housing Units | 5,281 | 77.7% |
| Renter-Occupied Housing Units | 1,517 | 22.3% |
| Total Occupied Housing Units | 6,798 | 100.0% |
Occupancy by Household Size in Iowa County
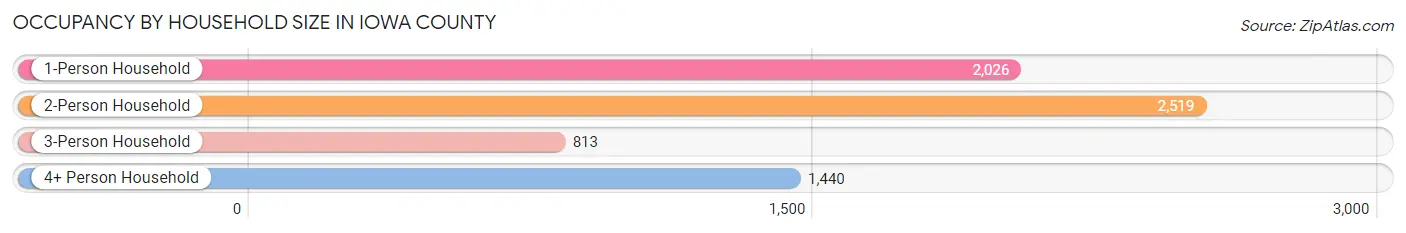
| Household Size | # Housing Units | % Housing Units |
| 1-Person Household | 2,026 | 29.8% |
| 2-Person Household | 2,519 | 37.1% |
| 3-Person Household | 813 | 12.0% |
| 4+ Person Household | 1,440 | 21.2% |
| Total Housing Units | 6,798 | 100.0% |
Occupancy by Ownership by Household Size in Iowa County
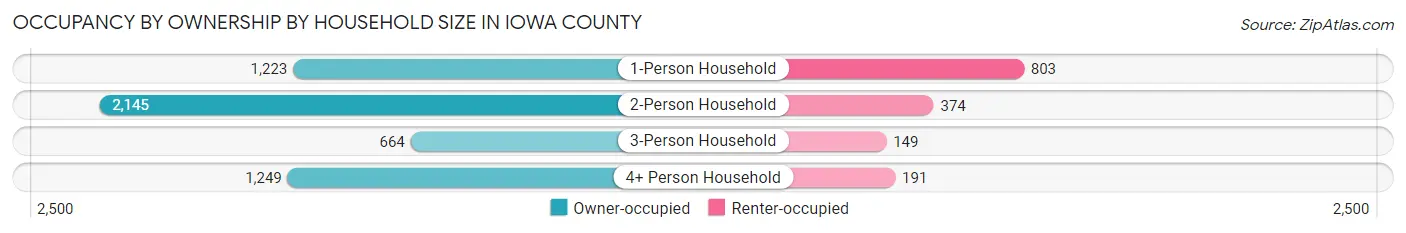
| Household Size | Owner-occupied | Renter-occupied |
| 1-Person Household | 1,223 (60.4%) | 803 (39.6%) |
| 2-Person Household | 2,145 (85.2%) | 374 (14.8%) |
| 3-Person Household | 664 (81.7%) | 149 (18.3%) |
| 4+ Person Household | 1,249 (86.7%) | 191 (13.3%) |
| Total Housing Units | 5,281 (77.7%) | 1,517 (22.3%) |
Occupancy by Educational Attainment in Iowa County
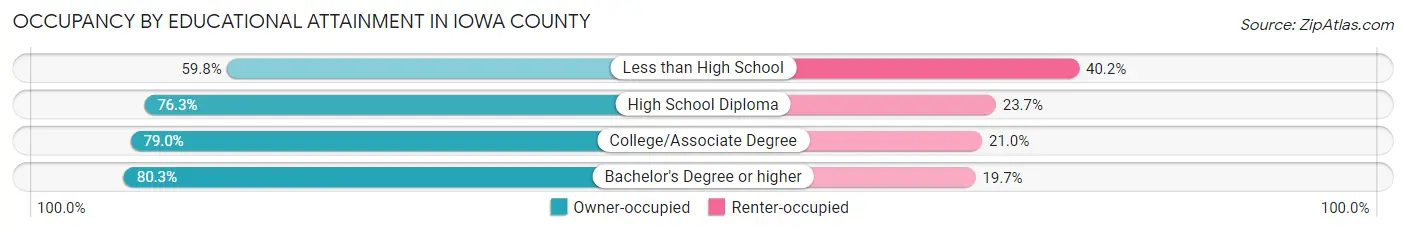
| Household Size | Owner-occupied | Renter-occupied |
| Less than High School | 156 (59.8%) | 105 (40.2%) |
| High School Diploma | 1,714 (76.3%) | 533 (23.7%) |
| College/Associate Degree | 2,097 (79.0%) | 557 (21.0%) |
| Bachelor's Degree or higher | 1,314 (80.3%) | 322 (19.7%) |
Occupancy by Age of Householder in Iowa County
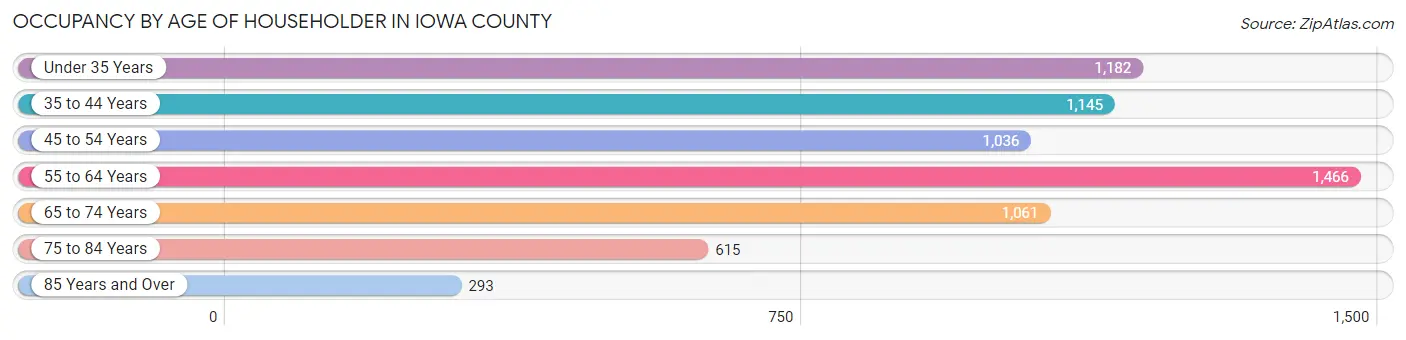
| Age Bracket | # Households | % Households |
| Under 35 Years | 1,182 | 17.4% |
| 35 to 44 Years | 1,145 | 16.8% |
| 45 to 54 Years | 1,036 | 15.2% |
| 55 to 64 Years | 1,466 | 21.6% |
| 65 to 74 Years | 1,061 | 15.6% |
| 75 to 84 Years | 615 | 9.0% |
| 85 Years and Over | 293 | 4.3% |
| Total | 6,798 | 100.0% |
Housing Finances in Iowa County
Median Income by Occupancy in Iowa County
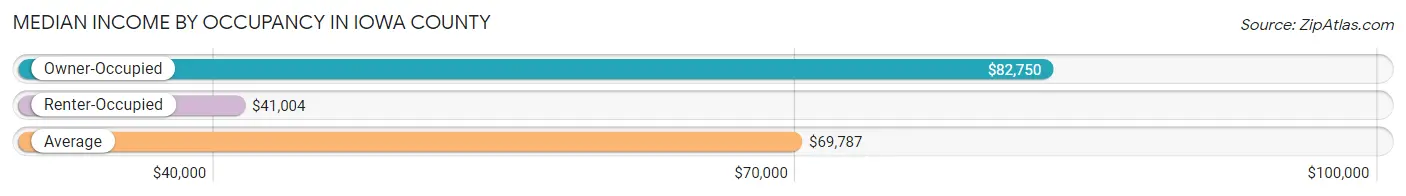
| Occupancy Type | # Households | Median Income |
| Owner-Occupied | 5,281 (77.7%) | $82,750 |
| Renter-Occupied | 1,517 (22.3%) | $41,004 |
| Average | 6,798 (100.0%) | $69,787 |
Occupancy by Householder Income Bracket in Iowa County
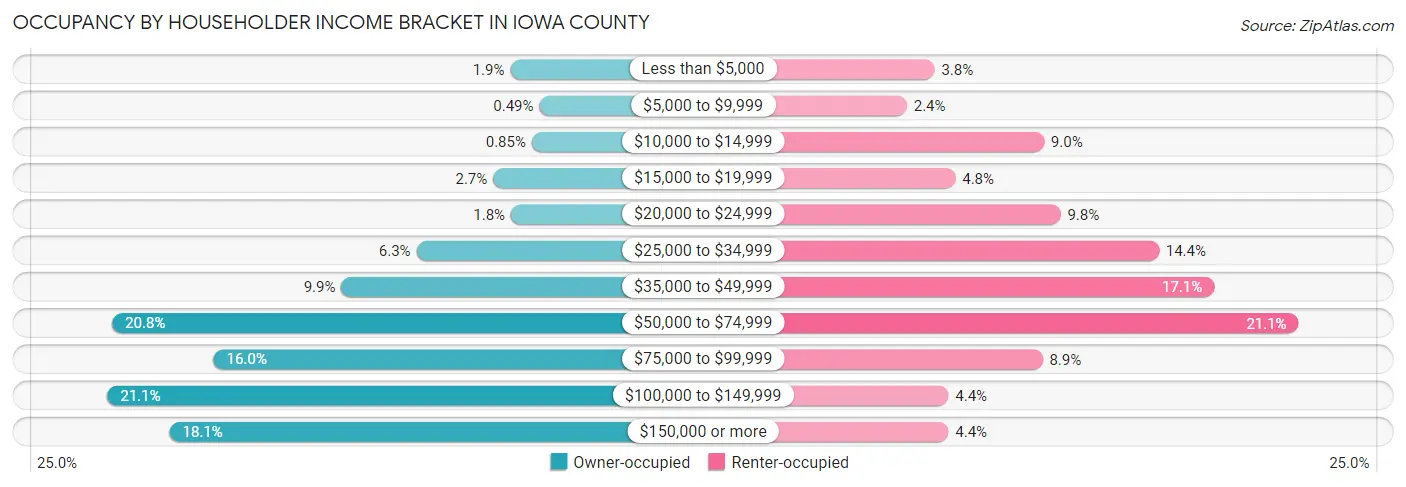
| Income Bracket | Owner-occupied | Renter-occupied |
| Less than $5,000 | 99 (1.9%) | 57 (3.8%) |
| $5,000 to $9,999 | 26 (0.5%) | 37 (2.4%) |
| $10,000 to $14,999 | 45 (0.9%) | 136 (9.0%) |
| $15,000 to $19,999 | 142 (2.7%) | 72 (4.8%) |
| $20,000 to $24,999 | 97 (1.8%) | 148 (9.8%) |
| $25,000 to $34,999 | 335 (6.3%) | 219 (14.4%) |
| $35,000 to $49,999 | 524 (9.9%) | 259 (17.1%) |
| $50,000 to $74,999 | 1,100 (20.8%) | 320 (21.1%) |
| $75,000 to $99,999 | 845 (16.0%) | 135 (8.9%) |
| $100,000 to $149,999 | 1,112 (21.1%) | 67 (4.4%) |
| $150,000 or more | 956 (18.1%) | 67 (4.4%) |
| Total | 5,281 (100.0%) | 1,517 (100.0%) |
Monthly Housing Cost Tiers in Iowa County

| Monthly Cost | Owner-occupied | Renter-occupied |
| Less than $300 | 164 (3.1%) | 53 (3.5%) |
| $300 to $499 | 581 (11.0%) | 160 (10.5%) |
| $500 to $799 | 1,202 (22.8%) | 654 (43.1%) |
| $800 to $999 | 541 (10.2%) | 216 (14.2%) |
| $1,000 to $1,499 | 1,247 (23.6%) | 219 (14.4%) |
| $1,500 to $1,999 | 803 (15.2%) | 72 (4.8%) |
| $2,000 to $2,499 | 406 (7.7%) | 0 (0.0%) |
| $2,500 to $2,999 | 185 (3.5%) | 28 (1.8%) |
| $3,000 or more | 152 (2.9%) | 7 (0.5%) |
| Total | 5,281 (100.0%) | 1,517 (100.0%) |
Physical Housing Characteristics in Iowa County
Housing Structures in Iowa County
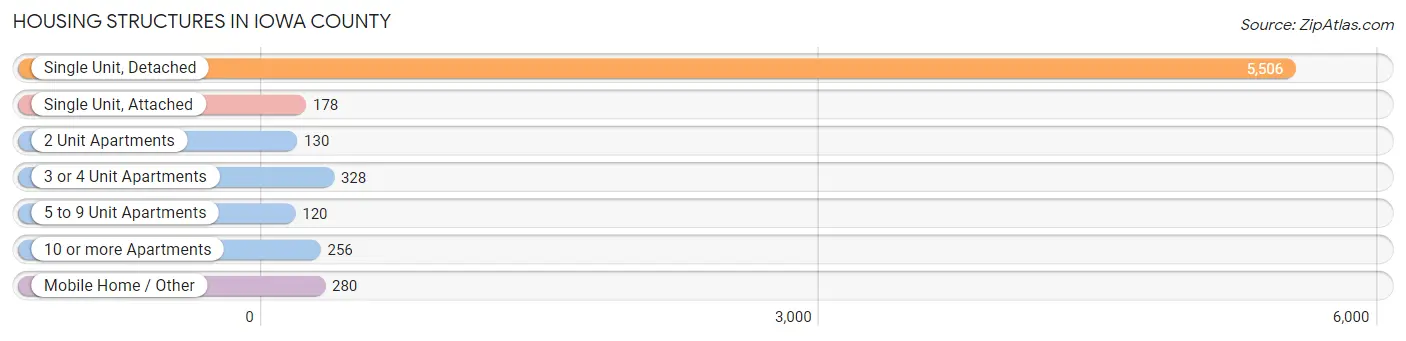
| Structure Type | # Housing Units | % Housing Units |
| Single Unit, Detached | 5,506 | 81.0% |
| Single Unit, Attached | 178 | 2.6% |
| 2 Unit Apartments | 130 | 1.9% |
| 3 or 4 Unit Apartments | 328 | 4.8% |
| 5 to 9 Unit Apartments | 120 | 1.8% |
| 10 or more Apartments | 256 | 3.8% |
| Mobile Home / Other | 280 | 4.1% |
| Total | 6,798 | 100.0% |
Housing Structures by Occupancy in Iowa County
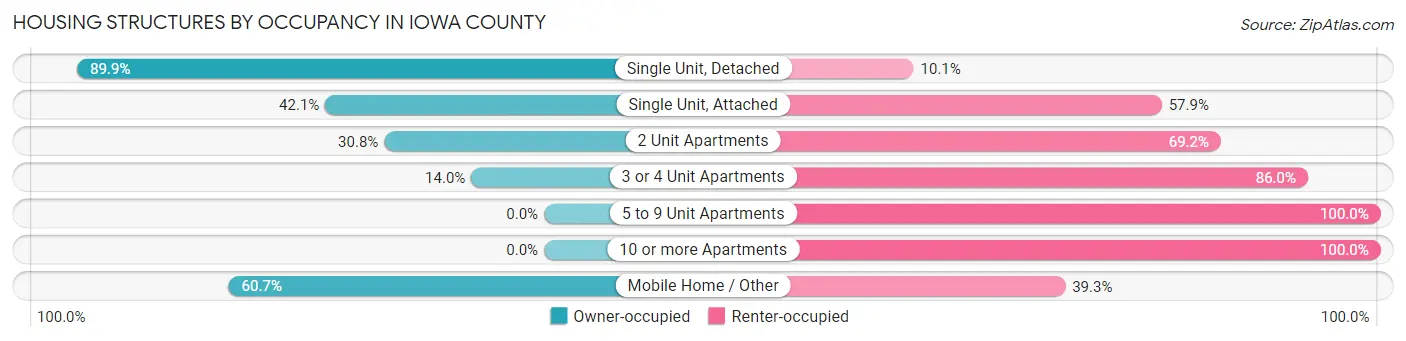
| Structure Type | Owner-occupied | Renter-occupied |
| Single Unit, Detached | 4,950 (89.9%) | 556 (10.1%) |
| Single Unit, Attached | 75 (42.1%) | 103 (57.9%) |
| 2 Unit Apartments | 40 (30.8%) | 90 (69.2%) |
| 3 or 4 Unit Apartments | 46 (14.0%) | 282 (86.0%) |
| 5 to 9 Unit Apartments | 0 (0.0%) | 120 (100.0%) |
| 10 or more Apartments | 0 (0.0%) | 256 (100.0%) |
| Mobile Home / Other | 170 (60.7%) | 110 (39.3%) |
| Total | 5,281 (77.7%) | 1,517 (22.3%) |
Housing Structures by Number of Rooms in Iowa County
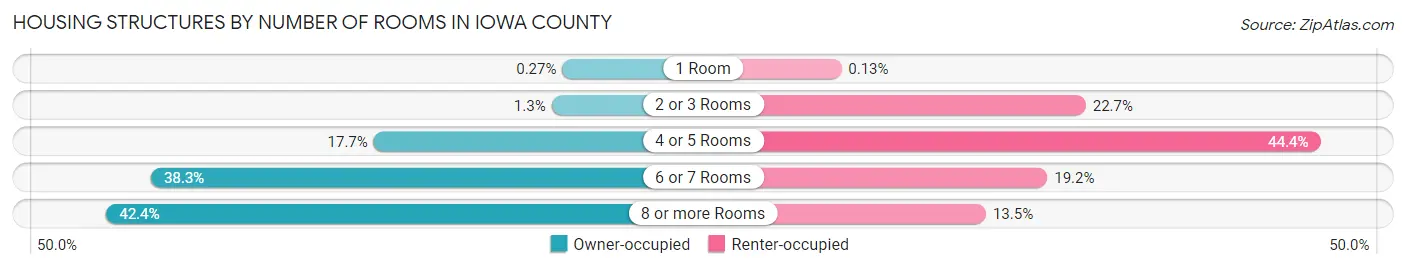
| Number of Rooms | Owner-occupied | Renter-occupied |
| 1 Room | 14 (0.3%) | 2 (0.1%) |
| 2 or 3 Rooms | 67 (1.3%) | 345 (22.7%) |
| 4 or 5 Rooms | 936 (17.7%) | 674 (44.4%) |
| 6 or 7 Rooms | 2,023 (38.3%) | 291 (19.2%) |
| 8 or more Rooms | 2,241 (42.4%) | 205 (13.5%) |
| Total | 5,281 (100.0%) | 1,517 (100.0%) |
Housing Structure by Heating Type in Iowa County
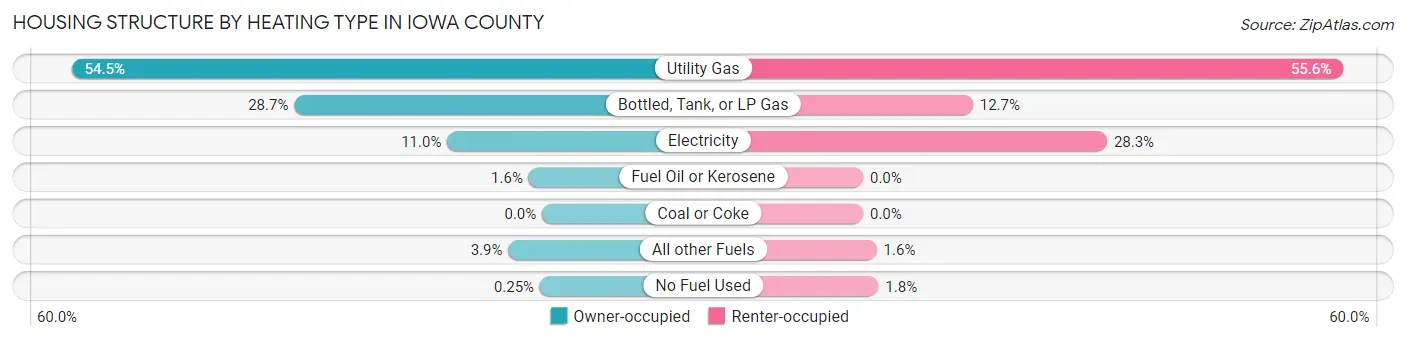
| Heating Type | Owner-occupied | Renter-occupied |
| Utility Gas | 2,880 (54.5%) | 844 (55.6%) |
| Bottled, Tank, or LP Gas | 1,518 (28.7%) | 193 (12.7%) |
| Electricity | 581 (11.0%) | 429 (28.3%) |
| Fuel Oil or Kerosene | 82 (1.5%) | 0 (0.0%) |
| Coal or Coke | 0 (0.0%) | 0 (0.0%) |
| All other Fuels | 207 (3.9%) | 24 (1.6%) |
| No Fuel Used | 13 (0.3%) | 27 (1.8%) |
| Total | 5,281 (100.0%) | 1,517 (100.0%) |
Household Vehicle Usage in Iowa County
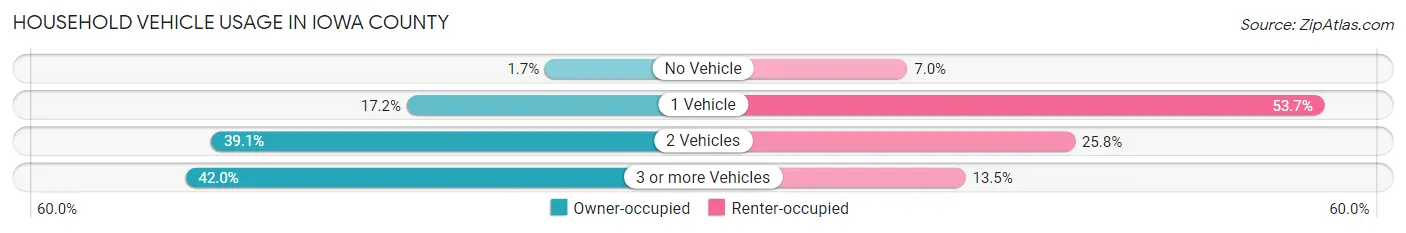
| Vehicles per Household | Owner-occupied | Renter-occupied |
| No Vehicle | 90 (1.7%) | 106 (7.0%) |
| 1 Vehicle | 908 (17.2%) | 815 (53.7%) |
| 2 Vehicles | 2,066 (39.1%) | 391 (25.8%) |
| 3 or more Vehicles | 2,217 (42.0%) | 205 (13.5%) |
| Total | 5,281 (100.0%) | 1,517 (100.0%) |
Real Estate & Mortgages in Iowa County
Real Estate and Mortgage Overview in Iowa County
| Characteristic | Without Mortgage | With Mortgage |
| Housing Units | 2,223 | 3,058 |
| Median Property Value | $171,300 | $178,700 |
| Median Household Income | $62,835 | $684 |
| Monthly Housing Costs | $586 | $138 |
| Real Estate Taxes | $2,319 | $38 |
Property Value by Mortgage Status in Iowa County
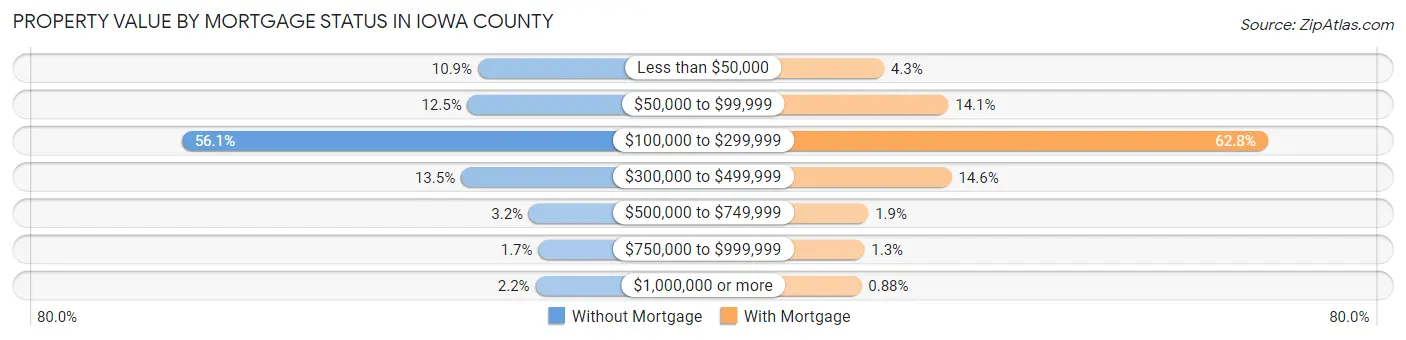
| Property Value | Without Mortgage | With Mortgage |
| Less than $50,000 | 243 (10.9%) | 132 (4.3%) |
| $50,000 to $99,999 | 278 (12.5%) | 432 (14.1%) |
| $100,000 to $299,999 | 1,246 (56.0%) | 1,920 (62.8%) |
| $300,000 to $499,999 | 300 (13.5%) | 447 (14.6%) |
| $500,000 to $749,999 | 70 (3.2%) | 59 (1.9%) |
| $750,000 to $999,999 | 38 (1.7%) | 41 (1.3%) |
| $1,000,000 or more | 48 (2.2%) | 27 (0.9%) |
| Total | 2,223 (100.0%) | 3,058 (100.0%) |
Household Income by Mortgage Status in Iowa County
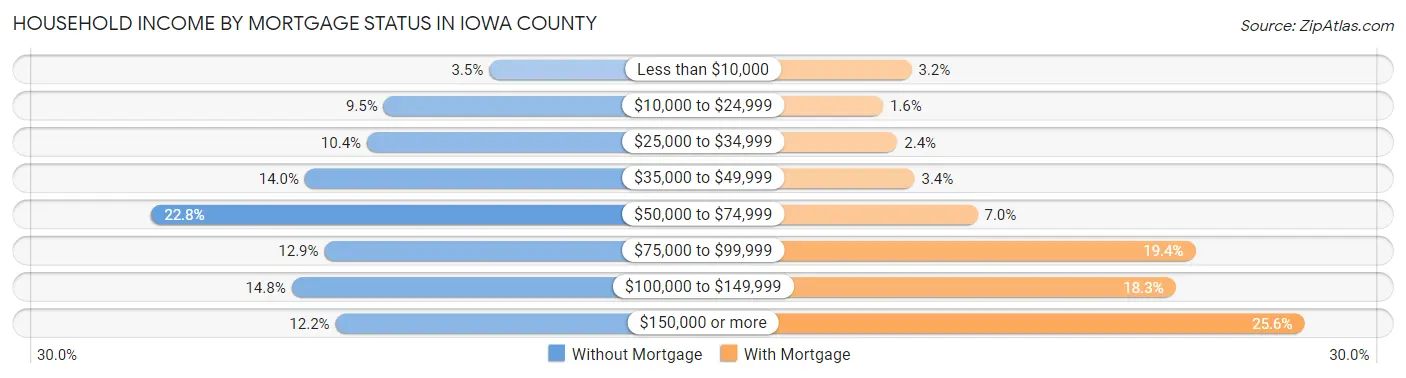
| Household Income | Without Mortgage | With Mortgage |
| Less than $10,000 | 77 (3.5%) | 98 (3.2%) |
| $10,000 to $24,999 | 211 (9.5%) | 48 (1.6%) |
| $25,000 to $34,999 | 232 (10.4%) | 73 (2.4%) |
| $35,000 to $49,999 | 311 (14.0%) | 103 (3.4%) |
| $50,000 to $74,999 | 506 (22.8%) | 213 (7.0%) |
| $75,000 to $99,999 | 286 (12.9%) | 594 (19.4%) |
| $100,000 to $149,999 | 328 (14.7%) | 559 (18.3%) |
| $150,000 or more | 272 (12.2%) | 784 (25.6%) |
| Total | 2,223 (100.0%) | 3,058 (100.0%) |
Property Value to Household Income Ratio in Iowa County
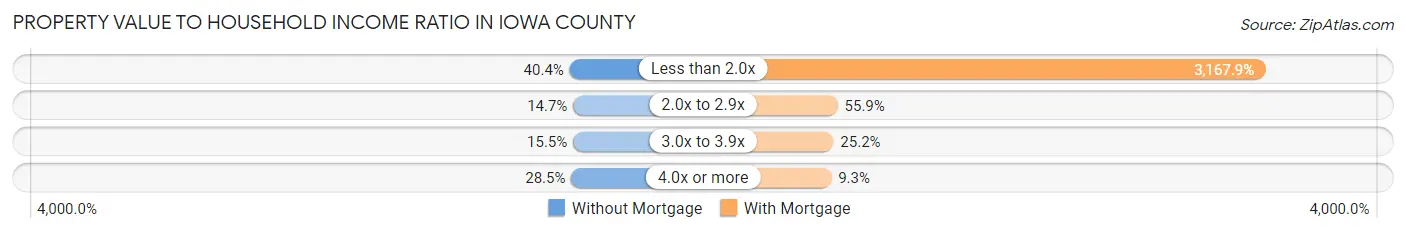
| Value-to-Income Ratio | Without Mortgage | With Mortgage |
| Less than 2.0x | 898 (40.4%) | 96,875 (3,167.9%) |
| 2.0x to 2.9x | 326 (14.7%) | 1,709 (55.9%) |
| 3.0x to 3.9x | 345 (15.5%) | 771 (25.2%) |
| 4.0x or more | 634 (28.5%) | 285 (9.3%) |
| Total | 2,223 (100.0%) | 3,058 (100.0%) |
Real Estate Taxes by Mortgage Status in Iowa County
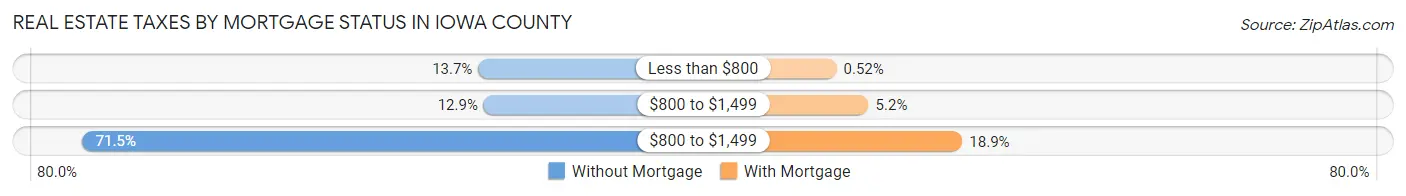
| Property Taxes | Without Mortgage | With Mortgage |
| Less than $800 | 305 (13.7%) | 16 (0.5%) |
| $800 to $1,499 | 287 (12.9%) | 159 (5.2%) |
| $800 to $1,499 | 1,590 (71.5%) | 578 (18.9%) |
| Total | 2,223 (100.0%) | 3,058 (100.0%) |
Health & Disability in Iowa County
Health Insurance Coverage by Age in Iowa County
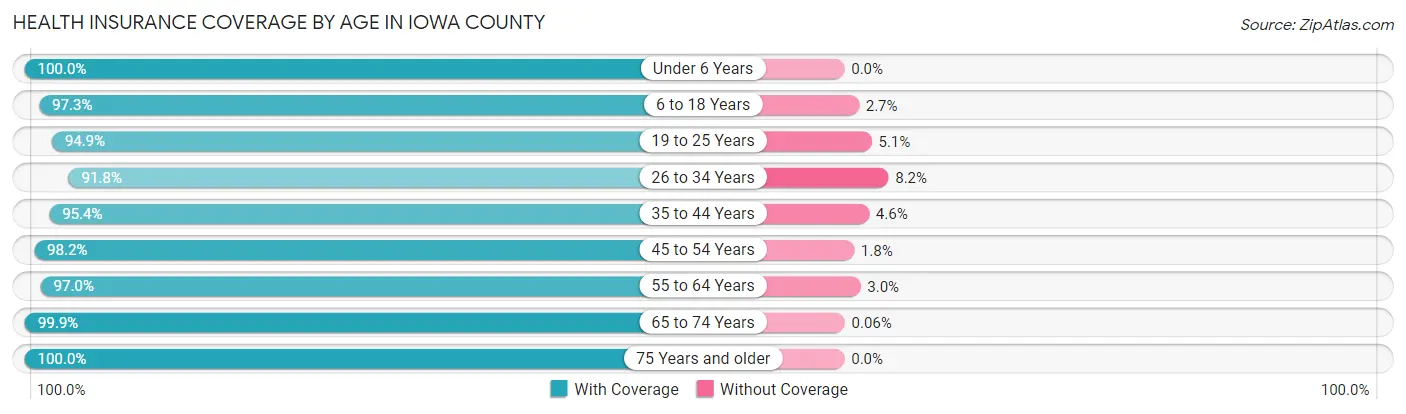
| Age Bracket | With Coverage | Without Coverage |
| Under 6 Years | 1,075 (100.0%) | 0 (0.0%) |
| 6 to 18 Years | 2,953 (97.3%) | 82 (2.7%) |
| 19 to 25 Years | 1,064 (94.9%) | 57 (5.1%) |
| 26 to 34 Years | 1,400 (91.8%) | 125 (8.2%) |
| 35 to 44 Years | 1,913 (95.4%) | 92 (4.6%) |
| 45 to 54 Years | 1,972 (98.2%) | 36 (1.8%) |
| 55 to 64 Years | 2,470 (97.0%) | 76 (3.0%) |
| 65 to 74 Years | 1,715 (99.9%) | 1 (0.1%) |
| 75 Years and older | 1,276 (100.0%) | 0 (0.0%) |
| Total | 15,838 (97.1%) | 469 (2.9%) |
Health Insurance Coverage by Citizenship Status in Iowa County
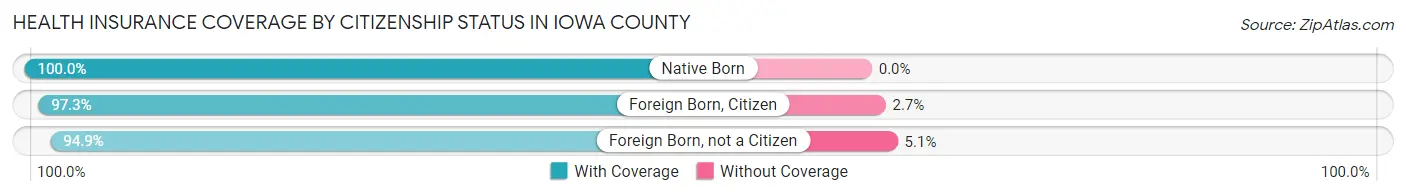
| Citizenship Status | With Coverage | Without Coverage |
| Native Born | 1,075 (100.0%) | 0 (0.0%) |
| Foreign Born, Citizen | 2,953 (97.3%) | 82 (2.7%) |
| Foreign Born, not a Citizen | 1,064 (94.9%) | 57 (5.1%) |
Health Insurance Coverage by Household Income in Iowa County
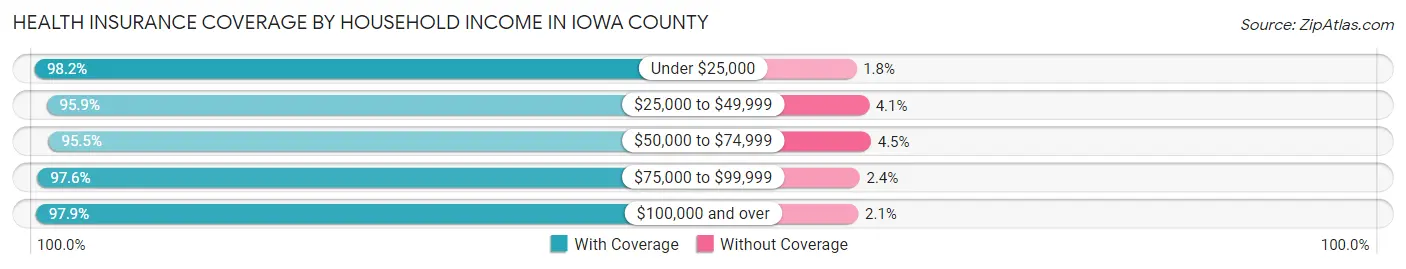
| Household Income | With Coverage | Without Coverage |
| Under $25,000 | 1,343 (98.2%) | 24 (1.8%) |
| $25,000 to $49,999 | 2,076 (95.9%) | 89 (4.1%) |
| $50,000 to $74,999 | 3,204 (95.5%) | 151 (4.5%) |
| $75,000 to $99,999 | 2,817 (97.6%) | 69 (2.4%) |
| $100,000 and over | 6,286 (97.9%) | 136 (2.1%) |
Public vs Private Health Insurance Coverage by Age in Iowa County
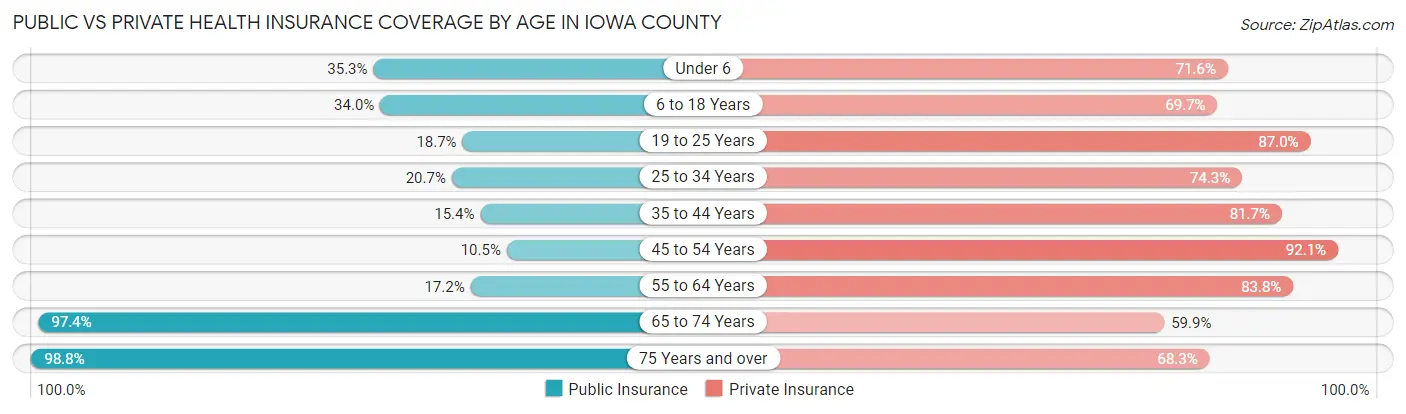
| Age Bracket | Public Insurance | Private Insurance |
| Under 6 | 379 (35.3%) | 770 (71.6%) |
| 6 to 18 Years | 1,032 (34.0%) | 2,116 (69.7%) |
| 19 to 25 Years | 210 (18.7%) | 975 (87.0%) |
| 25 to 34 Years | 316 (20.7%) | 1,133 (74.3%) |
| 35 to 44 Years | 309 (15.4%) | 1,637 (81.7%) |
| 45 to 54 Years | 211 (10.5%) | 1,849 (92.1%) |
| 55 to 64 Years | 439 (17.2%) | 2,133 (83.8%) |
| 65 to 74 Years | 1,672 (97.4%) | 1,027 (59.9%) |
| 75 Years and over | 1,260 (98.8%) | 871 (68.3%) |
| Total | 5,828 (35.7%) | 12,511 (76.7%) |
Disability Status by Sex by Age in Iowa County
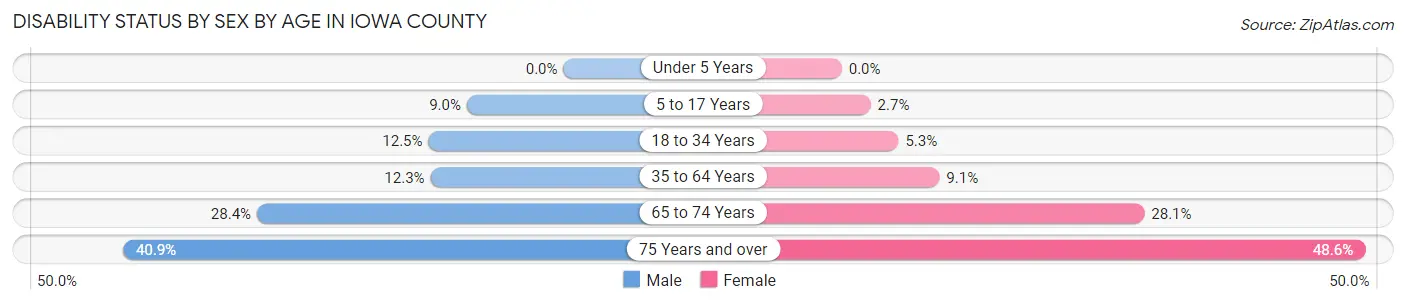
| Age Bracket | Male | Female |
| Under 5 Years | 0 (0.0%) | 0 (0.0%) |
| 5 to 17 Years | 137 (9.0%) | 38 (2.7%) |
| 18 to 34 Years | 187 (12.5%) | 73 (5.3%) |
| 35 to 64 Years | 424 (12.3%) | 283 (9.1%) |
| 65 to 74 Years | 248 (28.4%) | 237 (28.1%) |
| 75 Years and over | 226 (40.9%) | 351 (48.5%) |
Disability Class by Sex by Age in Iowa County
Disability Class: Hearing Difficulty
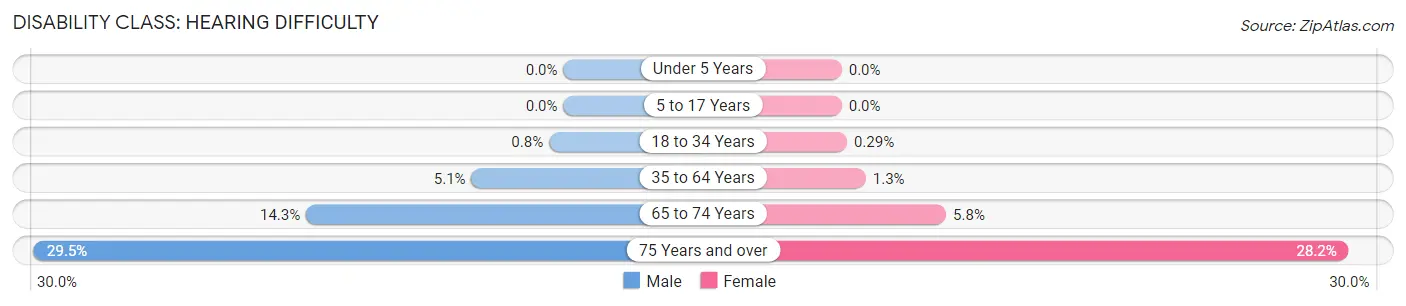
| Age Bracket | Male | Female |
| Under 5 Years | 0 (0.0%) | 0 (0.0%) |
| 5 to 17 Years | 0 (0.0%) | 0 (0.0%) |
| 18 to 34 Years | 12 (0.8%) | 4 (0.3%) |
| 35 to 64 Years | 176 (5.1%) | 42 (1.3%) |
| 65 to 74 Years | 125 (14.3%) | 49 (5.8%) |
| 75 Years and over | 163 (29.5%) | 204 (28.2%) |
Disability Class: Vision Difficulty
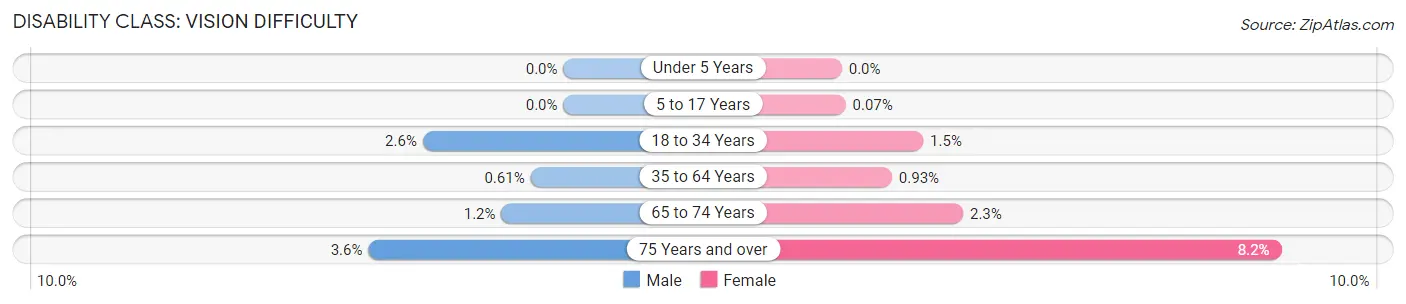
| Age Bracket | Male | Female |
| Under 5 Years | 0 (0.0%) | 0 (0.0%) |
| 5 to 17 Years | 0 (0.0%) | 1 (0.1%) |
| 18 to 34 Years | 39 (2.6%) | 21 (1.5%) |
| 35 to 64 Years | 21 (0.6%) | 29 (0.9%) |
| 65 to 74 Years | 10 (1.1%) | 19 (2.2%) |
| 75 Years and over | 20 (3.6%) | 59 (8.2%) |
Disability Class: Cognitive Difficulty
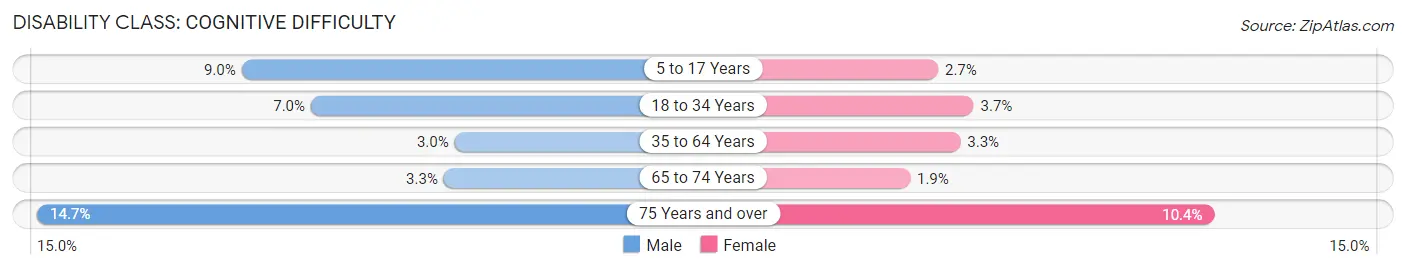
| Age Bracket | Male | Female |
| 5 to 17 Years | 137 (9.0%) | 38 (2.7%) |
| 18 to 34 Years | 105 (7.0%) | 51 (3.7%) |
| 35 to 64 Years | 104 (3.0%) | 103 (3.3%) |
| 65 to 74 Years | 29 (3.3%) | 16 (1.9%) |
| 75 Years and over | 81 (14.6%) | 75 (10.4%) |
Disability Class: Ambulatory Difficulty
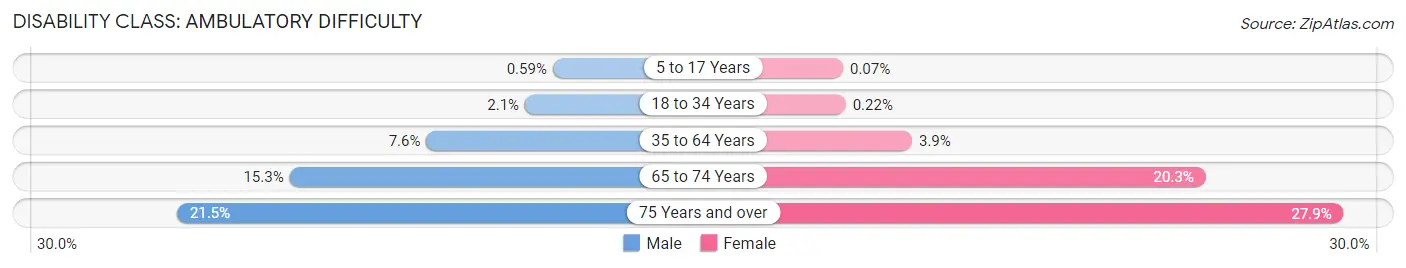
| Age Bracket | Male | Female |
| 5 to 17 Years | 9 (0.6%) | 1 (0.1%) |
| 18 to 34 Years | 32 (2.1%) | 3 (0.2%) |
| 35 to 64 Years | 262 (7.6%) | 122 (3.9%) |
| 65 to 74 Years | 133 (15.2%) | 171 (20.3%) |
| 75 Years and over | 119 (21.5%) | 202 (27.9%) |
Disability Class: Self-Care Difficulty
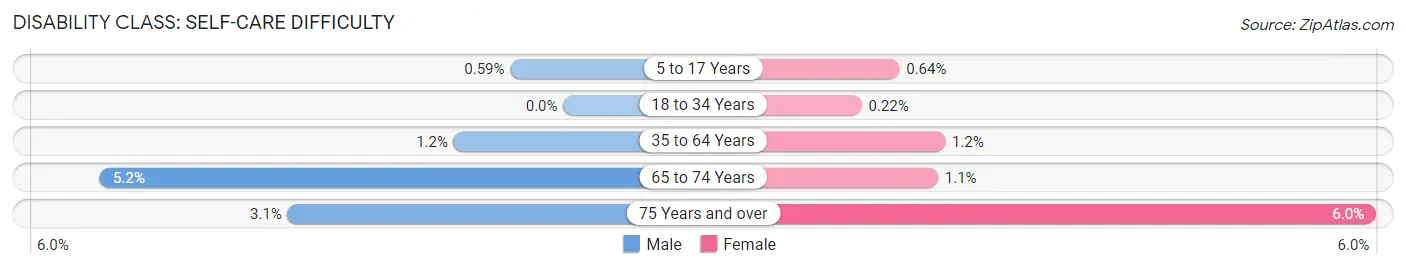
| Age Bracket | Male | Female |
| 5 to 17 Years | 9 (0.6%) | 9 (0.6%) |
| 18 to 34 Years | 0 (0.0%) | 3 (0.2%) |
| 35 to 64 Years | 42 (1.2%) | 36 (1.1%) |
| 65 to 74 Years | 45 (5.2%) | 9 (1.1%) |
| 75 Years and over | 17 (3.1%) | 43 (5.9%) |
Technology Access in Iowa County
Computing Device Access in Iowa County
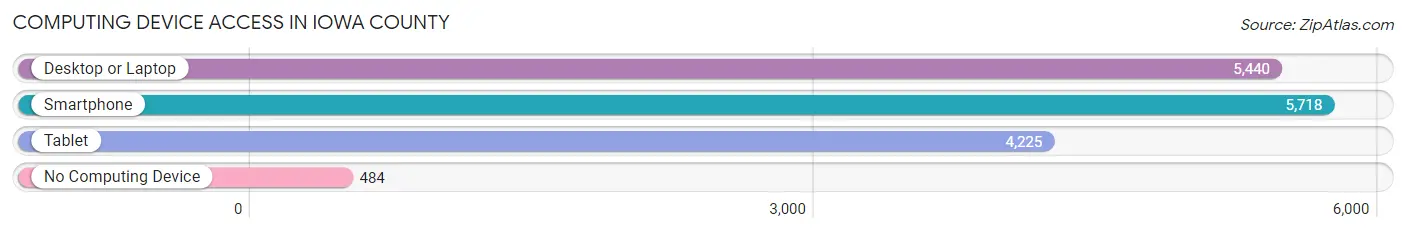
| Device Type | # Households | % Households |
| Desktop or Laptop | 5,440 | 80.0% |
| Smartphone | 5,718 | 84.1% |
| Tablet | 4,225 | 62.2% |
| No Computing Device | 484 | 7.1% |
| Total | 6,798 | 100.0% |
Internet Access in Iowa County
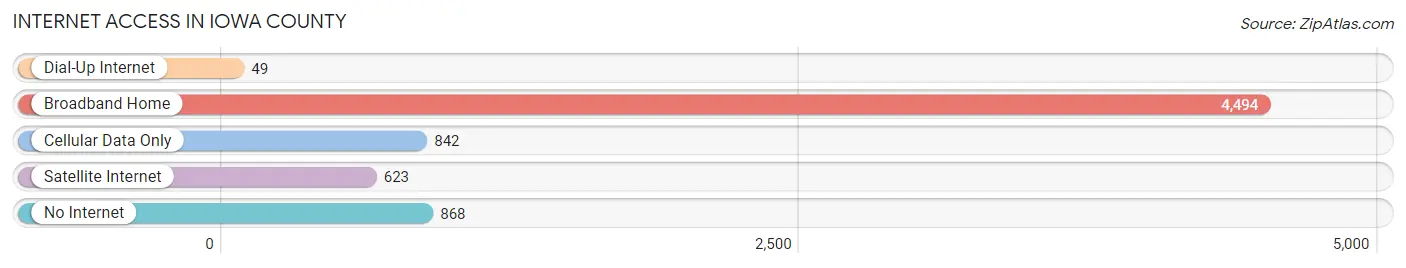
| Internet Type | # Households | % Households |
| Dial-Up Internet | 49 | 0.7% |
| Broadband Home | 4,494 | 66.1% |
| Cellular Data Only | 842 | 12.4% |
| Satellite Internet | 623 | 9.2% |
| No Internet | 868 | 12.8% |
| Total | 6,798 | 100.0% |
Iowa County Summary
Iowa County is located in the state of Iowa in the Midwestern United States. It is bordered by Johnson County to the north, Cedar County to the east, Muscatine County to the south, and Louisa County to the west. The county seat is Marengo, and the largest city is Williamsburg. Iowa County was established in 1843 and is named after the Iowa River, which flows through the county.
Geography
Iowa County covers an area of 576 square miles and is located in the rolling hills of eastern Iowa. The county is mostly rural, with small towns and villages scattered throughout. The Iowa River flows through the county, and the Cedar River forms part of the county’s western border. The county is home to several state parks, including Palisades-Kepler State Park, Lake Macbride State Park, and Pine Lake State Park.
Demographics
As of the 2010 census, Iowa County had a population of 16,355. The population was spread out with a median age of 41.7 years. The racial makeup of the county was 97.2% White, 0.5% African American, 0.3% Native American, 0.4% Asian, 0.1% Pacific Islander, 0.6% from other races, and 0.9% from two or more races. Hispanic or Latino of any race were 1.7% of the population.
Economy
Agriculture is the main economic driver in Iowa County. The county is home to several large farms, and the majority of the population is employed in the agricultural sector. The county is also home to several small businesses, including restaurants, retail stores, and service providers.
The county is home to several manufacturing companies, including a large food processing plant and a furniture manufacturer. The county is also home to several wineries and breweries, as well as a distillery.
Education
Iowa County is served by the Iowa County Community School District, which operates several elementary, middle, and high schools. The county is also home to several private schools, including a Catholic school and a Lutheran school. The county is also home to a community college, Kirkwood Community College, which offers a variety of degree and certificate programs.
Conclusion
Iowa County is a rural county located in the rolling hills of eastern Iowa. The county is home to several small towns and villages, and the majority of the population is employed in the agricultural sector. The county is also home to several manufacturing companies, wineries, breweries, and a distillery. The county is served by the Iowa County Community School District, as well as several private schools and Kirkwood Community College.
Common Questions
What is Per Capita Income in Iowa County?
Per Capita income in Iowa County is $40,182.
What is the Median Family Income in Iowa County?
Median Family Income in Iowa County is $90,301.
What is the Median Household income in Iowa County?
Median Household Income in Iowa County is $69,787.
What is Income or Wage Gap in Iowa County?
Income or Wage Gap in Iowa County is 29.3%.
Women in Iowa County earn 70.7 cents for every dollar earned by a man.
What is Family Income Deficit in Iowa County?
Family Income Deficit in Iowa County is $10,555.
Families that are below poverty line in Iowa County earn $10,555 less on average than the poverty threshold level.
What is Inequality or Gini Index in Iowa County?
Inequality or Gini Index in Iowa County is 0.45.
What is the Total Population of Iowa County?
Total Population of Iowa County is 16,575.
What is the Total Male Population of Iowa County?
Total Male Population of Iowa County is 8,470.
What is the Total Female Population of Iowa County?
Total Female Population of Iowa County is 8,105.
What is the Ratio of Males per 100 Females in Iowa County?
There are 104.50 Males per 100 Females in Iowa County.
What is the Ratio of Females per 100 Males in Iowa County?
There are 95.69 Females per 100 Males in Iowa County.
What is the Median Population Age in Iowa County?
Median Population Age in Iowa County is 42.2 Years.
What is the Average Family Size in Iowa County
Average Family Size in Iowa County is 3.0 People.
What is the Average Household Size in Iowa County
Average Household Size in Iowa County is 2.4 People.
How Large is the Labor Force in Iowa County?
There are 8,781 People in the Labor Forcein in Iowa County.
What is the Percentage of People in the Labor Force in Iowa County?
66.8% of People are in the Labor Force in Iowa County.
What is the Unemployment Rate in Iowa County?
Unemployment Rate in Iowa County is 3.2%.