Delaware County, IA Map & Demographics
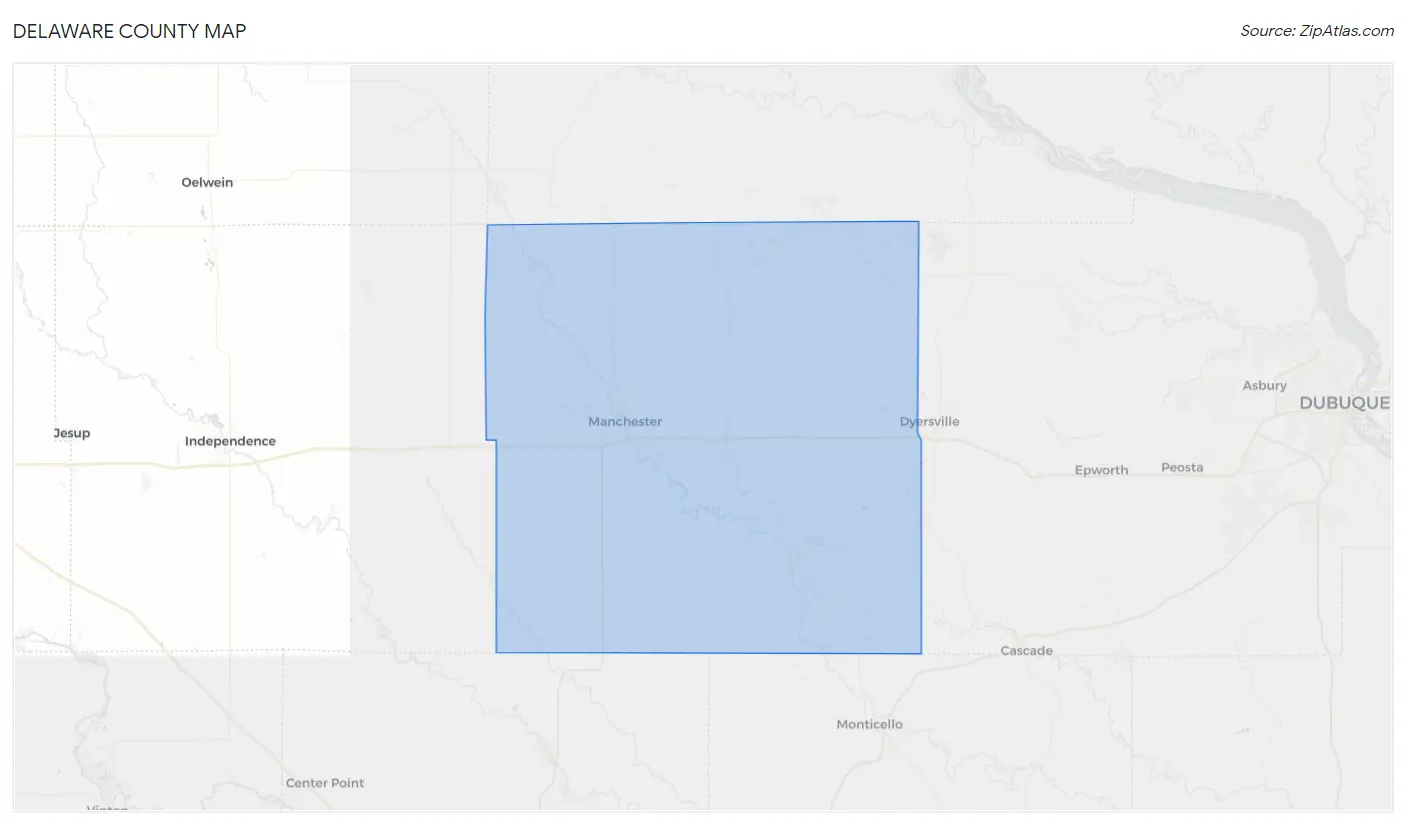
Delaware County Map
Delaware County Overview
$40,709
PER CAPITA INCOME
$90,572
AVG FAMILY INCOME
$75,896
AVG HOUSEHOLD INCOME
33.7%
WAGE / INCOME GAP [ % ]
66.3¢/ $1
WAGE / INCOME GAP [ $ ]
$9,961
FAMILY INCOME DEFICIT
0.44
INEQUALITY / GINI INDEX
17,523
TOTAL POPULATION
8,944
MALE POPULATION
8,579
FEMALE POPULATION
104.25
MALES / 100 FEMALES
95.92
FEMALES / 100 MALES
43.5
MEDIAN AGE
3.0
AVG FAMILY SIZE
2.5
AVG HOUSEHOLD SIZE
9,807
LABOR FORCE [ PEOPLE ]
71.1%
PERCENT IN LABOR FORCE
2.2%
UNEMPLOYMENT RATE
Income in Delaware County
Income Overview in Delaware County
Per Capita Income in Delaware County is $40,709, while median incomes of families and households are $90,572 and $75,896 respectively.
| Characteristic | Number | Measure |
| Per Capita Income | 17,523 | $40,709 |
| Median Family Income | 4,783 | $90,572 |
| Mean Family Income | 4,783 | $118,169 |
| Median Household Income | 7,068 | $75,896 |
| Mean Household Income | 7,068 | $97,812 |
| Income Deficit | 4,783 | $9,961 |
| Wage / Income Gap (%) | 17,523 | 33.72% |
| Wage / Income Gap ($) | 17,523 | 66.28¢ per $1 |
| Gini / Inequality Index | 17,523 | 0.44 |
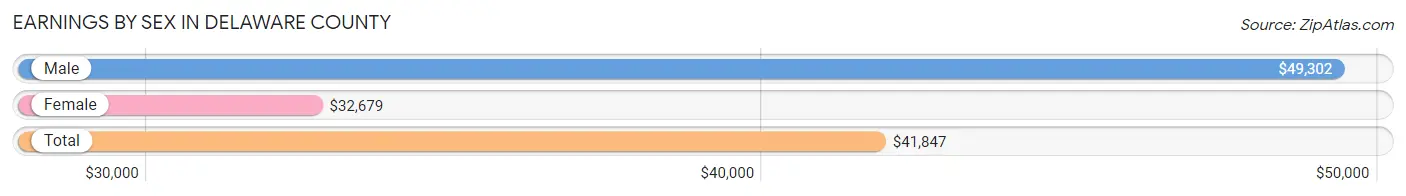
Earnings by Sex in Delaware County
Average Earnings in Delaware County are $41,847, $49,302 for men and $32,679 for women, a difference of 33.7%.
| Sex | Number | Average Earnings |
| Male | 5,586 (54.4%) | $49,302 |
| Female | 4,673 (45.6%) | $32,679 |
| Total | 10,259 (100.0%) | $41,847 |
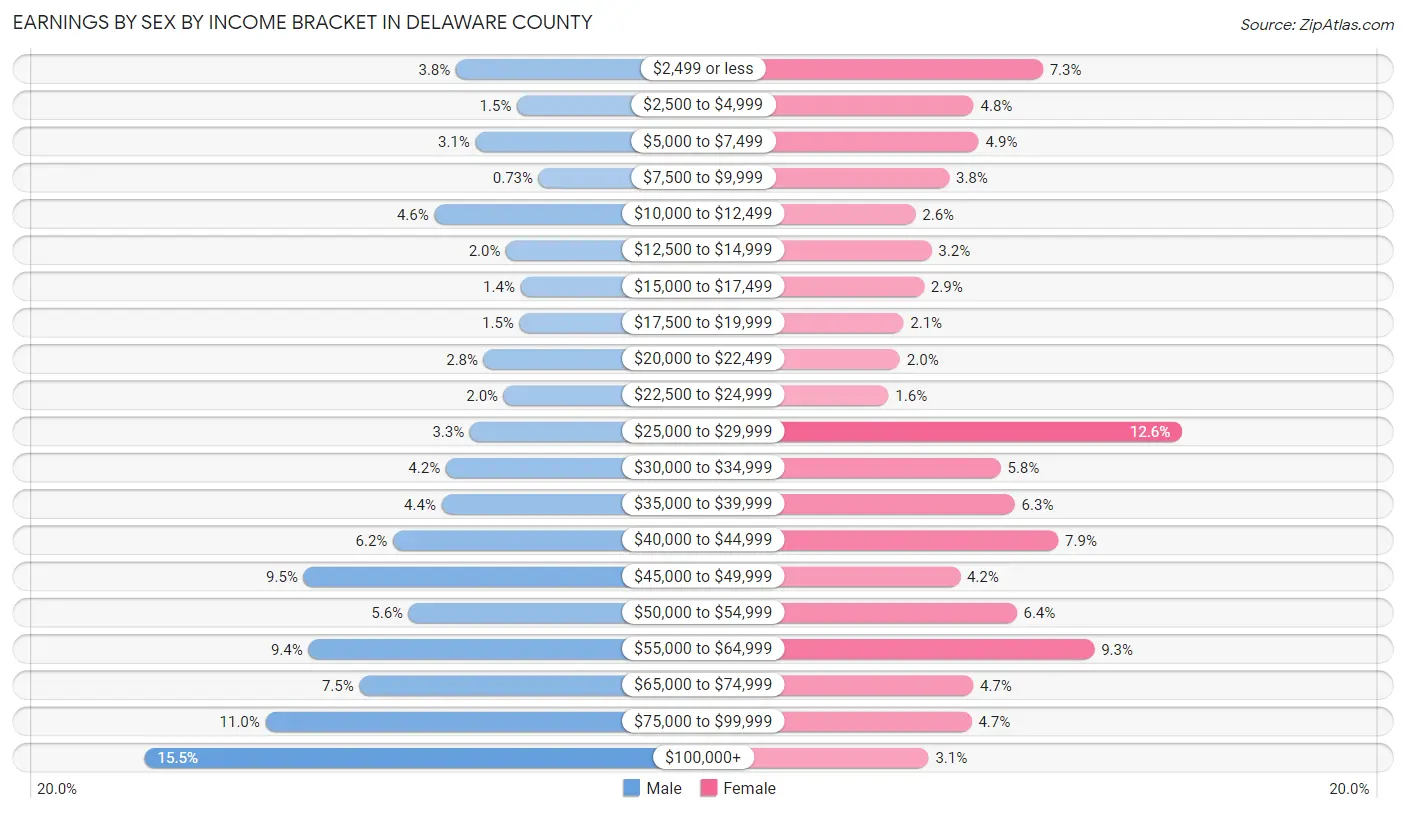
Earnings by Sex by Income Bracket in Delaware County
The most common earnings brackets in Delaware County are $100,000+ for men (866 | 15.5%) and $25,000 to $29,999 for women (587 | 12.6%).
| Income | Male | Female |
| $2,499 or less | 214 (3.8%) | 343 (7.3%) |
| $2,500 to $4,999 | 86 (1.5%) | 222 (4.8%) |
| $5,000 to $7,499 | 173 (3.1%) | 231 (4.9%) |
| $7,500 to $9,999 | 41 (0.7%) | 179 (3.8%) |
| $10,000 to $12,499 | 259 (4.6%) | 120 (2.6%) |
| $12,500 to $14,999 | 109 (1.9%) | 148 (3.2%) |
| $15,000 to $17,499 | 79 (1.4%) | 135 (2.9%) |
| $17,500 to $19,999 | 81 (1.5%) | 99 (2.1%) |
| $20,000 to $22,499 | 156 (2.8%) | 93 (2.0%) |
| $22,500 to $24,999 | 114 (2.0%) | 73 (1.6%) |
| $25,000 to $29,999 | 185 (3.3%) | 587 (12.6%) |
| $30,000 to $34,999 | 235 (4.2%) | 269 (5.8%) |
| $35,000 to $39,999 | 244 (4.4%) | 294 (6.3%) |
| $40,000 to $44,999 | 346 (6.2%) | 370 (7.9%) |
| $45,000 to $49,999 | 533 (9.5%) | 198 (4.2%) |
| $50,000 to $54,999 | 313 (5.6%) | 297 (6.4%) |
| $55,000 to $64,999 | 523 (9.4%) | 433 (9.3%) |
| $65,000 to $74,999 | 416 (7.4%) | 221 (4.7%) |
| $75,000 to $99,999 | 613 (11.0%) | 218 (4.7%) |
| $100,000+ | 866 (15.5%) | 143 (3.1%) |
| Total | 5,586 (100.0%) | 4,673 (100.0%) |
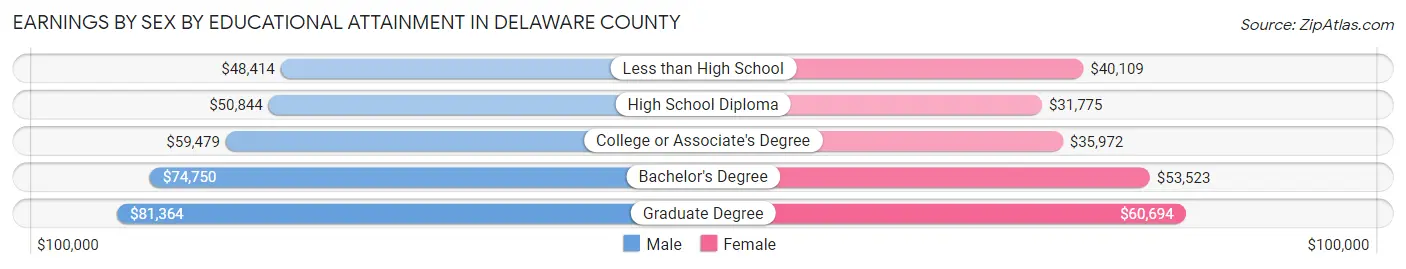
Earnings by Sex by Educational Attainment in Delaware County
Average earnings in Delaware County are $55,000 for men and $37,091 for women, a difference of 32.6%. Men with an educational attainment of graduate degree enjoy the highest average annual earnings of $81,364, while those with less than high school education earn the least with $48,414. Women with an educational attainment of graduate degree earn the most with the average annual earnings of $60,694, while those with high school diploma education have the smallest earnings of $31,775.
| Educational Attainment | Male Income | Female Income |
| Less than High School | $48,414 | $40,109 |
| High School Diploma | $50,844 | $31,775 |
| College or Associate's Degree | $59,479 | $35,972 |
| Bachelor's Degree | $74,750 | $53,523 |
| Graduate Degree | $81,364 | $60,694 |
| Total | $55,000 | $37,091 |
Family Income in Delaware County
Family Income Brackets in Delaware County
According to the Delaware County family income data, there are 1,287 families falling into the $100,000 to $149,999 income range, which is the most common income bracket and makes up 26.9% of all families. Conversely, the $10,000 to $14,999 income bracket is the least frequent group with only 38 families (0.8%) belonging to this category.
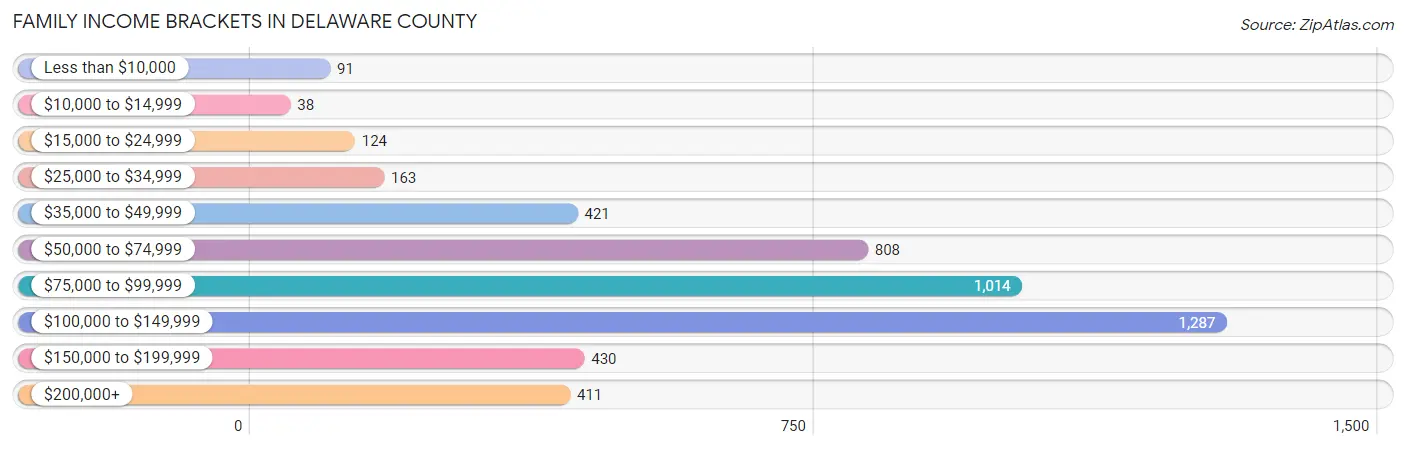
| Income Bracket | # Families | % Families |
| Less than $10,000 | 91 | 1.9% |
| $10,000 to $14,999 | 38 | 0.8% |
| $15,000 to $24,999 | 124 | 2.6% |
| $25,000 to $34,999 | 163 | 3.4% |
| $35,000 to $49,999 | 421 | 8.8% |
| $50,000 to $74,999 | 808 | 16.9% |
| $75,000 to $99,999 | 1,014 | 21.2% |
| $100,000 to $149,999 | 1,287 | 26.9% |
| $150,000 to $199,999 | 430 | 9.0% |
| $200,000+ | 411 | 8.6% |
Family Income by Famaliy Size in Delaware County
4-person families (836 | 17.5%) account for the highest median family income in Delaware County with $140,436 per family, while 2-person families (2,583 | 54.0%) have the highest median income of $40,142 per family member.
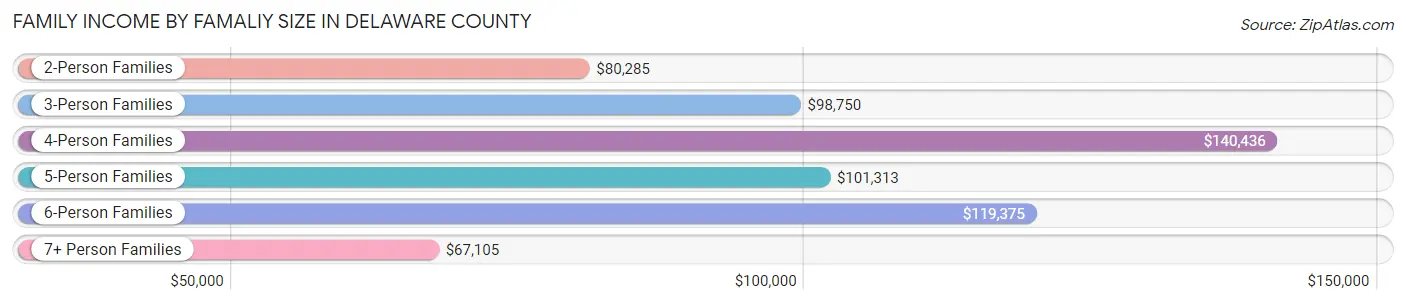
| Income Bracket | # Families | Median Income |
| 2-Person Families | 2,583 (54.0%) | $80,285 |
| 3-Person Families | 794 (16.6%) | $98,750 |
| 4-Person Families | 836 (17.5%) | $140,436 |
| 5-Person Families | 394 (8.2%) | $101,313 |
| 6-Person Families | 144 (3.0%) | $119,375 |
| 7+ Person Families | 32 (0.7%) | $67,105 |
| Total | 4,783 (100.0%) | $90,572 |
Family Income by Number of Earners in Delaware County
The median family income in Delaware County is $90,572, with families comprising 3+ earners (584) having the highest median family income of $132,330, while families with no earners (593) have the lowest median family income of $49,856, accounting for 12.2% and 12.4% of families, respectively.
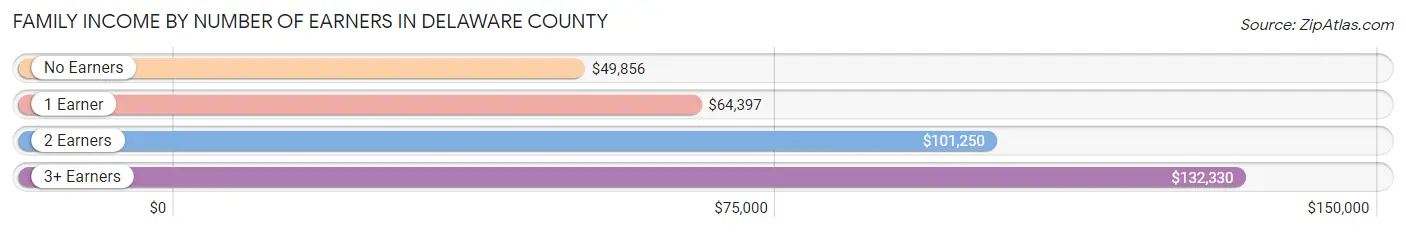
| Number of Earners | # Families | Median Income |
| No Earners | 593 (12.4%) | $49,856 |
| 1 Earner | 1,088 (22.8%) | $64,397 |
| 2 Earners | 2,518 (52.6%) | $101,250 |
| 3+ Earners | 584 (12.2%) | $132,330 |
| Total | 4,783 (100.0%) | $90,572 |
Household Income in Delaware County
Household Income Brackets in Delaware County
With 1,392 households falling in the category, the $100,000 to $149,999 income range is the most frequent in Delaware County, accounting for 19.7% of all households. In contrast, only 177 households (2.5%) fall into the less than $10,000 income bracket, making it the least populous group.
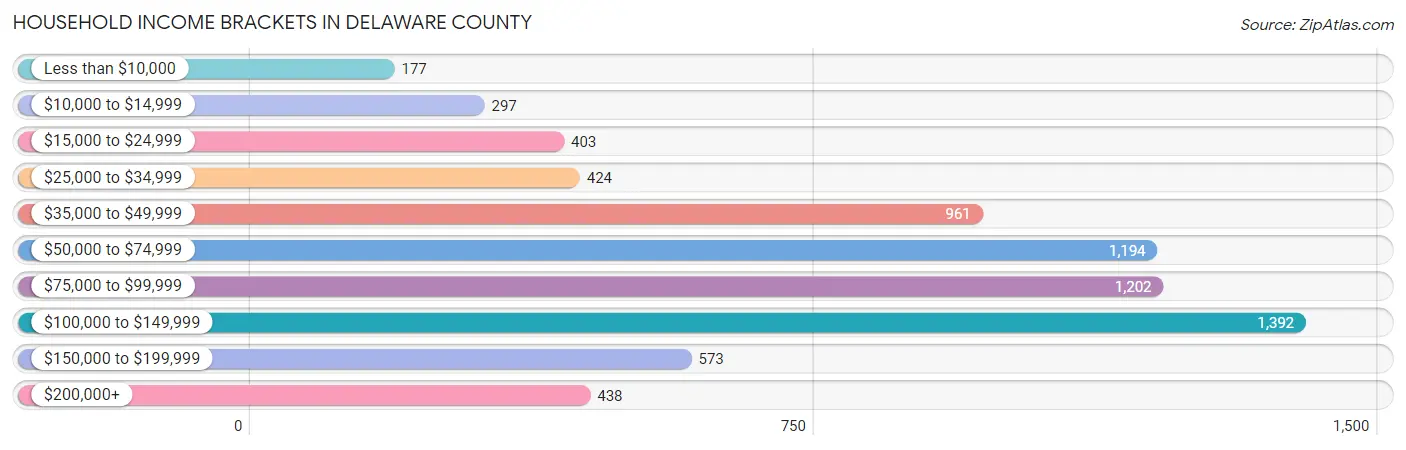
| Income Bracket | # Households | % Households |
| Less than $10,000 | 177 | 2.5% |
| $10,000 to $14,999 | 297 | 4.2% |
| $15,000 to $24,999 | 403 | 5.7% |
| $25,000 to $34,999 | 424 | 6.0% |
| $35,000 to $49,999 | 961 | 13.6% |
| $50,000 to $74,999 | 1,194 | 16.9% |
| $75,000 to $99,999 | 1,202 | 17.0% |
| $100,000 to $149,999 | 1,392 | 19.7% |
| $150,000 to $199,999 | 573 | 8.1% |
| $200,000+ | 438 | 6.2% |
Household Income by Householder Age in Delaware County
The median household income in Delaware County is $75,896, with the highest median household income of $93,313 found in the 25 to 44 years age bracket for the primary householder. A total of 1,873 households (26.5%) fall into this category. Meanwhile, the 15 to 24 years age bracket for the primary householder has the lowest median household income of $55,221, with 211 households (3.0%) in this group.
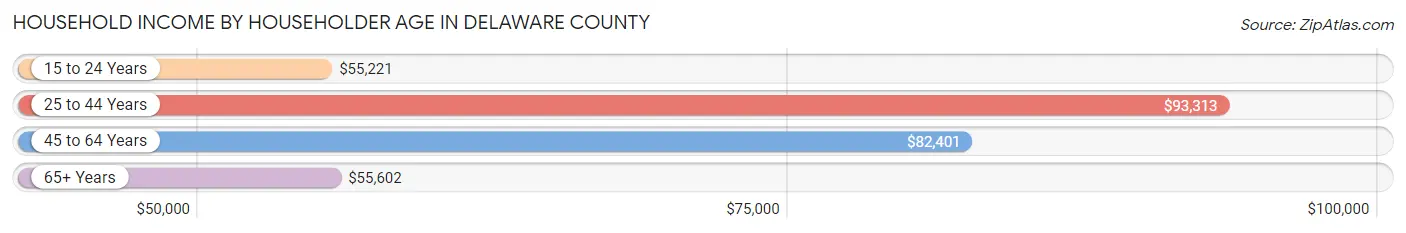
| Income Bracket | # Households | Median Income |
| 15 to 24 Years | 211 (3.0%) | $55,221 |
| 25 to 44 Years | 1,873 (26.5%) | $93,313 |
| 45 to 64 Years | 2,877 (40.7%) | $82,401 |
| 65+ Years | 2,107 (29.8%) | $55,602 |
| Total | 7,068 (100.0%) | $75,896 |
Poverty in Delaware County
Income Below Poverty by Sex and Age in Delaware County
With 5.1% poverty level for males and 8.3% for females among the residents of Delaware County, 16 and 17 year old males and 16 and 17 year old females are the most vulnerable to poverty, with 44 males (18.3%) and 35 females (17.3%) in their respective age groups living below the poverty level.
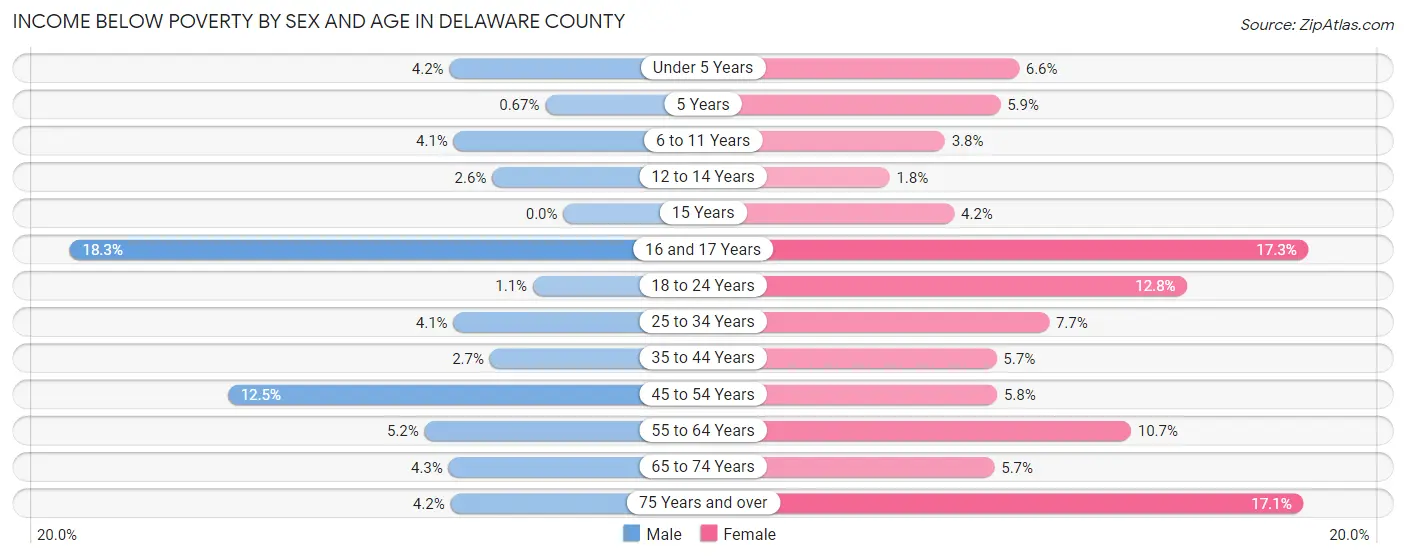
| Age Bracket | Male | Female |
| Under 5 Years | 23 (4.2%) | 36 (6.6%) |
| 5 Years | 1 (0.7%) | 2 (5.9%) |
| 6 to 11 Years | 28 (4.1%) | 25 (3.8%) |
| 12 to 14 Years | 11 (2.6%) | 7 (1.8%) |
| 15 Years | 0 (0.0%) | 6 (4.2%) |
| 16 and 17 Years | 44 (18.3%) | 35 (17.3%) |
| 18 to 24 Years | 8 (1.1%) | 77 (12.8%) |
| 25 to 34 Years | 34 (4.1%) | 59 (7.7%) |
| 35 to 44 Years | 28 (2.7%) | 53 (5.7%) |
| 45 to 54 Years | 130 (12.5%) | 56 (5.8%) |
| 55 to 64 Years | 75 (5.1%) | 156 (10.7%) |
| 65 to 74 Years | 42 (4.3%) | 55 (5.7%) |
| 75 Years and over | 27 (4.2%) | 134 (17.1%) |
| Total | 451 (5.1%) | 701 (8.3%) |
Income Above Poverty by Sex and Age in Delaware County
According to the poverty statistics in Delaware County, males aged 15 years and females aged 12 to 14 years are the age groups that are most secure financially, with 100.0% of males and 98.2% of females in these age groups living above the poverty line.
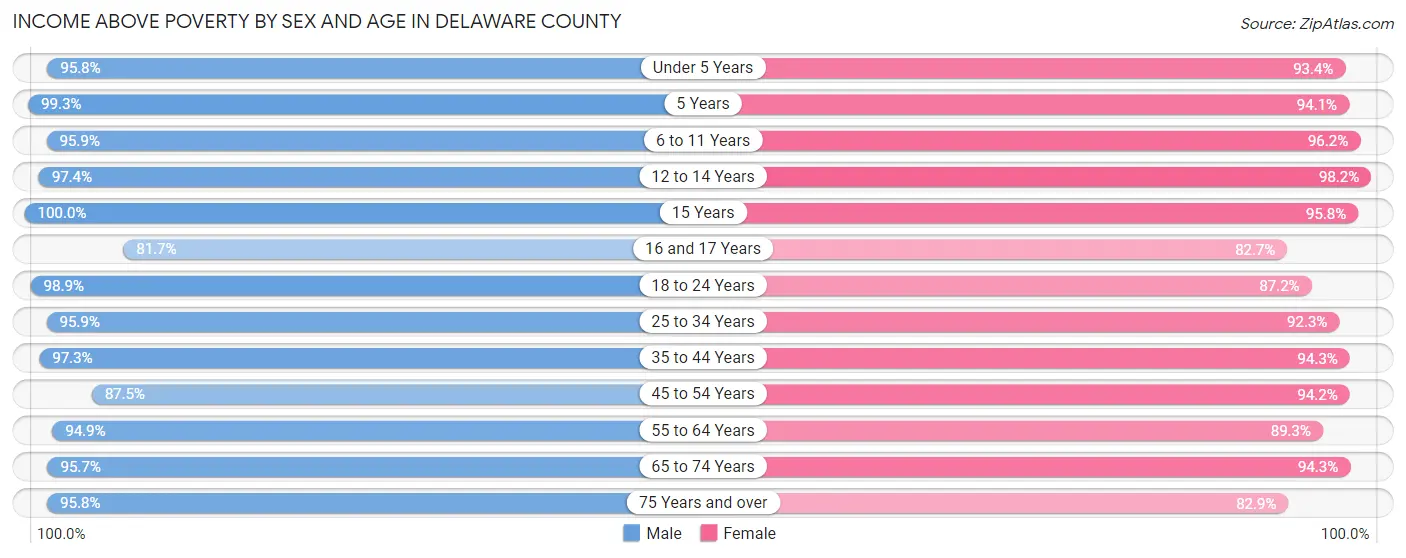
| Age Bracket | Male | Female |
| Under 5 Years | 521 (95.8%) | 512 (93.4%) |
| 5 Years | 149 (99.3%) | 32 (94.1%) |
| 6 to 11 Years | 660 (95.9%) | 630 (96.2%) |
| 12 to 14 Years | 405 (97.4%) | 388 (98.2%) |
| 15 Years | 154 (100.0%) | 138 (95.8%) |
| 16 and 17 Years | 196 (81.7%) | 167 (82.7%) |
| 18 to 24 Years | 701 (98.9%) | 523 (87.2%) |
| 25 to 34 Years | 799 (95.9%) | 708 (92.3%) |
| 35 to 44 Years | 998 (97.3%) | 871 (94.3%) |
| 45 to 54 Years | 913 (87.5%) | 917 (94.2%) |
| 55 to 64 Years | 1,382 (94.9%) | 1,298 (89.3%) |
| 65 to 74 Years | 945 (95.7%) | 917 (94.3%) |
| 75 Years and over | 618 (95.8%) | 648 (82.9%) |
| Total | 8,441 (94.9%) | 7,749 (91.7%) |
Income Below Poverty Among Married-Couple Families in Delaware County
The poverty statistics for married-couple families in Delaware County show that 2.7% or 113 of the total 4,179 families live below the poverty line. Families with no children have the highest poverty rate of 3.2%, comprising of 82 families. On the other hand, families with 5 or more children have the lowest poverty rate of 0.0%, which includes 0 families.
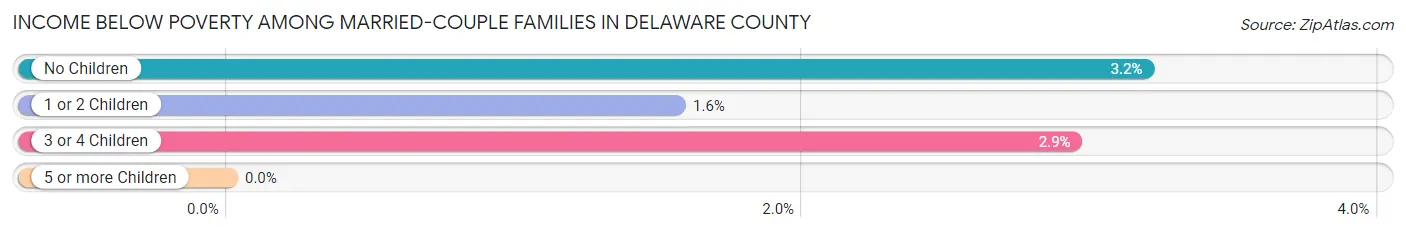
| Children | Above Poverty | Below Poverty |
| No Children | 2,487 (96.8%) | 82 (3.2%) |
| 1 or 2 Children | 1,138 (98.4%) | 18 (1.6%) |
| 3 or 4 Children | 429 (97.1%) | 13 (2.9%) |
| 5 or more Children | 12 (100.0%) | 0 (0.0%) |
| Total | 4,066 (97.3%) | 113 (2.7%) |
Income Below Poverty Among Single-Parent Households in Delaware County
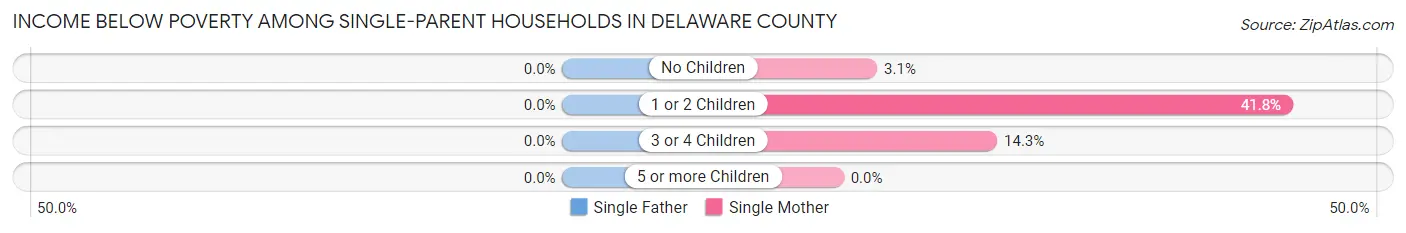
| Children | Single Father | Single Mother |
| No Children | 0 (0.0%) | 4 (3.1%) |
| 1 or 2 Children | 0 (0.0%) | 82 (41.8%) |
| 3 or 4 Children | 0 (0.0%) | 7 (14.3%) |
| 5 or more Children | 0 (0.0%) | 0 (0.0%) |
| Total | 0 (0.0%) | 93 (24.9%) |
Income Below Poverty Among Married-Couple vs Single-Parent Households in Delaware County
The poverty data for Delaware County shows that 113 of the married-couple family households (2.7%) and 93 of the single-parent households (15.4%) are living below the poverty level. Within the married-couple family households, those with no children have the highest poverty rate, with 82 households (3.2%) falling below the poverty line. Among the single-parent households, those with 1 or 2 children have the highest poverty rate, with 82 household (25.0%) living below poverty.
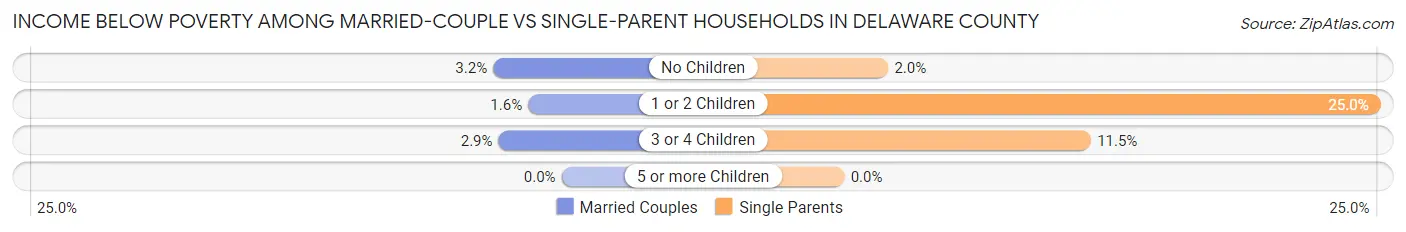
| Children | Married-Couple Families | Single-Parent Households |
| No Children | 82 (3.2%) | 4 (2.0%) |
| 1 or 2 Children | 18 (1.6%) | 82 (25.0%) |
| 3 or 4 Children | 13 (2.9%) | 7 (11.5%) |
| 5 or more Children | 0 (0.0%) | 0 (0.0%) |
| Total | 113 (2.7%) | 93 (15.4%) |
Race in Delaware County
The most populous races in Delaware County are White / Caucasian (16,799 | 95.9%), Two or more Races (510 | 2.9%), and Hispanic or Latino (282 | 1.6%).
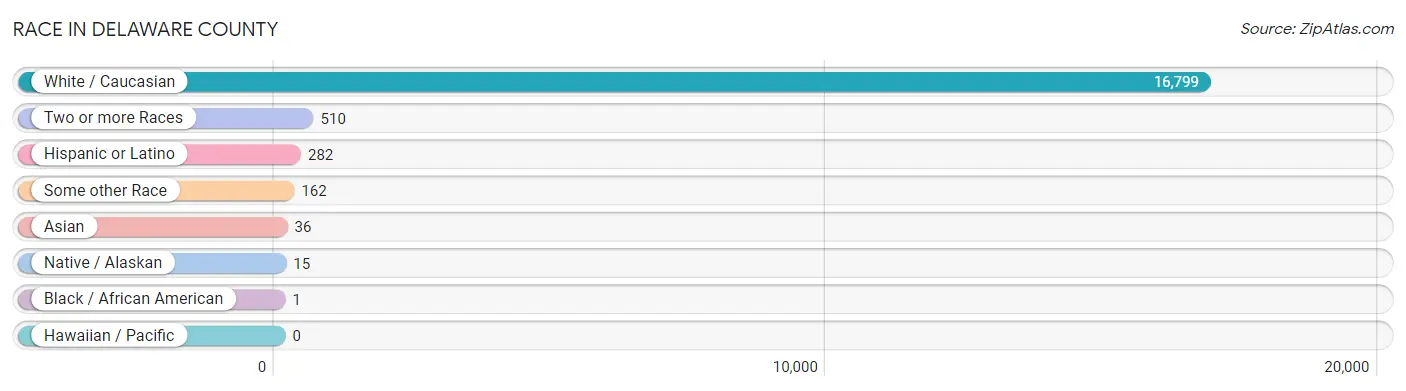
| Race | # Population | % Population |
| Asian | 36 | 0.2% |
| Black / African American | 1 | 0.0% |
| Hawaiian / Pacific | 0 | 0.0% |
| Hispanic or Latino | 282 | 1.6% |
| Native / Alaskan | 15 | 0.1% |
| White / Caucasian | 16,799 | 95.9% |
| Two or more Races | 510 | 2.9% |
| Some other Race | 162 | 0.9% |
| Total | 17,523 | 100.0% |
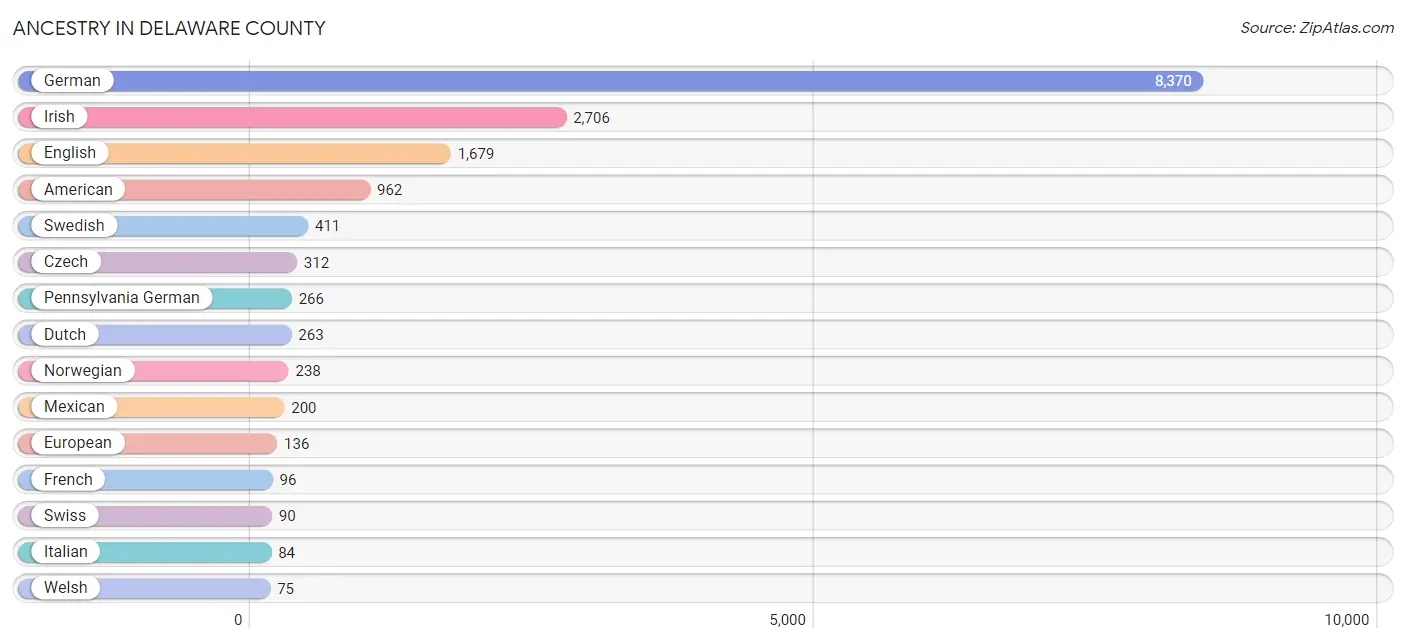
Ancestry in Delaware County
The most populous ancestries reported in Delaware County are German (8,370 | 47.8%), Irish (2,706 | 15.4%), English (1,679 | 9.6%), American (962 | 5.5%), and Swedish (411 | 2.4%), together accounting for 80.6% of all Delaware County residents.
| Ancestry | # Population | % Population |
| American | 962 | 5.5% |
| Arab | 60 | 0.3% |
| Belgian | 2 | 0.0% |
| Bhutanese | 43 | 0.3% |
| Blackfeet | 2 | 0.0% |
| Brazilian | 2 | 0.0% |
| British | 9 | 0.1% |
| Burmese | 5 | 0.0% |
| Central American | 31 | 0.2% |
| Cherokee | 17 | 0.1% |
| Czech | 312 | 1.8% |
| Czechoslovakian | 19 | 0.1% |
| Danish | 47 | 0.3% |
| Dutch | 263 | 1.5% |
| Eastern European | 6 | 0.0% |
| English | 1,679 | 9.6% |
| European | 136 | 0.8% |
| French | 96 | 0.5% |
| French Canadian | 14 | 0.1% |
| German | 8,370 | 47.8% |
| Greek | 18 | 0.1% |
| Guatemalan | 31 | 0.2% |
| Iranian | 2 | 0.0% |
| Irish | 2,706 | 15.4% |
| Italian | 84 | 0.5% |
| Jamaican | 48 | 0.3% |
| Korean | 34 | 0.2% |
| Lebanese | 60 | 0.3% |
| Luxembourger | 74 | 0.4% |
| Mexican | 200 | 1.1% |
| Northern European | 6 | 0.0% |
| Norwegian | 238 | 1.4% |
| Pakistani | 2 | 0.0% |
| Pennsylvania German | 266 | 1.5% |
| Polish | 55 | 0.3% |
| Portuguese | 4 | 0.0% |
| Puerto Rican | 18 | 0.1% |
| Scandinavian | 3 | 0.0% |
| Scotch-Irish | 18 | 0.1% |
| Scottish | 72 | 0.4% |
| Seminole | 2 | 0.0% |
| Sioux | 24 | 0.1% |
| Spaniard | 6 | 0.0% |
| Spanish | 11 | 0.1% |
| Swedish | 411 | 2.4% |
| Swiss | 90 | 0.5% |
| Welsh | 75 | 0.4% |
| Yugoslavian | 15 | 0.1% | View All 48 Rows |
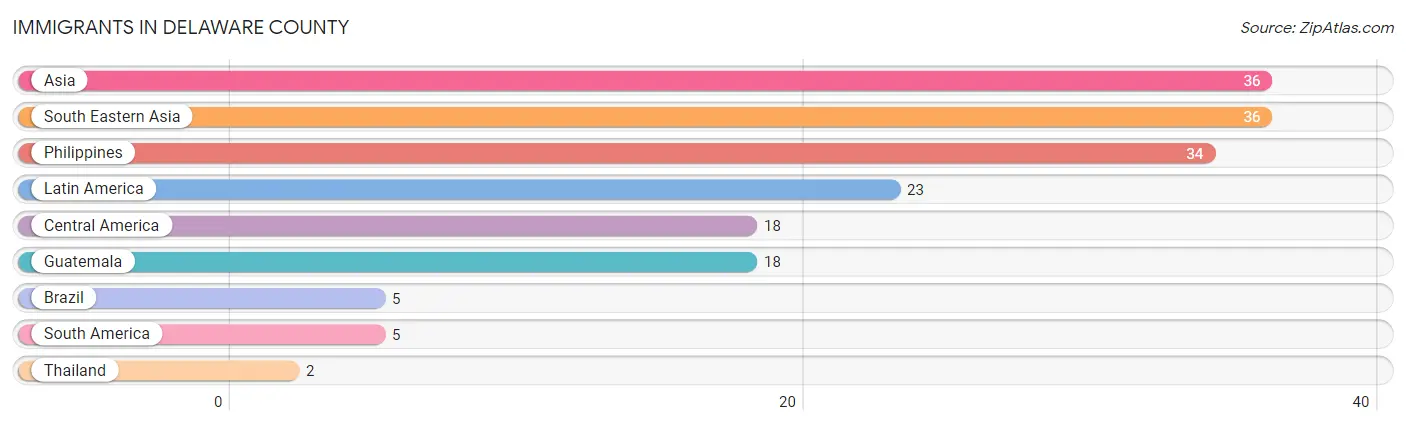
Immigrants in Delaware County
The most numerous immigrant groups reported in Delaware County came from Asia (36 | 0.2%), South Eastern Asia (36 | 0.2%), Philippines (34 | 0.2%), Latin America (23 | 0.1%), and Central America (18 | 0.1%), together accounting for 0.8% of all Delaware County residents.
| Immigration Origin | # Population | % Population |
| Asia | 36 | 0.2% |
| Brazil | 5 | 0.0% |
| Central America | 18 | 0.1% |
| Guatemala | 18 | 0.1% |
| Latin America | 23 | 0.1% |
| Philippines | 34 | 0.2% |
| South America | 5 | 0.0% |
| South Eastern Asia | 36 | 0.2% |
| Thailand | 2 | 0.0% | View All 9 Rows |
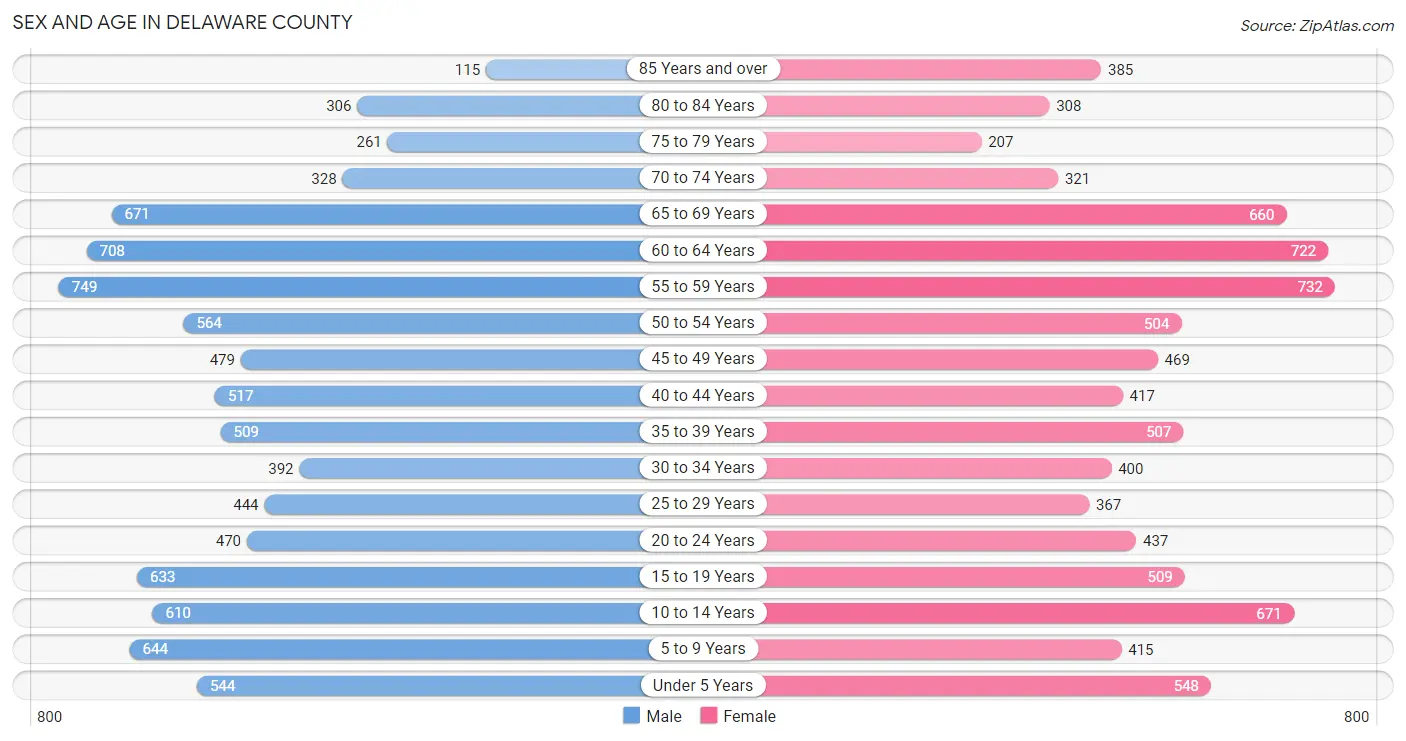
Sex and Age in Delaware County
Sex and Age in Delaware County
The most populous age groups in Delaware County are 55 to 59 Years (749 | 8.4%) for men and 55 to 59 Years (732 | 8.5%) for women.
| Age Bracket | Male | Female |
| Under 5 Years | 544 (6.1%) | 548 (6.4%) |
| 5 to 9 Years | 644 (7.2%) | 415 (4.8%) |
| 10 to 14 Years | 610 (6.8%) | 671 (7.8%) |
| 15 to 19 Years | 633 (7.1%) | 509 (5.9%) |
| 20 to 24 Years | 470 (5.2%) | 437 (5.1%) |
| 25 to 29 Years | 444 (5.0%) | 367 (4.3%) |
| 30 to 34 Years | 392 (4.4%) | 400 (4.7%) |
| 35 to 39 Years | 509 (5.7%) | 507 (5.9%) |
| 40 to 44 Years | 517 (5.8%) | 417 (4.9%) |
| 45 to 49 Years | 479 (5.4%) | 469 (5.5%) |
| 50 to 54 Years | 564 (6.3%) | 504 (5.9%) |
| 55 to 59 Years | 749 (8.4%) | 732 (8.5%) |
| 60 to 64 Years | 708 (7.9%) | 722 (8.4%) |
| 65 to 69 Years | 671 (7.5%) | 660 (7.7%) |
| 70 to 74 Years | 328 (3.7%) | 321 (3.7%) |
| 75 to 79 Years | 261 (2.9%) | 207 (2.4%) |
| 80 to 84 Years | 306 (3.4%) | 308 (3.6%) |
| 85 Years and over | 115 (1.3%) | 385 (4.5%) |
| Total | 8,944 (100.0%) | 8,579 (100.0%) |
Families and Households in Delaware County
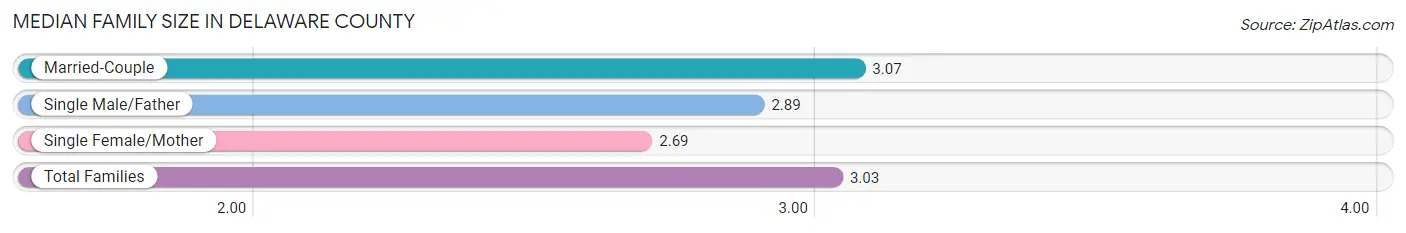
Median Family Size in Delaware County
The median family size in Delaware County is 3.03 persons per family, with married-couple families (4,179 | 87.4%) accounting for the largest median family size of 3.07 persons per family. On the other hand, single female/mother families (373 | 7.8%) represent the smallest median family size with 2.69 persons per family.
| Family Type | # Families | Family Size |
| Married-Couple | 4,179 (87.4%) | 3.07 |
| Single Male/Father | 231 (4.8%) | 2.89 |
| Single Female/Mother | 373 (7.8%) | 2.69 |
| Total Families | 4,783 (100.0%) | 3.03 |
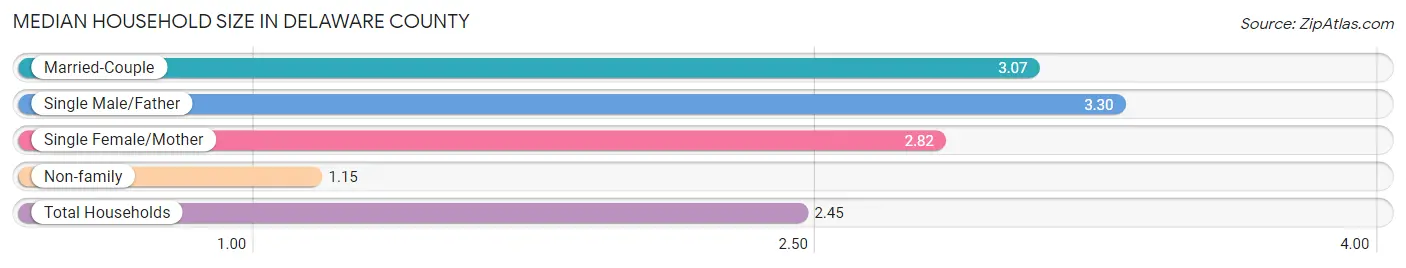
Median Household Size in Delaware County
The median household size in Delaware County is 2.45 persons per household, with single male/father households (231 | 3.3%) accounting for the largest median household size of 3.3 persons per household. non-family households (2,285 | 32.3%) represent the smallest median household size with 1.15 persons per household.
| Household Type | # Households | Household Size |
| Married-Couple | 4,179 (59.1%) | 3.07 |
| Single Male/Father | 231 (3.3%) | 3.30 |
| Single Female/Mother | 373 (5.3%) | 2.82 |
| Non-family | 2,285 (32.3%) | 1.15 |
| Total Households | 7,068 (100.0%) | 2.45 |
Household Size by Marriage Status in Delaware County
Out of a total of 7,068 households in Delaware County, 4,783 (67.7%) are family households, while 2,285 (32.3%) are nonfamily households. The most numerous type of family households are 2-person households, comprising 2,482, and the most common type of nonfamily households are 1-person households, comprising 1,911.
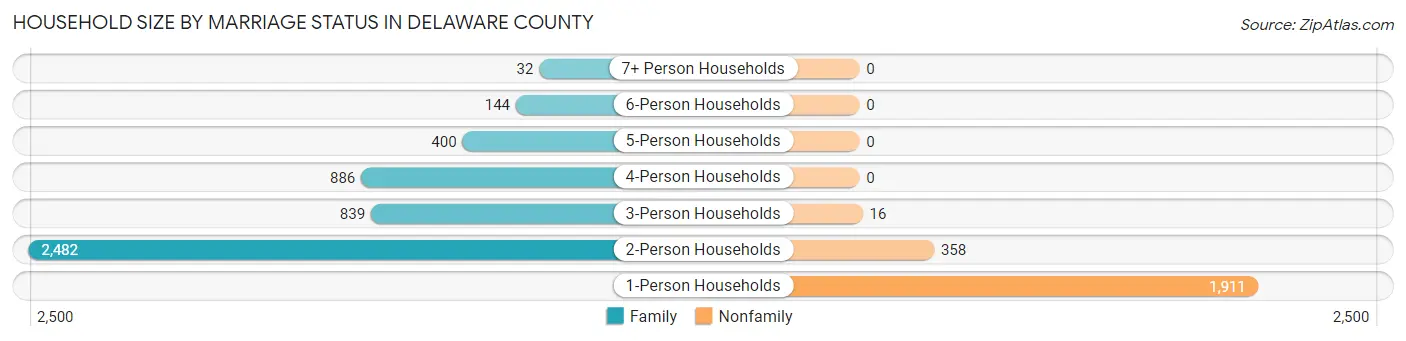
| Household Size | Family Households | Nonfamily Households |
| 1-Person Households | - | 1,911 (27.0%) |
| 2-Person Households | 2,482 (35.1%) | 358 (5.1%) |
| 3-Person Households | 839 (11.9%) | 16 (0.2%) |
| 4-Person Households | 886 (12.5%) | 0 (0.0%) |
| 5-Person Households | 400 (5.7%) | 0 (0.0%) |
| 6-Person Households | 144 (2.0%) | 0 (0.0%) |
| 7+ Person Households | 32 (0.4%) | 0 (0.0%) |
| Total | 4,783 (67.7%) | 2,285 (32.3%) |
Female Fertility in Delaware County
Fertility by Age in Delaware County
Average fertility rate in Delaware County is 54.0 births per 1,000 women. Women in the age bracket of 20 to 34 years have the highest fertility rate with 134.0 births per 1,000 women. Women in the age bracket of 20 to 34 years acount for 94.7% of all women with births.
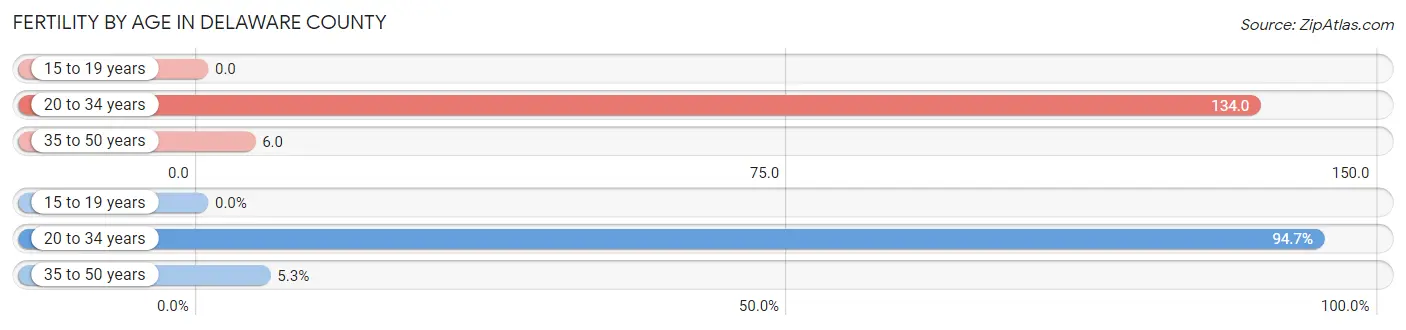
| Age Bracket | Women with Births | Births / 1,000 Women |
| 15 to 19 years | 0 (0.0%) | 0.0 |
| 20 to 34 years | 161 (94.7%) | 134.0 |
| 35 to 50 years | 9 (5.3%) | 6.0 |
| Total | 170 (100.0%) | 54.0 |
Fertility by Age by Marriage Status in Delaware County
90.6% of women with births (170) in Delaware County are married. The highest percentage of unmarried women with births falls into 20 to 34 years age bracket with 9.9% of them unmarried at the time of birth, while the lowest percentage of unmarried women with births belong to 35 to 50 years age bracket with 0.0% of them unmarried.
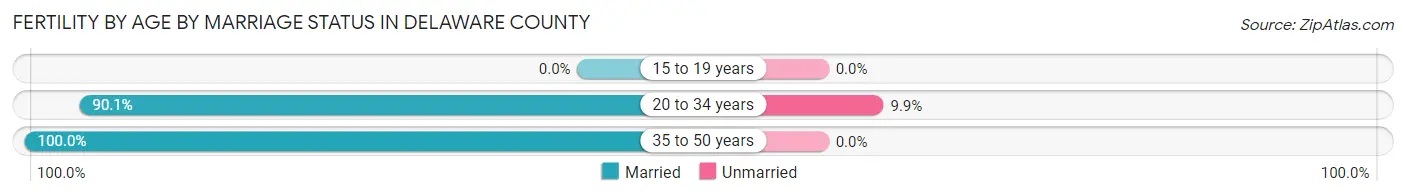
| Age Bracket | Married | Unmarried |
| 15 to 19 years | 0 (0.0%) | 0 (0.0%) |
| 20 to 34 years | 145 (90.1%) | 16 (9.9%) |
| 35 to 50 years | 9 (100.0%) | 0 (0.0%) |
| Total | 154 (90.6%) | 16 (9.4%) |
Fertility by Education in Delaware County
Average fertility rate in Delaware County is 54.0 births per 1,000 women. Women with the education attainment of bachelor's degree have the highest fertility rate of 143.0 births per 1,000 women, while women with the education attainment of graduate degree have the lowest fertility at 24.0 births per 1,000 women. Women with the education attainment of bachelor's degree represent 41.8% of all women with births.
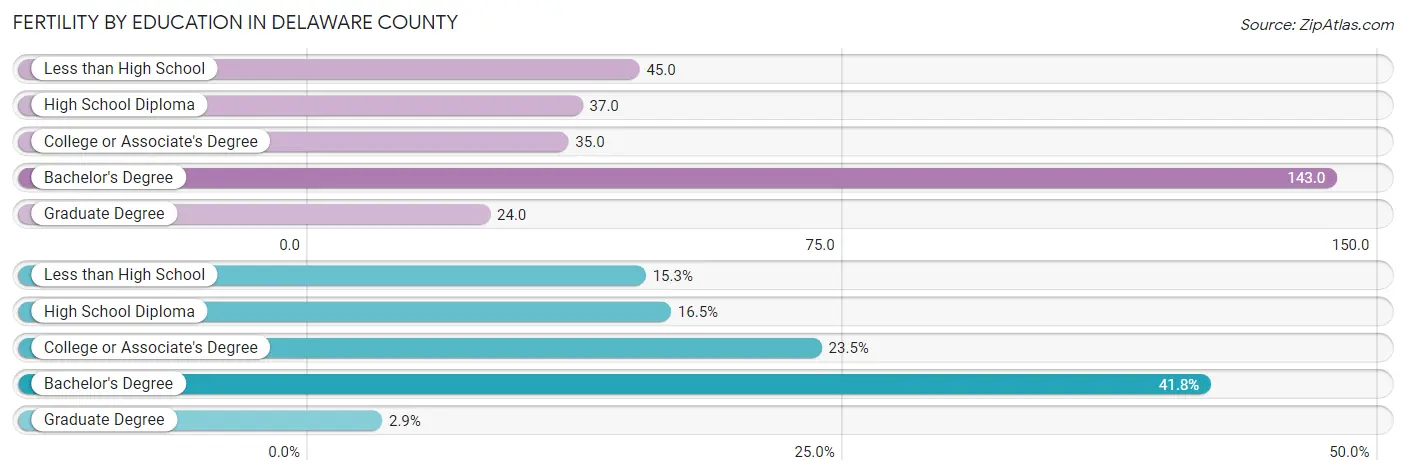
| Educational Attainment | Women with Births | Births / 1,000 Women |
| Less than High School | 26 (15.3%) | 45.0 |
| High School Diploma | 28 (16.5%) | 37.0 |
| College or Associate's Degree | 40 (23.5%) | 35.0 |
| Bachelor's Degree | 71 (41.8%) | 143.0 |
| Graduate Degree | 5 (2.9%) | 24.0 |
| Total | 170 (100.0%) | 54.0 |
Fertility by Education by Marriage Status in Delaware County
9.4% of women with births in Delaware County are unmarried. Women with the educational attainment of less than high school are most likely to be married with 100.0% of them married at childbirth, while women with the educational attainment of high school diploma are least likely to be married with 39.3% of them unmarried at childbirth.
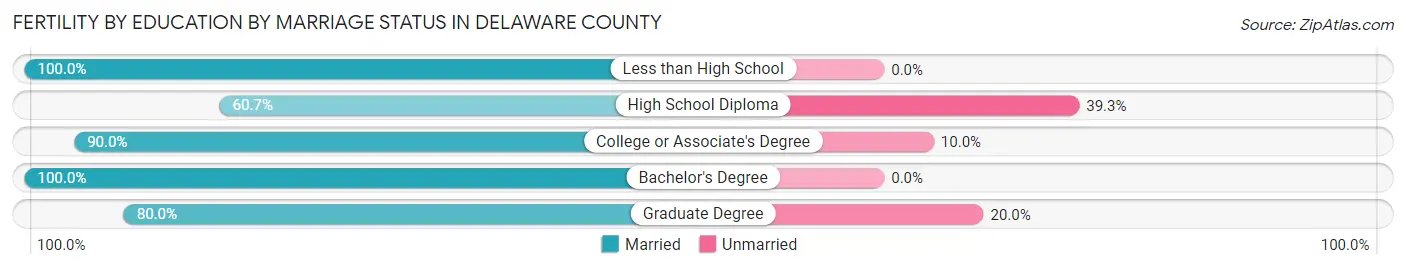
| Educational Attainment | Married | Unmarried |
| Less than High School | 26 (100.0%) | 0 (0.0%) |
| High School Diploma | 17 (60.7%) | 11 (39.3%) |
| College or Associate's Degree | 36 (90.0%) | 4 (10.0%) |
| Bachelor's Degree | 71 (100.0%) | 0 (0.0%) |
| Graduate Degree | 4 (80.0%) | 1 (20.0%) |
| Total | 154 (90.6%) | 16 (9.4%) |
Employment Characteristics in Delaware County
Employment by Class of Employer in Delaware County
Among the 9,504 employed individuals in Delaware County, private company employees (5,907 | 62.2%), self-employed (not incorporated) (1,338 | 14.1%), and local government employees (712 | 7.5%) make up the most common classes of employment.
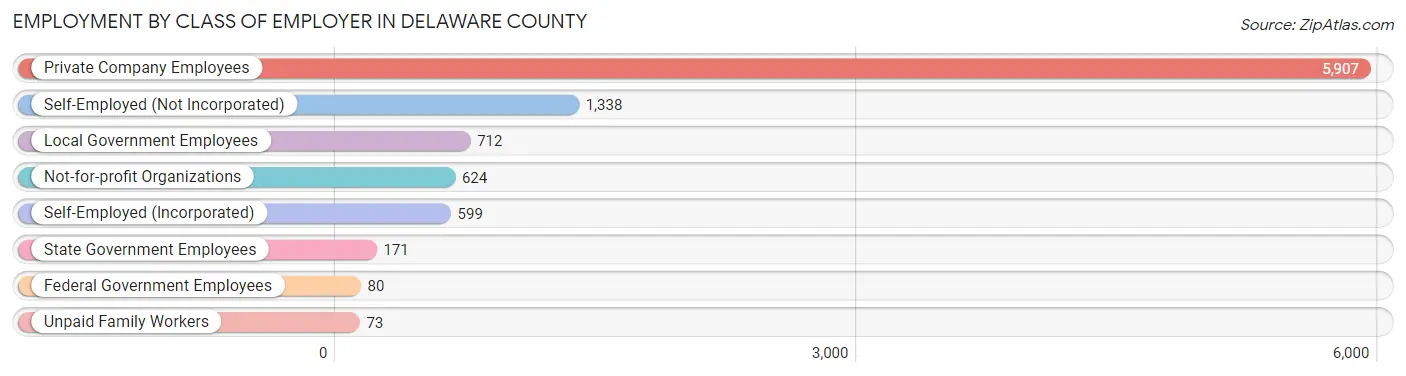
| Employer Class | # Employees | % Employees |
| Private Company Employees | 5,907 | 62.2% |
| Self-Employed (Incorporated) | 599 | 6.3% |
| Self-Employed (Not Incorporated) | 1,338 | 14.1% |
| Not-for-profit Organizations | 624 | 6.6% |
| Local Government Employees | 712 | 7.5% |
| State Government Employees | 171 | 1.8% |
| Federal Government Employees | 80 | 0.8% |
| Unpaid Family Workers | 73 | 0.8% |
| Total | 9,504 | 100.0% |
Employment Status by Age in Delaware County
According to the labor force statistics for Delaware County, out of the total population over 16 years of age (13,793), 71.1% or 9,807 individuals are in the labor force, with 2.2% or 216 of them unemployed. The age group with the highest labor force participation rate is 45 to 54 years, with 94.4% or 1,903 individuals in the labor force. Within the labor force, the 20 to 24 years age range has the highest percentage of unemployed individuals, with 16.1% or 128 of them being unemployed.
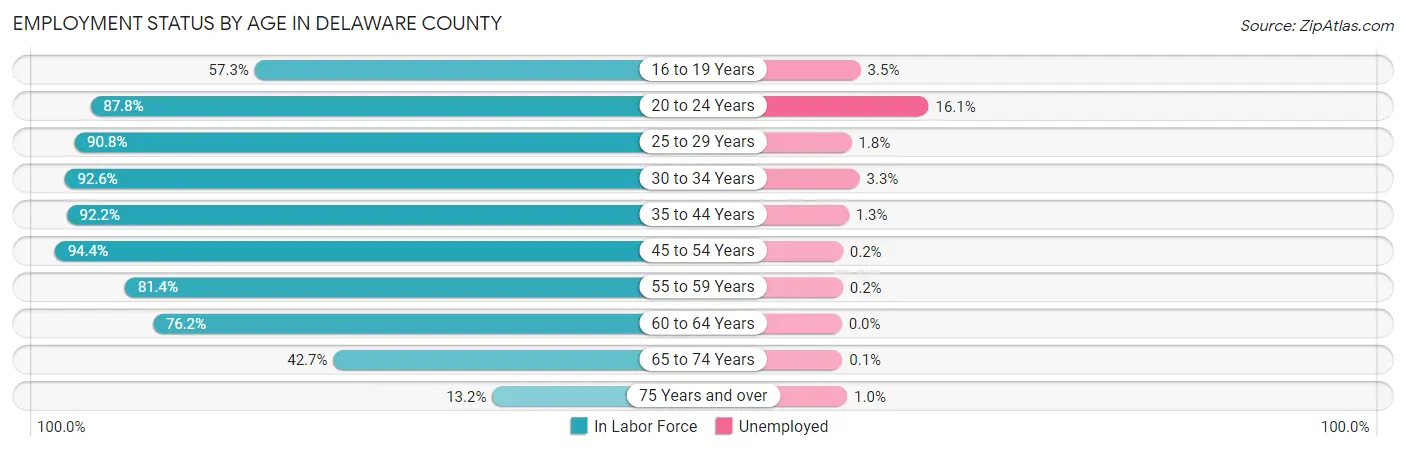
| Age Bracket | In Labor Force | Unemployed |
| 16 to 19 Years | 484 (57.3%) | 17 (3.5%) |
| 20 to 24 Years | 796 (87.8%) | 128 (16.1%) |
| 25 to 29 Years | 736 (90.8%) | 13 (1.8%) |
| 30 to 34 Years | 733 (92.6%) | 24 (3.3%) |
| 35 to 44 Years | 1,798 (92.2%) | 23 (1.3%) |
| 45 to 54 Years | 1,903 (94.4%) | 4 (0.2%) |
| 55 to 59 Years | 1,206 (81.4%) | 2 (0.2%) |
| 60 to 64 Years | 1,090 (76.2%) | 0 (0.0%) |
| 65 to 74 Years | 845 (42.7%) | 1 (0.1%) |
| 75 Years and over | 209 (13.2%) | 2 (1.0%) |
| Total | 9,807 (71.1%) | 216 (2.2%) |
Employment Status by Educational Attainment in Delaware County
According to labor force statistics for Delaware County, 88.1% of individuals (7,471) out of the total population between 25 and 64 years of age (8,480) are in the labor force, with 0.9% or 67 of them being unemployed. The group with the highest labor force participation rate are those with the educational attainment of college / associate degree, with 92.1% or 2,754 individuals in the labor force. Within the labor force, individuals with high school diploma education have the highest percentage of unemployment, with 1.7% or 48 of them being unemployed.
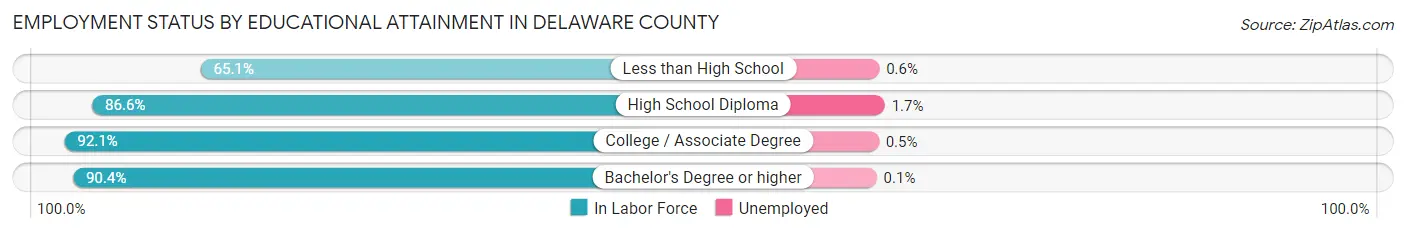
| Educational Attainment | In Labor Force | Unemployed |
| Less than High School | 329 (65.1%) | 3 (0.6%) |
| High School Diploma | 2,797 (86.6%) | 55 (1.7%) |
| College / Associate Degree | 2,754 (92.1%) | 15 (0.5%) |
| Bachelor's Degree or higher | 1,587 (90.4%) | 2 (0.1%) |
| Total | 7,471 (88.1%) | 76 (0.9%) |
Employment Occupations by Sex in Delaware County
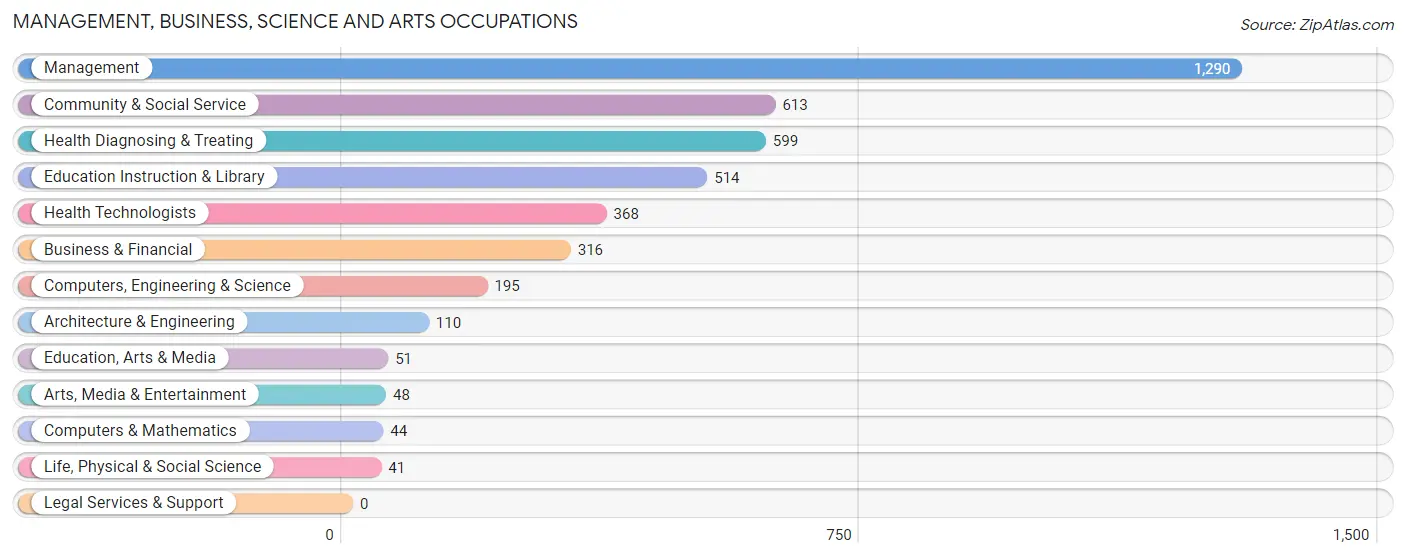
Management, Business, Science and Arts Occupations
The most common Management, Business, Science and Arts occupations in Delaware County are Management (1,290 | 13.5%), Community & Social Service (613 | 6.4%), Health Diagnosing & Treating (599 | 6.2%), Education Instruction & Library (514 | 5.4%), and Health Technologists (368 | 3.8%).
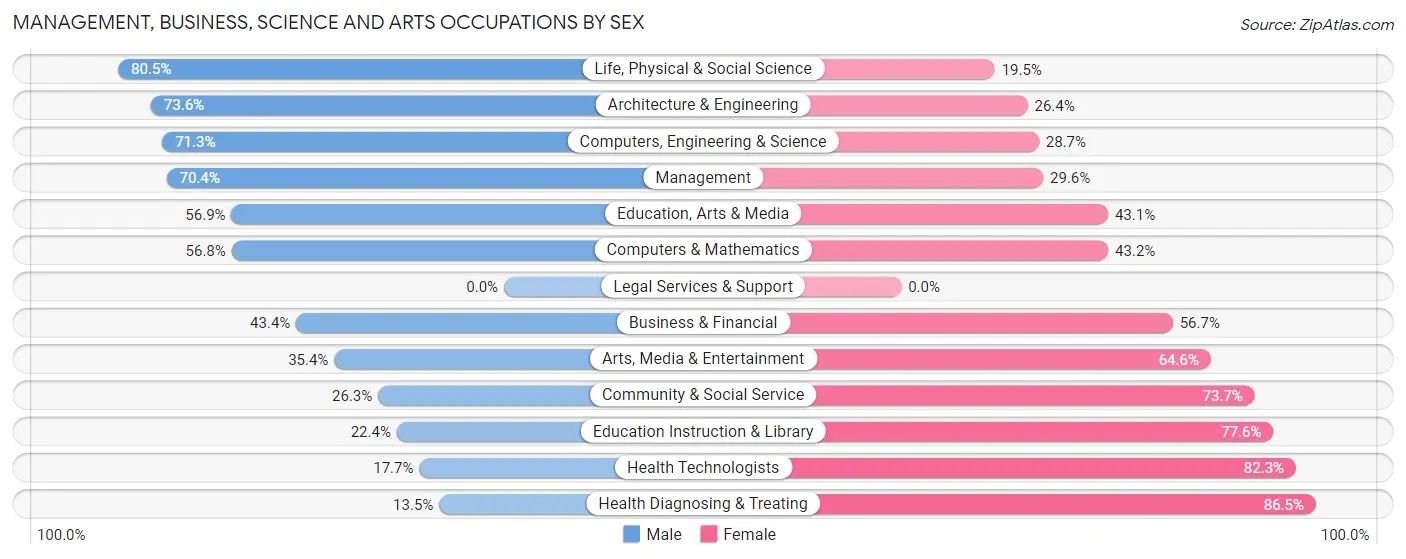
Management, Business, Science and Arts Occupations by Sex
Within the Management, Business, Science and Arts occupations in Delaware County, the most male-oriented occupations are Life, Physical & Social Science (80.5%), Architecture & Engineering (73.6%), and Computers, Engineering & Science (71.3%), while the most female-oriented occupations are Health Diagnosing & Treating (86.5%), Health Technologists (82.3%), and Education Instruction & Library (77.6%).
| Occupation | Male | Female |
| Management | 908 (70.4%) | 382 (29.6%) |
| Business & Financial | 137 (43.3%) | 179 (56.7%) |
| Computers, Engineering & Science | 139 (71.3%) | 56 (28.7%) |
| Computers & Mathematics | 25 (56.8%) | 19 (43.2%) |
| Architecture & Engineering | 81 (73.6%) | 29 (26.4%) |
| Life, Physical & Social Science | 33 (80.5%) | 8 (19.5%) |
| Community & Social Service | 161 (26.3%) | 452 (73.7%) |
| Education, Arts & Media | 29 (56.9%) | 22 (43.1%) |
| Legal Services & Support | 0 (0.0%) | 0 (0.0%) |
| Education Instruction & Library | 115 (22.4%) | 399 (77.6%) |
| Arts, Media & Entertainment | 17 (35.4%) | 31 (64.6%) |
| Health Diagnosing & Treating | 81 (13.5%) | 518 (86.5%) |
| Health Technologists | 65 (17.7%) | 303 (82.3%) |
| Total (Category) | 1,426 (47.3%) | 1,587 (52.7%) |
| Total (Overall) | 5,167 (53.9%) | 4,419 (46.1%) |
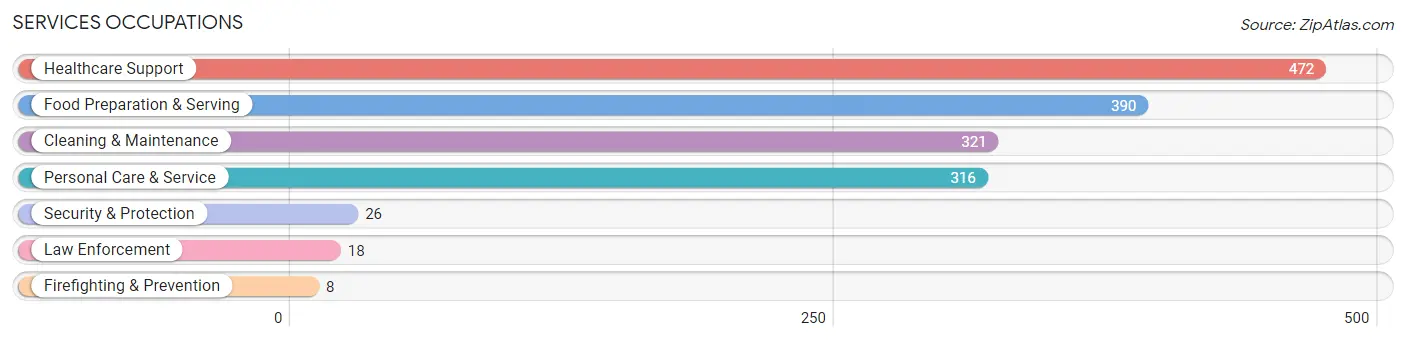
Services Occupations
The most common Services occupations in Delaware County are Healthcare Support (472 | 4.9%), Food Preparation & Serving (390 | 4.1%), Cleaning & Maintenance (321 | 3.4%), Personal Care & Service (316 | 3.3%), and Security & Protection (26 | 0.3%).
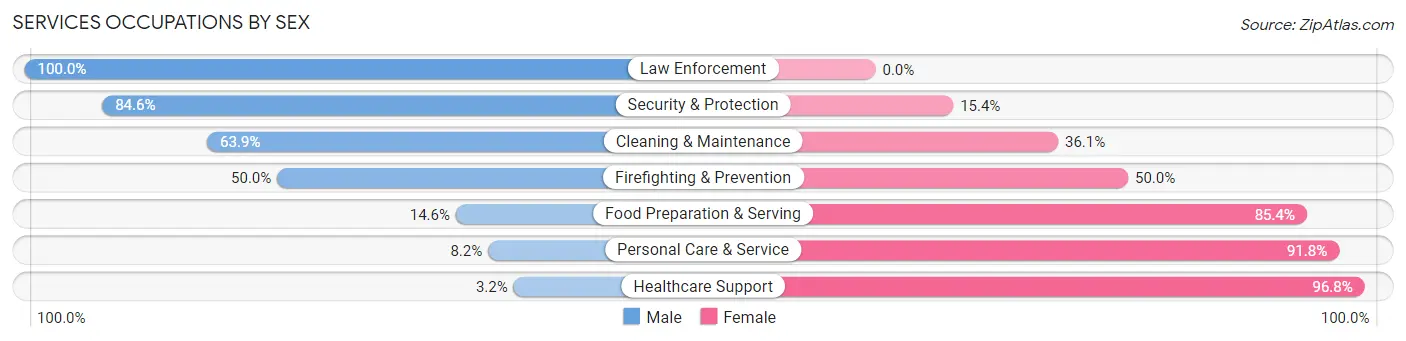
Services Occupations by Sex
Within the Services occupations in Delaware County, the most male-oriented occupations are Law Enforcement (100.0%), Security & Protection (84.6%), and Cleaning & Maintenance (63.9%), while the most female-oriented occupations are Healthcare Support (96.8%), Personal Care & Service (91.8%), and Food Preparation & Serving (85.4%).
| Occupation | Male | Female |
| Healthcare Support | 15 (3.2%) | 457 (96.8%) |
| Security & Protection | 22 (84.6%) | 4 (15.4%) |
| Firefighting & Prevention | 4 (50.0%) | 4 (50.0%) |
| Law Enforcement | 18 (100.0%) | 0 (0.0%) |
| Food Preparation & Serving | 57 (14.6%) | 333 (85.4%) |
| Cleaning & Maintenance | 205 (63.9%) | 116 (36.1%) |
| Personal Care & Service | 26 (8.2%) | 290 (91.8%) |
| Total (Category) | 325 (21.3%) | 1,200 (78.7%) |
| Total (Overall) | 5,167 (53.9%) | 4,419 (46.1%) |
Sales and Office Occupations
The most common Sales and Office occupations in Delaware County are Office & Administration (986 | 10.3%), and Sales & Related (679 | 7.1%).
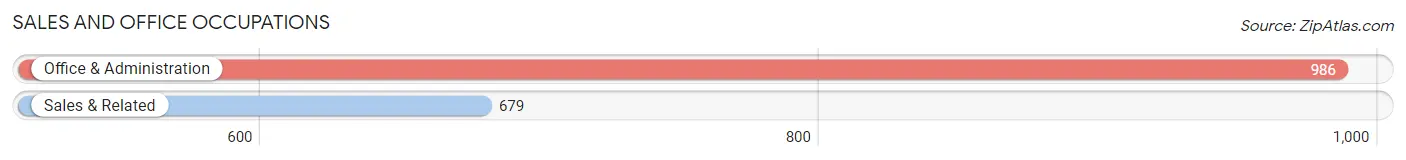
Sales and Office Occupations by Sex

| Occupation | Male | Female |
| Sales & Related | 324 (47.7%) | 355 (52.3%) |
| Office & Administration | 166 (16.8%) | 820 (83.2%) |
| Total (Category) | 490 (29.4%) | 1,175 (70.6%) |
| Total (Overall) | 5,167 (53.9%) | 4,419 (46.1%) |
Natural Resources, Construction and Maintenance Occupations
The most common Natural Resources, Construction and Maintenance occupations in Delaware County are Construction & Extraction (681 | 7.1%), Installation, Maintenance & Repair (322 | 3.4%), and Farming, Fishing & Forestry (232 | 2.4%).

Natural Resources, Construction and Maintenance Occupations by Sex

| Occupation | Male | Female |
| Farming, Fishing & Forestry | 213 (91.8%) | 19 (8.2%) |
| Construction & Extraction | 635 (93.2%) | 46 (6.8%) |
| Installation, Maintenance & Repair | 317 (98.5%) | 5 (1.5%) |
| Total (Category) | 1,165 (94.3%) | 70 (5.7%) |
| Total (Overall) | 5,167 (53.9%) | 4,419 (46.1%) |
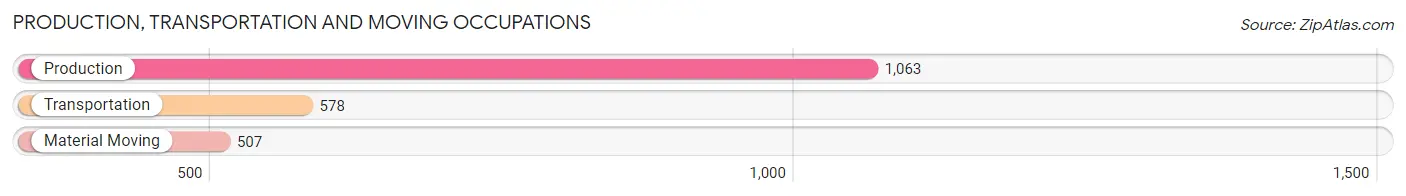
Production, Transportation and Moving Occupations
The most common Production, Transportation and Moving occupations in Delaware County are Production (1,063 | 11.1%), Transportation (578 | 6.0%), and Material Moving (507 | 5.3%).
Production, Transportation and Moving Occupations by Sex
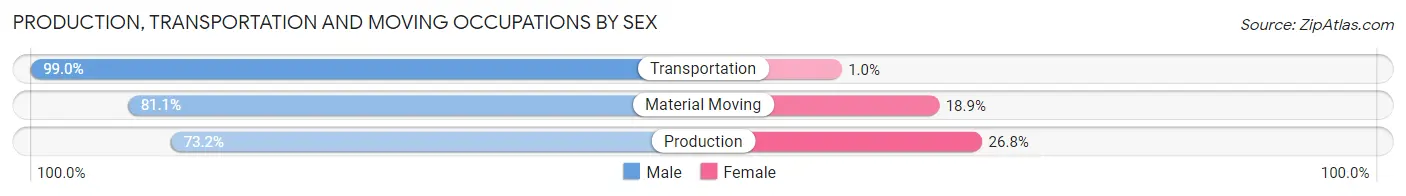
| Occupation | Male | Female |
| Production | 778 (73.2%) | 285 (26.8%) |
| Transportation | 572 (99.0%) | 6 (1.0%) |
| Material Moving | 411 (81.1%) | 96 (18.9%) |
| Total (Category) | 1,761 (82.0%) | 387 (18.0%) |
| Total (Overall) | 5,167 (53.9%) | 4,419 (46.1%) |
Employment Industries by Sex in Delaware County
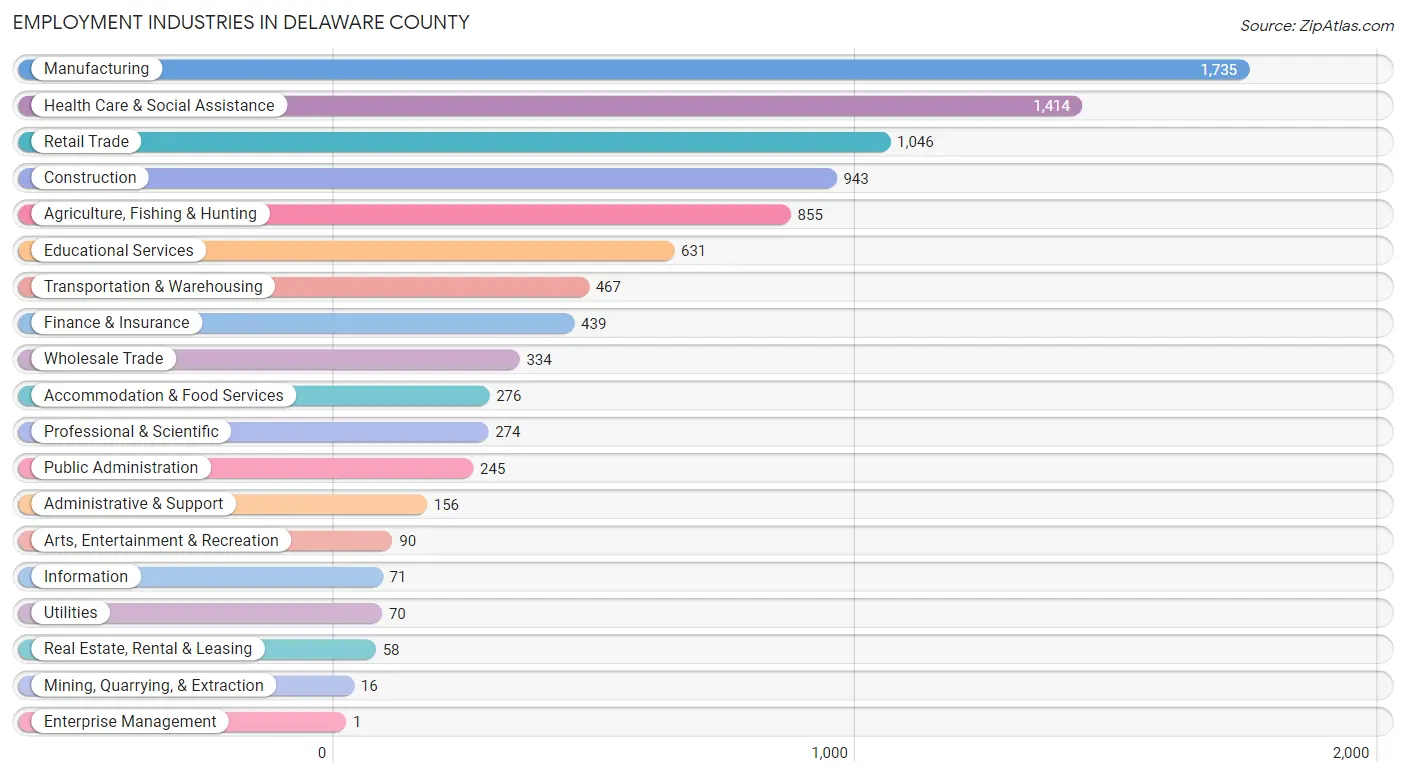
Employment Industries in Delaware County
The major employment industries in Delaware County include Manufacturing (1,735 | 18.1%), Health Care & Social Assistance (1,414 | 14.7%), Retail Trade (1,046 | 10.9%), Construction (943 | 9.8%), and Agriculture, Fishing & Hunting (855 | 8.9%).
Employment Industries by Sex in Delaware County
The Delaware County industries that see more men than women are Transportation & Warehousing (93.8%), Construction (90.9%), and Agriculture, Fishing & Hunting (90.3%), whereas the industries that tend to have a higher number of women are Enterprise Management (100.0%), Health Care & Social Assistance (93.6%), and Information (84.5%).
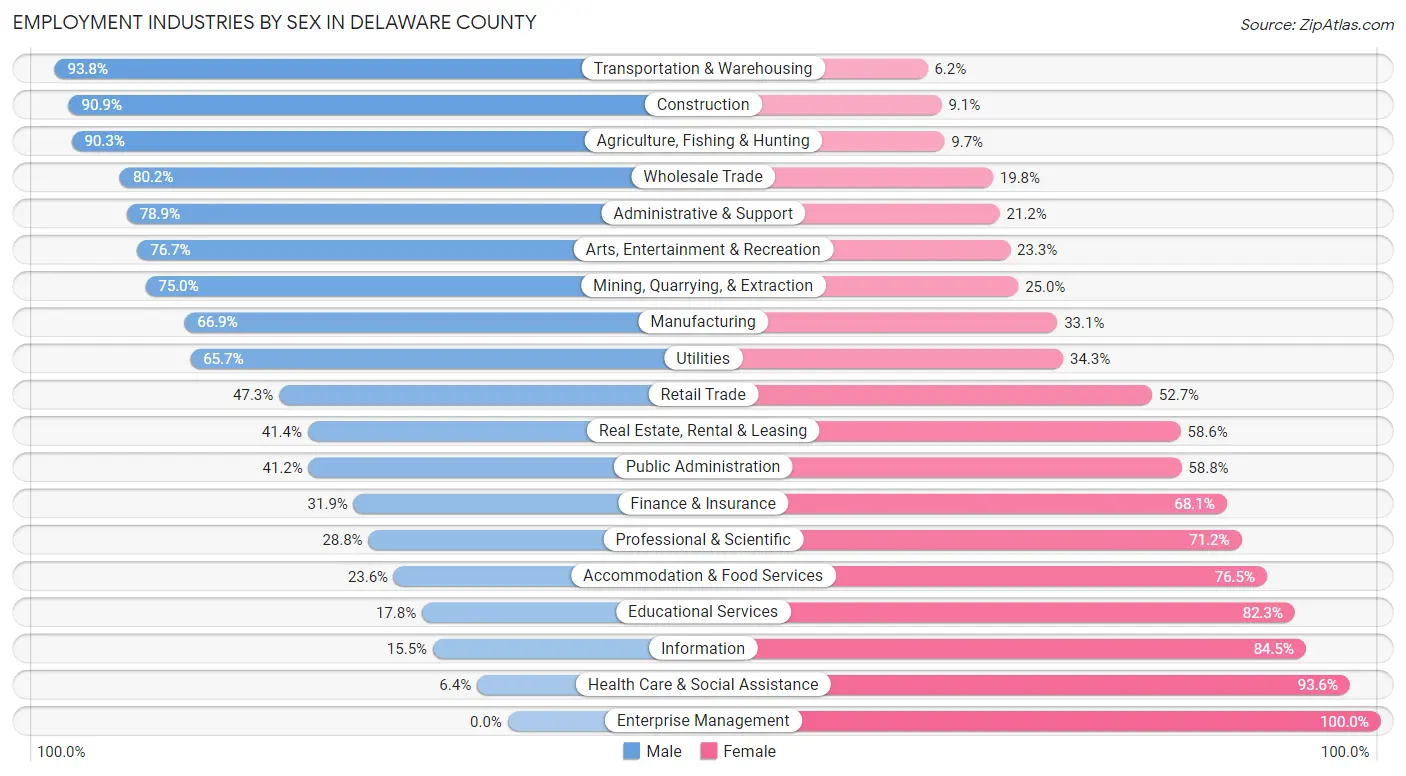
| Industry | Male | Female |
| Agriculture, Fishing & Hunting | 772 (90.3%) | 83 (9.7%) |
| Mining, Quarrying, & Extraction | 12 (75.0%) | 4 (25.0%) |
| Construction | 857 (90.9%) | 86 (9.1%) |
| Manufacturing | 1,161 (66.9%) | 574 (33.1%) |
| Wholesale Trade | 268 (80.2%) | 66 (19.8%) |
| Retail Trade | 495 (47.3%) | 551 (52.7%) |
| Transportation & Warehousing | 438 (93.8%) | 29 (6.2%) |
| Utilities | 46 (65.7%) | 24 (34.3%) |
| Information | 11 (15.5%) | 60 (84.5%) |
| Finance & Insurance | 140 (31.9%) | 299 (68.1%) |
| Real Estate, Rental & Leasing | 24 (41.4%) | 34 (58.6%) |
| Professional & Scientific | 79 (28.8%) | 195 (71.2%) |
| Enterprise Management | 0 (0.0%) | 1 (100.0%) |
| Administrative & Support | 123 (78.8%) | 33 (21.1%) |
| Educational Services | 112 (17.7%) | 519 (82.3%) |
| Health Care & Social Assistance | 90 (6.4%) | 1,324 (93.6%) |
| Arts, Entertainment & Recreation | 69 (76.7%) | 21 (23.3%) |
| Accommodation & Food Services | 65 (23.5%) | 211 (76.4%) |
| Public Administration | 101 (41.2%) | 144 (58.8%) |
| Total | 5,167 (53.9%) | 4,419 (46.1%) |
Education in Delaware County
School Enrollment in Delaware County
The most common levels of schooling among the 3,818 students in Delaware County are high school (1,050 | 27.5%), middle school (1,040 | 27.2%), and elementary school (901 | 23.6%).
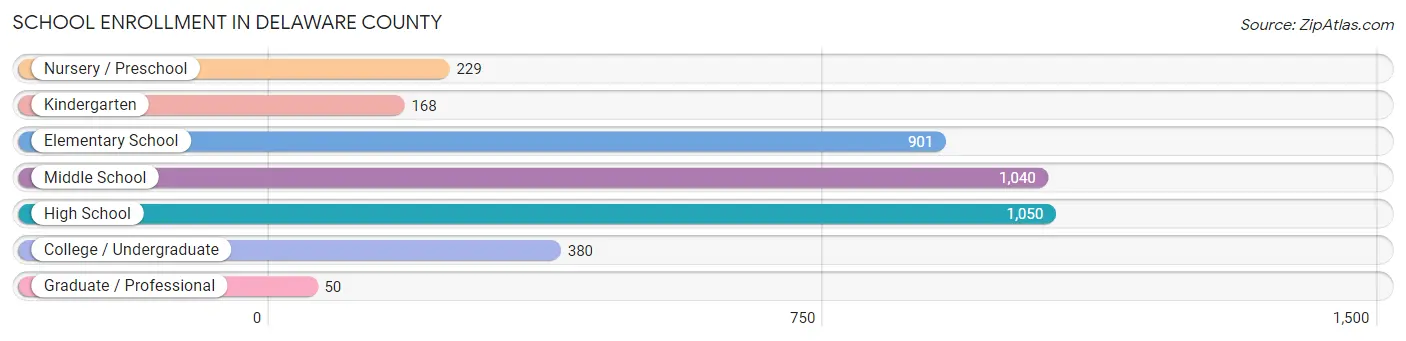
| School Level | # Students | % Students |
| Nursery / Preschool | 229 | 6.0% |
| Kindergarten | 168 | 4.4% |
| Elementary School | 901 | 23.6% |
| Middle School | 1,040 | 27.2% |
| High School | 1,050 | 27.5% |
| College / Undergraduate | 380 | 10.0% |
| Graduate / Professional | 50 | 1.3% |
| Total | 3,818 | 100.0% |
School Enrollment by Age by Funding Source in Delaware County
Out of a total of 3,818 students who are enrolled in schools in Delaware County, 821 (21.5%) attend a private institution, while the remaining 2,997 (78.5%) are enrolled in public schools. The age group of 35 years and over has the highest likelihood of being enrolled in private schools, with 46 (43.0% in the age bracket) enrolled. Conversely, the age group of 18 to 19 year olds has the lowest likelihood of being enrolled in a private school, with 246 (94.6% in the age bracket) attending a public institution.
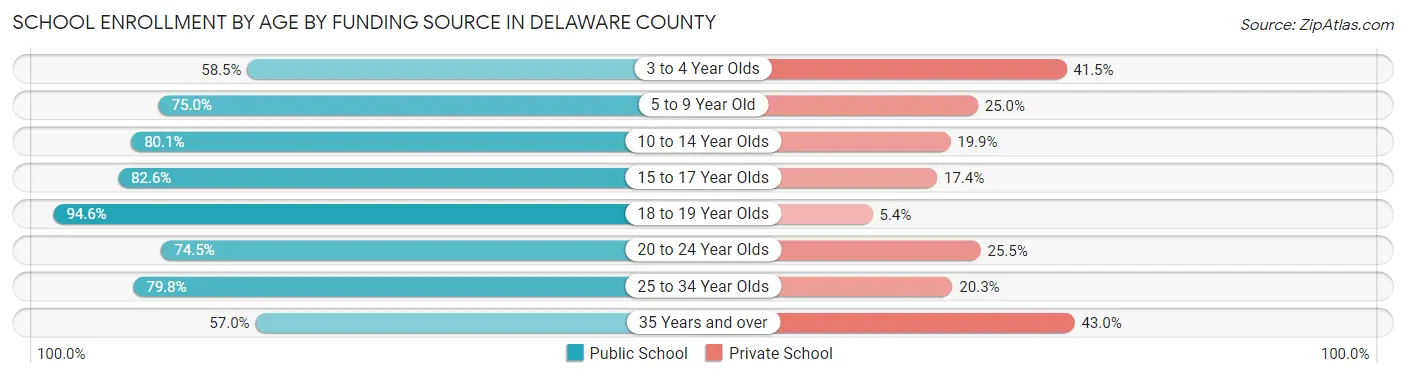
| Age Bracket | Public School | Private School |
| 3 to 4 Year Olds | 79 (58.5%) | 56 (41.5%) |
| 5 to 9 Year Old | 790 (75.0%) | 263 (25.0%) |
| 10 to 14 Year Olds | 997 (80.1%) | 247 (19.9%) |
| 15 to 17 Year Olds | 608 (82.6%) | 128 (17.4%) |
| 18 to 19 Year Olds | 246 (94.6%) | 14 (5.4%) |
| 20 to 24 Year Olds | 152 (74.5%) | 52 (25.5%) |
| 25 to 34 Year Olds | 63 (79.7%) | 16 (20.3%) |
| 35 Years and over | 61 (57.0%) | 46 (43.0%) |
| Total | 2,997 (78.5%) | 821 (21.5%) |
Educational Attainment by Field of Study in Delaware County
Education (470 | 19.1%), business (427 | 17.3%), science & technology (384 | 15.6%), bio, nature & agricultural (273 | 11.1%), and arts & humanities (159 | 6.5%) are the most common fields of study among 2,462 individuals in Delaware County who have obtained a bachelor's degree or higher.
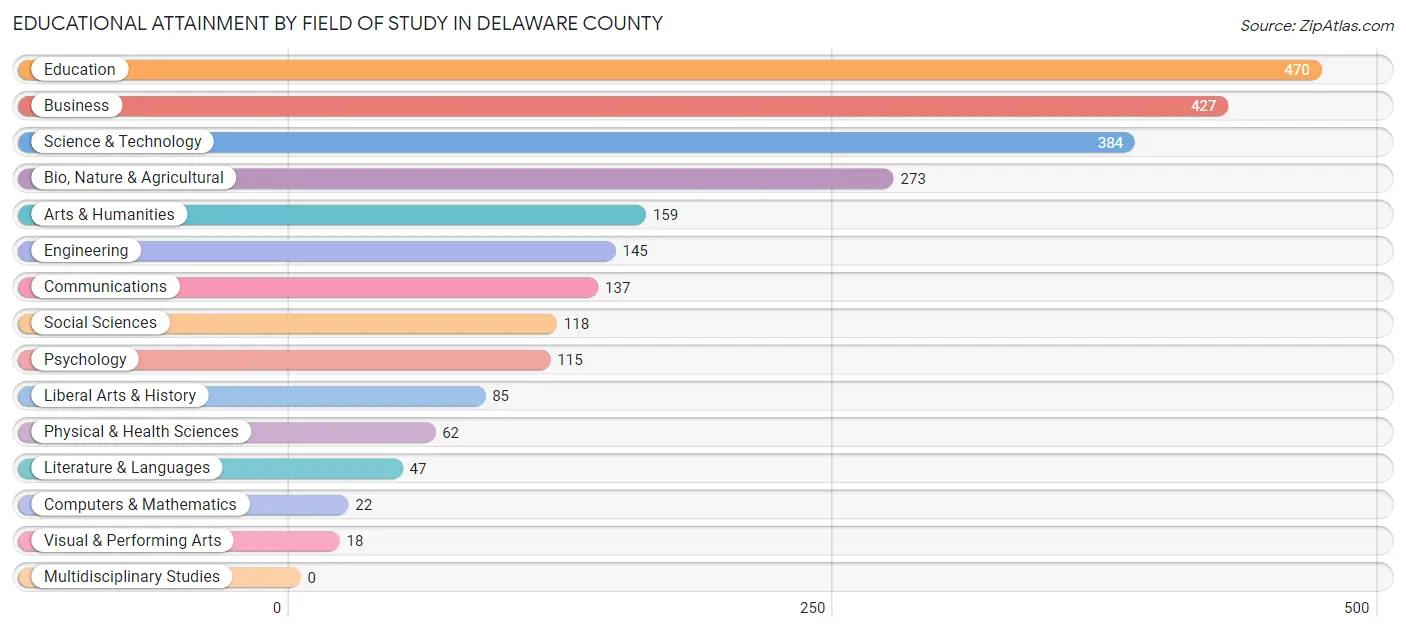
| Field of Study | # Graduates | % Graduates |
| Computers & Mathematics | 22 | 0.9% |
| Bio, Nature & Agricultural | 273 | 11.1% |
| Physical & Health Sciences | 62 | 2.5% |
| Psychology | 115 | 4.7% |
| Social Sciences | 118 | 4.8% |
| Engineering | 145 | 5.9% |
| Multidisciplinary Studies | 0 | 0.0% |
| Science & Technology | 384 | 15.6% |
| Business | 427 | 17.3% |
| Education | 470 | 19.1% |
| Literature & Languages | 47 | 1.9% |
| Liberal Arts & History | 85 | 3.5% |
| Visual & Performing Arts | 18 | 0.7% |
| Communications | 137 | 5.6% |
| Arts & Humanities | 159 | 6.5% |
| Total | 2,462 | 100.0% |
Transportation & Commute in Delaware County
Vehicle Availability by Sex in Delaware County
The most prevalent vehicle ownership categories in Delaware County are males with 2 vehicles (1,728, accounting for 33.8%) and females with 2 vehicles (1,412, making up 39.4%).
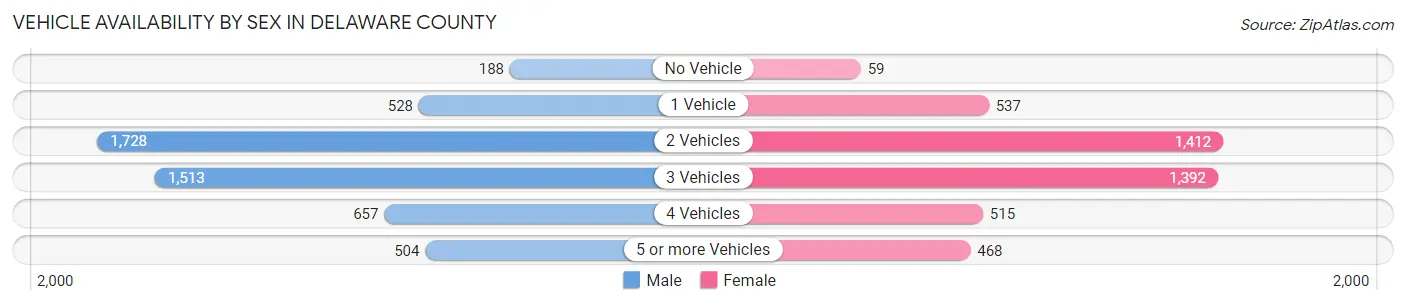
| Vehicles Available | Male | Female |
| No Vehicle | 188 (3.7%) | 59 (1.3%) |
| 1 Vehicle | 528 (10.3%) | 537 (12.2%) |
| 2 Vehicles | 1,728 (33.8%) | 1,412 (32.2%) |
| 3 Vehicles | 1,513 (29.6%) | 1,392 (31.8%) |
| 4 Vehicles | 657 (12.8%) | 515 (11.7%) |
| 5 or more Vehicles | 504 (9.9%) | 468 (10.7%) |
| Total | 5,118 (100.0%) | 4,383 (100.0%) |
Commute Time in Delaware County
The most frequently occuring commute durations in Delaware County are 5 to 9 minutes (1,760 commuters, 20.3%), 10 to 14 minutes (1,435 commuters, 16.5%), and 15 to 19 minutes (1,289 commuters, 14.8%).
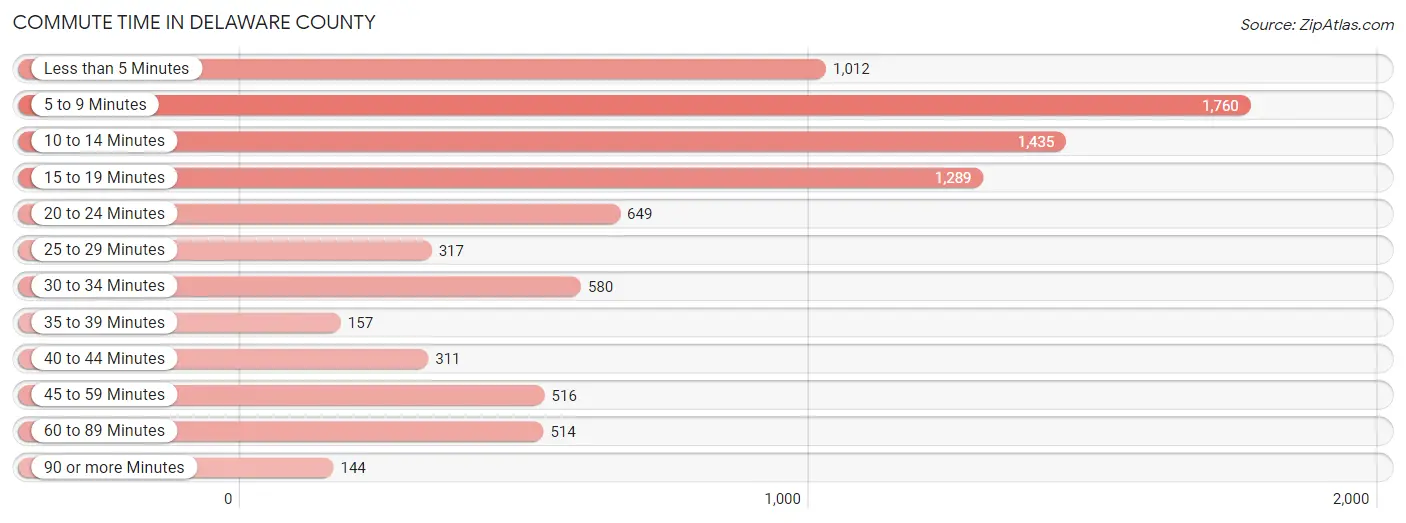
| Commute Time | # Commuters | % Commuters |
| Less than 5 Minutes | 1,012 | 11.7% |
| 5 to 9 Minutes | 1,760 | 20.3% |
| 10 to 14 Minutes | 1,435 | 16.5% |
| 15 to 19 Minutes | 1,289 | 14.8% |
| 20 to 24 Minutes | 649 | 7.5% |
| 25 to 29 Minutes | 317 | 3.6% |
| 30 to 34 Minutes | 580 | 6.7% |
| 35 to 39 Minutes | 157 | 1.8% |
| 40 to 44 Minutes | 311 | 3.6% |
| 45 to 59 Minutes | 516 | 5.9% |
| 60 to 89 Minutes | 514 | 5.9% |
| 90 or more Minutes | 144 | 1.7% |
Commute Time by Sex in Delaware County
The most common commute times in Delaware County are 5 to 9 minutes (987 commuters, 21.3%) for males and 5 to 9 minutes (773 commuters, 19.1%) for females.
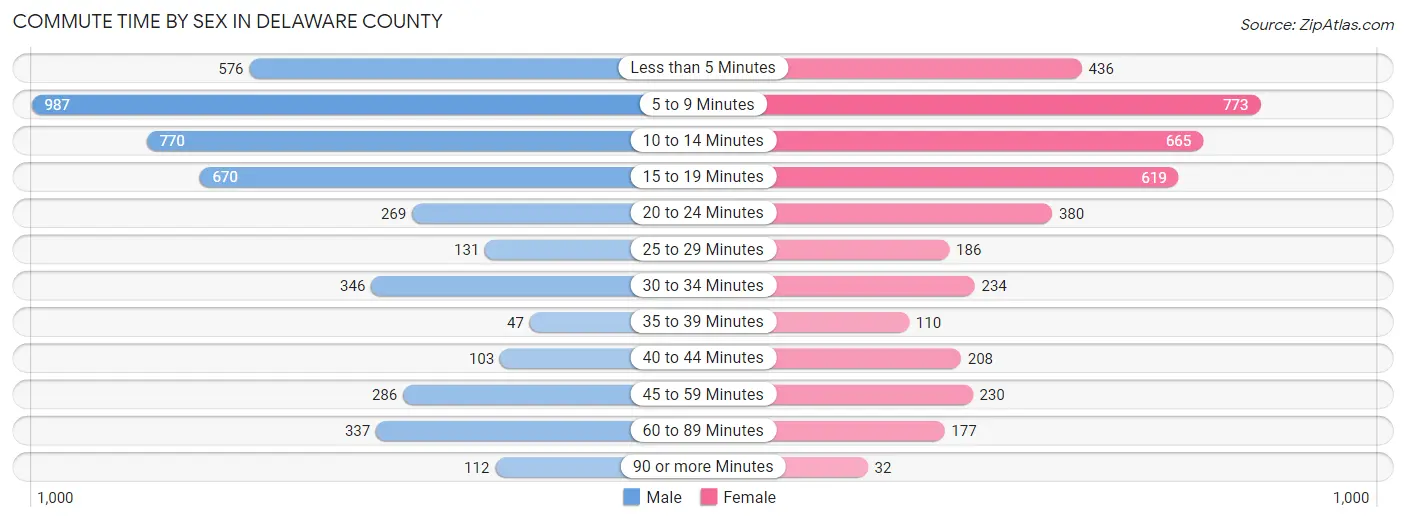
| Commute Time | Male | Female |
| Less than 5 Minutes | 576 (12.4%) | 436 (10.8%) |
| 5 to 9 Minutes | 987 (21.3%) | 773 (19.1%) |
| 10 to 14 Minutes | 770 (16.6%) | 665 (16.4%) |
| 15 to 19 Minutes | 670 (14.5%) | 619 (15.3%) |
| 20 to 24 Minutes | 269 (5.8%) | 380 (9.4%) |
| 25 to 29 Minutes | 131 (2.8%) | 186 (4.6%) |
| 30 to 34 Minutes | 346 (7.5%) | 234 (5.8%) |
| 35 to 39 Minutes | 47 (1.0%) | 110 (2.7%) |
| 40 to 44 Minutes | 103 (2.2%) | 208 (5.1%) |
| 45 to 59 Minutes | 286 (6.2%) | 230 (5.7%) |
| 60 to 89 Minutes | 337 (7.3%) | 177 (4.4%) |
| 90 or more Minutes | 112 (2.4%) | 32 (0.8%) |
Time of Departure to Work by Sex in Delaware County
The most frequent times of departure to work in Delaware County are 7:30 AM to 7:59 AM (671, 14.5%) for males and 7:00 AM to 7:29 AM (725, 17.9%) for females.
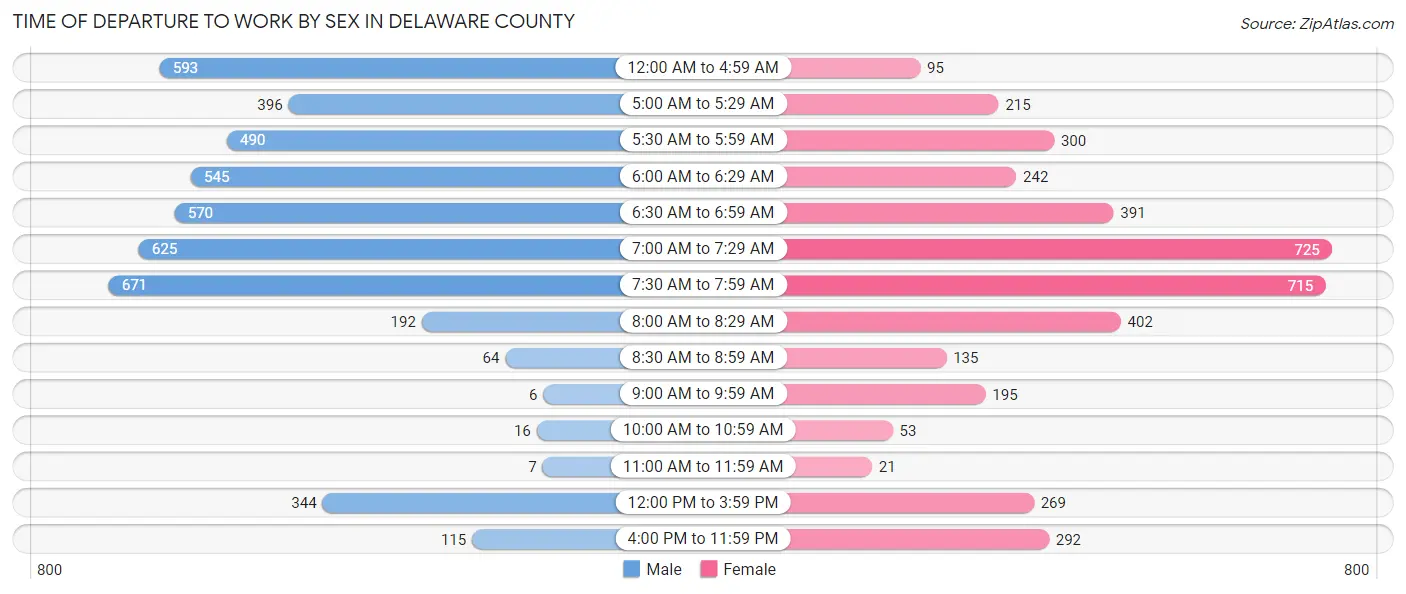
| Time of Departure | Male | Female |
| 12:00 AM to 4:59 AM | 593 (12.8%) | 95 (2.4%) |
| 5:00 AM to 5:29 AM | 396 (8.6%) | 215 (5.3%) |
| 5:30 AM to 5:59 AM | 490 (10.6%) | 300 (7.4%) |
| 6:00 AM to 6:29 AM | 545 (11.8%) | 242 (6.0%) |
| 6:30 AM to 6:59 AM | 570 (12.3%) | 391 (9.7%) |
| 7:00 AM to 7:29 AM | 625 (13.5%) | 725 (17.9%) |
| 7:30 AM to 7:59 AM | 671 (14.5%) | 715 (17.6%) |
| 8:00 AM to 8:29 AM | 192 (4.1%) | 402 (9.9%) |
| 8:30 AM to 8:59 AM | 64 (1.4%) | 135 (3.3%) |
| 9:00 AM to 9:59 AM | 6 (0.1%) | 195 (4.8%) |
| 10:00 AM to 10:59 AM | 16 (0.4%) | 53 (1.3%) |
| 11:00 AM to 11:59 AM | 7 (0.2%) | 21 (0.5%) |
| 12:00 PM to 3:59 PM | 344 (7.4%) | 269 (6.6%) |
| 4:00 PM to 11:59 PM | 115 (2.5%) | 292 (7.2%) |
| Total | 4,634 (100.0%) | 4,050 (100.0%) |
Housing Occupancy in Delaware County
Occupancy by Ownership in Delaware County
Of the total 7,068 dwellings in Delaware County, owner-occupied units account for 5,839 (82.6%), while renter-occupied units make up 1,229 (17.4%).
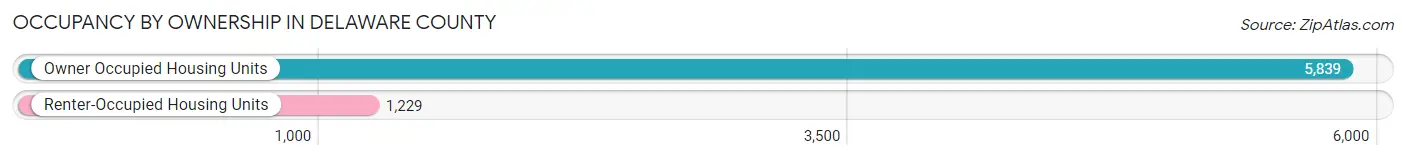
| Occupancy | # Housing Units | % Housing Units |
| Owner Occupied Housing Units | 5,839 | 82.6% |
| Renter-Occupied Housing Units | 1,229 | 17.4% |
| Total Occupied Housing Units | 7,068 | 100.0% |
Occupancy by Household Size in Delaware County
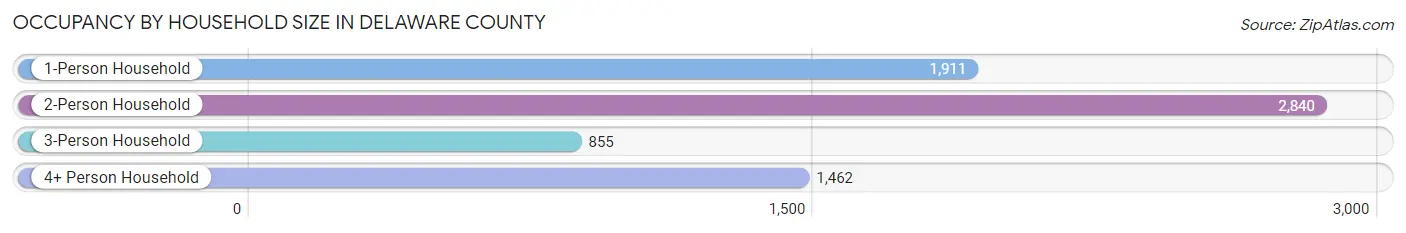
| Household Size | # Housing Units | % Housing Units |
| 1-Person Household | 1,911 | 27.0% |
| 2-Person Household | 2,840 | 40.2% |
| 3-Person Household | 855 | 12.1% |
| 4+ Person Household | 1,462 | 20.7% |
| Total Housing Units | 7,068 | 100.0% |
Occupancy by Ownership by Household Size in Delaware County
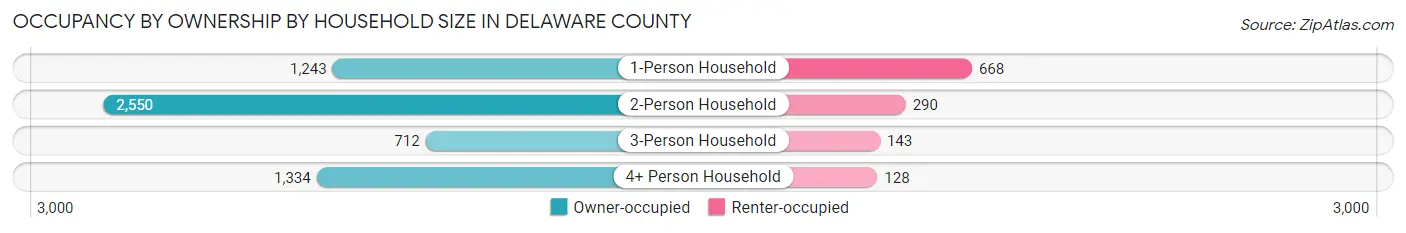
| Household Size | Owner-occupied | Renter-occupied |
| 1-Person Household | 1,243 (65.0%) | 668 (35.0%) |
| 2-Person Household | 2,550 (89.8%) | 290 (10.2%) |
| 3-Person Household | 712 (83.3%) | 143 (16.7%) |
| 4+ Person Household | 1,334 (91.2%) | 128 (8.8%) |
| Total Housing Units | 5,839 (82.6%) | 1,229 (17.4%) |
Occupancy by Educational Attainment in Delaware County
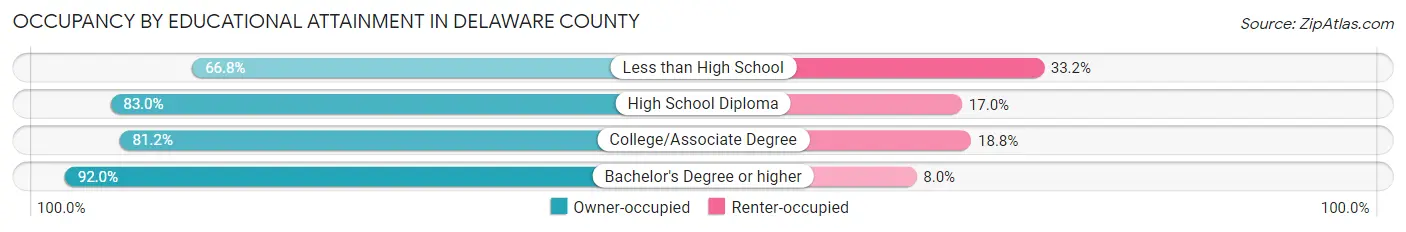
| Household Size | Owner-occupied | Renter-occupied |
| Less than High School | 456 (66.8%) | 227 (33.2%) |
| High School Diploma | 2,393 (83.0%) | 490 (17.0%) |
| College/Associate Degree | 1,743 (81.2%) | 404 (18.8%) |
| Bachelor's Degree or higher | 1,247 (92.0%) | 108 (8.0%) |
Occupancy by Age of Householder in Delaware County
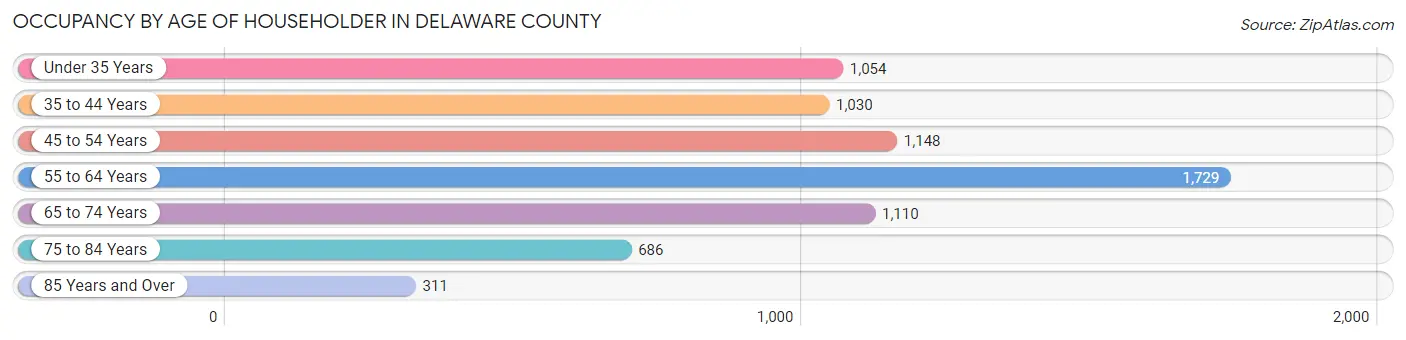
| Age Bracket | # Households | % Households |
| Under 35 Years | 1,054 | 14.9% |
| 35 to 44 Years | 1,030 | 14.6% |
| 45 to 54 Years | 1,148 | 16.2% |
| 55 to 64 Years | 1,729 | 24.5% |
| 65 to 74 Years | 1,110 | 15.7% |
| 75 to 84 Years | 686 | 9.7% |
| 85 Years and Over | 311 | 4.4% |
| Total | 7,068 | 100.0% |
Housing Finances in Delaware County
Median Income by Occupancy in Delaware County
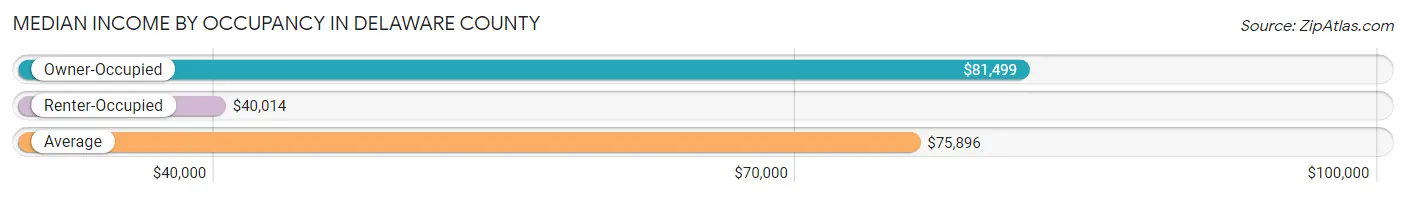
| Occupancy Type | # Households | Median Income |
| Owner-Occupied | 5,839 (82.6%) | $81,499 |
| Renter-Occupied | 1,229 (17.4%) | $40,014 |
| Average | 7,068 (100.0%) | $75,896 |
Occupancy by Householder Income Bracket in Delaware County
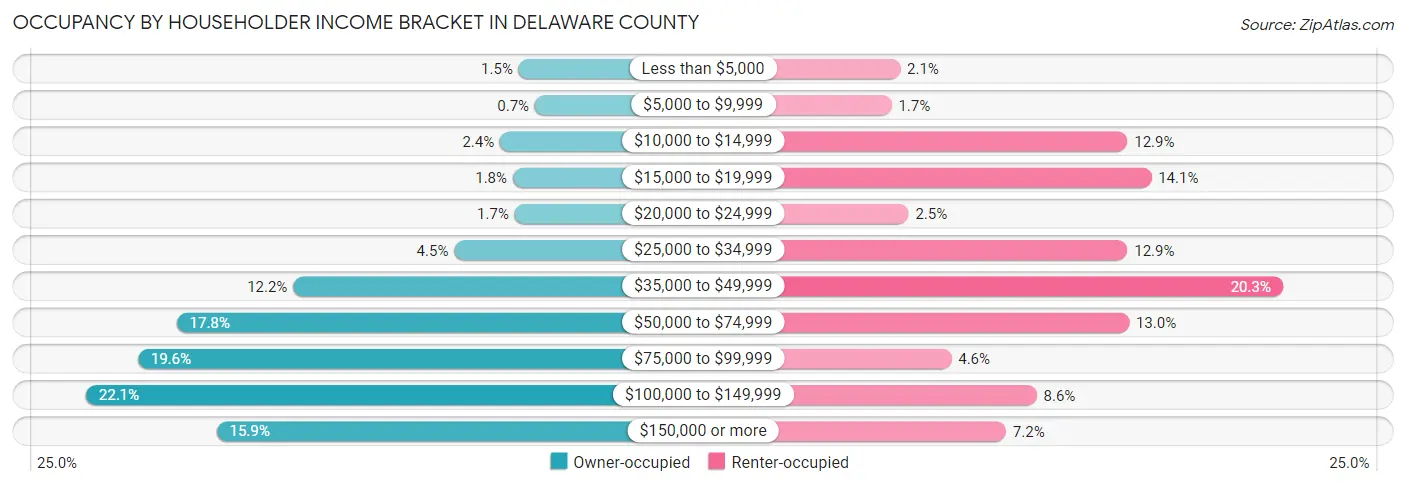
| Income Bracket | Owner-occupied | Renter-occupied |
| Less than $5,000 | 86 (1.5%) | 26 (2.1%) |
| $5,000 to $9,999 | 41 (0.7%) | 21 (1.7%) |
| $10,000 to $14,999 | 138 (2.4%) | 159 (12.9%) |
| $15,000 to $19,999 | 102 (1.8%) | 173 (14.1%) |
| $20,000 to $24,999 | 97 (1.7%) | 31 (2.5%) |
| $25,000 to $34,999 | 265 (4.5%) | 159 (12.9%) |
| $35,000 to $49,999 | 713 (12.2%) | 250 (20.3%) |
| $50,000 to $74,999 | 1,037 (17.8%) | 160 (13.0%) |
| $75,000 to $99,999 | 1,145 (19.6%) | 56 (4.6%) |
| $100,000 to $149,999 | 1,289 (22.1%) | 106 (8.6%) |
| $150,000 or more | 926 (15.9%) | 88 (7.2%) |
| Total | 5,839 (100.0%) | 1,229 (100.0%) |
Monthly Housing Cost Tiers in Delaware County
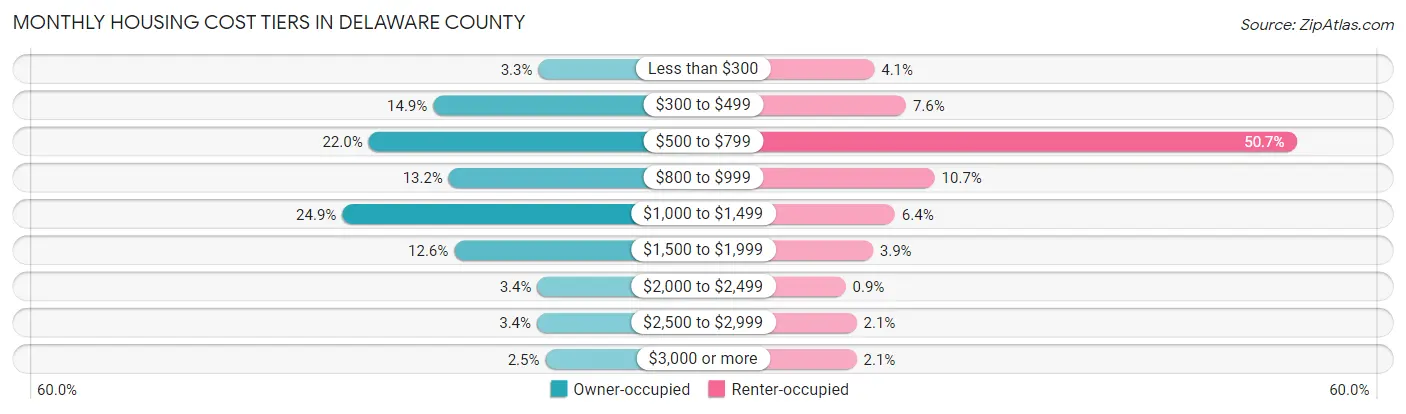
| Monthly Cost | Owner-occupied | Renter-occupied |
| Less than $300 | 190 (3.3%) | 50 (4.1%) |
| $300 to $499 | 868 (14.9%) | 93 (7.6%) |
| $500 to $799 | 1,285 (22.0%) | 623 (50.7%) |
| $800 to $999 | 768 (13.2%) | 132 (10.7%) |
| $1,000 to $1,499 | 1,455 (24.9%) | 78 (6.4%) |
| $1,500 to $1,999 | 733 (12.6%) | 48 (3.9%) |
| $2,000 to $2,499 | 196 (3.4%) | 11 (0.9%) |
| $2,500 to $2,999 | 199 (3.4%) | 26 (2.1%) |
| $3,000 or more | 145 (2.5%) | 26 (2.1%) |
| Total | 5,839 (100.0%) | 1,229 (100.0%) |
Physical Housing Characteristics in Delaware County
Housing Structures in Delaware County
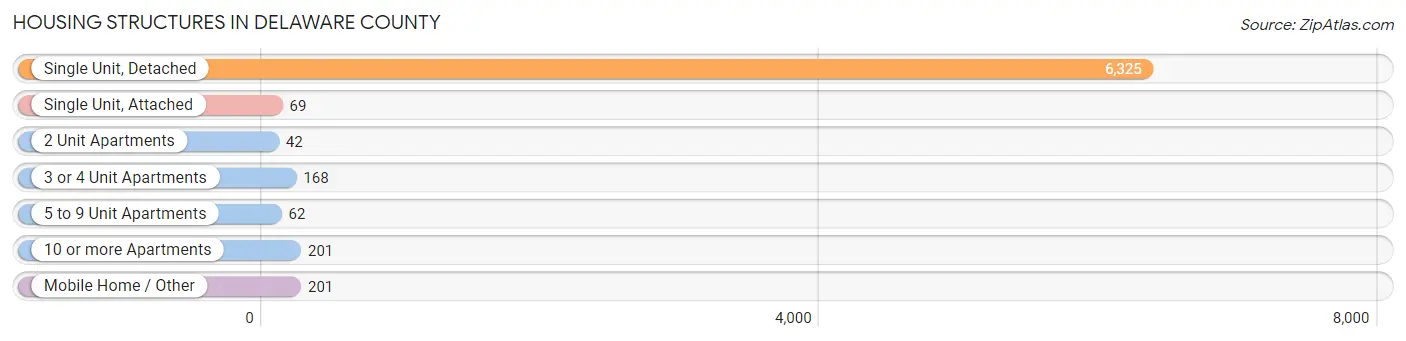
| Structure Type | # Housing Units | % Housing Units |
| Single Unit, Detached | 6,325 | 89.5% |
| Single Unit, Attached | 69 | 1.0% |
| 2 Unit Apartments | 42 | 0.6% |
| 3 or 4 Unit Apartments | 168 | 2.4% |
| 5 to 9 Unit Apartments | 62 | 0.9% |
| 10 or more Apartments | 201 | 2.8% |
| Mobile Home / Other | 201 | 2.8% |
| Total | 7,068 | 100.0% |
Housing Structures by Occupancy in Delaware County
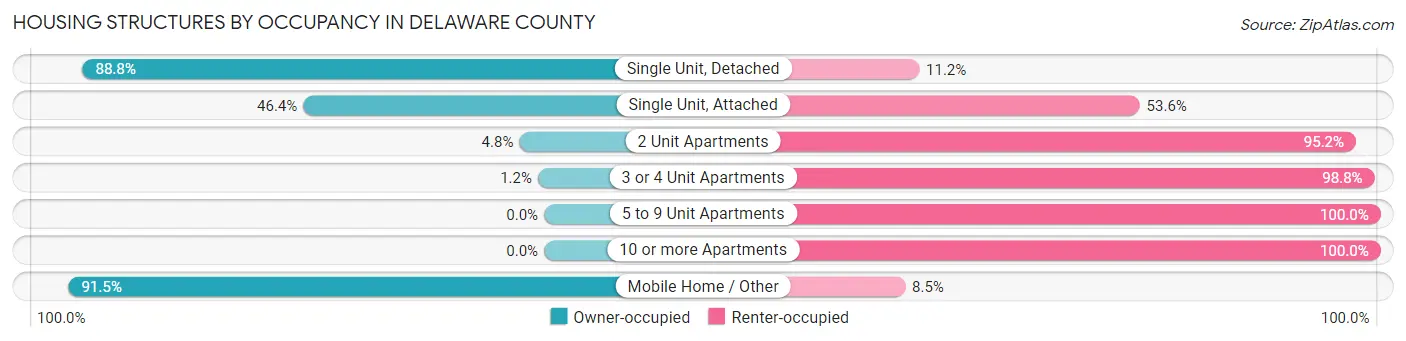
| Structure Type | Owner-occupied | Renter-occupied |
| Single Unit, Detached | 5,619 (88.8%) | 706 (11.2%) |
| Single Unit, Attached | 32 (46.4%) | 37 (53.6%) |
| 2 Unit Apartments | 2 (4.8%) | 40 (95.2%) |
| 3 or 4 Unit Apartments | 2 (1.2%) | 166 (98.8%) |
| 5 to 9 Unit Apartments | 0 (0.0%) | 62 (100.0%) |
| 10 or more Apartments | 0 (0.0%) | 201 (100.0%) |
| Mobile Home / Other | 184 (91.5%) | 17 (8.5%) |
| Total | 5,839 (82.6%) | 1,229 (17.4%) |
Housing Structures by Number of Rooms in Delaware County
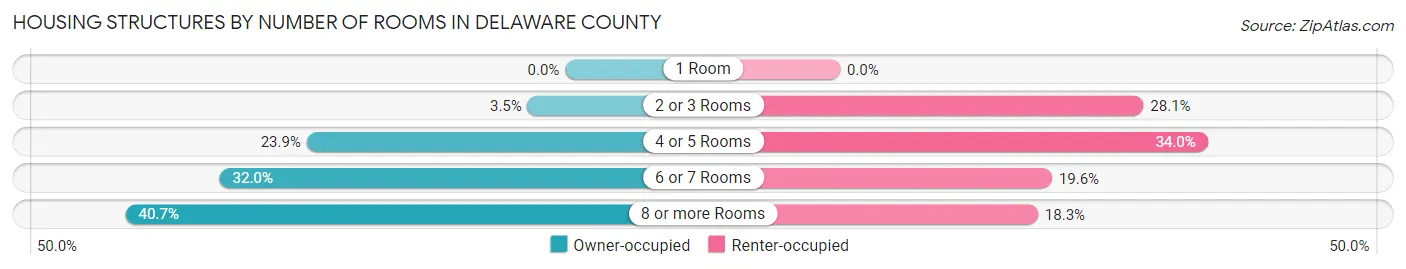
| Number of Rooms | Owner-occupied | Renter-occupied |
| 1 Room | 0 (0.0%) | 0 (0.0%) |
| 2 or 3 Rooms | 203 (3.5%) | 345 (28.1%) |
| 4 or 5 Rooms | 1,396 (23.9%) | 418 (34.0%) |
| 6 or 7 Rooms | 1,866 (32.0%) | 241 (19.6%) |
| 8 or more Rooms | 2,374 (40.7%) | 225 (18.3%) |
| Total | 5,839 (100.0%) | 1,229 (100.0%) |
Housing Structure by Heating Type in Delaware County
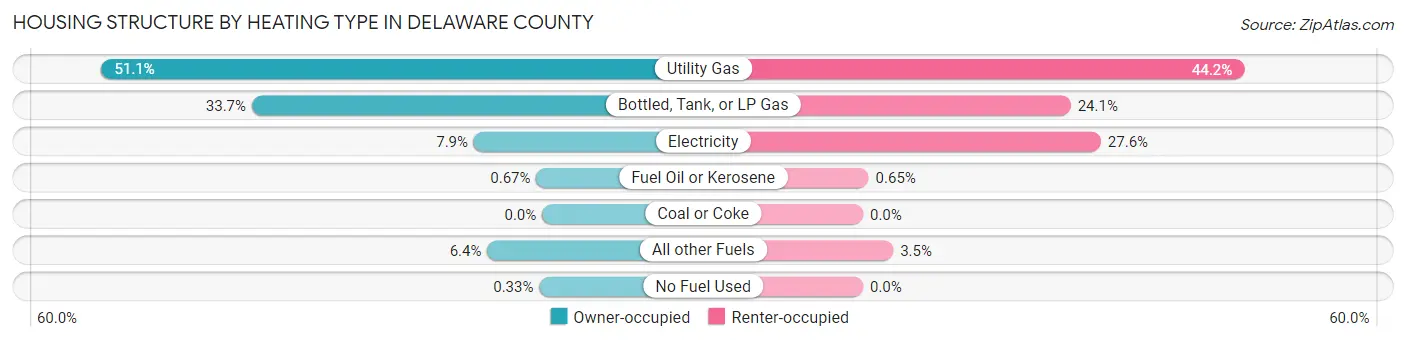
| Heating Type | Owner-occupied | Renter-occupied |
| Utility Gas | 2,983 (51.1%) | 543 (44.2%) |
| Bottled, Tank, or LP Gas | 1,965 (33.7%) | 296 (24.1%) |
| Electricity | 462 (7.9%) | 339 (27.6%) |
| Fuel Oil or Kerosene | 39 (0.7%) | 8 (0.6%) |
| Coal or Coke | 0 (0.0%) | 0 (0.0%) |
| All other Fuels | 371 (6.4%) | 43 (3.5%) |
| No Fuel Used | 19 (0.3%) | 0 (0.0%) |
| Total | 5,839 (100.0%) | 1,229 (100.0%) |
Household Vehicle Usage in Delaware County
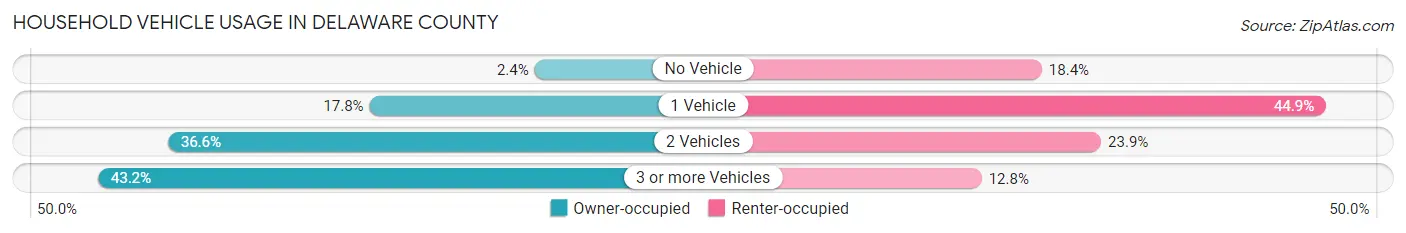
| Vehicles per Household | Owner-occupied | Renter-occupied |
| No Vehicle | 140 (2.4%) | 226 (18.4%) |
| 1 Vehicle | 1,040 (17.8%) | 552 (44.9%) |
| 2 Vehicles | 2,139 (36.6%) | 294 (23.9%) |
| 3 or more Vehicles | 2,520 (43.2%) | 157 (12.8%) |
| Total | 5,839 (100.0%) | 1,229 (100.0%) |
Real Estate & Mortgages in Delaware County
Real Estate and Mortgage Overview in Delaware County
| Characteristic | Without Mortgage | With Mortgage |
| Housing Units | 2,481 | 3,358 |
| Median Property Value | $152,200 | $156,400 |
| Median Household Income | $68,099 | $634 |
| Monthly Housing Costs | $570 | $136 |
| Real Estate Taxes | $1,962 | $98 |
Property Value by Mortgage Status in Delaware County
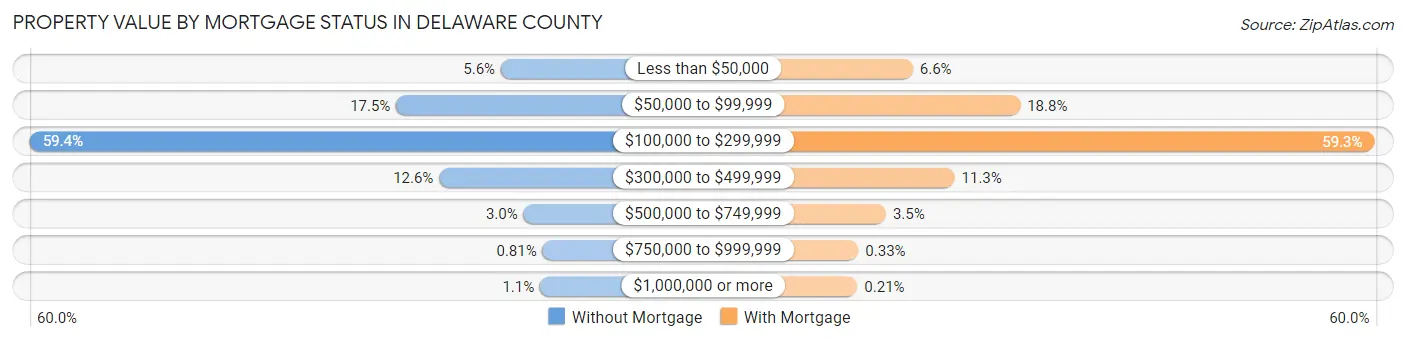
| Property Value | Without Mortgage | With Mortgage |
| Less than $50,000 | 138 (5.6%) | 220 (6.6%) |
| $50,000 to $99,999 | 435 (17.5%) | 632 (18.8%) |
| $100,000 to $299,999 | 1,474 (59.4%) | 1,991 (59.3%) |
| $300,000 to $499,999 | 313 (12.6%) | 380 (11.3%) |
| $500,000 to $749,999 | 74 (3.0%) | 117 (3.5%) |
| $750,000 to $999,999 | 20 (0.8%) | 11 (0.3%) |
| $1,000,000 or more | 27 (1.1%) | 7 (0.2%) |
| Total | 2,481 (100.0%) | 3,358 (100.0%) |
Household Income by Mortgage Status in Delaware County
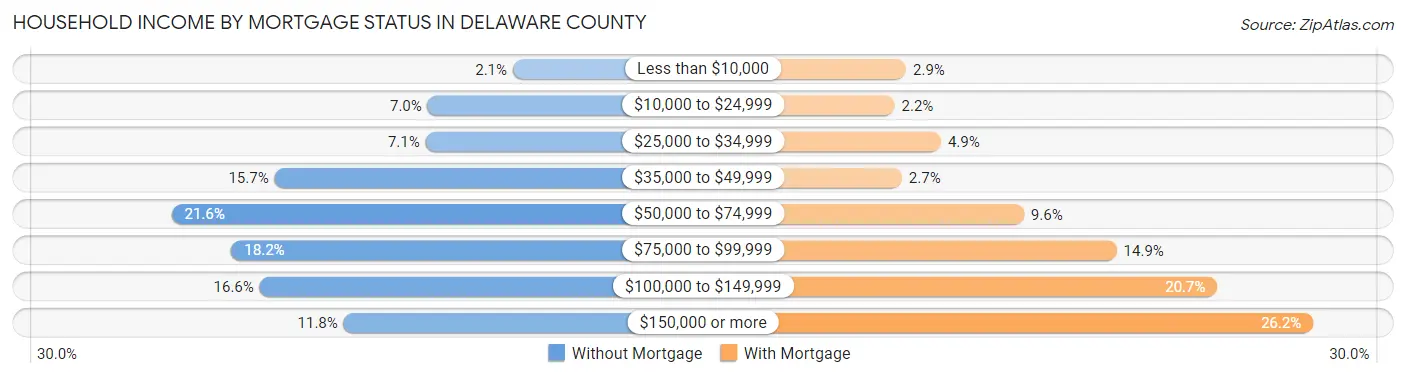
| Household Income | Without Mortgage | With Mortgage |
| Less than $10,000 | 52 (2.1%) | 97 (2.9%) |
| $10,000 to $24,999 | 173 (7.0%) | 75 (2.2%) |
| $25,000 to $34,999 | 176 (7.1%) | 164 (4.9%) |
| $35,000 to $49,999 | 390 (15.7%) | 89 (2.6%) |
| $50,000 to $74,999 | 536 (21.6%) | 323 (9.6%) |
| $75,000 to $99,999 | 451 (18.2%) | 501 (14.9%) |
| $100,000 to $149,999 | 411 (16.6%) | 694 (20.7%) |
| $150,000 or more | 292 (11.8%) | 878 (26.2%) |
| Total | 2,481 (100.0%) | 3,358 (100.0%) |
Property Value to Household Income Ratio in Delaware County
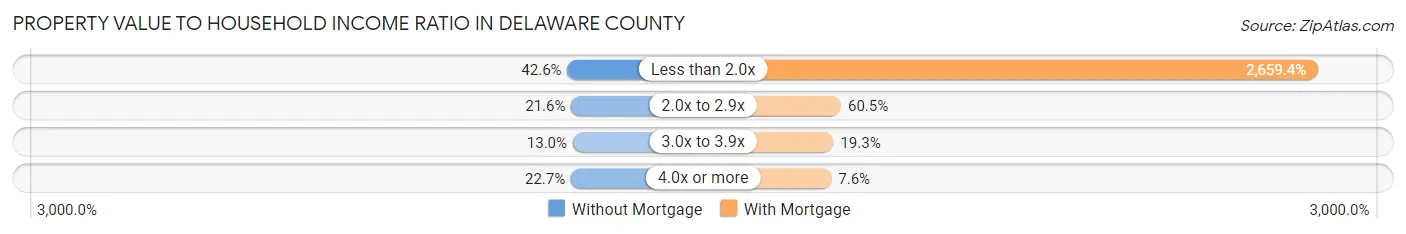
| Value-to-Income Ratio | Without Mortgage | With Mortgage |
| Less than 2.0x | 1,056 (42.6%) | 89,301 (2,659.3%) |
| 2.0x to 2.9x | 536 (21.6%) | 2,030 (60.5%) |
| 3.0x to 3.9x | 322 (13.0%) | 649 (19.3%) |
| 4.0x or more | 562 (22.7%) | 255 (7.6%) |
| Total | 2,481 (100.0%) | 3,358 (100.0%) |
Real Estate Taxes by Mortgage Status in Delaware County
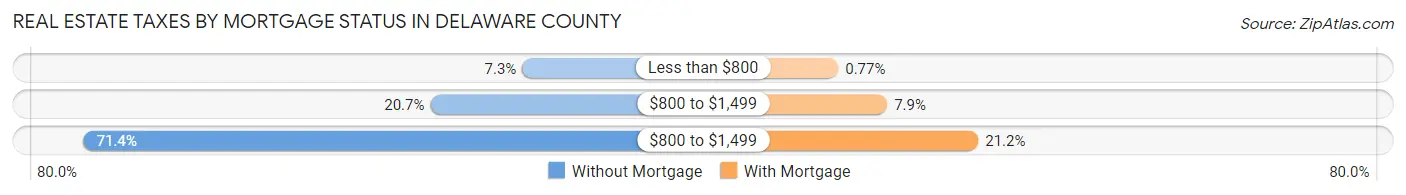
| Property Taxes | Without Mortgage | With Mortgage |
| Less than $800 | 181 (7.3%) | 26 (0.8%) |
| $800 to $1,499 | 514 (20.7%) | 266 (7.9%) |
| $800 to $1,499 | 1,771 (71.4%) | 713 (21.2%) |
| Total | 2,481 (100.0%) | 3,358 (100.0%) |
Health & Disability in Delaware County
Health Insurance Coverage by Age in Delaware County
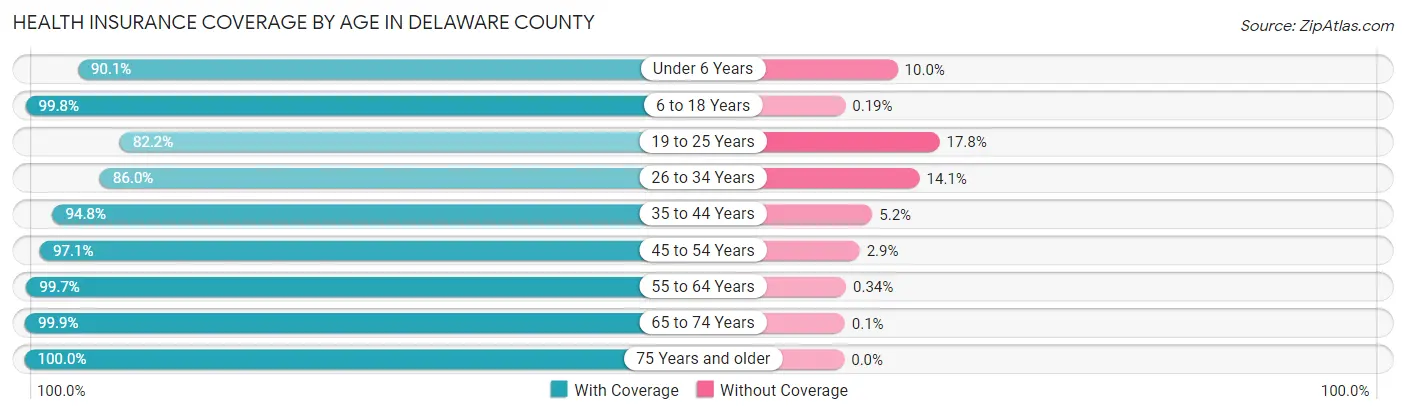
| Age Bracket | With Coverage | Without Coverage |
| Under 6 Years | 1,149 (90.0%) | 127 (10.0%) |
| 6 to 18 Years | 3,086 (99.8%) | 6 (0.2%) |
| 19 to 25 Years | 1,078 (82.2%) | 233 (17.8%) |
| 26 to 34 Years | 1,205 (86.0%) | 197 (14.1%) |
| 35 to 44 Years | 1,848 (94.8%) | 102 (5.2%) |
| 45 to 54 Years | 1,958 (97.1%) | 58 (2.9%) |
| 55 to 64 Years | 2,901 (99.7%) | 10 (0.3%) |
| 65 to 74 Years | 1,957 (99.9%) | 2 (0.1%) |
| 75 Years and older | 1,427 (100.0%) | 0 (0.0%) |
| Total | 16,609 (95.8%) | 735 (4.2%) |
Health Insurance Coverage by Citizenship Status in Delaware County
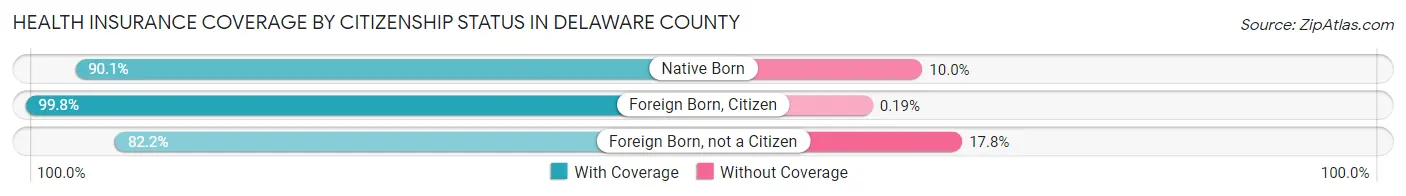
| Citizenship Status | With Coverage | Without Coverage |
| Native Born | 1,149 (90.0%) | 127 (10.0%) |
| Foreign Born, Citizen | 3,086 (99.8%) | 6 (0.2%) |
| Foreign Born, not a Citizen | 1,078 (82.2%) | 233 (17.8%) |
Health Insurance Coverage by Household Income in Delaware County
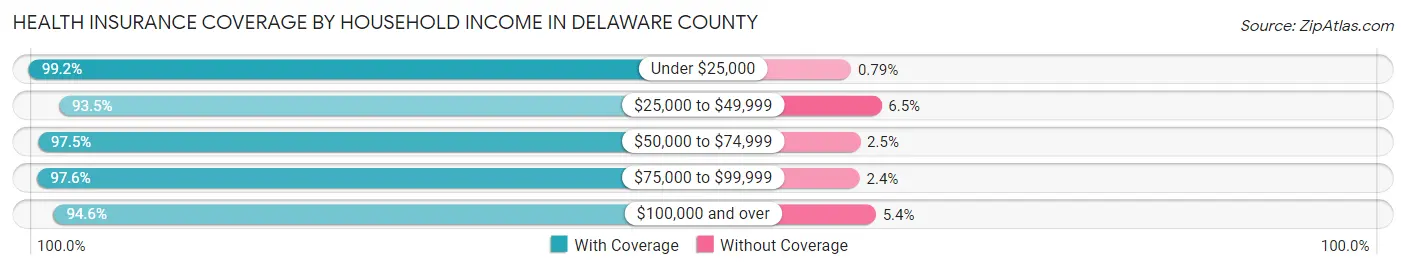
| Household Income | With Coverage | Without Coverage |
| Under $25,000 | 1,251 (99.2%) | 10 (0.8%) |
| $25,000 to $49,999 | 2,380 (93.5%) | 165 (6.5%) |
| $50,000 to $74,999 | 2,499 (97.5%) | 64 (2.5%) |
| $75,000 to $99,999 | 3,091 (97.6%) | 76 (2.4%) |
| $100,000 and over | 7,328 (94.6%) | 420 (5.4%) |
Public vs Private Health Insurance Coverage by Age in Delaware County
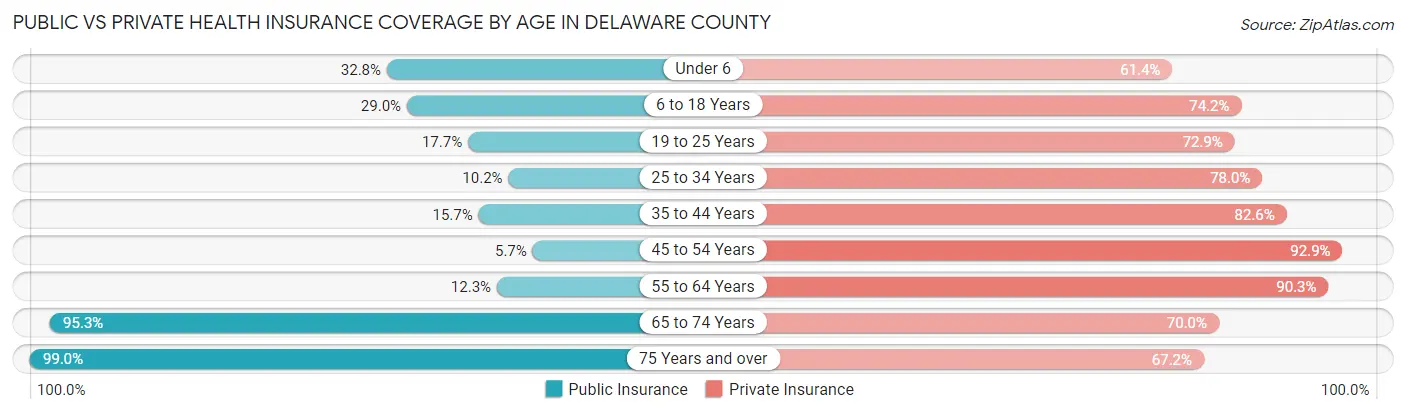
| Age Bracket | Public Insurance | Private Insurance |
| Under 6 | 418 (32.8%) | 783 (61.4%) |
| 6 to 18 Years | 898 (29.0%) | 2,293 (74.2%) |
| 19 to 25 Years | 232 (17.7%) | 956 (72.9%) |
| 25 to 34 Years | 143 (10.2%) | 1,094 (78.0%) |
| 35 to 44 Years | 307 (15.7%) | 1,610 (82.6%) |
| 45 to 54 Years | 115 (5.7%) | 1,873 (92.9%) |
| 55 to 64 Years | 359 (12.3%) | 2,629 (90.3%) |
| 65 to 74 Years | 1,867 (95.3%) | 1,371 (70.0%) |
| 75 Years and over | 1,413 (99.0%) | 959 (67.2%) |
| Total | 5,752 (33.2%) | 13,568 (78.2%) |
Disability Status by Sex by Age in Delaware County
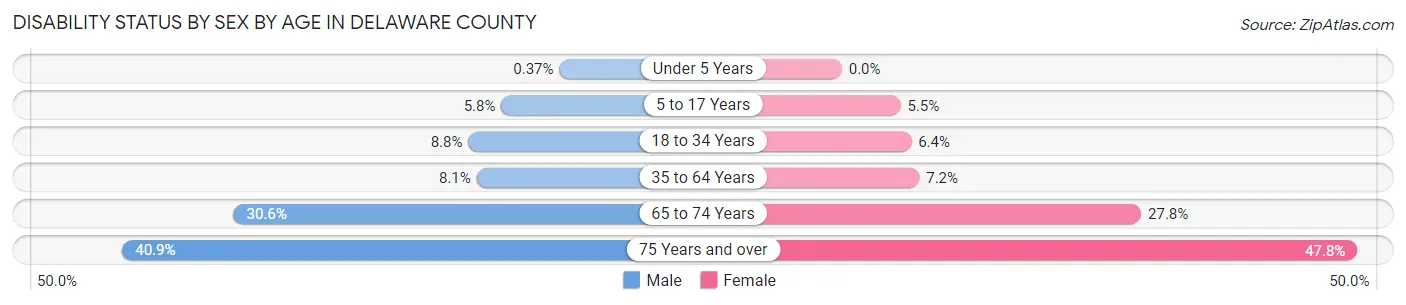
| Age Bracket | Male | Female |
| Under 5 Years | 2 (0.4%) | 0 (0.0%) |
| 5 to 17 Years | 95 (5.8%) | 78 (5.4%) |
| 18 to 34 Years | 136 (8.8%) | 88 (6.4%) |
| 35 to 64 Years | 284 (8.1%) | 241 (7.2%) |
| 65 to 74 Years | 302 (30.6%) | 270 (27.8%) |
| 75 Years and over | 264 (40.9%) | 374 (47.8%) |
Disability Class by Sex by Age in Delaware County
Disability Class: Hearing Difficulty
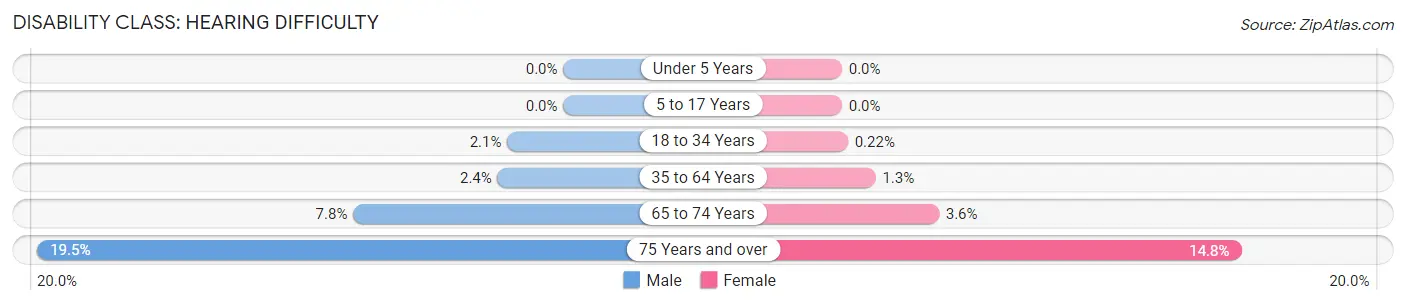
| Age Bracket | Male | Female |
| Under 5 Years | 0 (0.0%) | 0 (0.0%) |
| 5 to 17 Years | 0 (0.0%) | 0 (0.0%) |
| 18 to 34 Years | 32 (2.1%) | 3 (0.2%) |
| 35 to 64 Years | 86 (2.4%) | 42 (1.3%) |
| 65 to 74 Years | 77 (7.8%) | 35 (3.6%) |
| 75 Years and over | 126 (19.5%) | 116 (14.8%) |
Disability Class: Vision Difficulty
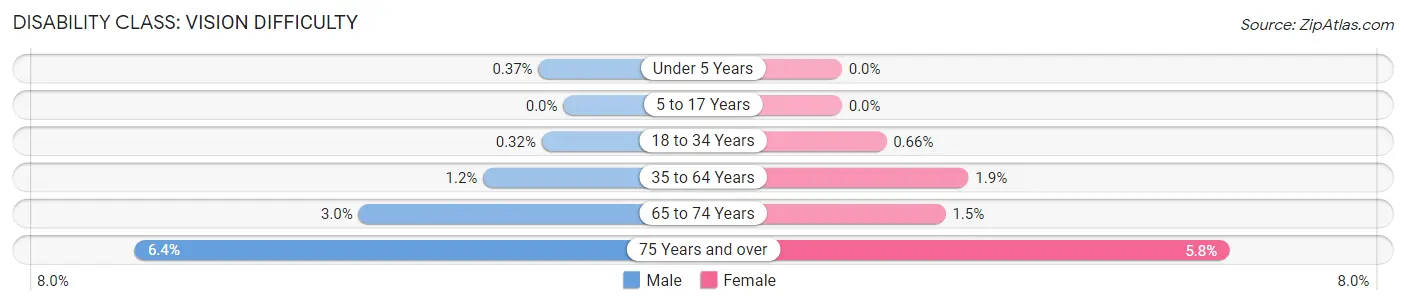
| Age Bracket | Male | Female |
| Under 5 Years | 2 (0.4%) | 0 (0.0%) |
| 5 to 17 Years | 0 (0.0%) | 0 (0.0%) |
| 18 to 34 Years | 5 (0.3%) | 9 (0.7%) |
| 35 to 64 Years | 42 (1.2%) | 63 (1.9%) |
| 65 to 74 Years | 30 (3.0%) | 15 (1.5%) |
| 75 Years and over | 41 (6.4%) | 45 (5.8%) |
Disability Class: Cognitive Difficulty
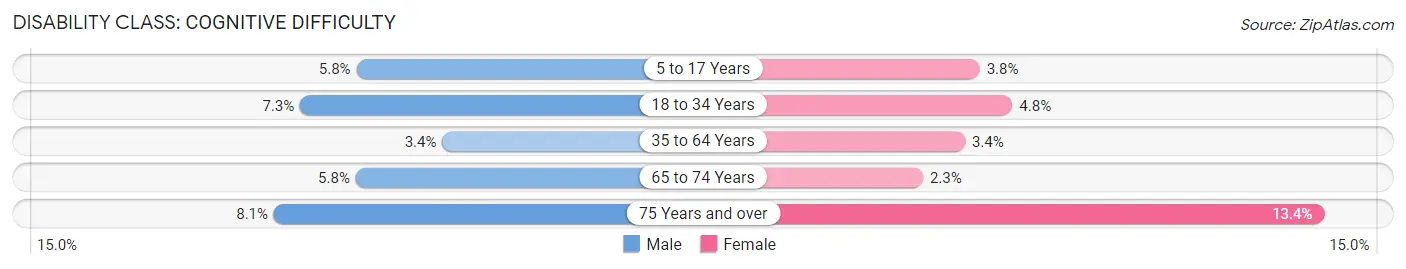
| Age Bracket | Male | Female |
| 5 to 17 Years | 95 (5.8%) | 55 (3.8%) |
| 18 to 34 Years | 113 (7.3%) | 65 (4.8%) |
| 35 to 64 Years | 119 (3.4%) | 115 (3.4%) |
| 65 to 74 Years | 57 (5.8%) | 22 (2.3%) |
| 75 Years and over | 52 (8.1%) | 105 (13.4%) |
Disability Class: Ambulatory Difficulty
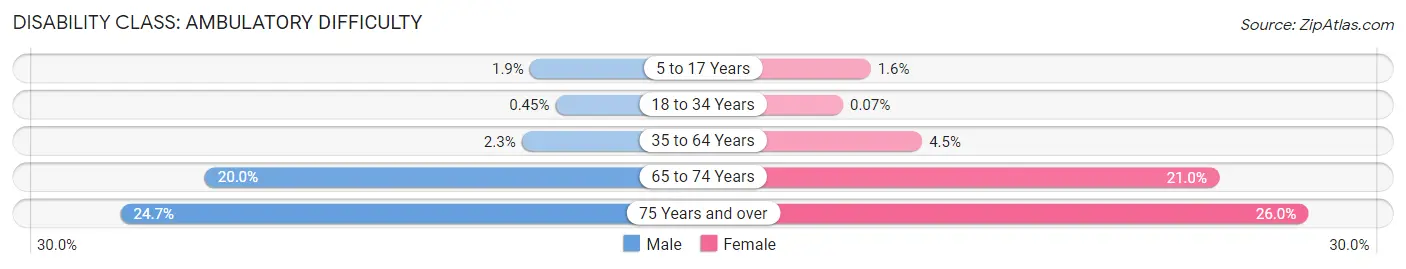
| Age Bracket | Male | Female |
| 5 to 17 Years | 31 (1.9%) | 23 (1.6%) |
| 18 to 34 Years | 7 (0.4%) | 1 (0.1%) |
| 35 to 64 Years | 82 (2.3%) | 150 (4.5%) |
| 65 to 74 Years | 197 (20.0%) | 204 (21.0%) |
| 75 Years and over | 159 (24.6%) | 203 (26.0%) |
Disability Class: Self-Care Difficulty
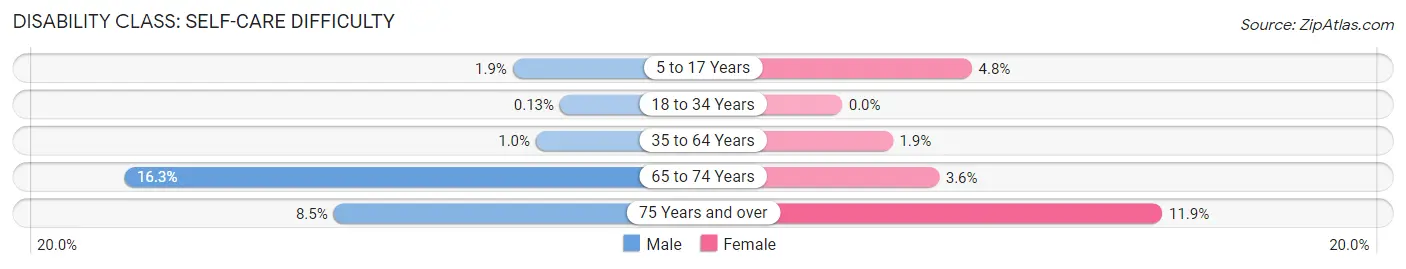
| Age Bracket | Male | Female |
| 5 to 17 Years | 31 (1.9%) | 69 (4.8%) |
| 18 to 34 Years | 2 (0.1%) | 0 (0.0%) |
| 35 to 64 Years | 36 (1.0%) | 63 (1.9%) |
| 65 to 74 Years | 161 (16.3%) | 35 (3.6%) |
| 75 Years and over | 55 (8.5%) | 93 (11.9%) |
Technology Access in Delaware County
Computing Device Access in Delaware County
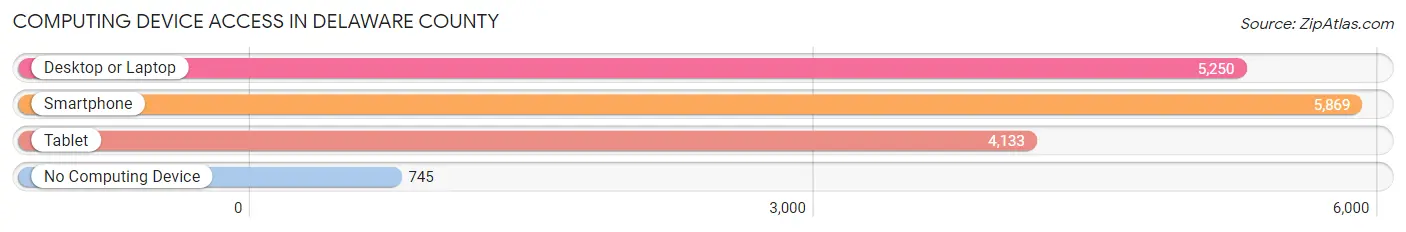
| Device Type | # Households | % Households |
| Desktop or Laptop | 5,250 | 74.3% |
| Smartphone | 5,869 | 83.0% |
| Tablet | 4,133 | 58.5% |
| No Computing Device | 745 | 10.5% |
| Total | 7,068 | 100.0% |
Internet Access in Delaware County
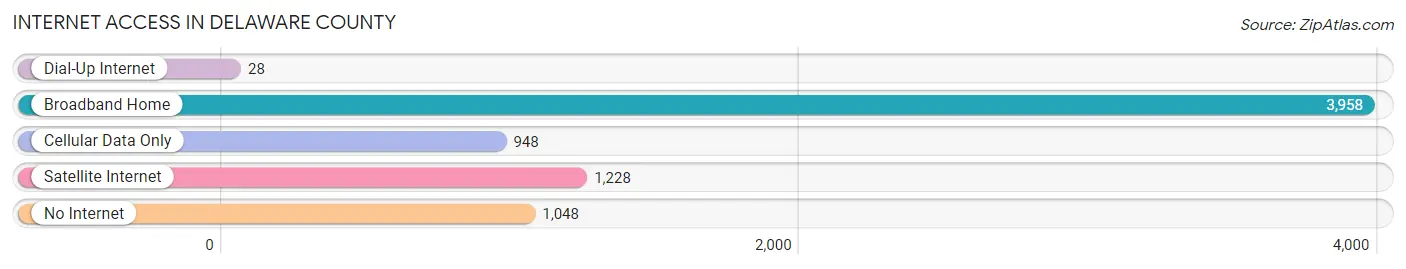
| Internet Type | # Households | % Households |
| Dial-Up Internet | 28 | 0.4% |
| Broadband Home | 3,958 | 56.0% |
| Cellular Data Only | 948 | 13.4% |
| Satellite Internet | 1,228 | 17.4% |
| No Internet | 1,048 | 14.8% |
| Total | 7,068 | 100.0% |
Delaware County Summary
Delaware County, Iowa is located in the northeastern corner of the state and is part of the Dubuque Metropolitan Statistical Area. The county was established in 1837 and is named after the Delaware Native American tribe. The county seat is Manchester, and the population was estimated to be around 19,000 in 2019.
Geography
Delaware County is located in the northeastern corner of Iowa and is bordered by Dubuque County to the north, Clayton County to the east, Jones County to the south, and Jackson County to the west. The county covers an area of 545 square miles and is mostly rural, with the majority of the land being used for agricultural purposes. The Maquoketa River runs through the county, and there are several small lakes and ponds scattered throughout the area. The highest point in the county is located in the northwest corner, at an elevation of 1,092 feet.
The county is divided into twelve townships: Delhi, Dundee, Eden, Elk, Fairview, Fillmore, Honey Creek, Liberty, Manchester, Mill Creek, Oneida, and Union. The county is also home to several small towns and villages, including Delhi, Dundee, Edgewood, Greeley, Manchester, Masonville, and Ryan.
Economy
The economy of Delaware County is largely based on agriculture, with corn, soybeans, and hay being the main crops. Other industries in the county include manufacturing, retail, and tourism. The county is home to several large employers, including the John Deere Dubuque Works, the Manchester-Dubuque Airport, and the Manchester-Dubuque Regional Airport.
Demographics
As of the 2010 census, the population of Delaware County was 18,871, with a population density of 34.5 people per square mile. The median age was 40.7 years, and the median household income was $50,945. The racial makeup of the county was 97.2% White, 0.7% African American, 0.3% Native American, 0.4% Asian, 0.1% Pacific Islander, 0.5% from other races, and 0.8% from two or more races. Hispanic or Latino of any race were 1.7% of the population.
The largest ancestry groups in Delaware County were German (37.2%), Irish (17.2%), English (13.2%), and Dutch (7.2%). The majority of the population (90.2%) spoke English as their primary language, while 4.2% spoke Spanish, 0.7% spoke German, and 0.5% spoke French.
Education
Delaware County is served by the East Central Iowa Educational Service Agency, which provides educational services to the county's public school districts. The county is home to several public school districts, including the Edgewood-Colesburg Community School District, the Maquoketa Community School District, and the North Linn Community School District. The county is also home to several private schools, including the Manchester Christian Academy and the St. Mary's Catholic School.
Conclusion
Delaware County, Iowa is a rural county located in the northeastern corner of the state. The county is largely agricultural, with corn, soybeans, and hay being the main crops. The county is home to several large employers, including the John Deere Dubuque Works, the Manchester-Dubuque Airport, and the Manchester-Dubuque Regional Airport. The population of the county was estimated to be around 19,000 in 2019, and the median household income was $50,945. The county is served by several public and private schools, and is part of the East Central Iowa Educational Service Agency.
Common Questions
What is Per Capita Income in Delaware County?
Per Capita income in Delaware County is $40,709.
What is the Median Family Income in Delaware County?
Median Family Income in Delaware County is $90,572.
What is the Median Household income in Delaware County?
Median Household Income in Delaware County is $75,896.
What is Income or Wage Gap in Delaware County?
Income or Wage Gap in Delaware County is 33.7%.
Women in Delaware County earn 66.3 cents for every dollar earned by a man.
What is Family Income Deficit in Delaware County?
Family Income Deficit in Delaware County is $9,961.
Families that are below poverty line in Delaware County earn $9,961 less on average than the poverty threshold level.
What is Inequality or Gini Index in Delaware County?
Inequality or Gini Index in Delaware County is 0.44.
What is the Total Population of Delaware County?
Total Population of Delaware County is 17,523.
What is the Total Male Population of Delaware County?
Total Male Population of Delaware County is 8,944.
What is the Total Female Population of Delaware County?
Total Female Population of Delaware County is 8,579.
What is the Ratio of Males per 100 Females in Delaware County?
There are 104.25 Males per 100 Females in Delaware County.
What is the Ratio of Females per 100 Males in Delaware County?
There are 95.92 Females per 100 Males in Delaware County.
What is the Median Population Age in Delaware County?
Median Population Age in Delaware County is 43.5 Years.
What is the Average Family Size in Delaware County
Average Family Size in Delaware County is 3.0 People.
What is the Average Household Size in Delaware County
Average Household Size in Delaware County is 2.5 People.
How Large is the Labor Force in Delaware County?
There are 9,807 People in the Labor Forcein in Delaware County.
What is the Percentage of People in the Labor Force in Delaware County?
71.1% of People are in the Labor Force in Delaware County.
What is the Unemployment Rate in Delaware County?
Unemployment Rate in Delaware County is 2.2%.