Davis County, IA Map & Demographics
Davis County Map
Davis County Overview
$32,889
PER CAPITA INCOME
$89,434
AVG FAMILY INCOME
$77,176
AVG HOUSEHOLD INCOME
42.5%
WAGE / INCOME GAP [ % ]
57.5¢/ $1
WAGE / INCOME GAP [ $ ]
0.40
INEQUALITY / GINI INDEX
9,093
TOTAL POPULATION
4,636
MALE POPULATION
4,457
FEMALE POPULATION
104.02
MALES / 100 FEMALES
96.14
FEMALES / 100 MALES
36.3
MEDIAN AGE
3.3
AVG FAMILY SIZE
2.8
AVG HOUSEHOLD SIZE
4,188
LABOR FORCE [ PEOPLE ]
62.6%
PERCENT IN LABOR FORCE
2.0%
UNEMPLOYMENT RATE
Davis County Area Codes
Income in Davis County
Income Overview in Davis County
Per Capita Income in Davis County is $32,889, while median incomes of families and households are $89,434 and $77,176 respectively.
| Characteristic | Number | Measure |
| Per Capita Income | 9,093 | $32,889 |
| Median Family Income | 2,422 | $89,434 |
| Mean Family Income | 2,422 | $103,968 |
| Median Household Income | 3,172 | $77,176 |
| Mean Household Income | 3,172 | $91,815 |
| Income Deficit | 2,422 | $0 |
| Wage / Income Gap (%) | 9,093 | 42.47% |
| Wage / Income Gap ($) | 9,093 | 57.53¢ per $1 |
| Gini / Inequality Index | 9,093 | 0.40 |
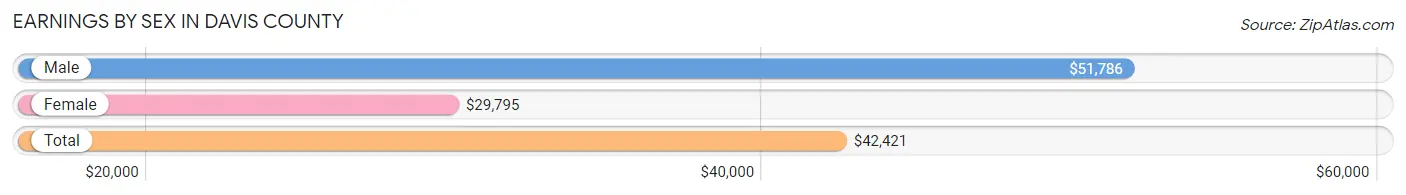
Earnings by Sex in Davis County
Average Earnings in Davis County are $42,421, $51,786 for men and $29,795 for women, a difference of 42.5%.
| Sex | Number | Average Earnings |
| Male | 2,718 (59.2%) | $51,786 |
| Female | 1,877 (40.8%) | $29,795 |
| Total | 4,595 (100.0%) | $42,421 |
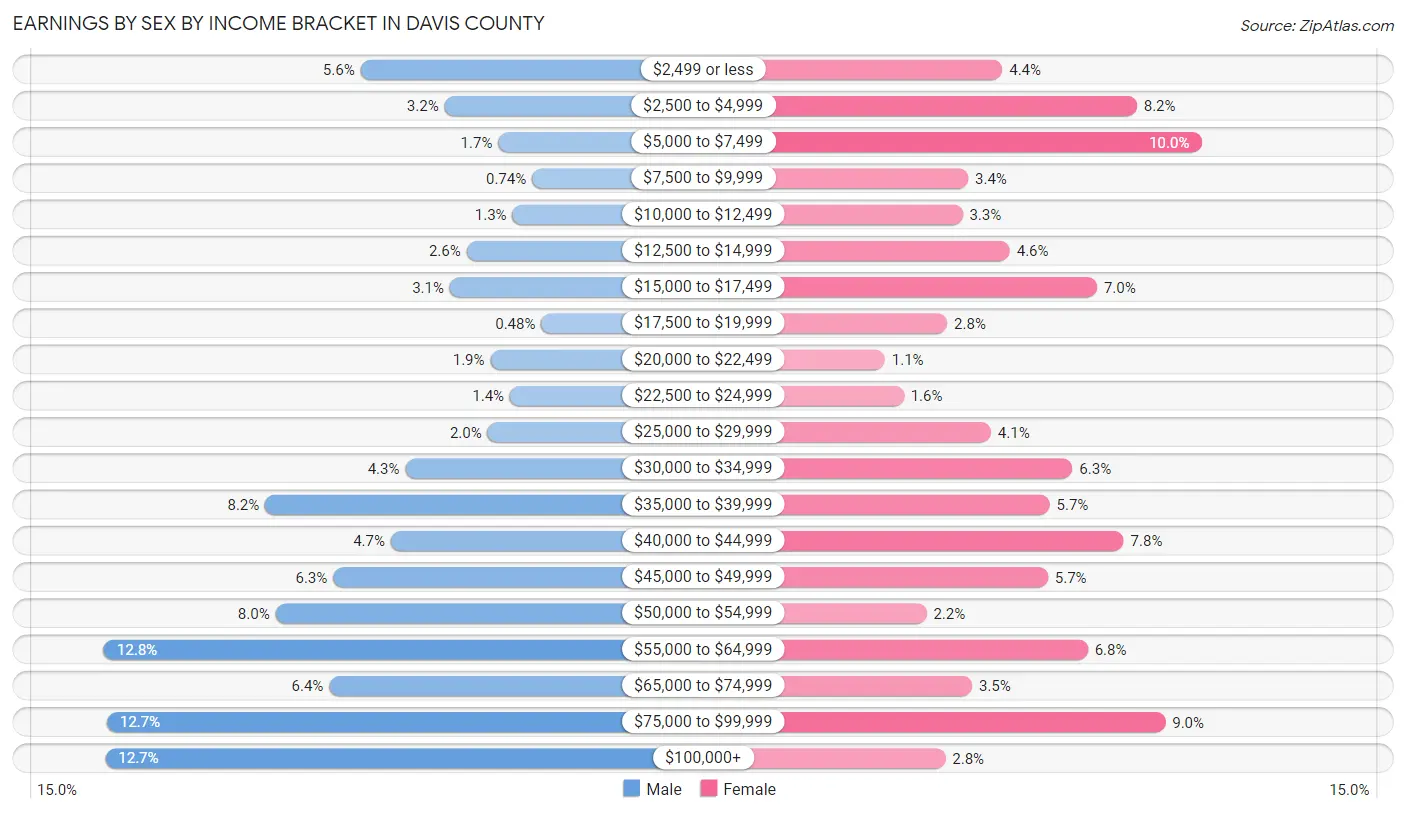
Earnings by Sex by Income Bracket in Davis County
The most common earnings brackets in Davis County are $55,000 to $64,999 for men (347 | 12.8%) and $5,000 to $7,499 for women (187 | 10.0%).
| Income | Male | Female |
| $2,499 or less | 151 (5.6%) | 82 (4.4%) |
| $2,500 to $4,999 | 87 (3.2%) | 153 (8.2%) |
| $5,000 to $7,499 | 46 (1.7%) | 187 (10.0%) |
| $7,500 to $9,999 | 20 (0.7%) | 64 (3.4%) |
| $10,000 to $12,499 | 35 (1.3%) | 61 (3.3%) |
| $12,500 to $14,999 | 70 (2.6%) | 86 (4.6%) |
| $15,000 to $17,499 | 83 (3.0%) | 132 (7.0%) |
| $17,500 to $19,999 | 13 (0.5%) | 53 (2.8%) |
| $20,000 to $22,499 | 52 (1.9%) | 20 (1.1%) |
| $22,500 to $24,999 | 37 (1.4%) | 30 (1.6%) |
| $25,000 to $29,999 | 54 (2.0%) | 76 (4.1%) |
| $30,000 to $34,999 | 117 (4.3%) | 119 (6.3%) |
| $35,000 to $39,999 | 224 (8.2%) | 107 (5.7%) |
| $40,000 to $44,999 | 128 (4.7%) | 146 (7.8%) |
| $45,000 to $49,999 | 172 (6.3%) | 106 (5.7%) |
| $50,000 to $54,999 | 216 (8.0%) | 42 (2.2%) |
| $55,000 to $64,999 | 347 (12.8%) | 127 (6.8%) |
| $65,000 to $74,999 | 175 (6.4%) | 66 (3.5%) |
| $75,000 to $99,999 | 345 (12.7%) | 168 (8.9%) |
| $100,000+ | 346 (12.7%) | 52 (2.8%) |
| Total | 2,718 (100.0%) | 1,877 (100.0%) |
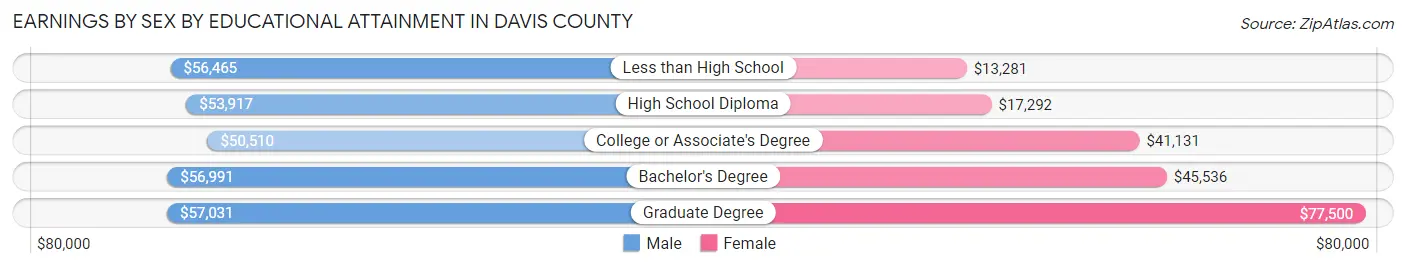
Earnings by Sex by Educational Attainment in Davis County
Average earnings in Davis County are $54,908 for men and $37,336 for women, a difference of 32.0%. Men with an educational attainment of graduate degree enjoy the highest average annual earnings of $57,031, while those with college or associate's degree education earn the least with $50,510. Women with an educational attainment of graduate degree earn the most with the average annual earnings of $77,500, while those with less than high school education have the smallest earnings of $13,281.
| Educational Attainment | Male Income | Female Income |
| Less than High School | $56,465 | $13,281 |
| High School Diploma | $53,917 | $17,292 |
| College or Associate's Degree | $50,510 | $41,131 |
| Bachelor's Degree | $56,991 | $45,536 |
| Graduate Degree | $57,031 | $77,500 |
| Total | $54,908 | $37,336 |
Family Income in Davis County
Family Income Brackets in Davis County
According to the Davis County family income data, there are 610 families falling into the $75,000 to $99,999 income range, which is the most common income bracket and makes up 25.2% of all families. Conversely, the $10,000 to $14,999 income bracket is the least frequent group with only 5 families (0.2%) belonging to this category.
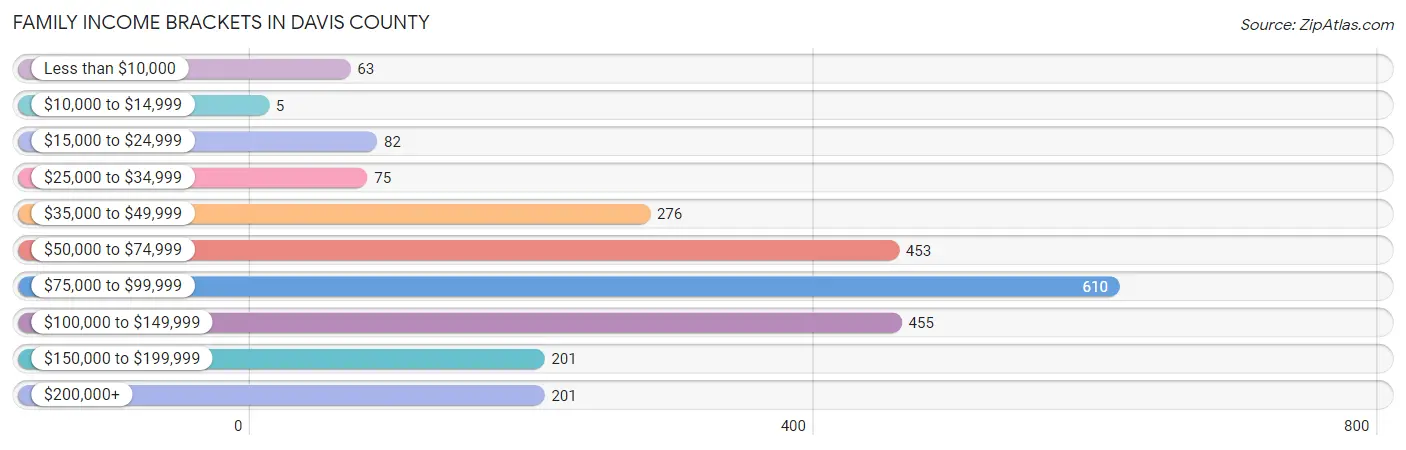
| Income Bracket | # Families | % Families |
| Less than $10,000 | 63 | 2.6% |
| $10,000 to $14,999 | 5 | 0.2% |
| $15,000 to $24,999 | 82 | 3.4% |
| $25,000 to $34,999 | 75 | 3.1% |
| $35,000 to $49,999 | 276 | 11.4% |
| $50,000 to $74,999 | 453 | 18.7% |
| $75,000 to $99,999 | 610 | 25.2% |
| $100,000 to $149,999 | 455 | 18.8% |
| $150,000 to $199,999 | 201 | 8.3% |
| $200,000+ | 201 | 8.3% |
Family Income by Famaliy Size in Davis County
7+ person families (210 | 8.7%) account for the highest median family income in Davis County with $113,269 per family, while 2-person families (1,159 | 47.8%) have the highest median income of $42,660 per family member.
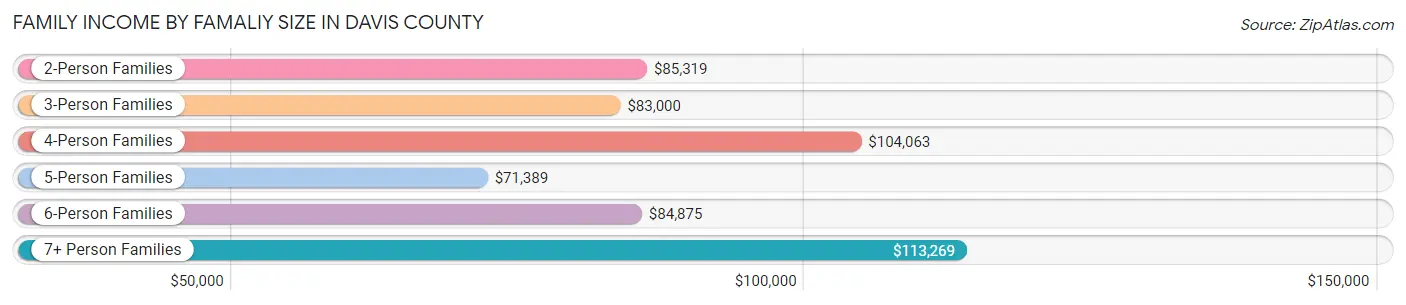
| Income Bracket | # Families | Median Income |
| 2-Person Families | 1,159 (47.8%) | $85,319 |
| 3-Person Families | 430 (17.7%) | $83,000 |
| 4-Person Families | 378 (15.6%) | $104,063 |
| 5-Person Families | 158 (6.5%) | $71,389 |
| 6-Person Families | 87 (3.6%) | $84,875 |
| 7+ Person Families | 210 (8.7%) | $113,269 |
| Total | 2,422 (100.0%) | $89,434 |
Family Income by Number of Earners in Davis County
The median family income in Davis County is $89,434, with families comprising 3+ earners (328) having the highest median family income of $101,944, while families with no earners (280) have the lowest median family income of $55,962, accounting for 13.5% and 11.6% of families, respectively.
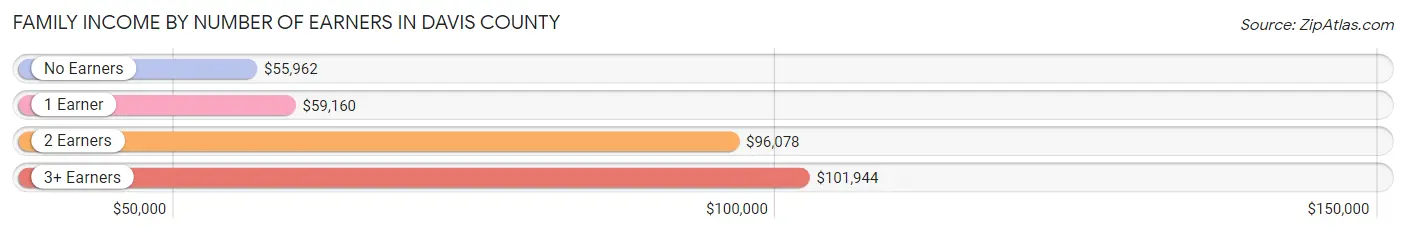
| Number of Earners | # Families | Median Income |
| No Earners | 280 (11.6%) | $55,962 |
| 1 Earner | 753 (31.1%) | $59,160 |
| 2 Earners | 1,061 (43.8%) | $96,078 |
| 3+ Earners | 328 (13.5%) | $101,944 |
| Total | 2,422 (100.0%) | $89,434 |
Household Income in Davis County
Household Income Brackets in Davis County
With 669 households falling in the category, the $75,000 to $99,999 income range is the most frequent in Davis County, accounting for 21.1% of all households. In contrast, only 102 households (3.2%) fall into the less than $10,000 income bracket, making it the least populous group.
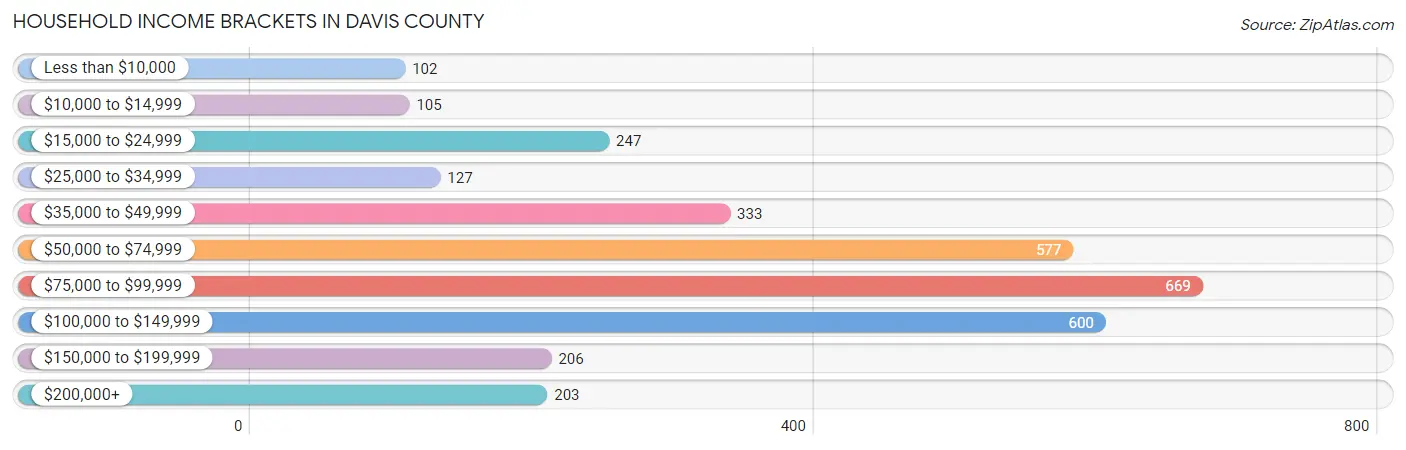
| Income Bracket | # Households | % Households |
| Less than $10,000 | 102 | 3.2% |
| $10,000 to $14,999 | 105 | 3.3% |
| $15,000 to $24,999 | 247 | 7.8% |
| $25,000 to $34,999 | 127 | 4.0% |
| $35,000 to $49,999 | 333 | 10.5% |
| $50,000 to $74,999 | 577 | 18.2% |
| $75,000 to $99,999 | 669 | 21.1% |
| $100,000 to $149,999 | 600 | 18.9% |
| $150,000 to $199,999 | 206 | 6.5% |
| $200,000+ | 203 | 6.4% |
Household Income by Householder Age in Davis County
The median household income in Davis County is $77,176, with the highest median household income of $95,718 found in the 45 to 64 years age bracket for the primary householder. A total of 1,171 households (36.9%) fall into this category. Meanwhile, the 65+ years age bracket for the primary householder has the lowest median household income of $48,981, with 960 households (30.3%) in this group.
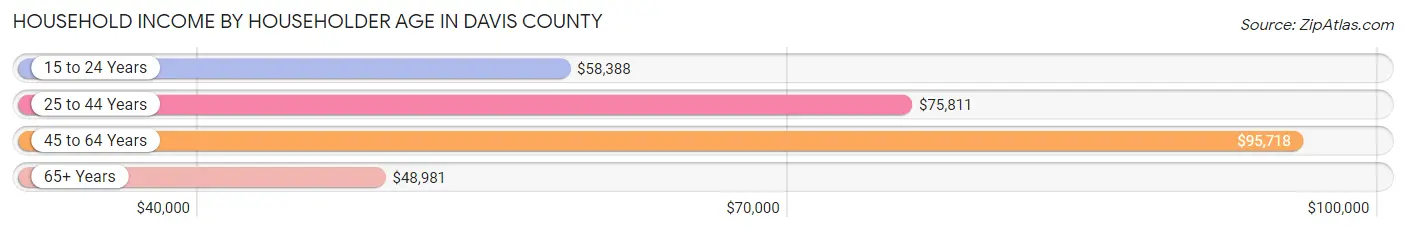
| Income Bracket | # Households | Median Income |
| 15 to 24 Years | 103 (3.3%) | $58,388 |
| 25 to 44 Years | 938 (29.6%) | $75,811 |
| 45 to 64 Years | 1,171 (36.9%) | $95,718 |
| 65+ Years | 960 (30.3%) | $48,981 |
| Total | 3,172 (100.0%) | $77,176 |
Poverty in Davis County
Income Below Poverty by Sex and Age in Davis County
With 7.9% poverty level for males and 11.0% for females among the residents of Davis County, 5 year old males and 16 and 17 year old females are the most vulnerable to poverty, with 25 males (41.7%) and 43 females (31.2%) in their respective age groups living below the poverty level.
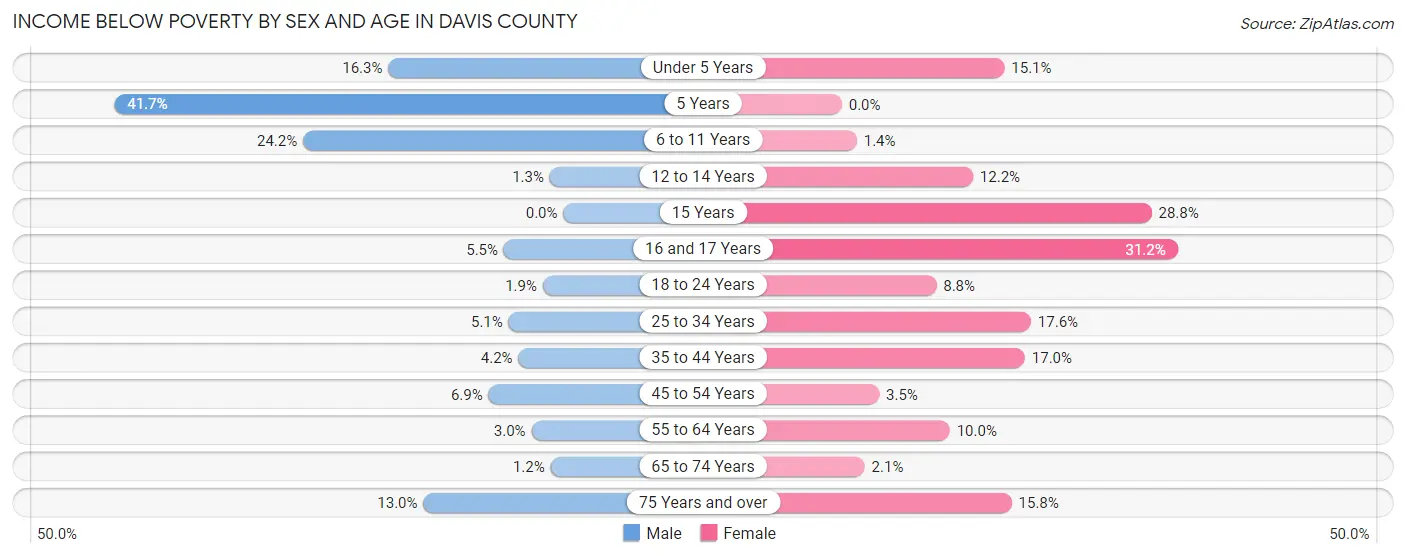
| Age Bracket | Male | Female |
| Under 5 Years | 72 (16.3%) | 56 (15.1%) |
| 5 Years | 25 (41.7%) | 0 (0.0%) |
| 6 to 11 Years | 101 (24.2%) | 6 (1.4%) |
| 12 to 14 Years | 3 (1.3%) | 23 (12.2%) |
| 15 Years | 0 (0.0%) | 23 (28.7%) |
| 16 and 17 Years | 8 (5.5%) | 43 (31.2%) |
| 18 to 24 Years | 7 (1.9%) | 30 (8.8%) |
| 25 to 34 Years | 27 (5.1%) | 83 (17.5%) |
| 35 to 44 Years | 21 (4.2%) | 79 (17.0%) |
| 45 to 54 Years | 35 (6.9%) | 16 (3.5%) |
| 55 to 64 Years | 17 (3.0%) | 53 (10.0%) |
| 65 to 74 Years | 5 (1.2%) | 9 (2.1%) |
| 75 Years and over | 40 (13.0%) | 61 (15.8%) |
| Total | 361 (7.9%) | 482 (11.0%) |
Income Above Poverty by Sex and Age in Davis County
According to the poverty statistics in Davis County, males aged 15 years and females aged 5 years are the age groups that are most secure financially, with 100.0% of males and 100.0% of females in these age groups living above the poverty line.
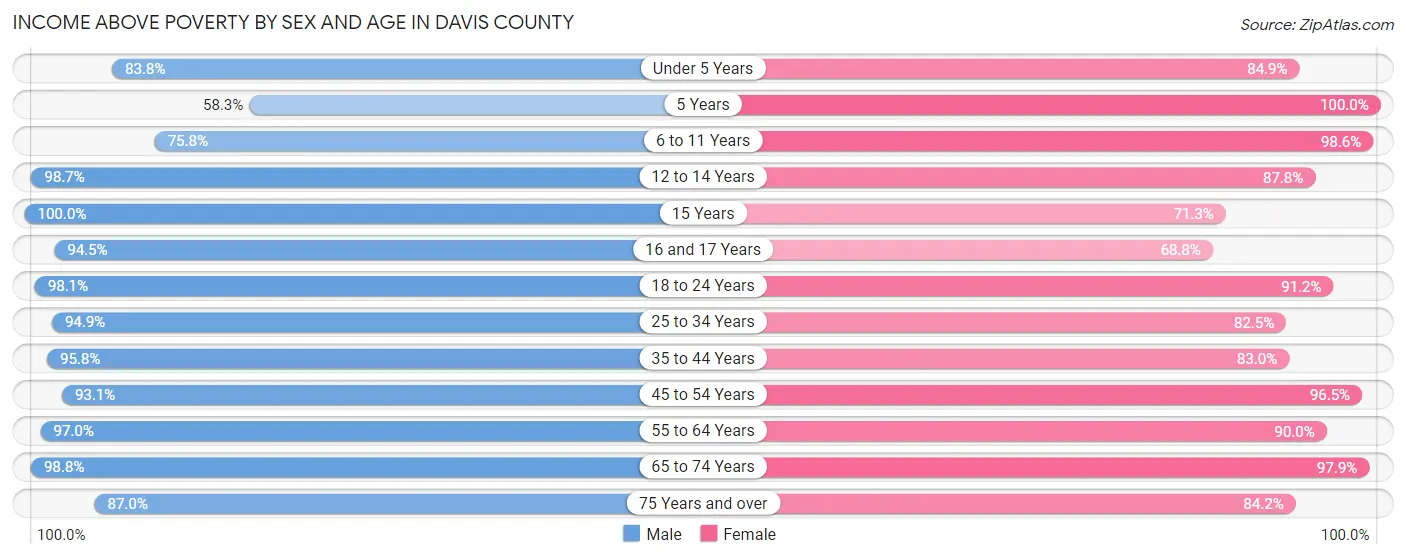
| Age Bracket | Male | Female |
| Under 5 Years | 371 (83.8%) | 315 (84.9%) |
| 5 Years | 35 (58.3%) | 81 (100.0%) |
| 6 to 11 Years | 317 (75.8%) | 425 (98.6%) |
| 12 to 14 Years | 236 (98.7%) | 166 (87.8%) |
| 15 Years | 74 (100.0%) | 57 (71.3%) |
| 16 and 17 Years | 137 (94.5%) | 95 (68.8%) |
| 18 to 24 Years | 360 (98.1%) | 312 (91.2%) |
| 25 to 34 Years | 505 (94.9%) | 390 (82.5%) |
| 35 to 44 Years | 483 (95.8%) | 386 (83.0%) |
| 45 to 54 Years | 469 (93.1%) | 446 (96.5%) |
| 55 to 64 Years | 558 (97.0%) | 476 (90.0%) |
| 65 to 74 Years | 415 (98.8%) | 415 (97.9%) |
| 75 Years and over | 268 (87.0%) | 326 (84.2%) |
| Total | 4,228 (92.1%) | 3,890 (89.0%) |
Income Below Poverty Among Married-Couple Families in Davis County
The poverty statistics for married-couple families in Davis County show that 5.5% or 116 of the total 2,109 families live below the poverty line. Families with 5 or more children have the highest poverty rate of 14.8%, comprising of 30 families. On the other hand, families with 1 or 2 children have the lowest poverty rate of 3.1%, which includes 16 families.
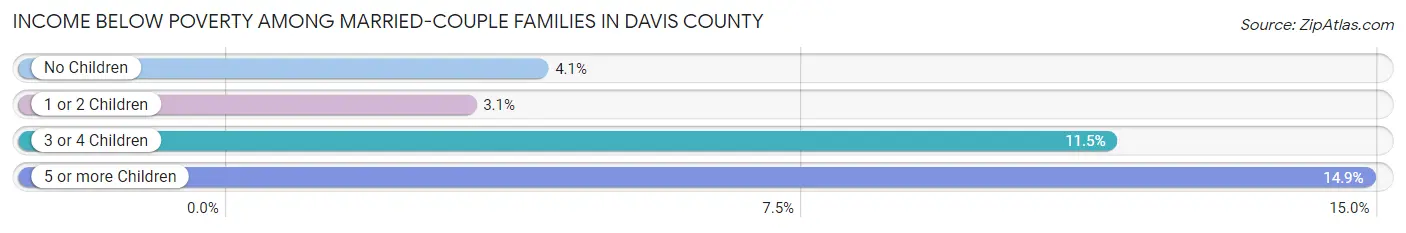
| Children | Above Poverty | Below Poverty |
| No Children | 1,160 (96.0%) | 49 (4.1%) |
| 1 or 2 Children | 499 (96.9%) | 16 (3.1%) |
| 3 or 4 Children | 162 (88.5%) | 21 (11.5%) |
| 5 or more Children | 172 (85.2%) | 30 (14.8%) |
| Total | 1,993 (94.5%) | 116 (5.5%) |
Income Below Poverty Among Single-Parent Households in Davis County
According to the poverty data in Davis County, 0.6% or 1 single-father households and 26.1% or 40 single-mother households are living below the poverty line. Among single-father households, those with no children have the highest poverty rate, with 1 households (2.3%) experiencing poverty. Likewise, among single-mother households, those with 3 or 4 children have the highest poverty rate, with 4 households (30.8%) falling below the poverty line.
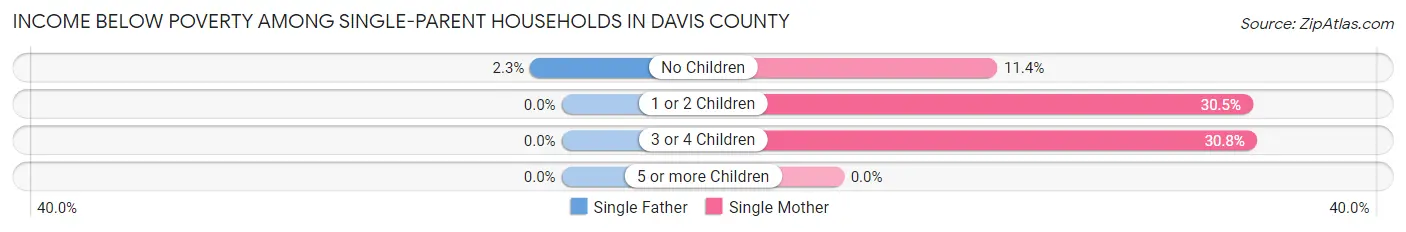
| Children | Single Father | Single Mother |
| No Children | 1 (2.3%) | 4 (11.4%) |
| 1 or 2 Children | 0 (0.0%) | 32 (30.5%) |
| 3 or 4 Children | 0 (0.0%) | 4 (30.8%) |
| 5 or more Children | 0 (0.0%) | 0 (0.0%) |
| Total | 1 (0.6%) | 40 (26.1%) |
Income Below Poverty Among Married-Couple vs Single-Parent Households in Davis County
The poverty data for Davis County shows that 116 of the married-couple family households (5.5%) and 41 of the single-parent households (13.1%) are living below the poverty level. Within the married-couple family households, those with 5 or more children have the highest poverty rate, with 30 households (14.8%) falling below the poverty line. Among the single-parent households, those with 1 or 2 children have the highest poverty rate, with 32 household (16.3%) living below poverty.
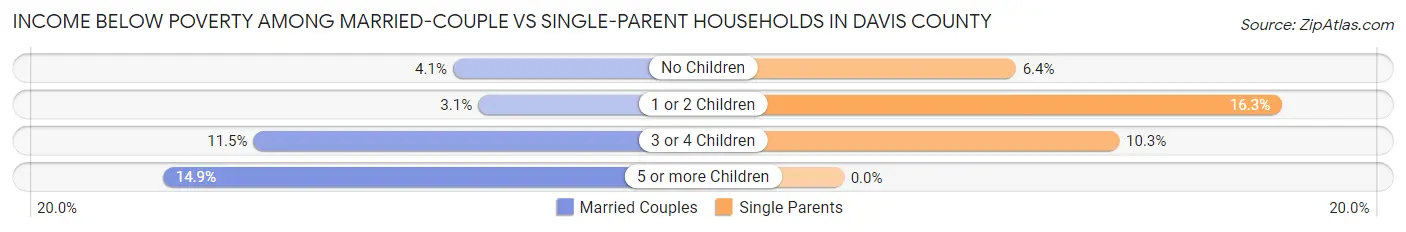
| Children | Married-Couple Families | Single-Parent Households |
| No Children | 49 (4.1%) | 5 (6.4%) |
| 1 or 2 Children | 16 (3.1%) | 32 (16.3%) |
| 3 or 4 Children | 21 (11.5%) | 4 (10.3%) |
| 5 or more Children | 30 (14.8%) | 0 (0.0%) |
| Total | 116 (5.5%) | 41 (13.1%) |
Race in Davis County
The most populous races in Davis County are White / Caucasian (8,748 | 96.2%), Hispanic or Latino (155 | 1.7%), and Some other Race (135 | 1.5%).
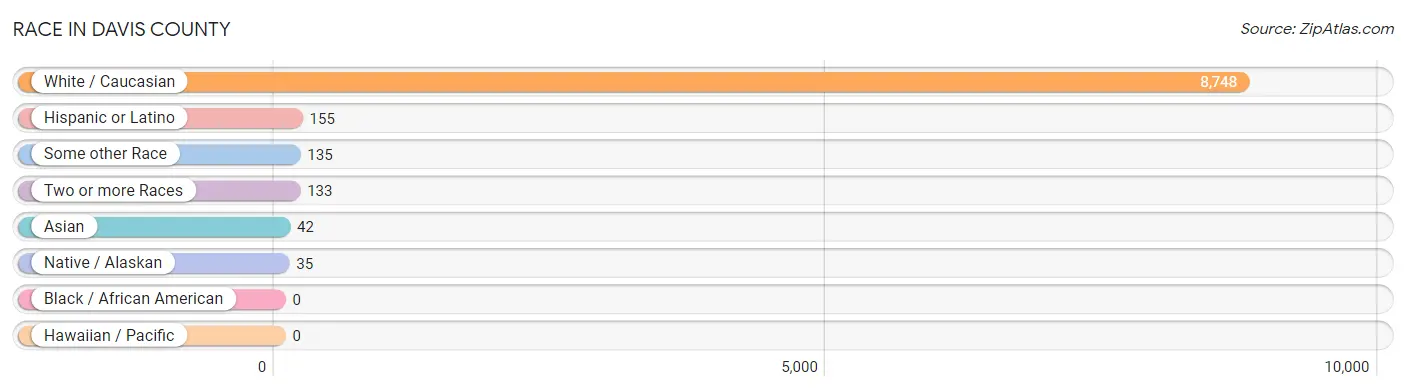
| Race | # Population | % Population |
| Asian | 42 | 0.5% |
| Black / African American | 0 | 0.0% |
| Hawaiian / Pacific | 0 | 0.0% |
| Hispanic or Latino | 155 | 1.7% |
| Native / Alaskan | 35 | 0.4% |
| White / Caucasian | 8,748 | 96.2% |
| Two or more Races | 133 | 1.5% |
| Some other Race | 135 | 1.5% |
| Total | 9,093 | 100.0% |
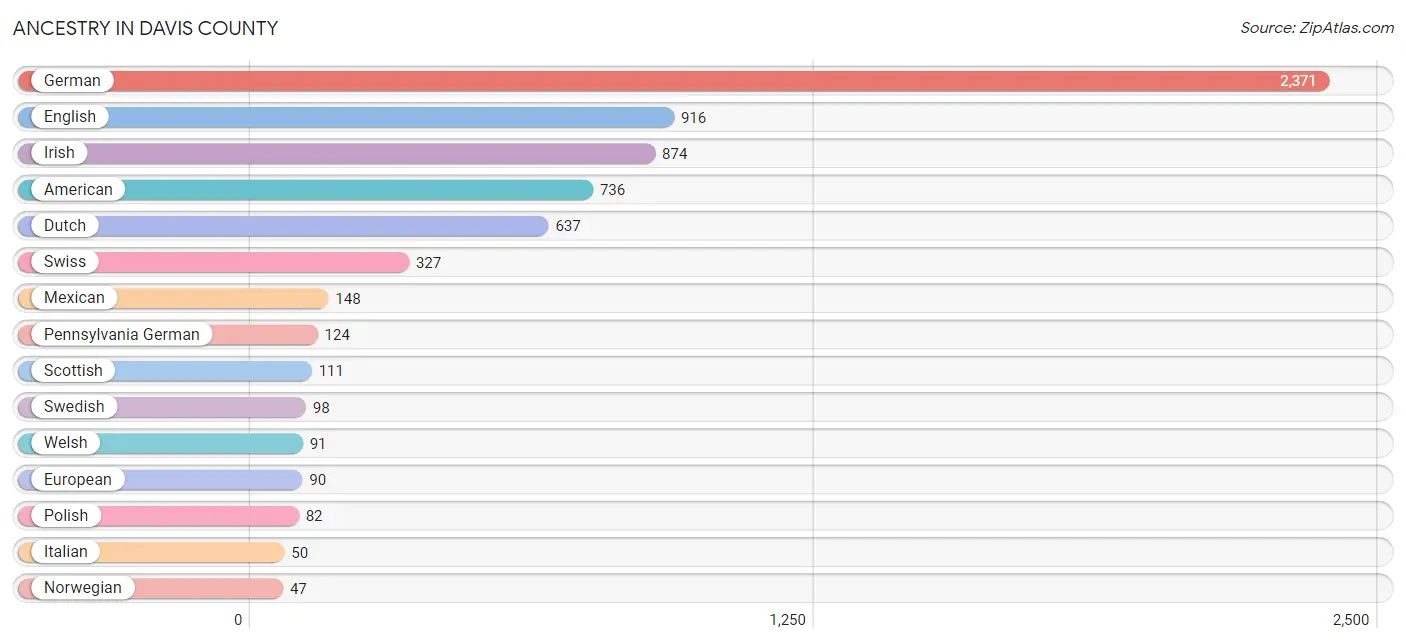
Ancestry in Davis County
The most populous ancestries reported in Davis County are German (2,371 | 26.1%), English (916 | 10.1%), Irish (874 | 9.6%), American (736 | 8.1%), and Dutch (637 | 7.0%), together accounting for 60.9% of all Davis County residents.
| Ancestry | # Population | % Population |
| American | 736 | 8.1% |
| Belgian | 7 | 0.1% |
| Bhutanese | 3 | 0.0% |
| Blackfeet | 1 | 0.0% |
| British | 22 | 0.2% |
| Burmese | 42 | 0.5% |
| Central American | 7 | 0.1% |
| Croatian | 14 | 0.2% |
| Danish | 10 | 0.1% |
| Dutch | 637 | 7.0% |
| Eastern European | 2 | 0.0% |
| English | 916 | 10.1% |
| European | 90 | 1.0% |
| French | 30 | 0.3% |
| German | 2,371 | 26.1% |
| Guatemalan | 7 | 0.1% |
| Icelander | 19 | 0.2% |
| Irish | 874 | 9.6% |
| Italian | 50 | 0.5% |
| Mexican | 148 | 1.6% |
| Mexican American Indian | 12 | 0.1% |
| Norwegian | 47 | 0.5% |
| Pennsylvania German | 124 | 1.4% |
| Polish | 82 | 0.9% |
| Portuguese | 10 | 0.1% |
| Russian | 5 | 0.1% |
| Scandinavian | 3 | 0.0% |
| Scotch-Irish | 25 | 0.3% |
| Scottish | 111 | 1.2% |
| South American Indian | 23 | 0.3% |
| Swedish | 98 | 1.1% |
| Swiss | 327 | 3.6% |
| Welsh | 91 | 1.0% | View All 33 Rows |
Immigrants in Davis County
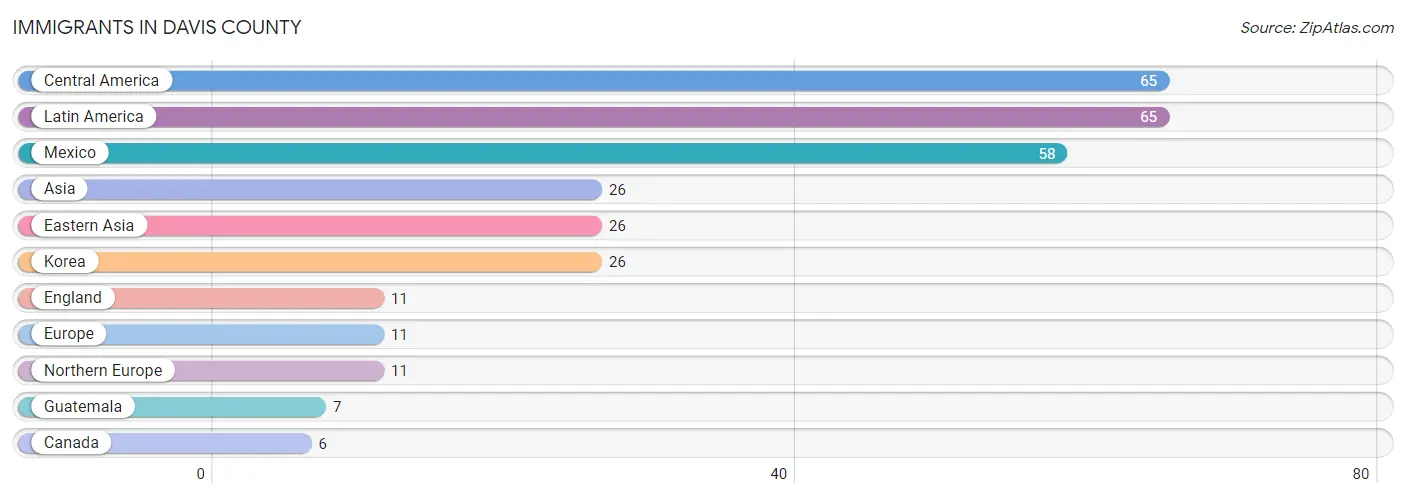
The most numerous immigrant groups reported in Davis County came from Central America (65 | 0.7%), Latin America (65 | 0.7%), Mexico (58 | 0.6%), Asia (26 | 0.3%), and Eastern Asia (26 | 0.3%), together accounting for 2.6% of all Davis County residents.
| Immigration Origin | # Population | % Population |
| Asia | 26 | 0.3% |
| Canada | 6 | 0.1% |
| Central America | 65 | 0.7% |
| Eastern Asia | 26 | 0.3% |
| England | 11 | 0.1% |
| Europe | 11 | 0.1% |
| Guatemala | 7 | 0.1% |
| Korea | 26 | 0.3% |
| Latin America | 65 | 0.7% |
| Mexico | 58 | 0.6% |
| Northern Europe | 11 | 0.1% | View All 11 Rows |
Sex and Age in Davis County
Sex and Age in Davis County
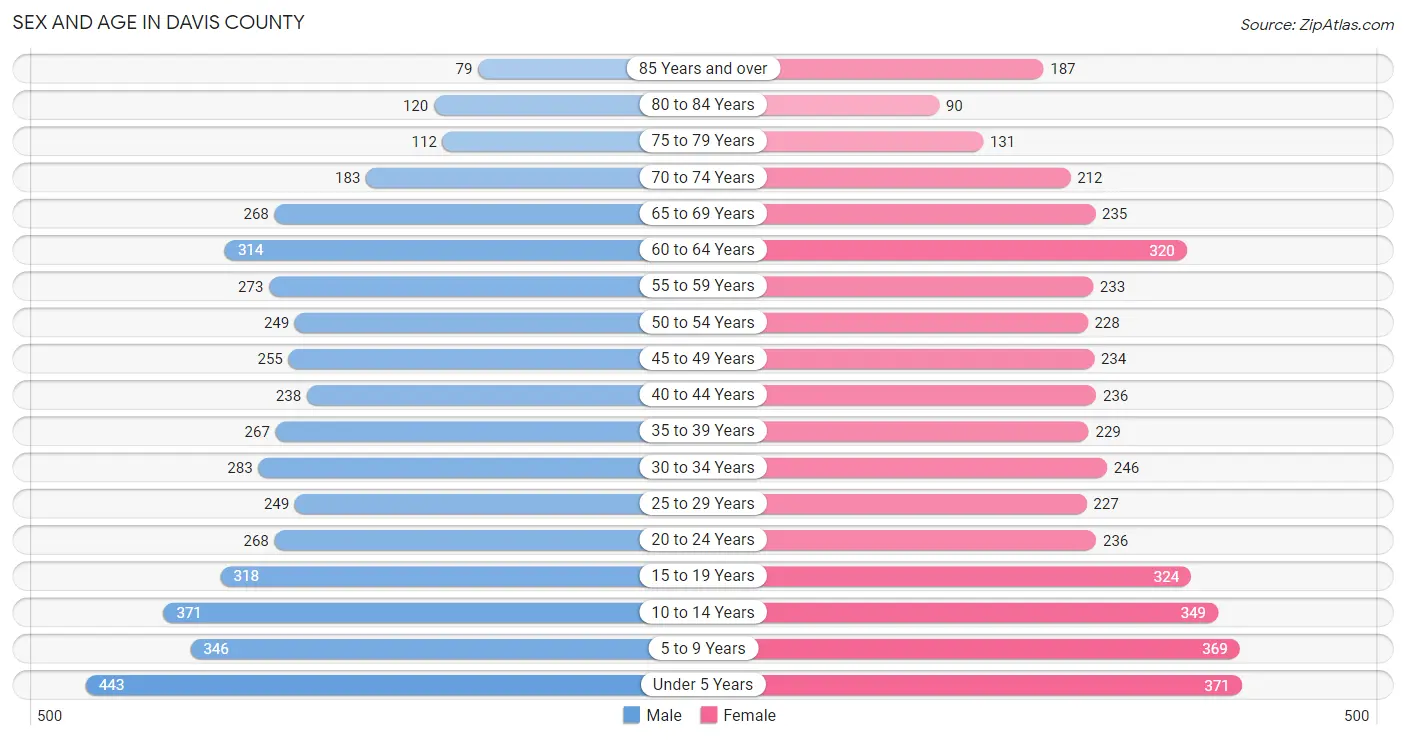
The most populous age groups in Davis County are Under 5 Years (443 | 9.6%) for men and Under 5 Years (371 | 8.3%) for women.
| Age Bracket | Male | Female |
| Under 5 Years | 443 (9.6%) | 371 (8.3%) |
| 5 to 9 Years | 346 (7.5%) | 369 (8.3%) |
| 10 to 14 Years | 371 (8.0%) | 349 (7.8%) |
| 15 to 19 Years | 318 (6.9%) | 324 (7.3%) |
| 20 to 24 Years | 268 (5.8%) | 236 (5.3%) |
| 25 to 29 Years | 249 (5.4%) | 227 (5.1%) |
| 30 to 34 Years | 283 (6.1%) | 246 (5.5%) |
| 35 to 39 Years | 267 (5.8%) | 229 (5.1%) |
| 40 to 44 Years | 238 (5.1%) | 236 (5.3%) |
| 45 to 49 Years | 255 (5.5%) | 234 (5.2%) |
| 50 to 54 Years | 249 (5.4%) | 228 (5.1%) |
| 55 to 59 Years | 273 (5.9%) | 233 (5.2%) |
| 60 to 64 Years | 314 (6.8%) | 320 (7.2%) |
| 65 to 69 Years | 268 (5.8%) | 235 (5.3%) |
| 70 to 74 Years | 183 (4.0%) | 212 (4.8%) |
| 75 to 79 Years | 112 (2.4%) | 131 (2.9%) |
| 80 to 84 Years | 120 (2.6%) | 90 (2.0%) |
| 85 Years and over | 79 (1.7%) | 187 (4.2%) |
| Total | 4,636 (100.0%) | 4,457 (100.0%) |
Families and Households in Davis County
Median Family Size in Davis County
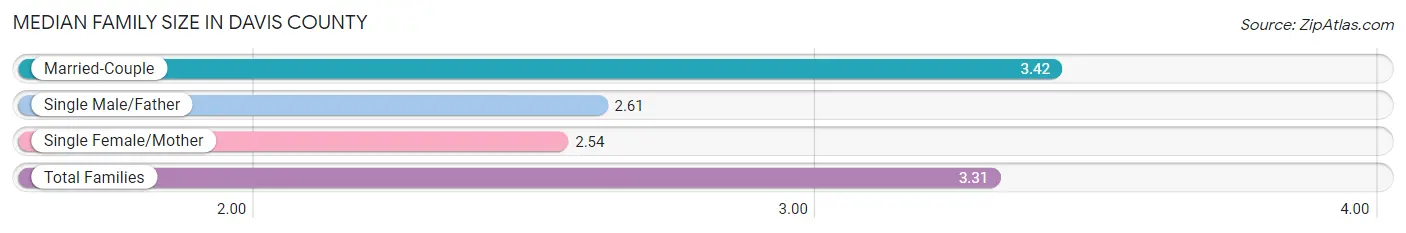
The median family size in Davis County is 3.31 persons per family, with married-couple families (2,109 | 87.1%) accounting for the largest median family size of 3.42 persons per family. On the other hand, single female/mother families (153 | 6.3%) represent the smallest median family size with 2.54 persons per family.
| Family Type | # Families | Family Size |
| Married-Couple | 2,109 (87.1%) | 3.42 |
| Single Male/Father | 160 (6.6%) | 2.61 |
| Single Female/Mother | 153 (6.3%) | 2.54 |
| Total Families | 2,422 (100.0%) | 3.31 |
Median Household Size in Davis County
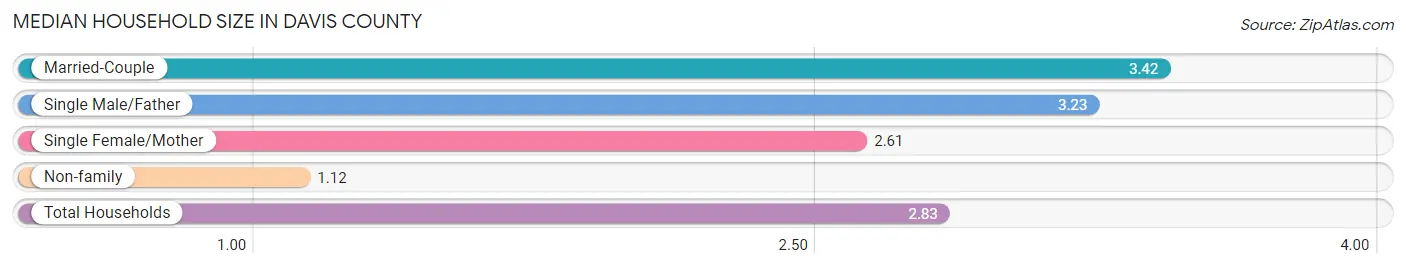
The median household size in Davis County is 2.83 persons per household, with married-couple households (2,109 | 66.5%) accounting for the largest median household size of 3.42 persons per household. non-family households (750 | 23.6%) represent the smallest median household size with 1.12 persons per household.
| Household Type | # Households | Household Size |
| Married-Couple | 2,109 (66.5%) | 3.42 |
| Single Male/Father | 160 (5.0%) | 3.23 |
| Single Female/Mother | 153 (4.8%) | 2.61 |
| Non-family | 750 (23.6%) | 1.12 |
| Total Households | 3,172 (100.0%) | 2.83 |
Household Size by Marriage Status in Davis County
Out of a total of 3,172 households in Davis County, 2,422 (76.4%) are family households, while 750 (23.6%) are nonfamily households. The most numerous type of family households are 2-person households, comprising 1,138, and the most common type of nonfamily households are 1-person households, comprising 687.
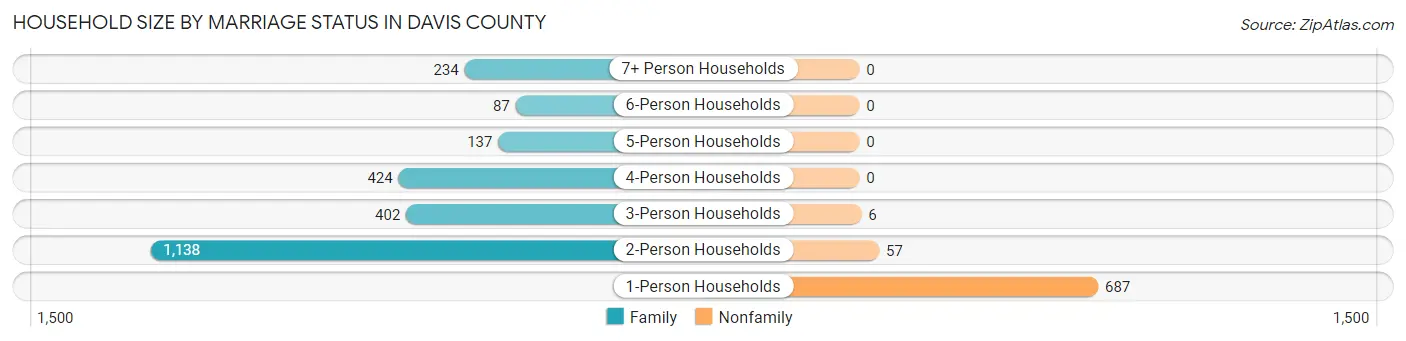
| Household Size | Family Households | Nonfamily Households |
| 1-Person Households | - | 687 (21.7%) |
| 2-Person Households | 1,138 (35.9%) | 57 (1.8%) |
| 3-Person Households | 402 (12.7%) | 6 (0.2%) |
| 4-Person Households | 424 (13.4%) | 0 (0.0%) |
| 5-Person Households | 137 (4.3%) | 0 (0.0%) |
| 6-Person Households | 87 (2.7%) | 0 (0.0%) |
| 7+ Person Households | 234 (7.4%) | 0 (0.0%) |
| Total | 2,422 (76.4%) | 750 (23.6%) |
Female Fertility in Davis County
Fertility by Age in Davis County
Average fertility rate in Davis County is 48.0 births per 1,000 women. Women in the age bracket of 20 to 34 years have the highest fertility rate with 104.0 births per 1,000 women. Women in the age bracket of 20 to 34 years acount for 86.1% of all women with births.
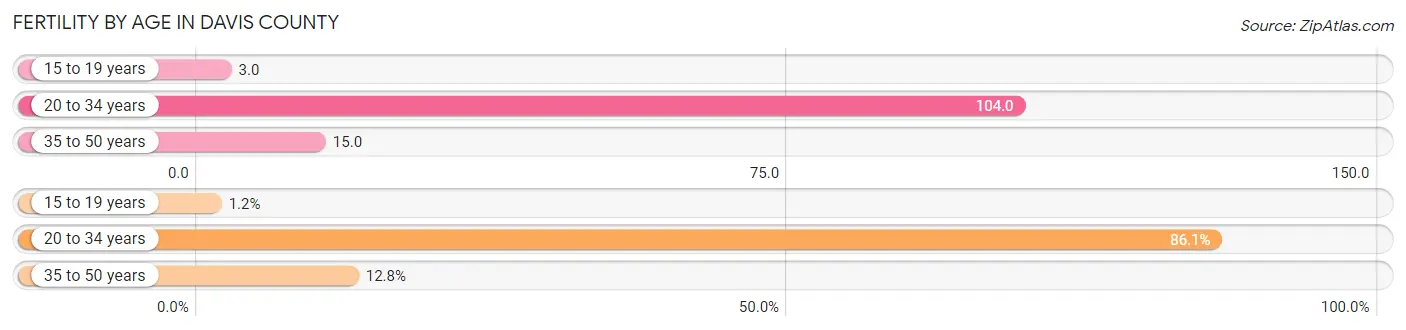
| Age Bracket | Women with Births | Births / 1,000 Women |
| 15 to 19 years | 1 (1.2%) | 3.0 |
| 20 to 34 years | 74 (86.1%) | 104.0 |
| 35 to 50 years | 11 (12.8%) | 15.0 |
| Total | 86 (100.0%) | 48.0 |
Fertility by Age by Marriage Status in Davis County
82.6% of women with births (86) in Davis County are married. The highest percentage of unmarried women with births falls into 15 to 19 years age bracket with 100.0% of them unmarried at the time of birth, while the lowest percentage of unmarried women with births belong to 20 to 34 years age bracket with 13.5% of them unmarried.
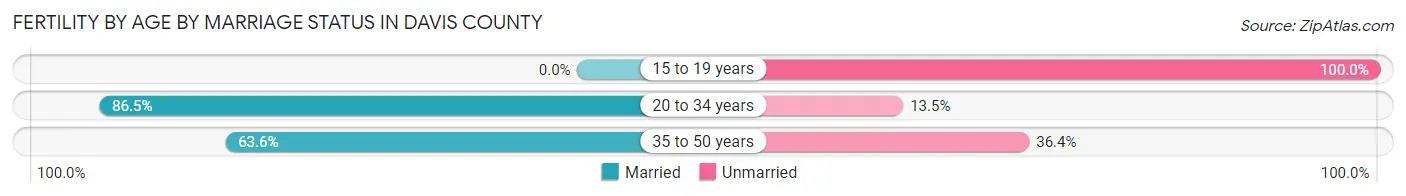
| Age Bracket | Married | Unmarried |
| 15 to 19 years | 0 (0.0%) | 1 (100.0%) |
| 20 to 34 years | 64 (86.5%) | 10 (13.5%) |
| 35 to 50 years | 7 (63.6%) | 4 (36.4%) |
| Total | 71 (82.6%) | 15 (17.4%) |
Fertility by Education in Davis County
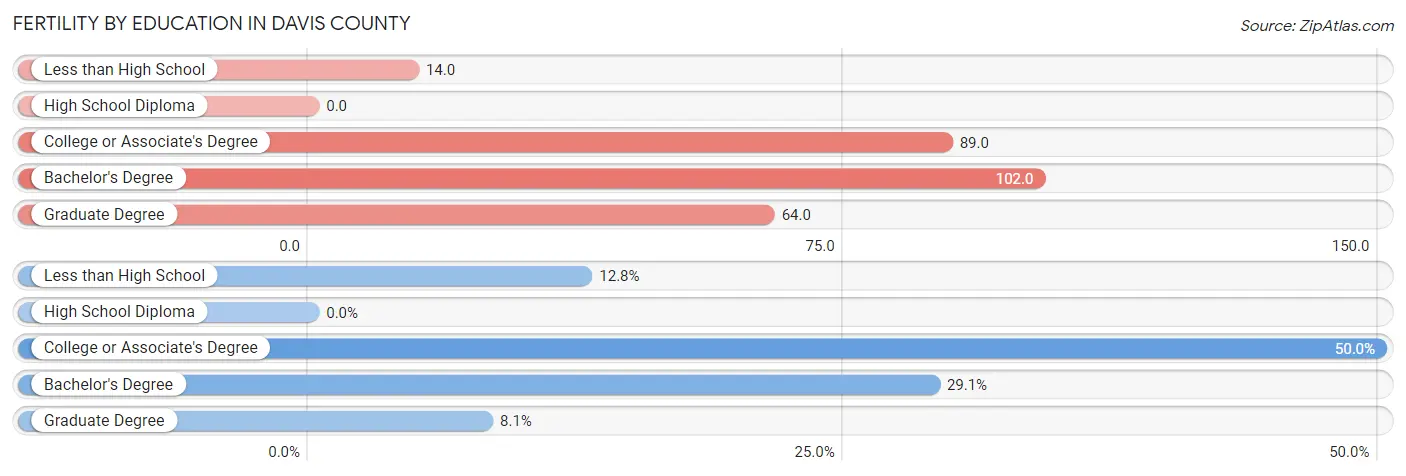
| Educational Attainment | Women with Births | Births / 1,000 Women |
| Less than High School | 11 (12.8%) | 14.0 |
| High School Diploma | 0 (0.0%) | 0.0 |
| College or Associate's Degree | 43 (50.0%) | 89.0 |
| Bachelor's Degree | 25 (29.1%) | 102.0 |
| Graduate Degree | 7 (8.1%) | 64.0 |
| Total | 86 (100.0%) | 48.0 |
Fertility by Education by Marriage Status in Davis County
17.4% of women with births in Davis County are unmarried. Women with the educational attainment of graduate degree are most likely to be married with 100.0% of them married at childbirth, while women with the educational attainment of college or associate's degree are least likely to be married with 23.3% of them unmarried at childbirth.
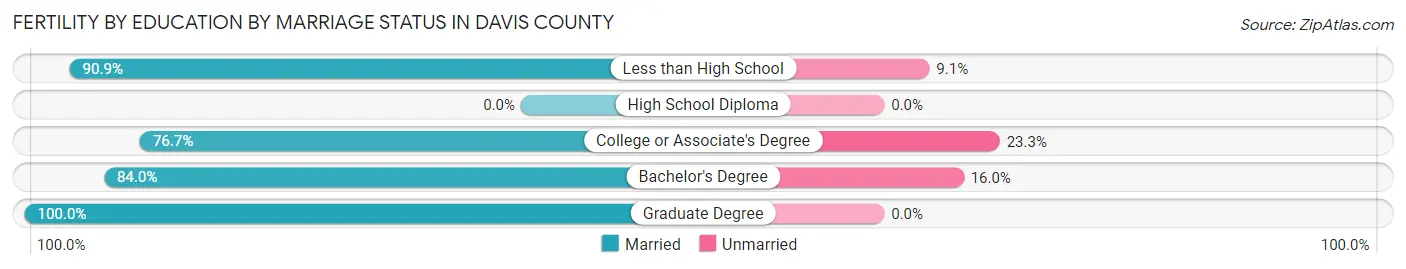
| Educational Attainment | Married | Unmarried |
| Less than High School | 10 (90.9%) | 1 (9.1%) |
| High School Diploma | 0 (0.0%) | 0 (0.0%) |
| College or Associate's Degree | 33 (76.7%) | 10 (23.3%) |
| Bachelor's Degree | 21 (84.0%) | 4 (16.0%) |
| Graduate Degree | 7 (100.0%) | 0 (0.0%) |
| Total | 71 (82.6%) | 15 (17.4%) |
Employment Characteristics in Davis County
Employment by Class of Employer in Davis County
Among the 4,002 employed individuals in Davis County, private company employees (2,222 | 55.5%), self-employed (not incorporated) (737 | 18.4%), and not-for-profit organizations (333 | 8.3%) make up the most common classes of employment.
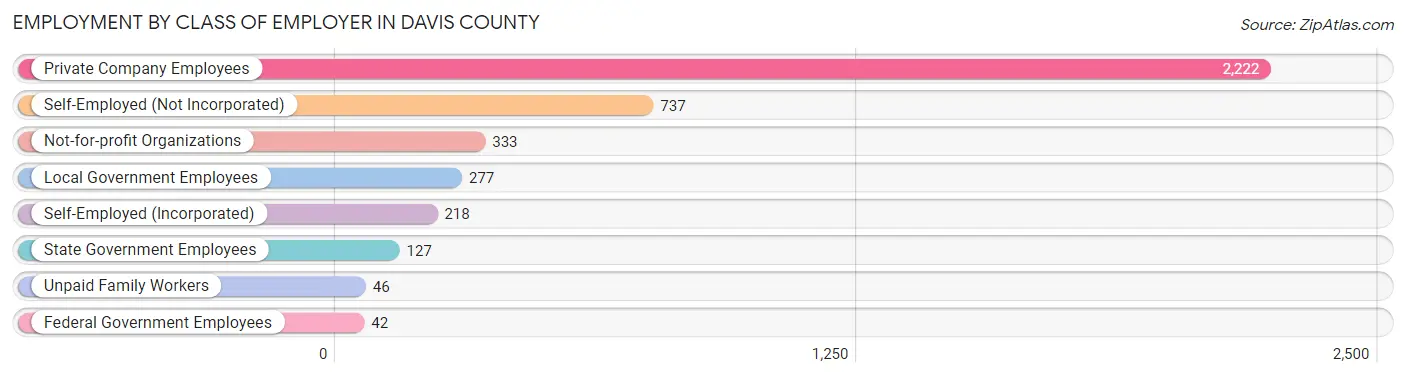
| Employer Class | # Employees | % Employees |
| Private Company Employees | 2,222 | 55.5% |
| Self-Employed (Incorporated) | 218 | 5.4% |
| Self-Employed (Not Incorporated) | 737 | 18.4% |
| Not-for-profit Organizations | 333 | 8.3% |
| Local Government Employees | 277 | 6.9% |
| State Government Employees | 127 | 3.2% |
| Federal Government Employees | 42 | 1.1% |
| Unpaid Family Workers | 46 | 1.1% |
| Total | 4,002 | 100.0% |
Employment Status by Age in Davis County
According to the labor force statistics for Davis County, out of the total population over 16 years of age (6,690), 62.6% or 4,188 individuals are in the labor force, with 2.0% or 84 of them unemployed. The age group with the highest labor force participation rate is 20 to 24 years, with 81.3% or 410 individuals in the labor force. Within the labor force, the 20 to 24 years age range has the highest percentage of unemployed individuals, with 4.1% or 17 of them being unemployed.

| Age Bracket | In Labor Force | Unemployed |
| 16 to 19 Years | 257 (52.7%) | 6 (2.3%) |
| 20 to 24 Years | 410 (81.3%) | 17 (4.1%) |
| 25 to 29 Years | 361 (75.8%) | 8 (2.2%) |
| 30 to 34 Years | 349 (66.0%) | 6 (1.7%) |
| 35 to 44 Years | 783 (80.7%) | 25 (3.2%) |
| 45 to 54 Years | 753 (78.0%) | 18 (2.4%) |
| 55 to 59 Years | 399 (78.9%) | 0 (0.0%) |
| 60 to 64 Years | 467 (73.7%) | 0 (0.0%) |
| 65 to 74 Years | 324 (36.1%) | 4 (1.2%) |
| 75 Years and over | 88 (12.2%) | 0 (0.0%) |
| Total | 4,188 (62.6%) | 84 (2.0%) |
Employment Status by Educational Attainment in Davis County
According to labor force statistics for Davis County, 76.3% of individuals (3,114) out of the total population between 25 and 64 years of age (4,081) are in the labor force, with 1.8% or 56 of them being unemployed. The group with the highest labor force participation rate are those with the educational attainment of bachelor's degree or higher, with 93.8% or 751 individuals in the labor force. Within the labor force, individuals with high school diploma education have the highest percentage of unemployment, with 2.7% or 20 of them being unemployed.
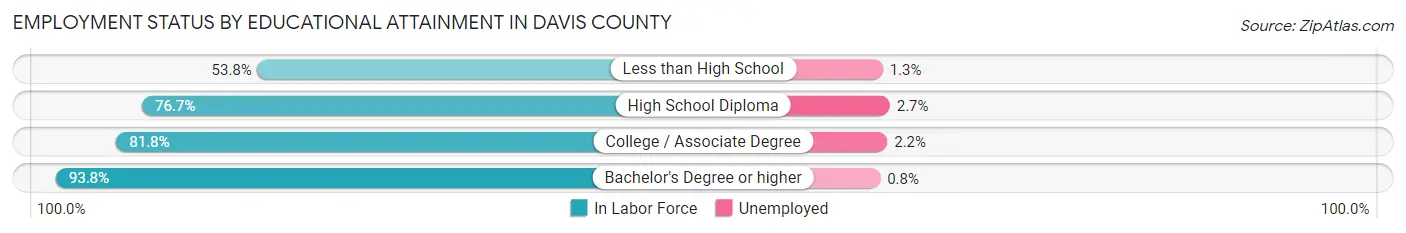
| Educational Attainment | In Labor Force | Unemployed |
| Less than High School | 523 (53.8%) | 13 (1.3%) |
| High School Diploma | 749 (76.7%) | 26 (2.7%) |
| College / Associate Degree | 1,090 (81.8%) | 29 (2.2%) |
| Bachelor's Degree or higher | 751 (93.8%) | 6 (0.8%) |
| Total | 3,114 (76.3%) | 73 (1.8%) |
Employment Occupations by Sex in Davis County
Management, Business, Science and Arts Occupations
The most common Management, Business, Science and Arts occupations in Davis County are Management (650 | 15.8%), Community & Social Service (343 | 8.4%), Health Diagnosing & Treating (241 | 5.9%), Health Technologists (198 | 4.8%), and Education Instruction & Library (195 | 4.8%).
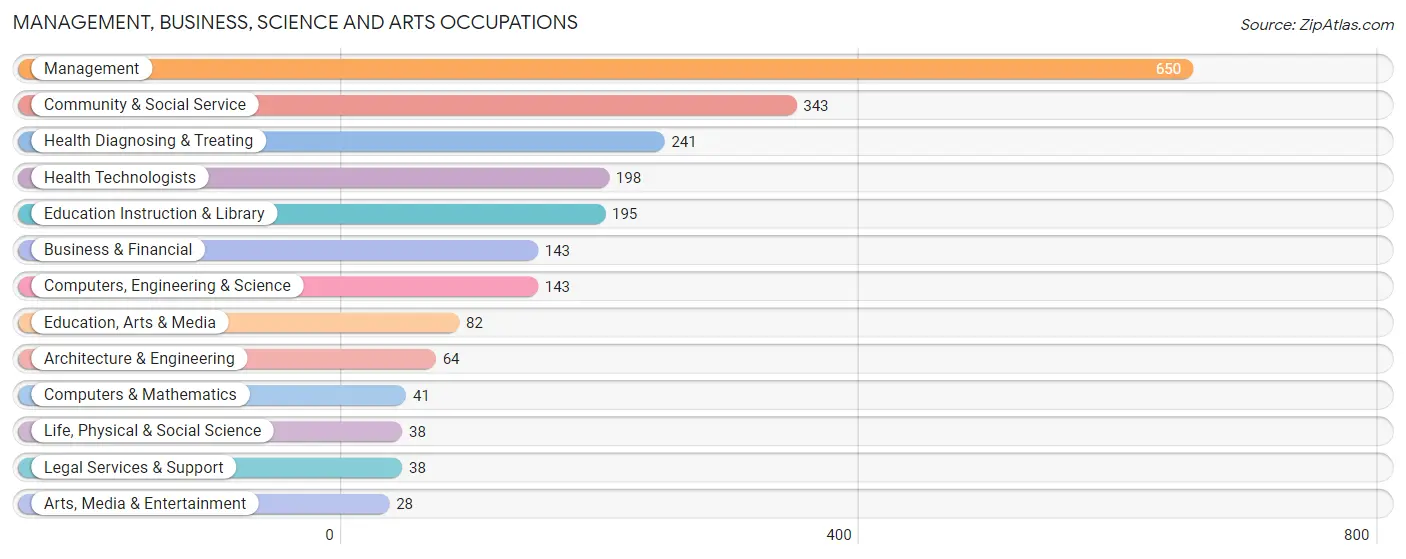
Management, Business, Science and Arts Occupations by Sex
Within the Management, Business, Science and Arts occupations in Davis County, the most male-oriented occupations are Architecture & Engineering (100.0%), Life, Physical & Social Science (94.7%), and Computers, Engineering & Science (93.0%), while the most female-oriented occupations are Legal Services & Support (100.0%), Health Technologists (89.9%), and Health Diagnosing & Treating (87.1%).
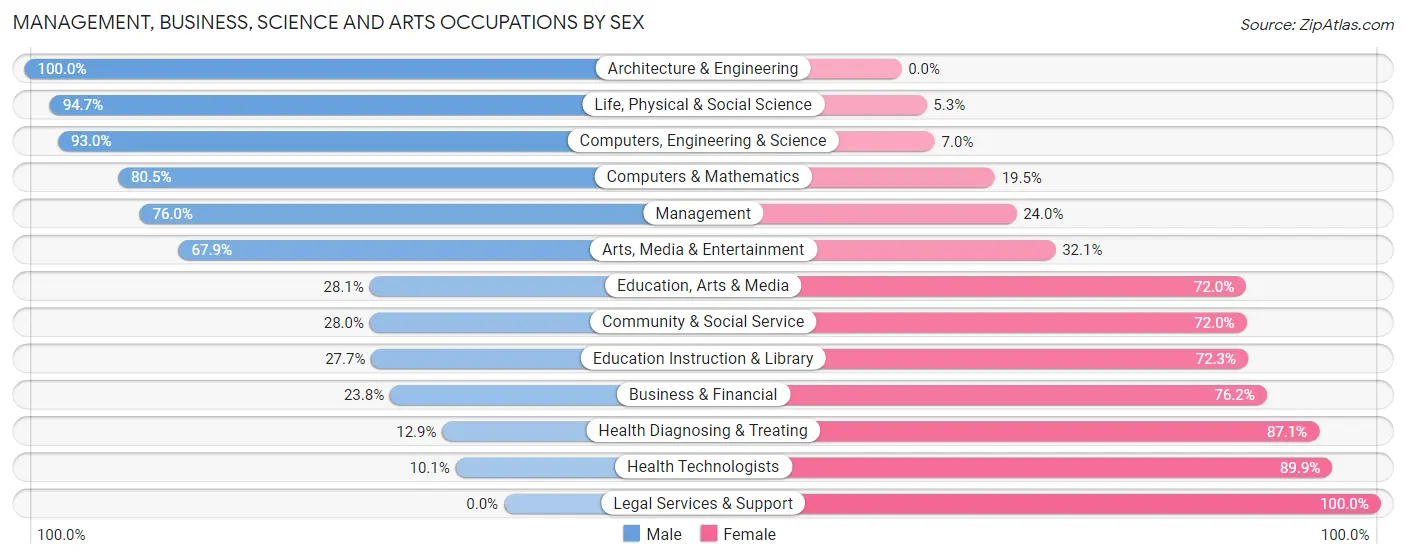
| Occupation | Male | Female |
| Management | 494 (76.0%) | 156 (24.0%) |
| Business & Financial | 34 (23.8%) | 109 (76.2%) |
| Computers, Engineering & Science | 133 (93.0%) | 10 (7.0%) |
| Computers & Mathematics | 33 (80.5%) | 8 (19.5%) |
| Architecture & Engineering | 64 (100.0%) | 0 (0.0%) |
| Life, Physical & Social Science | 36 (94.7%) | 2 (5.3%) |
| Community & Social Service | 96 (28.0%) | 247 (72.0%) |
| Education, Arts & Media | 23 (28.1%) | 59 (72.0%) |
| Legal Services & Support | 0 (0.0%) | 38 (100.0%) |
| Education Instruction & Library | 54 (27.7%) | 141 (72.3%) |
| Arts, Media & Entertainment | 19 (67.9%) | 9 (32.1%) |
| Health Diagnosing & Treating | 31 (12.9%) | 210 (87.1%) |
| Health Technologists | 20 (10.1%) | 178 (89.9%) |
| Total (Category) | 788 (51.8%) | 732 (48.2%) |
| Total (Overall) | 2,473 (60.2%) | 1,634 (39.8%) |
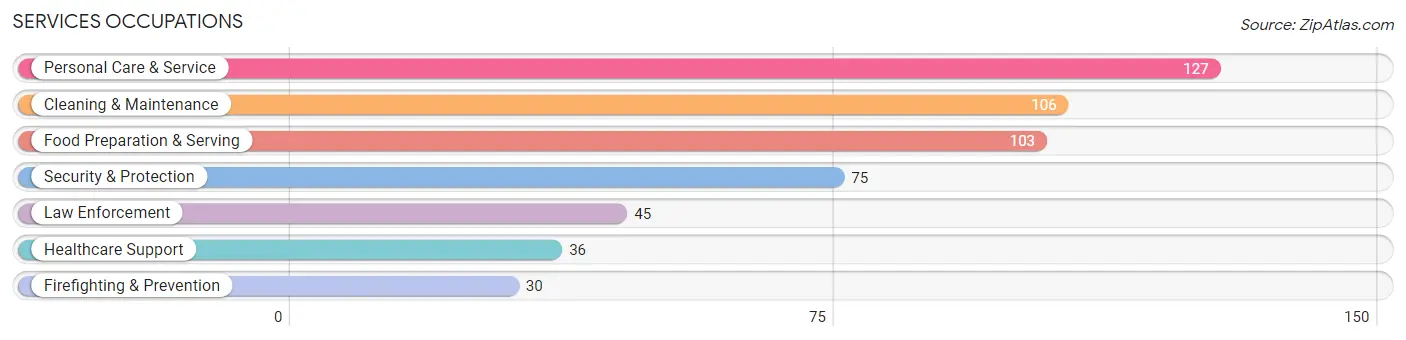
Services Occupations
The most common Services occupations in Davis County are Personal Care & Service (127 | 3.1%), Cleaning & Maintenance (106 | 2.6%), Food Preparation & Serving (103 | 2.5%), Security & Protection (75 | 1.8%), and Law Enforcement (45 | 1.1%).
Services Occupations by Sex
Within the Services occupations in Davis County, the most male-oriented occupations are Firefighting & Prevention (86.7%), Security & Protection (77.3%), and Law Enforcement (71.1%), while the most female-oriented occupations are Healthcare Support (94.4%), Food Preparation & Serving (67.0%), and Personal Care & Service (63.8%).
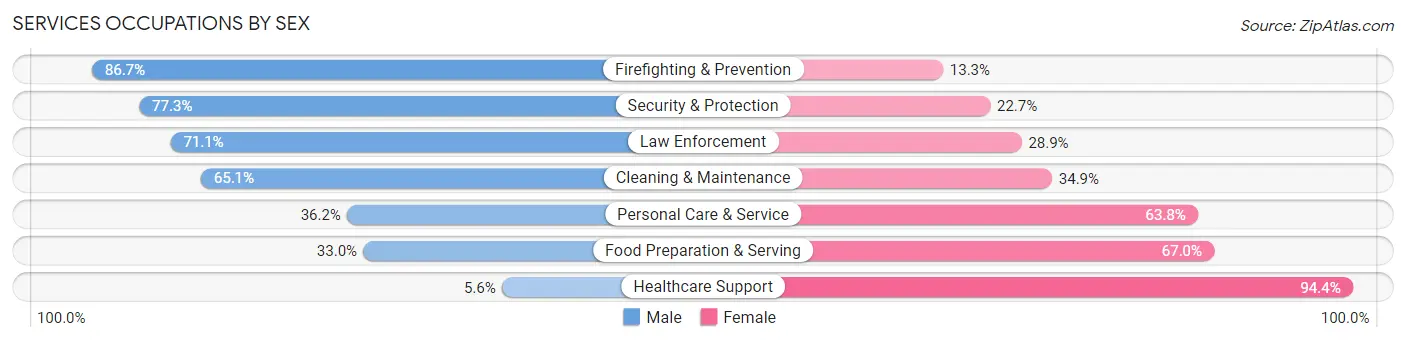
| Occupation | Male | Female |
| Healthcare Support | 2 (5.6%) | 34 (94.4%) |
| Security & Protection | 58 (77.3%) | 17 (22.7%) |
| Firefighting & Prevention | 26 (86.7%) | 4 (13.3%) |
| Law Enforcement | 32 (71.1%) | 13 (28.9%) |
| Food Preparation & Serving | 34 (33.0%) | 69 (67.0%) |
| Cleaning & Maintenance | 69 (65.1%) | 37 (34.9%) |
| Personal Care & Service | 46 (36.2%) | 81 (63.8%) |
| Total (Category) | 209 (46.8%) | 238 (53.2%) |
| Total (Overall) | 2,473 (60.2%) | 1,634 (39.8%) |
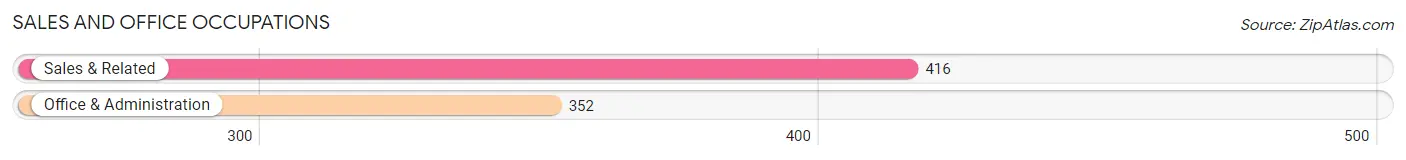
Sales and Office Occupations
The most common Sales and Office occupations in Davis County are Sales & Related (416 | 10.1%), and Office & Administration (352 | 8.6%).
Sales and Office Occupations by Sex
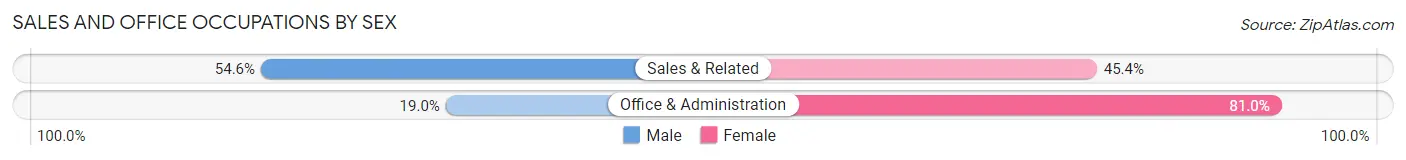
| Occupation | Male | Female |
| Sales & Related | 227 (54.6%) | 189 (45.4%) |
| Office & Administration | 67 (19.0%) | 285 (81.0%) |
| Total (Category) | 294 (38.3%) | 474 (61.7%) |
| Total (Overall) | 2,473 (60.2%) | 1,634 (39.8%) |
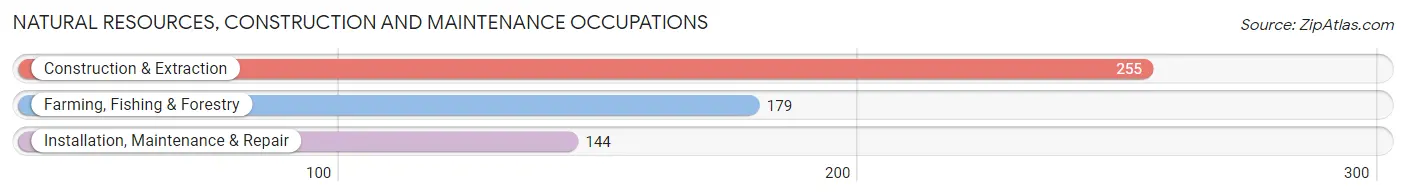
Natural Resources, Construction and Maintenance Occupations
The most common Natural Resources, Construction and Maintenance occupations in Davis County are Construction & Extraction (255 | 6.2%), Farming, Fishing & Forestry (179 | 4.4%), and Installation, Maintenance & Repair (144 | 3.5%).
Natural Resources, Construction and Maintenance Occupations by Sex
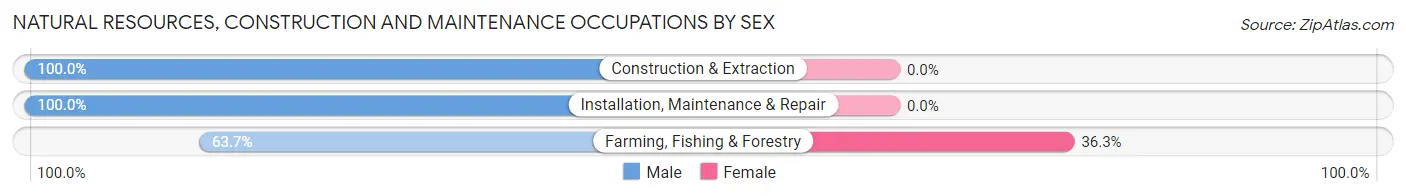
| Occupation | Male | Female |
| Farming, Fishing & Forestry | 114 (63.7%) | 65 (36.3%) |
| Construction & Extraction | 255 (100.0%) | 0 (0.0%) |
| Installation, Maintenance & Repair | 144 (100.0%) | 0 (0.0%) |
| Total (Category) | 513 (88.7%) | 65 (11.3%) |
| Total (Overall) | 2,473 (60.2%) | 1,634 (39.8%) |
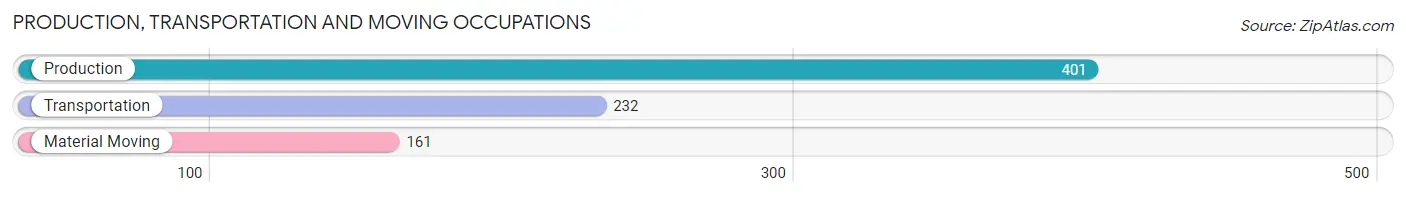
Production, Transportation and Moving Occupations
The most common Production, Transportation and Moving occupations in Davis County are Production (401 | 9.8%), Transportation (232 | 5.7%), and Material Moving (161 | 3.9%).
Production, Transportation and Moving Occupations by Sex
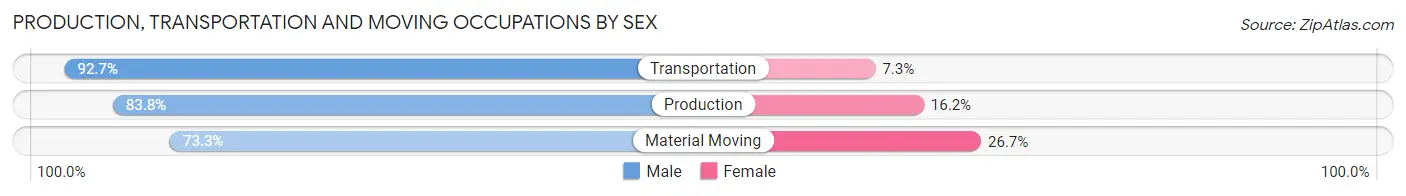
| Occupation | Male | Female |
| Production | 336 (83.8%) | 65 (16.2%) |
| Transportation | 215 (92.7%) | 17 (7.3%) |
| Material Moving | 118 (73.3%) | 43 (26.7%) |
| Total (Category) | 669 (84.3%) | 125 (15.7%) |
| Total (Overall) | 2,473 (60.2%) | 1,634 (39.8%) |
Employment Industries by Sex in Davis County
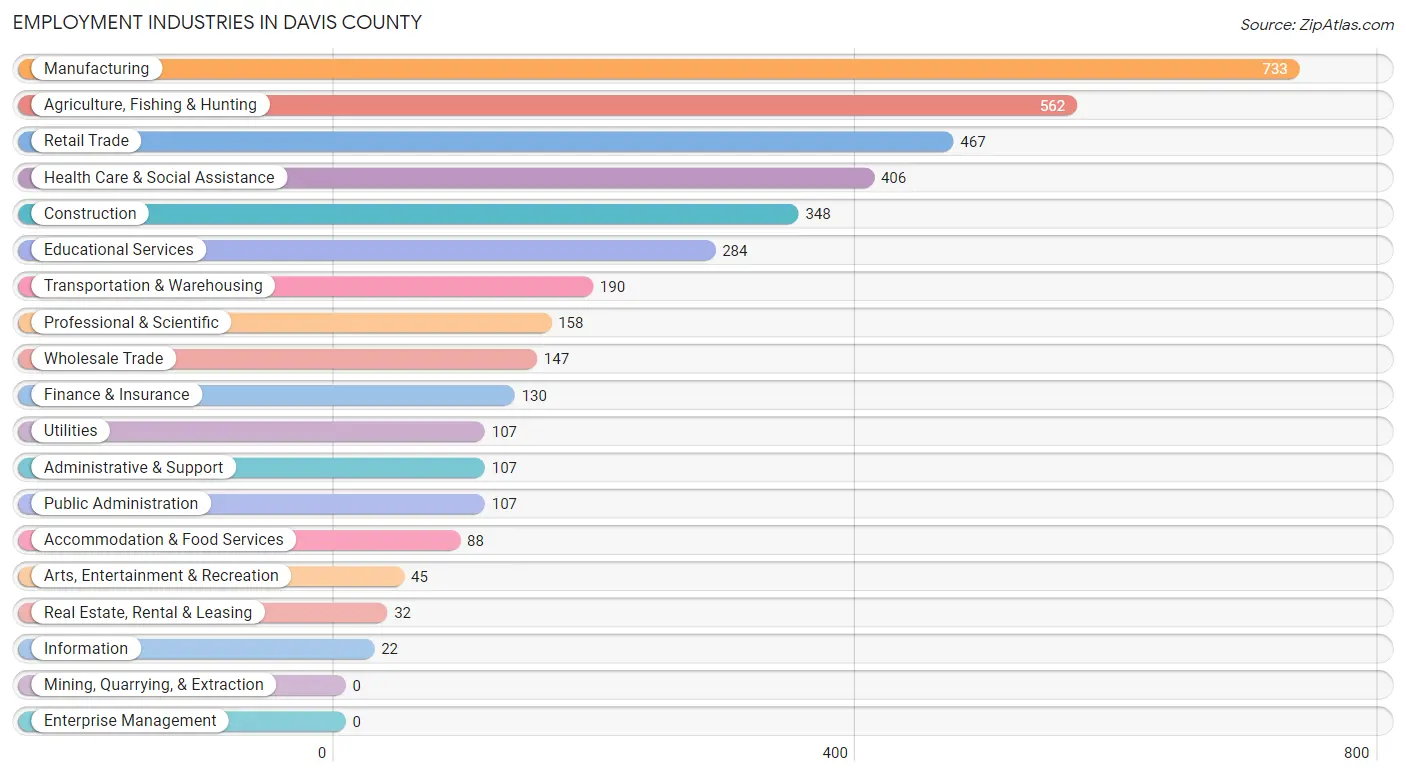
Employment Industries in Davis County
The major employment industries in Davis County include Manufacturing (733 | 17.8%), Agriculture, Fishing & Hunting (562 | 13.7%), Retail Trade (467 | 11.4%), Health Care & Social Assistance (406 | 9.9%), and Construction (348 | 8.5%).
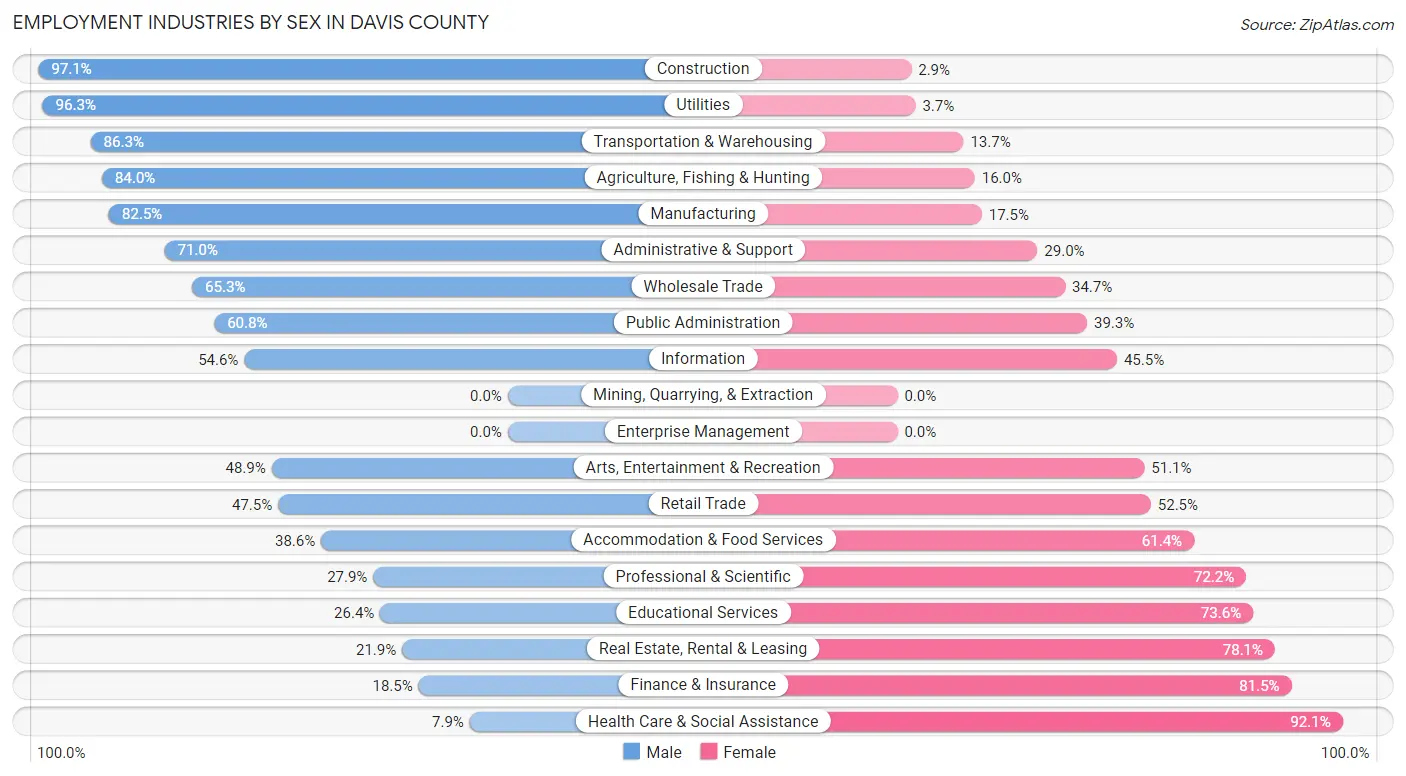
Employment Industries by Sex in Davis County
The Davis County industries that see more men than women are Construction (97.1%), Utilities (96.3%), and Transportation & Warehousing (86.3%), whereas the industries that tend to have a higher number of women are Health Care & Social Assistance (92.1%), Finance & Insurance (81.5%), and Real Estate, Rental & Leasing (78.1%).
| Industry | Male | Female |
| Agriculture, Fishing & Hunting | 472 (84.0%) | 90 (16.0%) |
| Mining, Quarrying, & Extraction | 0 (0.0%) | 0 (0.0%) |
| Construction | 338 (97.1%) | 10 (2.9%) |
| Manufacturing | 605 (82.5%) | 128 (17.5%) |
| Wholesale Trade | 96 (65.3%) | 51 (34.7%) |
| Retail Trade | 222 (47.5%) | 245 (52.5%) |
| Transportation & Warehousing | 164 (86.3%) | 26 (13.7%) |
| Utilities | 103 (96.3%) | 4 (3.7%) |
| Information | 12 (54.5%) | 10 (45.5%) |
| Finance & Insurance | 24 (18.5%) | 106 (81.5%) |
| Real Estate, Rental & Leasing | 7 (21.9%) | 25 (78.1%) |
| Professional & Scientific | 44 (27.9%) | 114 (72.2%) |
| Enterprise Management | 0 (0.0%) | 0 (0.0%) |
| Administrative & Support | 76 (71.0%) | 31 (29.0%) |
| Educational Services | 75 (26.4%) | 209 (73.6%) |
| Health Care & Social Assistance | 32 (7.9%) | 374 (92.1%) |
| Arts, Entertainment & Recreation | 22 (48.9%) | 23 (51.1%) |
| Accommodation & Food Services | 34 (38.6%) | 54 (61.4%) |
| Public Administration | 65 (60.8%) | 42 (39.3%) |
| Total | 2,473 (60.2%) | 1,634 (39.8%) |
Education in Davis County
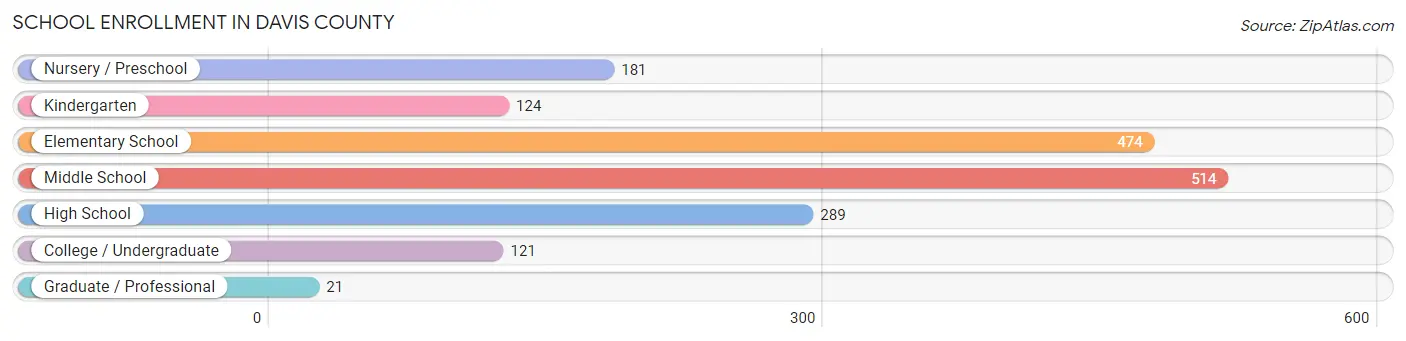
School Enrollment in Davis County
The most common levels of schooling among the 1,724 students in Davis County are middle school (514 | 29.8%), elementary school (474 | 27.5%), and high school (289 | 16.8%).
| School Level | # Students | % Students |
| Nursery / Preschool | 181 | 10.5% |
| Kindergarten | 124 | 7.2% |
| Elementary School | 474 | 27.5% |
| Middle School | 514 | 29.8% |
| High School | 289 | 16.8% |
| College / Undergraduate | 121 | 7.0% |
| Graduate / Professional | 21 | 1.2% |
| Total | 1,724 | 100.0% |
School Enrollment by Age by Funding Source in Davis County
Out of a total of 1,724 students who are enrolled in schools in Davis County, 497 (28.8%) attend a private institution, while the remaining 1,227 (71.2%) are enrolled in public schools. The age group of 25 to 34 year olds has the highest likelihood of being enrolled in private schools, with 9 (75.0% in the age bracket) enrolled. Conversely, the age group of 20 to 24 year olds has the lowest likelihood of being enrolled in a private school, with 59 (100.0% in the age bracket) attending a public institution.
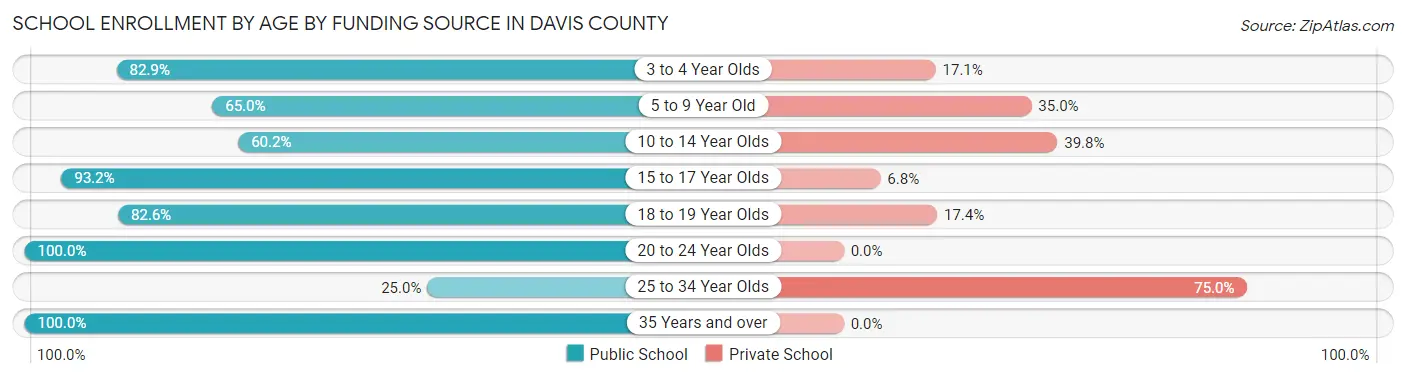
| Age Bracket | Public School | Private School |
| 3 to 4 Year Olds | 150 (82.9%) | 31 (17.1%) |
| 5 to 9 Year Old | 372 (65.0%) | 200 (35.0%) |
| 10 to 14 Year Olds | 351 (60.2%) | 232 (39.8%) |
| 15 to 17 Year Olds | 218 (93.2%) | 16 (6.8%) |
| 18 to 19 Year Olds | 38 (82.6%) | 8 (17.4%) |
| 20 to 24 Year Olds | 59 (100.0%) | 0 (0.0%) |
| 25 to 34 Year Olds | 3 (25.0%) | 9 (75.0%) |
| 35 Years and over | 37 (100.0%) | 0 (0.0%) |
| Total | 1,227 (71.2%) | 497 (28.8%) |
Educational Attainment by Field of Study in Davis County
Education (246 | 20.8%), bio, nature & agricultural (171 | 14.4%), business (168 | 14.2%), arts & humanities (150 | 12.7%), and science & technology (119 | 10.0%) are the most common fields of study among 1,185 individuals in Davis County who have obtained a bachelor's degree or higher.
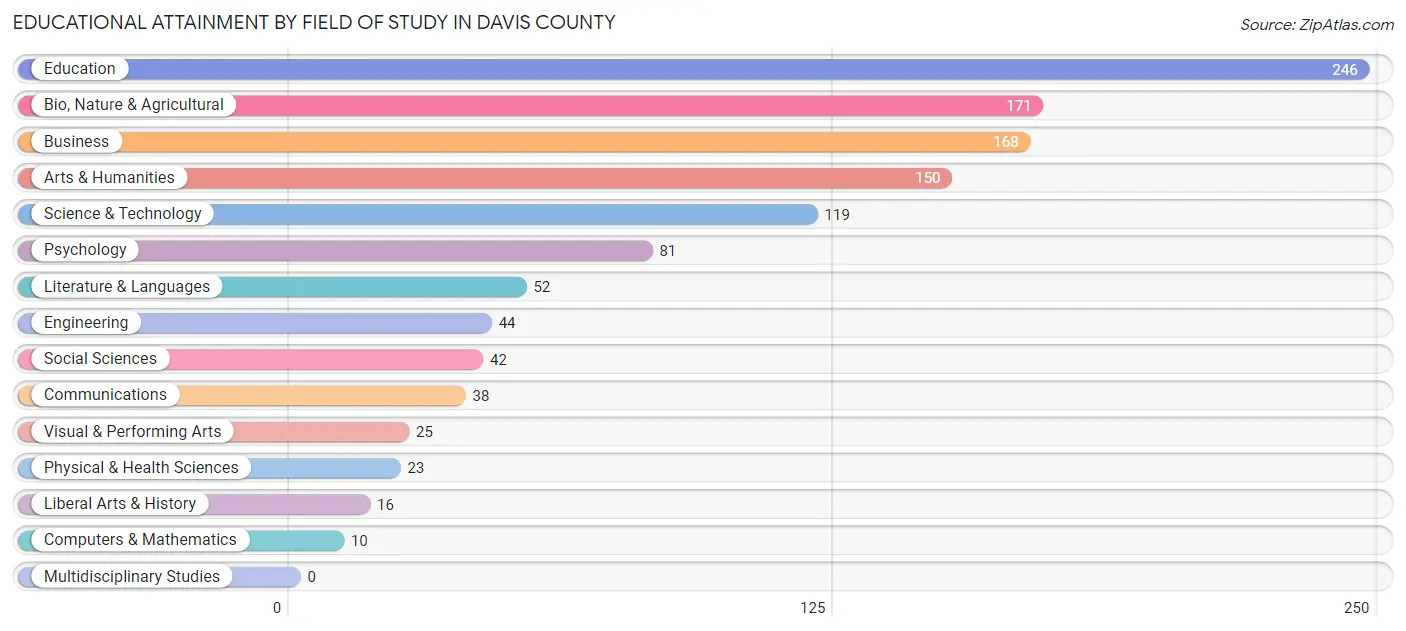
| Field of Study | # Graduates | % Graduates |
| Computers & Mathematics | 10 | 0.8% |
| Bio, Nature & Agricultural | 171 | 14.4% |
| Physical & Health Sciences | 23 | 1.9% |
| Psychology | 81 | 6.8% |
| Social Sciences | 42 | 3.5% |
| Engineering | 44 | 3.7% |
| Multidisciplinary Studies | 0 | 0.0% |
| Science & Technology | 119 | 10.0% |
| Business | 168 | 14.2% |
| Education | 246 | 20.8% |
| Literature & Languages | 52 | 4.4% |
| Liberal Arts & History | 16 | 1.3% |
| Visual & Performing Arts | 25 | 2.1% |
| Communications | 38 | 3.2% |
| Arts & Humanities | 150 | 12.7% |
| Total | 1,185 | 100.0% |
Transportation & Commute in Davis County
Vehicle Availability by Sex in Davis County
The most prevalent vehicle ownership categories in Davis County are males with 3 vehicles (644, accounting for 26.7%) and females with 3 vehicles (512, making up 40.5%).
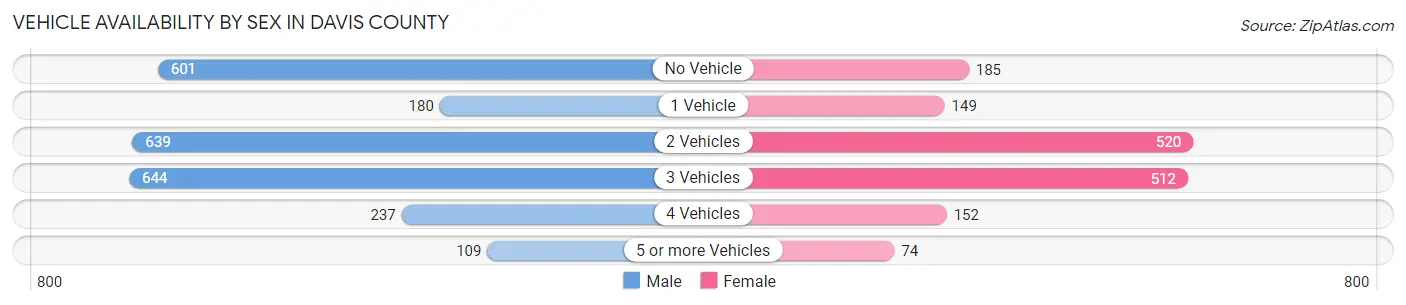
| Vehicles Available | Male | Female |
| No Vehicle | 601 (24.9%) | 185 (11.6%) |
| 1 Vehicle | 180 (7.5%) | 149 (9.4%) |
| 2 Vehicles | 639 (26.5%) | 520 (32.7%) |
| 3 Vehicles | 644 (26.7%) | 512 (32.2%) |
| 4 Vehicles | 237 (9.8%) | 152 (9.6%) |
| 5 or more Vehicles | 109 (4.5%) | 74 (4.6%) |
| Total | 2,410 (100.0%) | 1,592 (100.0%) |
Commute Time in Davis County
The most frequently occuring commute durations in Davis County are 15 to 19 minutes (470 commuters, 13.3%), 5 to 9 minutes (469 commuters, 13.3%), and 10 to 14 minutes (469 commuters, 13.3%).
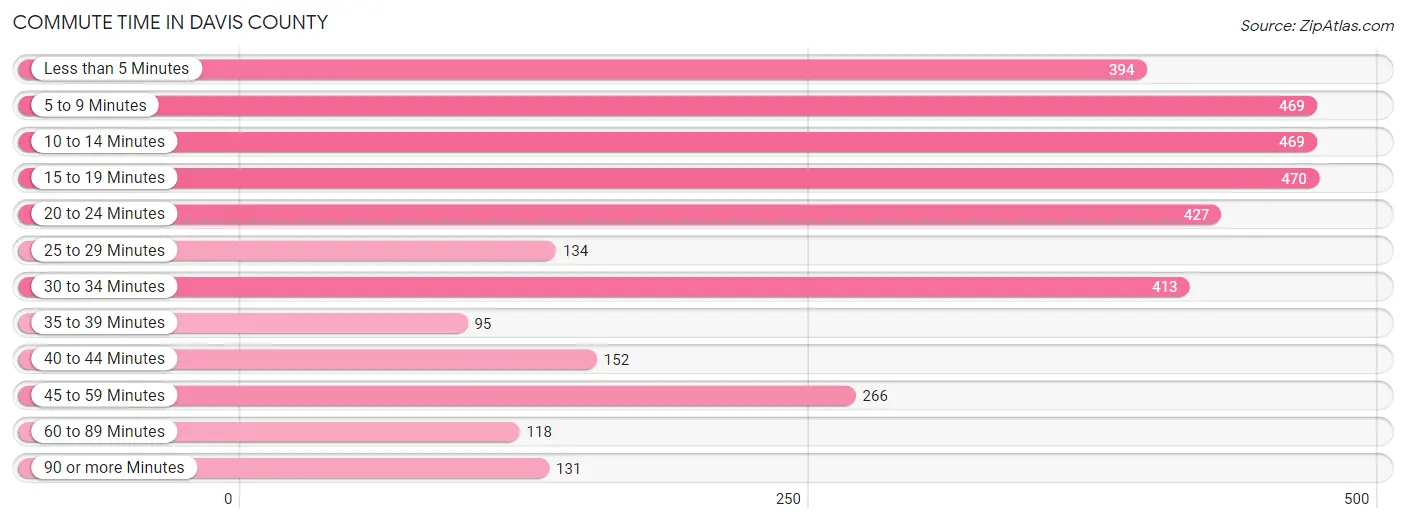
| Commute Time | # Commuters | % Commuters |
| Less than 5 Minutes | 394 | 11.1% |
| 5 to 9 Minutes | 469 | 13.3% |
| 10 to 14 Minutes | 469 | 13.3% |
| 15 to 19 Minutes | 470 | 13.3% |
| 20 to 24 Minutes | 427 | 12.1% |
| 25 to 29 Minutes | 134 | 3.8% |
| 30 to 34 Minutes | 413 | 11.7% |
| 35 to 39 Minutes | 95 | 2.7% |
| 40 to 44 Minutes | 152 | 4.3% |
| 45 to 59 Minutes | 266 | 7.5% |
| 60 to 89 Minutes | 118 | 3.3% |
| 90 or more Minutes | 131 | 3.7% |
Commute Time by Sex in Davis County
The most common commute times in Davis County are 20 to 24 minutes (300 commuters, 14.5%) for males and 5 to 9 minutes (261 commuters, 17.7%) for females.
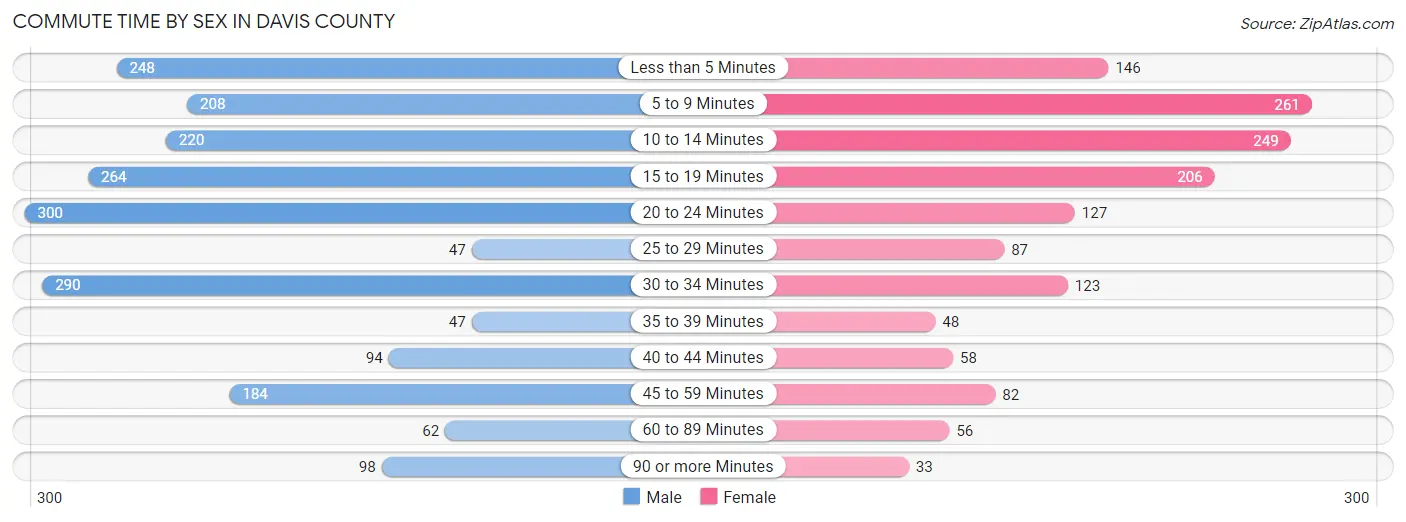
| Commute Time | Male | Female |
| Less than 5 Minutes | 248 (12.0%) | 146 (9.9%) |
| 5 to 9 Minutes | 208 (10.1%) | 261 (17.7%) |
| 10 to 14 Minutes | 220 (10.7%) | 249 (16.9%) |
| 15 to 19 Minutes | 264 (12.8%) | 206 (14.0%) |
| 20 to 24 Minutes | 300 (14.5%) | 127 (8.6%) |
| 25 to 29 Minutes | 47 (2.3%) | 87 (5.9%) |
| 30 to 34 Minutes | 290 (14.1%) | 123 (8.3%) |
| 35 to 39 Minutes | 47 (2.3%) | 48 (3.3%) |
| 40 to 44 Minutes | 94 (4.6%) | 58 (3.9%) |
| 45 to 59 Minutes | 184 (8.9%) | 82 (5.6%) |
| 60 to 89 Minutes | 62 (3.0%) | 56 (3.8%) |
| 90 or more Minutes | 98 (4.8%) | 33 (2.2%) |
Time of Departure to Work by Sex in Davis County
The most frequent times of departure to work in Davis County are 7:00 AM to 7:29 AM (398, 19.3%) for males and 7:30 AM to 7:59 AM (392, 26.6%) for females.
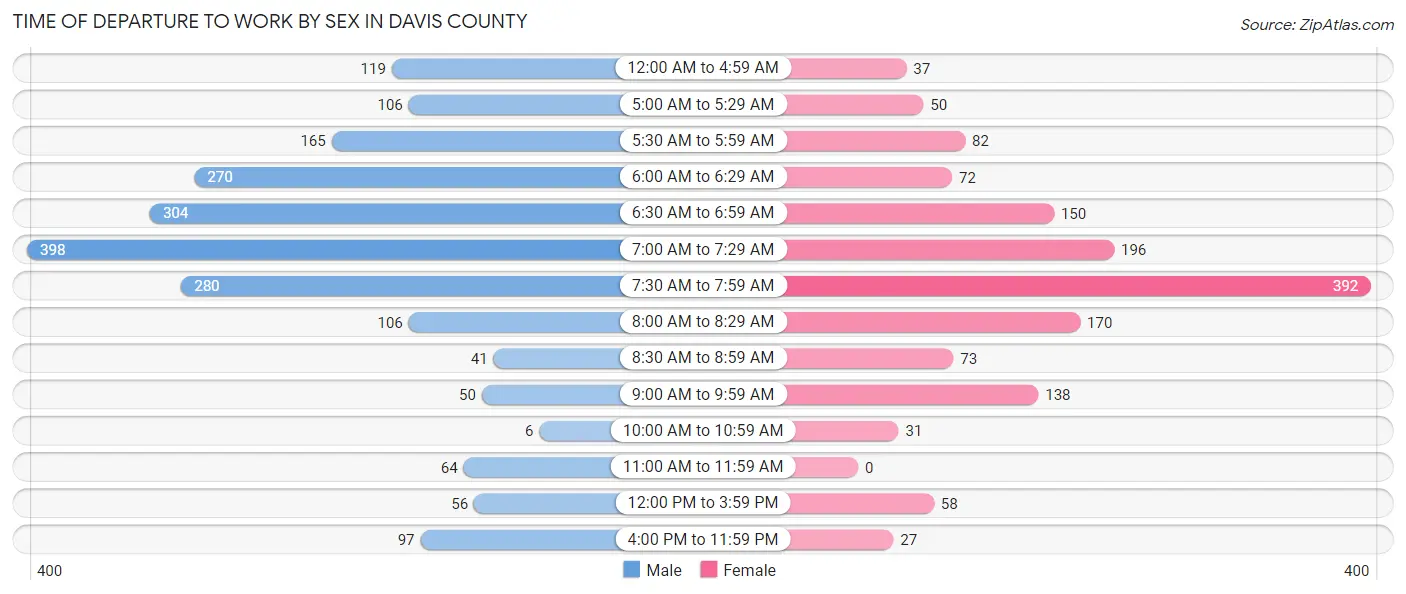
| Time of Departure | Male | Female |
| 12:00 AM to 4:59 AM | 119 (5.8%) | 37 (2.5%) |
| 5:00 AM to 5:29 AM | 106 (5.1%) | 50 (3.4%) |
| 5:30 AM to 5:59 AM | 165 (8.0%) | 82 (5.6%) |
| 6:00 AM to 6:29 AM | 270 (13.1%) | 72 (4.9%) |
| 6:30 AM to 6:59 AM | 304 (14.7%) | 150 (10.2%) |
| 7:00 AM to 7:29 AM | 398 (19.3%) | 196 (13.3%) |
| 7:30 AM to 7:59 AM | 280 (13.6%) | 392 (26.6%) |
| 8:00 AM to 8:29 AM | 106 (5.1%) | 170 (11.5%) |
| 8:30 AM to 8:59 AM | 41 (2.0%) | 73 (5.0%) |
| 9:00 AM to 9:59 AM | 50 (2.4%) | 138 (9.3%) |
| 10:00 AM to 10:59 AM | 6 (0.3%) | 31 (2.1%) |
| 11:00 AM to 11:59 AM | 64 (3.1%) | 0 (0.0%) |
| 12:00 PM to 3:59 PM | 56 (2.7%) | 58 (3.9%) |
| 4:00 PM to 11:59 PM | 97 (4.7%) | 27 (1.8%) |
| Total | 2,062 (100.0%) | 1,476 (100.0%) |
Housing Occupancy in Davis County
Occupancy by Ownership in Davis County
Of the total 3,172 dwellings in Davis County, owner-occupied units account for 2,693 (84.9%), while renter-occupied units make up 479 (15.1%).
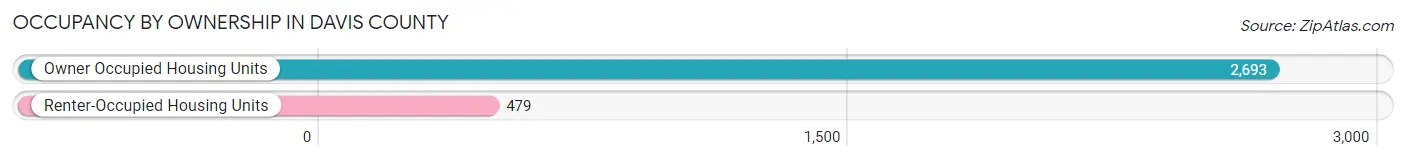
| Occupancy | # Housing Units | % Housing Units |
| Owner Occupied Housing Units | 2,693 | 84.9% |
| Renter-Occupied Housing Units | 479 | 15.1% |
| Total Occupied Housing Units | 3,172 | 100.0% |
Occupancy by Household Size in Davis County
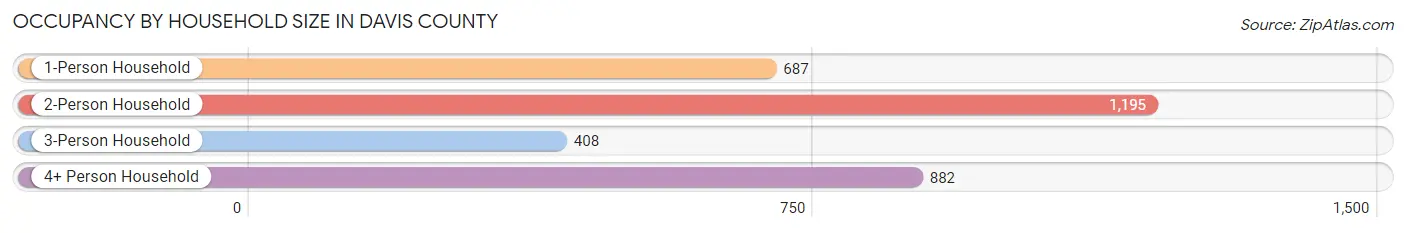
| Household Size | # Housing Units | % Housing Units |
| 1-Person Household | 687 | 21.7% |
| 2-Person Household | 1,195 | 37.7% |
| 3-Person Household | 408 | 12.9% |
| 4+ Person Household | 882 | 27.8% |
| Total Housing Units | 3,172 | 100.0% |
Occupancy by Ownership by Household Size in Davis County
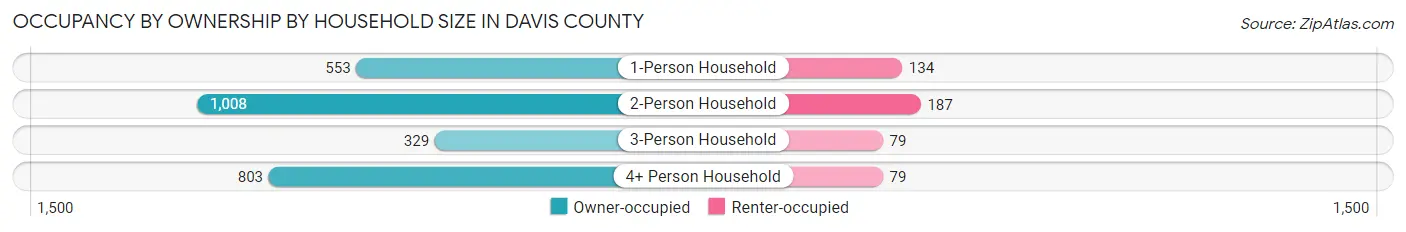
| Household Size | Owner-occupied | Renter-occupied |
| 1-Person Household | 553 (80.5%) | 134 (19.5%) |
| 2-Person Household | 1,008 (84.4%) | 187 (15.7%) |
| 3-Person Household | 329 (80.6%) | 79 (19.4%) |
| 4+ Person Household | 803 (91.0%) | 79 (9.0%) |
| Total Housing Units | 2,693 (84.9%) | 479 (15.1%) |
Occupancy by Educational Attainment in Davis County
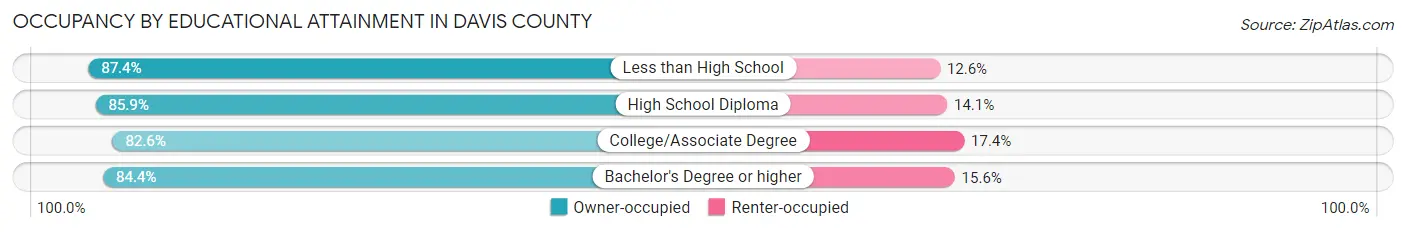
| Household Size | Owner-occupied | Renter-occupied |
| Less than High School | 532 (87.4%) | 77 (12.6%) |
| High School Diploma | 825 (85.9%) | 135 (14.1%) |
| College/Associate Degree | 777 (82.6%) | 164 (17.4%) |
| Bachelor's Degree or higher | 559 (84.4%) | 103 (15.6%) |
Occupancy by Age of Householder in Davis County
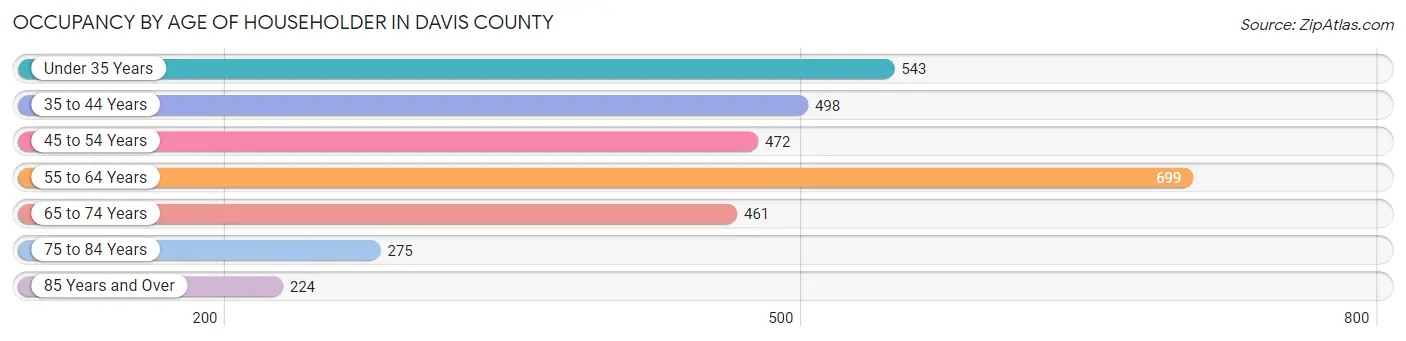
| Age Bracket | # Households | % Households |
| Under 35 Years | 543 | 17.1% |
| 35 to 44 Years | 498 | 15.7% |
| 45 to 54 Years | 472 | 14.9% |
| 55 to 64 Years | 699 | 22.0% |
| 65 to 74 Years | 461 | 14.5% |
| 75 to 84 Years | 275 | 8.7% |
| 85 Years and Over | 224 | 7.1% |
| Total | 3,172 | 100.0% |
Housing Finances in Davis County
Median Income by Occupancy in Davis County
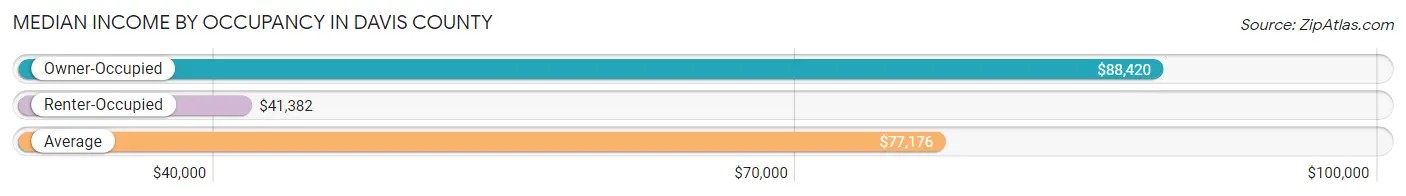
| Occupancy Type | # Households | Median Income |
| Owner-Occupied | 2,693 (84.9%) | $88,420 |
| Renter-Occupied | 479 (15.1%) | $41,382 |
| Average | 3,172 (100.0%) | $77,176 |
Occupancy by Householder Income Bracket in Davis County
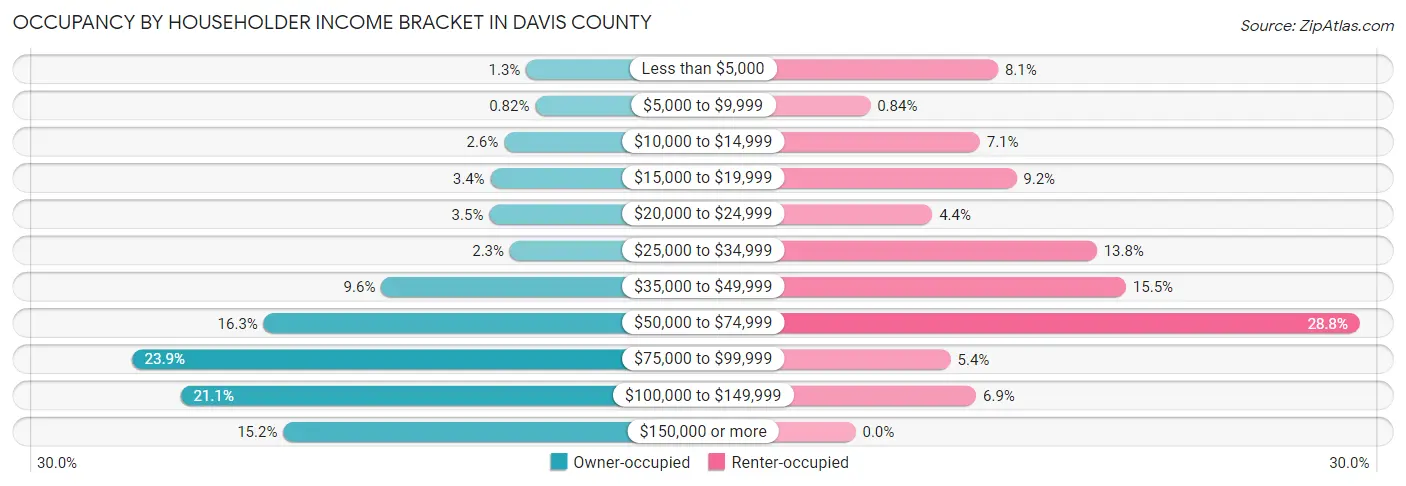
| Income Bracket | Owner-occupied | Renter-occupied |
| Less than $5,000 | 36 (1.3%) | 39 (8.1%) |
| $5,000 to $9,999 | 22 (0.8%) | 4 (0.8%) |
| $10,000 to $14,999 | 70 (2.6%) | 34 (7.1%) |
| $15,000 to $19,999 | 91 (3.4%) | 44 (9.2%) |
| $20,000 to $24,999 | 93 (3.5%) | 21 (4.4%) |
| $25,000 to $34,999 | 61 (2.3%) | 66 (13.8%) |
| $35,000 to $49,999 | 259 (9.6%) | 74 (15.4%) |
| $50,000 to $74,999 | 440 (16.3%) | 138 (28.8%) |
| $75,000 to $99,999 | 643 (23.9%) | 26 (5.4%) |
| $100,000 to $149,999 | 568 (21.1%) | 33 (6.9%) |
| $150,000 or more | 410 (15.2%) | 0 (0.0%) |
| Total | 2,693 (100.0%) | 479 (100.0%) |
Monthly Housing Cost Tiers in Davis County
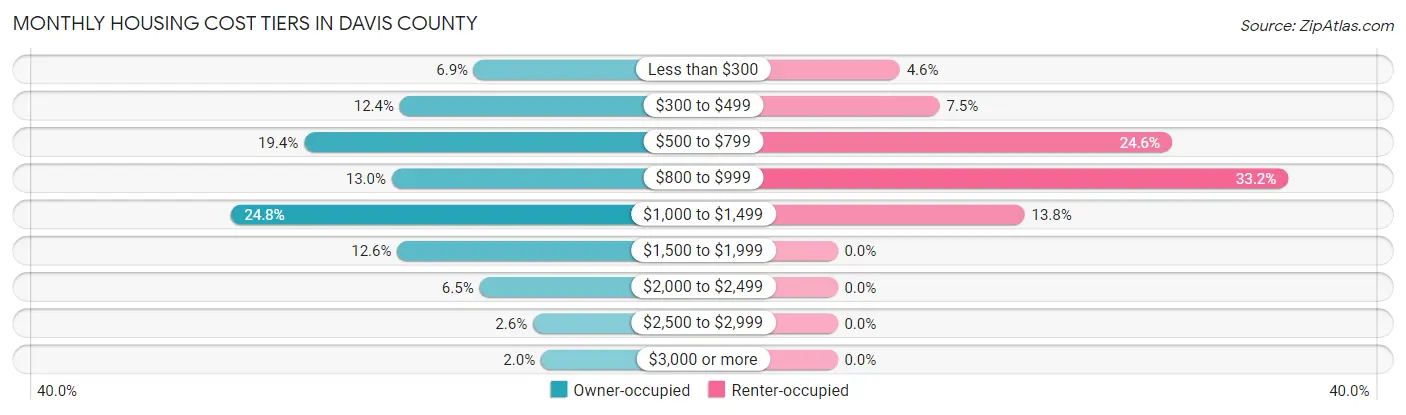
| Monthly Cost | Owner-occupied | Renter-occupied |
| Less than $300 | 186 (6.9%) | 22 (4.6%) |
| $300 to $499 | 333 (12.4%) | 36 (7.5%) |
| $500 to $799 | 523 (19.4%) | 118 (24.6%) |
| $800 to $999 | 349 (13.0%) | 159 (33.2%) |
| $1,000 to $1,499 | 667 (24.8%) | 66 (13.8%) |
| $1,500 to $1,999 | 338 (12.6%) | 0 (0.0%) |
| $2,000 to $2,499 | 175 (6.5%) | 0 (0.0%) |
| $2,500 to $2,999 | 69 (2.6%) | 0 (0.0%) |
| $3,000 or more | 53 (2.0%) | 0 (0.0%) |
| Total | 2,693 (100.0%) | 479 (100.0%) |
Physical Housing Characteristics in Davis County
Housing Structures in Davis County
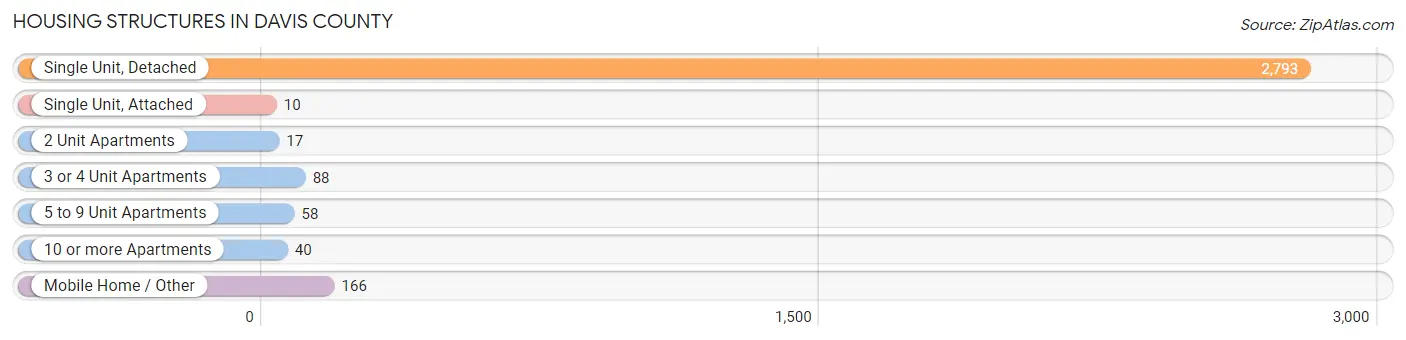
| Structure Type | # Housing Units | % Housing Units |
| Single Unit, Detached | 2,793 | 88.0% |
| Single Unit, Attached | 10 | 0.3% |
| 2 Unit Apartments | 17 | 0.5% |
| 3 or 4 Unit Apartments | 88 | 2.8% |
| 5 to 9 Unit Apartments | 58 | 1.8% |
| 10 or more Apartments | 40 | 1.3% |
| Mobile Home / Other | 166 | 5.2% |
| Total | 3,172 | 100.0% |
Housing Structures by Occupancy in Davis County
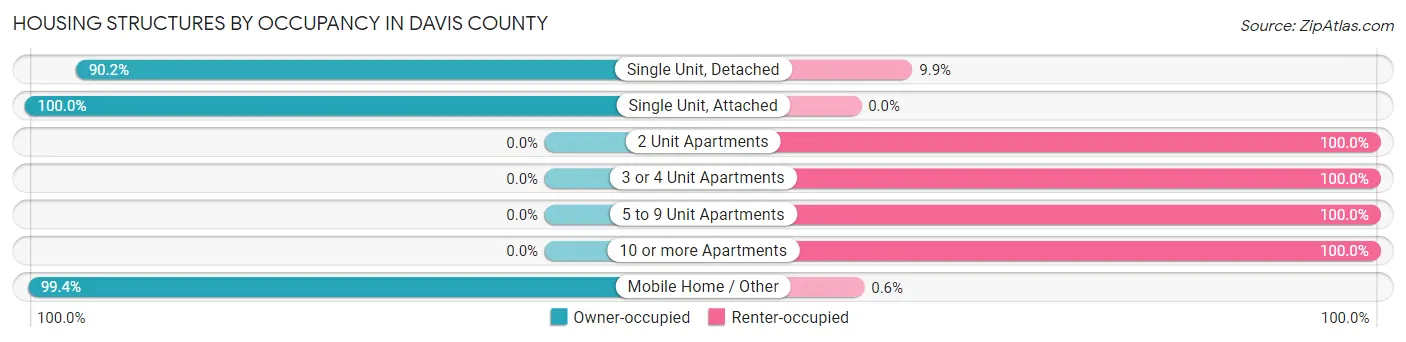
| Structure Type | Owner-occupied | Renter-occupied |
| Single Unit, Detached | 2,518 (90.1%) | 275 (9.9%) |
| Single Unit, Attached | 10 (100.0%) | 0 (0.0%) |
| 2 Unit Apartments | 0 (0.0%) | 17 (100.0%) |
| 3 or 4 Unit Apartments | 0 (0.0%) | 88 (100.0%) |
| 5 to 9 Unit Apartments | 0 (0.0%) | 58 (100.0%) |
| 10 or more Apartments | 0 (0.0%) | 40 (100.0%) |
| Mobile Home / Other | 165 (99.4%) | 1 (0.6%) |
| Total | 2,693 (84.9%) | 479 (15.1%) |
Housing Structures by Number of Rooms in Davis County
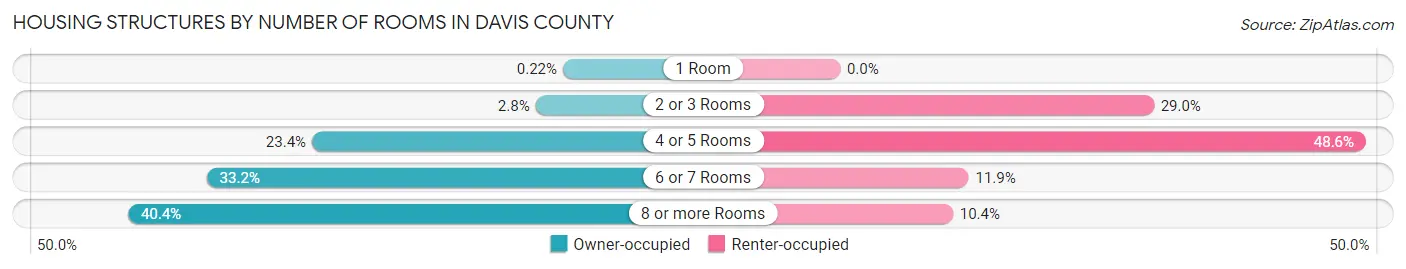
| Number of Rooms | Owner-occupied | Renter-occupied |
| 1 Room | 6 (0.2%) | 0 (0.0%) |
| 2 or 3 Rooms | 74 (2.8%) | 139 (29.0%) |
| 4 or 5 Rooms | 631 (23.4%) | 233 (48.6%) |
| 6 or 7 Rooms | 893 (33.2%) | 57 (11.9%) |
| 8 or more Rooms | 1,089 (40.4%) | 50 (10.4%) |
| Total | 2,693 (100.0%) | 479 (100.0%) |
Housing Structure by Heating Type in Davis County
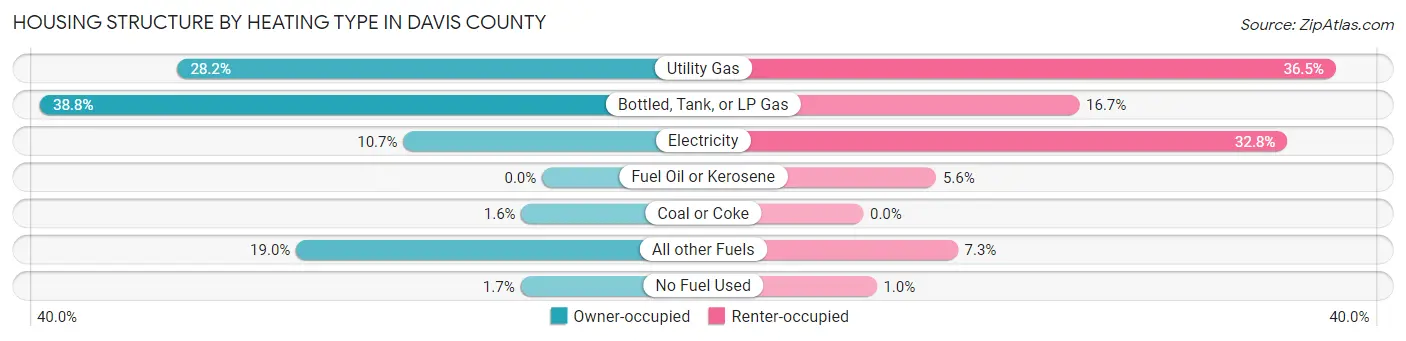
| Heating Type | Owner-occupied | Renter-occupied |
| Utility Gas | 759 (28.2%) | 175 (36.5%) |
| Bottled, Tank, or LP Gas | 1,045 (38.8%) | 80 (16.7%) |
| Electricity | 289 (10.7%) | 157 (32.8%) |
| Fuel Oil or Kerosene | 0 (0.0%) | 27 (5.6%) |
| Coal or Coke | 43 (1.6%) | 0 (0.0%) |
| All other Fuels | 512 (19.0%) | 35 (7.3%) |
| No Fuel Used | 45 (1.7%) | 5 (1.0%) |
| Total | 2,693 (100.0%) | 479 (100.0%) |
Household Vehicle Usage in Davis County
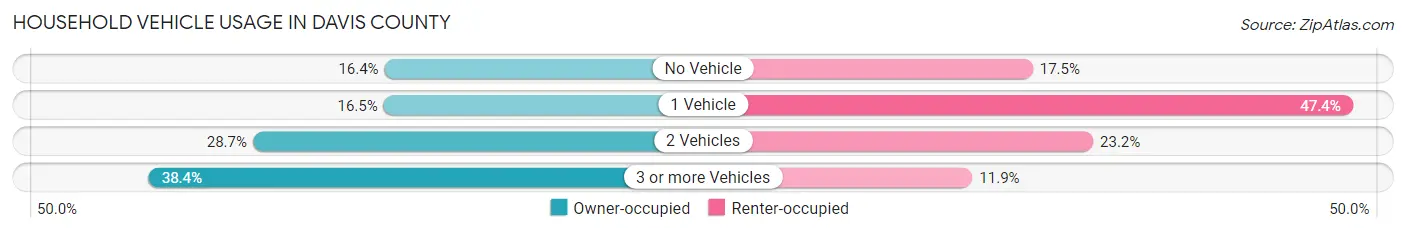
| Vehicles per Household | Owner-occupied | Renter-occupied |
| No Vehicle | 442 (16.4%) | 84 (17.5%) |
| 1 Vehicle | 444 (16.5%) | 227 (47.4%) |
| 2 Vehicles | 773 (28.7%) | 111 (23.2%) |
| 3 or more Vehicles | 1,034 (38.4%) | 57 (11.9%) |
| Total | 2,693 (100.0%) | 479 (100.0%) |
Real Estate & Mortgages in Davis County
Real Estate and Mortgage Overview in Davis County
| Characteristic | Without Mortgage | With Mortgage |
| Housing Units | 1,109 | 1,584 |
| Median Property Value | $117,000 | $159,800 |
| Median Household Income | $77,129 | $288 |
| Monthly Housing Costs | $537 | $53 |
| Real Estate Taxes | $1,916 | $14 |
Property Value by Mortgage Status in Davis County
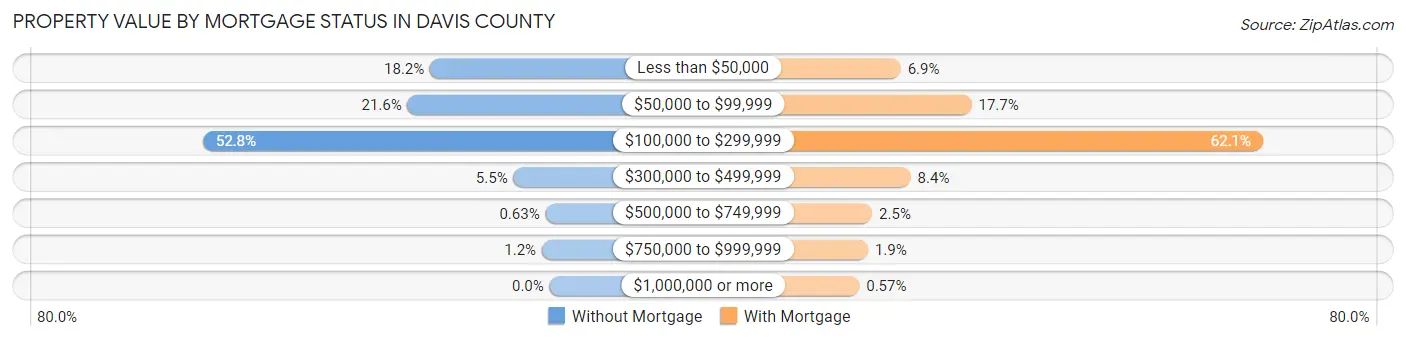
| Property Value | Without Mortgage | With Mortgage |
| Less than $50,000 | 202 (18.2%) | 109 (6.9%) |
| $50,000 to $99,999 | 240 (21.6%) | 280 (17.7%) |
| $100,000 to $299,999 | 586 (52.8%) | 983 (62.1%) |
| $300,000 to $499,999 | 61 (5.5%) | 133 (8.4%) |
| $500,000 to $749,999 | 7 (0.6%) | 40 (2.5%) |
| $750,000 to $999,999 | 13 (1.2%) | 30 (1.9%) |
| $1,000,000 or more | 0 (0.0%) | 9 (0.6%) |
| Total | 1,109 (100.0%) | 1,584 (100.0%) |
Household Income by Mortgage Status in Davis County
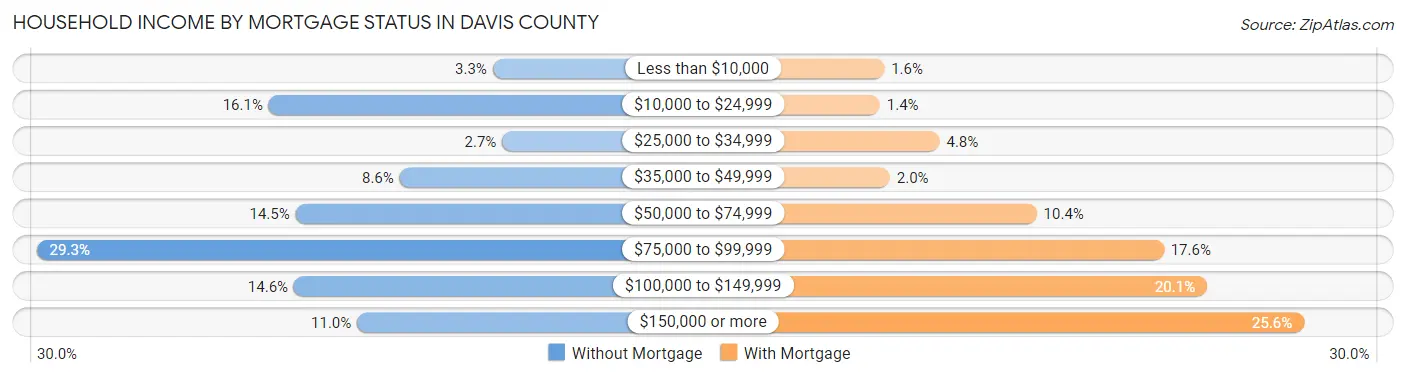
| Household Income | Without Mortgage | With Mortgage |
| Less than $10,000 | 36 (3.3%) | 26 (1.6%) |
| $10,000 to $24,999 | 178 (16.1%) | 22 (1.4%) |
| $25,000 to $34,999 | 30 (2.7%) | 76 (4.8%) |
| $35,000 to $49,999 | 95 (8.6%) | 31 (2.0%) |
| $50,000 to $74,999 | 161 (14.5%) | 164 (10.3%) |
| $75,000 to $99,999 | 325 (29.3%) | 279 (17.6%) |
| $100,000 to $149,999 | 162 (14.6%) | 318 (20.1%) |
| $150,000 or more | 122 (11.0%) | 406 (25.6%) |
| Total | 1,109 (100.0%) | 1,584 (100.0%) |
Property Value to Household Income Ratio in Davis County
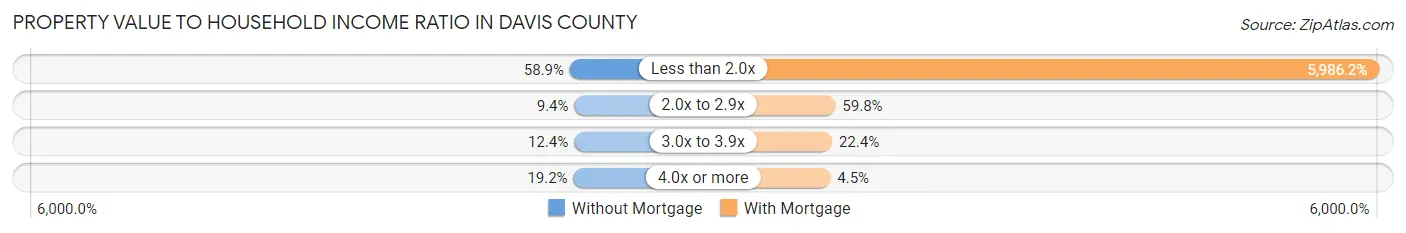
| Value-to-Income Ratio | Without Mortgage | With Mortgage |
| Less than 2.0x | 653 (58.9%) | 94,821 (5,986.2%) |
| 2.0x to 2.9x | 104 (9.4%) | 947 (59.8%) |
| 3.0x to 3.9x | 138 (12.4%) | 354 (22.4%) |
| 4.0x or more | 213 (19.2%) | 71 (4.5%) |
| Total | 1,109 (100.0%) | 1,584 (100.0%) |
Real Estate Taxes by Mortgage Status in Davis County
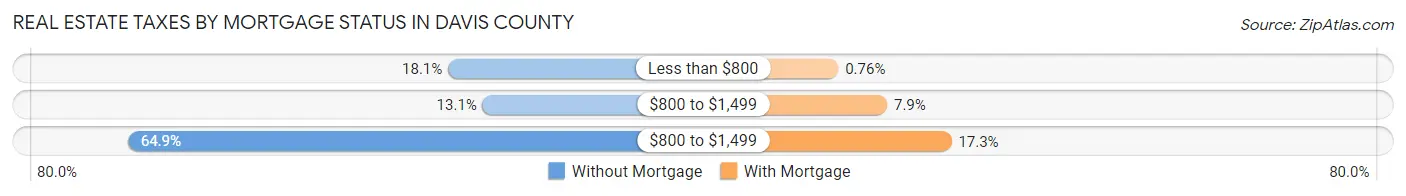
| Property Taxes | Without Mortgage | With Mortgage |
| Less than $800 | 201 (18.1%) | 12 (0.8%) |
| $800 to $1,499 | 145 (13.1%) | 125 (7.9%) |
| $800 to $1,499 | 720 (64.9%) | 274 (17.3%) |
| Total | 1,109 (100.0%) | 1,584 (100.0%) |
Health & Disability in Davis County
Health Insurance Coverage by Age in Davis County
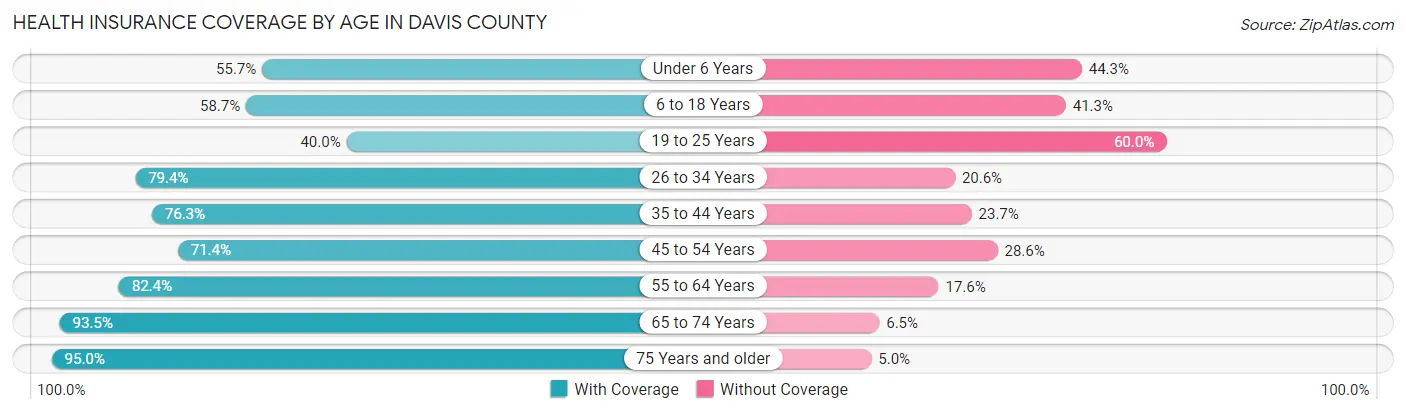
| Age Bracket | With Coverage | Without Coverage |
| Under 6 Years | 532 (55.7%) | 423 (44.3%) |
| 6 to 18 Years | 1,100 (58.7%) | 774 (41.3%) |
| 19 to 25 Years | 287 (40.0%) | 431 (60.0%) |
| 26 to 34 Years | 677 (79.4%) | 176 (20.6%) |
| 35 to 44 Years | 739 (76.3%) | 230 (23.7%) |
| 45 to 54 Years | 690 (71.4%) | 276 (28.6%) |
| 55 to 64 Years | 910 (82.4%) | 194 (17.6%) |
| 65 to 74 Years | 789 (93.5%) | 55 (6.5%) |
| 75 Years and older | 660 (95.0%) | 35 (5.0%) |
| Total | 6,384 (71.1%) | 2,594 (28.9%) |
Health Insurance Coverage by Citizenship Status in Davis County
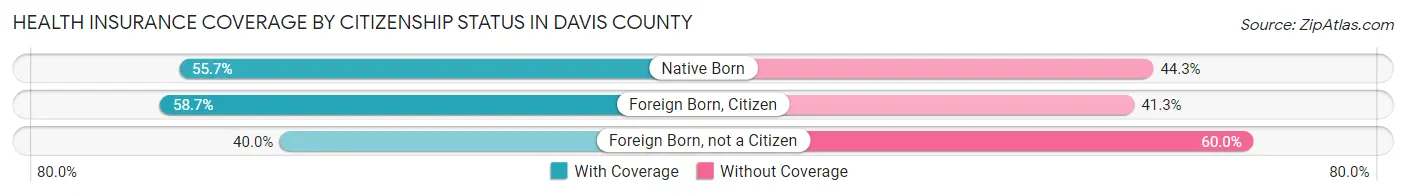
| Citizenship Status | With Coverage | Without Coverage |
| Native Born | 532 (55.7%) | 423 (44.3%) |
| Foreign Born, Citizen | 1,100 (58.7%) | 774 (41.3%) |
| Foreign Born, not a Citizen | 287 (40.0%) | 431 (60.0%) |
Health Insurance Coverage by Household Income in Davis County
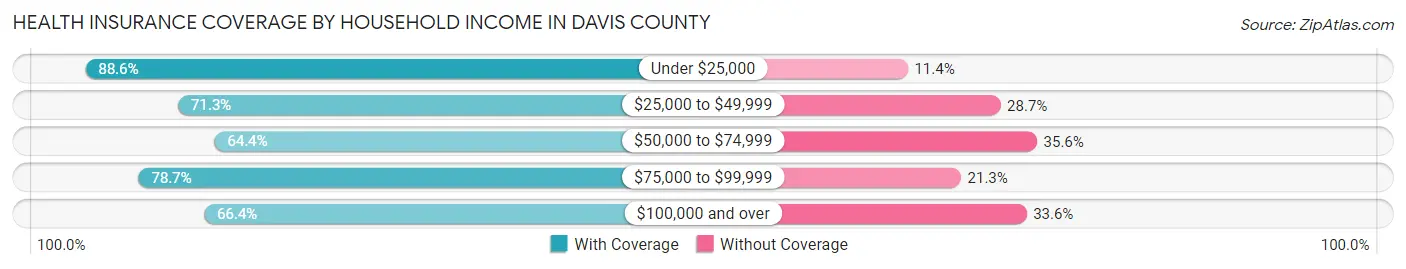
| Household Income | With Coverage | Without Coverage |
| Under $25,000 | 647 (88.6%) | 83 (11.4%) |
| $25,000 to $49,999 | 826 (71.3%) | 333 (28.7%) |
| $50,000 to $74,999 | 1,040 (64.4%) | 574 (35.6%) |
| $75,000 to $99,999 | 1,513 (78.7%) | 410 (21.3%) |
| $100,000 and over | 2,358 (66.4%) | 1,194 (33.6%) |
Public vs Private Health Insurance Coverage by Age in Davis County
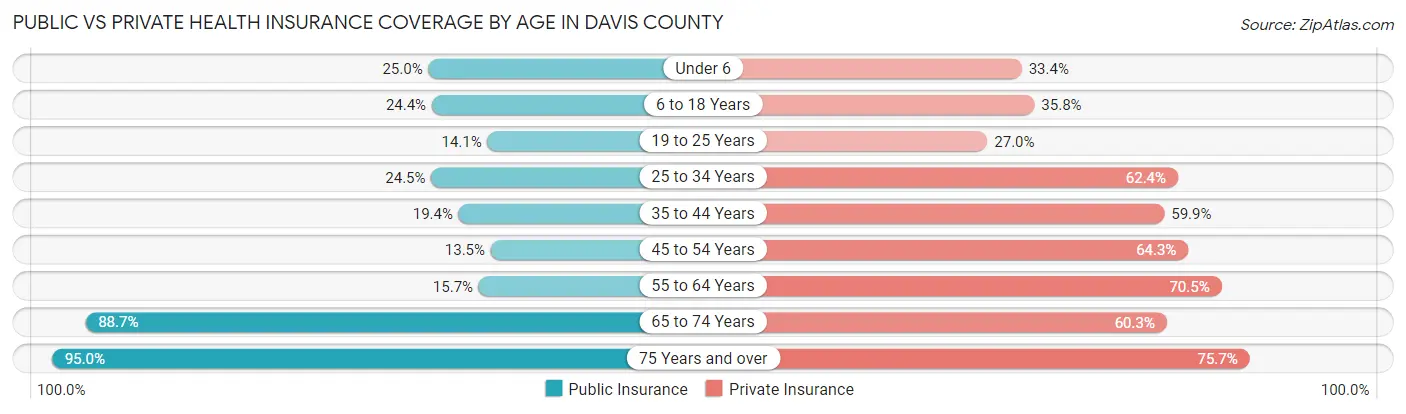
| Age Bracket | Public Insurance | Private Insurance |
| Under 6 | 239 (25.0%) | 319 (33.4%) |
| 6 to 18 Years | 457 (24.4%) | 670 (35.7%) |
| 19 to 25 Years | 101 (14.1%) | 194 (27.0%) |
| 25 to 34 Years | 209 (24.5%) | 532 (62.4%) |
| 35 to 44 Years | 188 (19.4%) | 580 (59.9%) |
| 45 to 54 Years | 130 (13.5%) | 621 (64.3%) |
| 55 to 64 Years | 173 (15.7%) | 778 (70.5%) |
| 65 to 74 Years | 749 (88.7%) | 509 (60.3%) |
| 75 Years and over | 660 (95.0%) | 526 (75.7%) |
| Total | 2,906 (32.4%) | 4,729 (52.7%) |
Disability Status by Sex by Age in Davis County
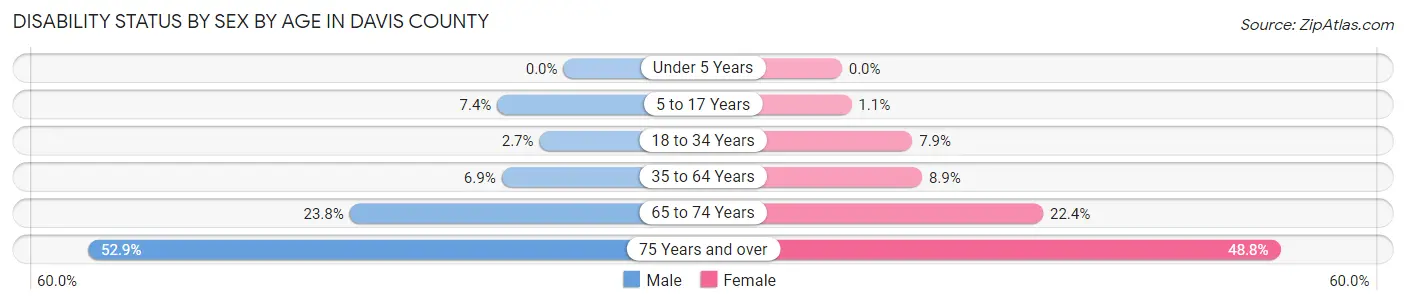
| Age Bracket | Male | Female |
| Under 5 Years | 0 (0.0%) | 0 (0.0%) |
| 5 to 17 Years | 69 (7.4%) | 10 (1.1%) |
| 18 to 34 Years | 24 (2.7%) | 64 (7.9%) |
| 35 to 64 Years | 109 (6.9%) | 130 (8.9%) |
| 65 to 74 Years | 100 (23.8%) | 95 (22.4%) |
| 75 Years and over | 163 (52.9%) | 189 (48.8%) |
Disability Class by Sex by Age in Davis County
Disability Class: Hearing Difficulty
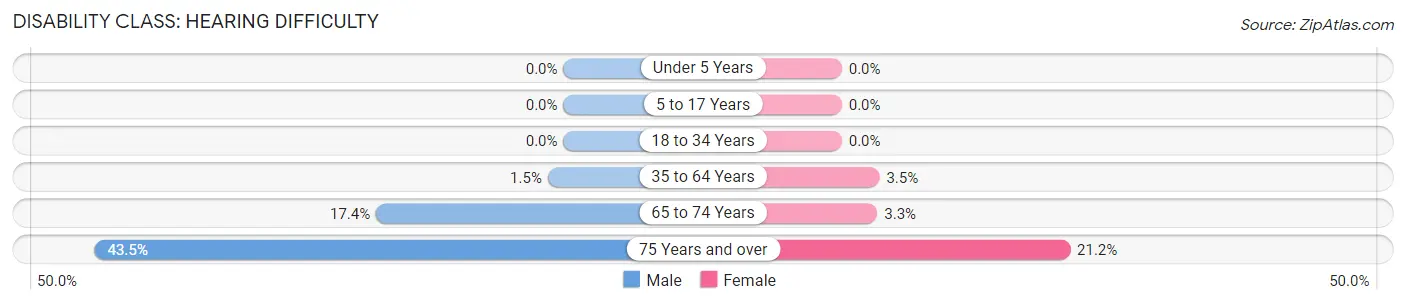
| Age Bracket | Male | Female |
| Under 5 Years | 0 (0.0%) | 0 (0.0%) |
| 5 to 17 Years | 0 (0.0%) | 0 (0.0%) |
| 18 to 34 Years | 0 (0.0%) | 0 (0.0%) |
| 35 to 64 Years | 23 (1.5%) | 51 (3.5%) |
| 65 to 74 Years | 73 (17.4%) | 14 (3.3%) |
| 75 Years and over | 134 (43.5%) | 82 (21.2%) |
Disability Class: Vision Difficulty
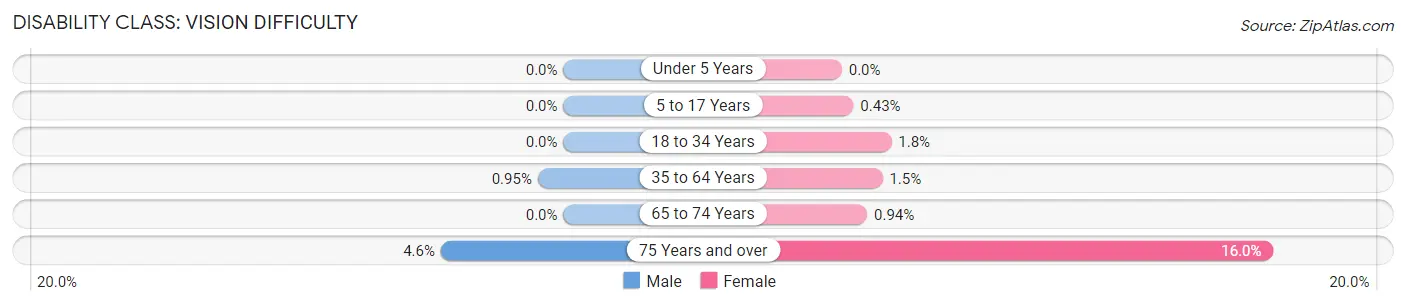
| Age Bracket | Male | Female |
| Under 5 Years | 0 (0.0%) | 0 (0.0%) |
| 5 to 17 Years | 0 (0.0%) | 4 (0.4%) |
| 18 to 34 Years | 0 (0.0%) | 15 (1.8%) |
| 35 to 64 Years | 15 (0.9%) | 22 (1.5%) |
| 65 to 74 Years | 0 (0.0%) | 4 (0.9%) |
| 75 Years and over | 14 (4.5%) | 62 (16.0%) |
Disability Class: Cognitive Difficulty
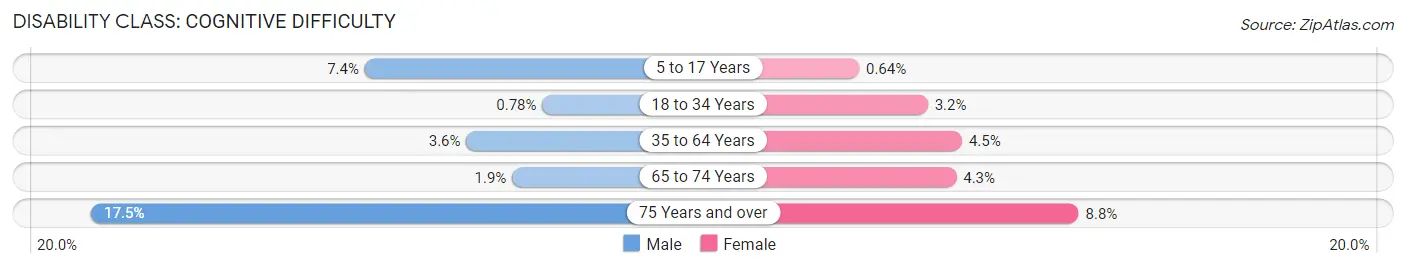
| Age Bracket | Male | Female |
| 5 to 17 Years | 69 (7.4%) | 6 (0.6%) |
| 18 to 34 Years | 7 (0.8%) | 26 (3.2%) |
| 35 to 64 Years | 57 (3.6%) | 65 (4.5%) |
| 65 to 74 Years | 8 (1.9%) | 18 (4.3%) |
| 75 Years and over | 54 (17.5%) | 34 (8.8%) |
Disability Class: Ambulatory Difficulty
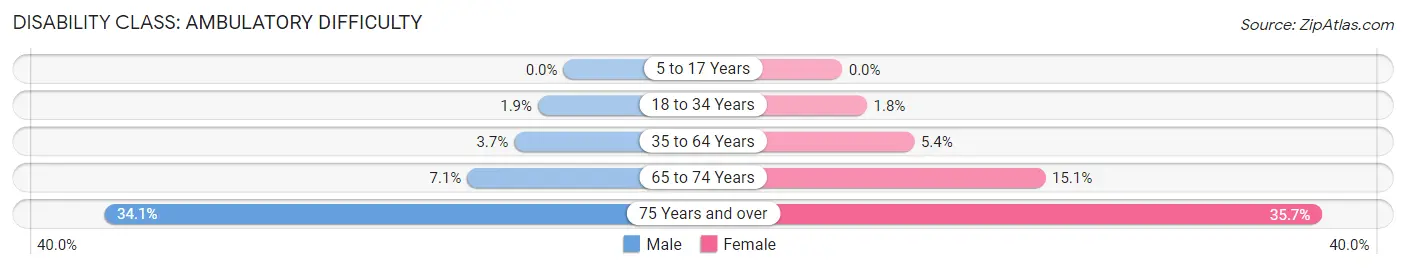
| Age Bracket | Male | Female |
| 5 to 17 Years | 0 (0.0%) | 0 (0.0%) |
| 18 to 34 Years | 17 (1.9%) | 15 (1.8%) |
| 35 to 64 Years | 58 (3.7%) | 78 (5.4%) |
| 65 to 74 Years | 30 (7.1%) | 64 (15.1%) |
| 75 Years and over | 105 (34.1%) | 138 (35.7%) |
Disability Class: Self-Care Difficulty
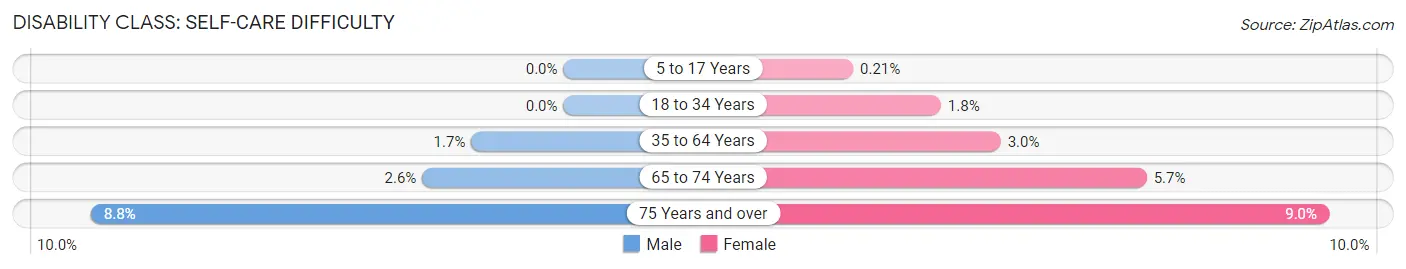
| Age Bracket | Male | Female |
| 5 to 17 Years | 0 (0.0%) | 2 (0.2%) |
| 18 to 34 Years | 0 (0.0%) | 15 (1.8%) |
| 35 to 64 Years | 27 (1.7%) | 43 (2.9%) |
| 65 to 74 Years | 11 (2.6%) | 24 (5.7%) |
| 75 Years and over | 27 (8.8%) | 35 (9.0%) |
Technology Access in Davis County
Computing Device Access in Davis County
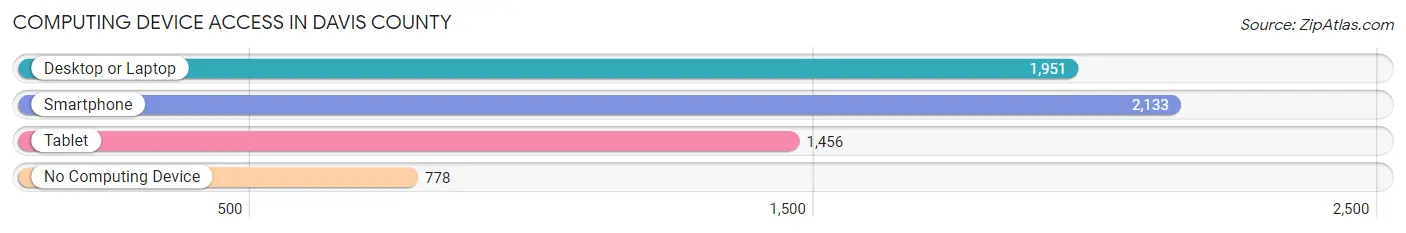
| Device Type | # Households | % Households |
| Desktop or Laptop | 1,951 | 61.5% |
| Smartphone | 2,133 | 67.2% |
| Tablet | 1,456 | 45.9% |
| No Computing Device | 778 | 24.5% |
| Total | 3,172 | 100.0% |
Internet Access in Davis County
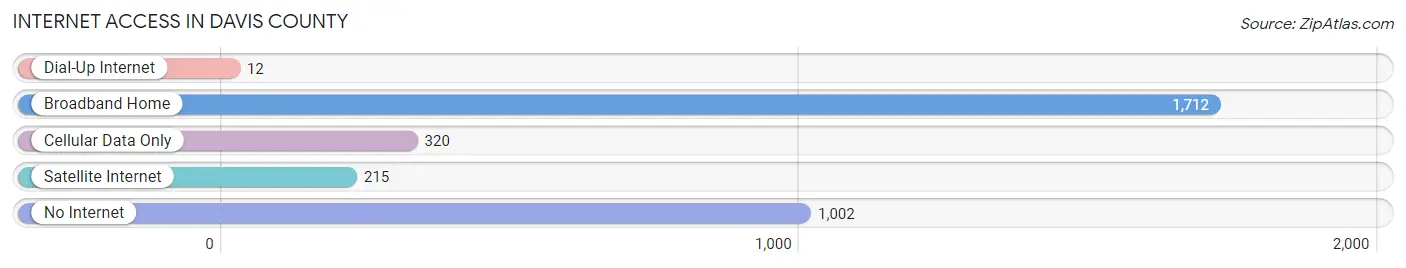
| Internet Type | # Households | % Households |
| Dial-Up Internet | 12 | 0.4% |
| Broadband Home | 1,712 | 54.0% |
| Cellular Data Only | 320 | 10.1% |
| Satellite Internet | 215 | 6.8% |
| No Internet | 1,002 | 31.6% |
| Total | 3,172 | 100.0% |
Davis County Summary
Davis County is located in the south-central part of the state of Iowa, in the United States. It is bordered by Appanoose County to the north, Van Buren County to the east, Jefferson County to the south, and Lucas County to the west. The county seat is Bloomfield, and the largest city is Bloomfield. The county was established in 1843 and named after Garrett Davis, a United States Senator from Kentucky.
Geography
Davis County covers an area of 576 square miles, making it the 33rd largest county in Iowa. The county is located in the Des Moines Lobe region of the state, and is characterized by rolling hills and valleys. The highest point in the county is located in the northwest corner, at an elevation of 1,092 feet. The county is drained by the North and South Skunk Rivers, as well as several smaller streams.
The county is mostly rural, with only a few small towns and villages. The largest town is Bloomfield, with a population of 2,845 in 2010. Other towns include Drakesville, Floris, Pulaski, and Selma.
Climate
Davis County has a humid continental climate, with cold winters and hot, humid summers. The average annual temperature is 48°F, and the average annual precipitation is 33 inches.
Demographics
As of the 2010 census, there were 8,753 people, 3,521 households, and 2,521 families living in the county. The population density was 15.2 people per square mile. The racial makeup of the county was 97.3% White, 0.3% African American, 0.2% Native American, 0.3% Asian, 0.1% Pacific Islander, 0.7% from other races, and 0.9% from two or more races. Hispanic or Latino of any race were 1.7% of the population.
The median income for a household in the county was $41,945, and the median income for a family was $50,945. The per capita income for the county was $20,845. About 8.3% of families and 11.2% of the population were below the poverty line, including 14.2% of those under age 18 and 8.2% of those age 65 or over.
Economy
Agriculture is the main economic activity in Davis County. The county is home to a variety of crops, including corn, soybeans, hay, and oats. Livestock production is also important, with beef cattle, hogs, and sheep being raised in the county.
The county also has a number of small businesses, including manufacturing, retail, and service industries. The largest employers in the county are the Davis County Hospital, the Davis County School District, and the Davis County Sheriff's Office.
Conclusion
Davis County is a rural county located in the south-central part of Iowa. It is characterized by rolling hills and valleys, and is home to a variety of crops and livestock. The county has a humid continental climate, with cold winters and hot, humid summers. The population of the county is 8,753, and the median income for a household is $41,945. Agriculture is the main economic activity in the county, with a number of small businesses also operating in the area.
Common Questions
What is Per Capita Income in Davis County?
Per Capita income in Davis County is $32,889.
What is the Median Family Income in Davis County?
Median Family Income in Davis County is $89,434.
What is the Median Household income in Davis County?
Median Household Income in Davis County is $77,176.
What is Income or Wage Gap in Davis County?
Income or Wage Gap in Davis County is 42.5%.
Women in Davis County earn 57.5 cents for every dollar earned by a man.
What is Inequality or Gini Index in Davis County?
Inequality or Gini Index in Davis County is 0.40.
What is the Total Population of Davis County?
Total Population of Davis County is 9,093.
What is the Total Male Population of Davis County?
Total Male Population of Davis County is 4,636.
What is the Total Female Population of Davis County?
Total Female Population of Davis County is 4,457.
What is the Ratio of Males per 100 Females in Davis County?
There are 104.02 Males per 100 Females in Davis County.
What is the Ratio of Females per 100 Males in Davis County?
There are 96.14 Females per 100 Males in Davis County.
What is the Median Population Age in Davis County?
Median Population Age in Davis County is 36.3 Years.
What is the Average Family Size in Davis County
Average Family Size in Davis County is 3.3 People.
What is the Average Household Size in Davis County
Average Household Size in Davis County is 2.8 People.
How Large is the Labor Force in Davis County?
There are 4,188 People in the Labor Forcein in Davis County.
What is the Percentage of People in the Labor Force in Davis County?
62.6% of People are in the Labor Force in Davis County.
What is the Unemployment Rate in Davis County?
Unemployment Rate in Davis County is 2.0%.