Appanoose County, IA Map & Demographics
Appanoose County Map
Appanoose County Overview
$28,109
PER CAPITA INCOME
$60,169
AVG FAMILY INCOME
$50,684
AVG HOUSEHOLD INCOME
24.5%
WAGE / INCOME GAP [ % ]
75.5¢/ $1
WAGE / INCOME GAP [ $ ]
$11,090
FAMILY INCOME DEFICIT
0.44
INEQUALITY / GINI INDEX
12,279
TOTAL POPULATION
6,147
MALE POPULATION
6,132
FEMALE POPULATION
100.24
MALES / 100 FEMALES
99.76
FEMALES / 100 MALES
45.0
MEDIAN AGE
3.0
AVG FAMILY SIZE
2.4
AVG HOUSEHOLD SIZE
5,311
LABOR FORCE [ PEOPLE ]
53.9%
PERCENT IN LABOR FORCE
6.1%
UNEMPLOYMENT RATE
Appanoose County Area Codes
Income in Appanoose County
Income Overview in Appanoose County
Per Capita Income in Appanoose County is $28,109, while median incomes of families and households are $60,169 and $50,684 respectively.
| Characteristic | Number | Measure |
| Per Capita Income | 12,279 | $28,109 |
| Median Family Income | 3,170 | $60,169 |
| Mean Family Income | 3,170 | $79,974 |
| Median Household Income | 5,028 | $50,684 |
| Mean Household Income | 5,028 | $66,726 |
| Income Deficit | 3,170 | $11,090 |
| Wage / Income Gap (%) | 12,279 | 24.49% |
| Wage / Income Gap ($) | 12,279 | 75.51¢ per $1 |
| Gini / Inequality Index | 12,279 | 0.44 |
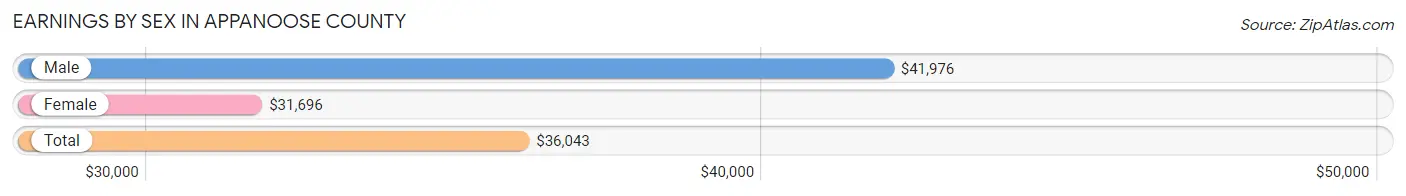
Earnings by Sex in Appanoose County
Average Earnings in Appanoose County are $36,043, $41,976 for men and $31,696 for women, a difference of 24.5%.
| Sex | Number | Average Earnings |
| Male | 2,909 (51.9%) | $41,976 |
| Female | 2,694 (48.1%) | $31,696 |
| Total | 5,603 (100.0%) | $36,043 |
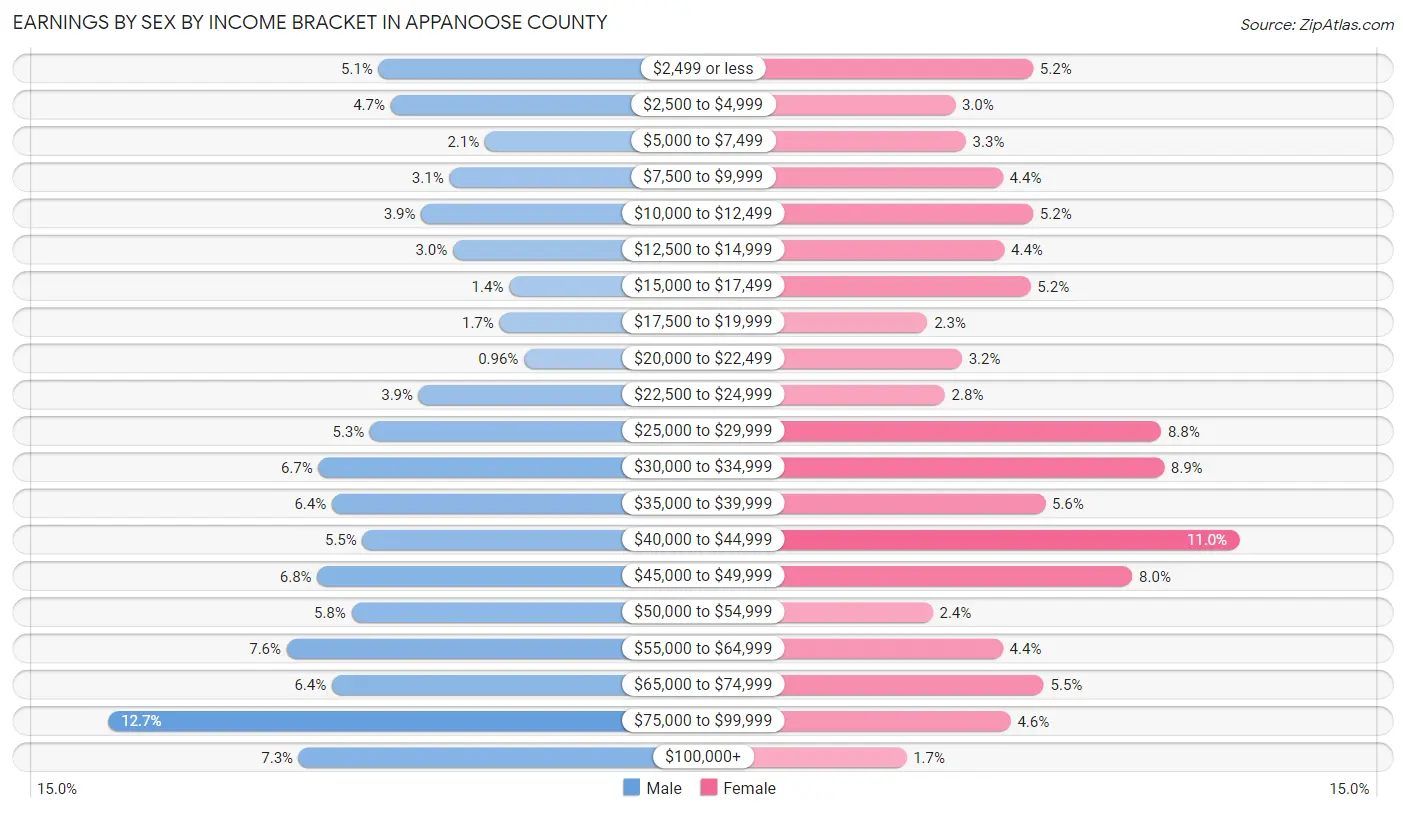
Earnings by Sex by Income Bracket in Appanoose County
The most common earnings brackets in Appanoose County are $75,000 to $99,999 for men (368 | 12.7%) and $40,000 to $44,999 for women (297 | 11.0%).
| Income | Male | Female |
| $2,499 or less | 147 (5.1%) | 141 (5.2%) |
| $2,500 to $4,999 | 137 (4.7%) | 82 (3.0%) |
| $5,000 to $7,499 | 60 (2.1%) | 90 (3.3%) |
| $7,500 to $9,999 | 89 (3.1%) | 118 (4.4%) |
| $10,000 to $12,499 | 112 (3.8%) | 141 (5.2%) |
| $12,500 to $14,999 | 86 (3.0%) | 119 (4.4%) |
| $15,000 to $17,499 | 40 (1.4%) | 139 (5.2%) |
| $17,500 to $19,999 | 48 (1.7%) | 61 (2.3%) |
| $20,000 to $22,499 | 28 (1.0%) | 87 (3.2%) |
| $22,500 to $24,999 | 114 (3.9%) | 74 (2.8%) |
| $25,000 to $29,999 | 154 (5.3%) | 238 (8.8%) |
| $30,000 to $34,999 | 196 (6.7%) | 240 (8.9%) |
| $35,000 to $39,999 | 185 (6.4%) | 150 (5.6%) |
| $40,000 to $44,999 | 160 (5.5%) | 297 (11.0%) |
| $45,000 to $49,999 | 197 (6.8%) | 216 (8.0%) |
| $50,000 to $54,999 | 169 (5.8%) | 65 (2.4%) |
| $55,000 to $64,999 | 222 (7.6%) | 118 (4.4%) |
| $65,000 to $74,999 | 185 (6.4%) | 149 (5.5%) |
| $75,000 to $99,999 | 368 (12.7%) | 124 (4.6%) |
| $100,000+ | 212 (7.3%) | 45 (1.7%) |
| Total | 2,909 (100.0%) | 2,694 (100.0%) |
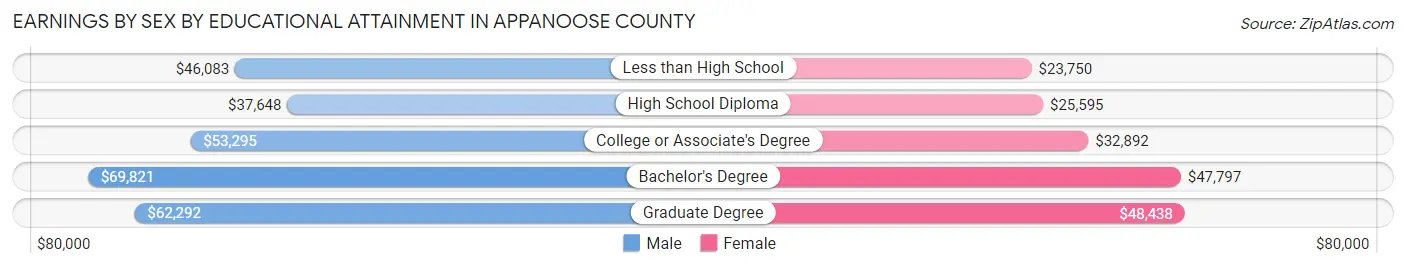
Earnings by Sex by Educational Attainment in Appanoose County
Average earnings in Appanoose County are $46,678 for men and $34,496 for women, a difference of 26.1%. Men with an educational attainment of bachelor's degree enjoy the highest average annual earnings of $69,821, while those with high school diploma education earn the least with $37,648. Women with an educational attainment of graduate degree earn the most with the average annual earnings of $48,438, while those with less than high school education have the smallest earnings of $23,750.
| Educational Attainment | Male Income | Female Income |
| Less than High School | $46,083 | $23,750 |
| High School Diploma | $37,648 | $25,595 |
| College or Associate's Degree | $53,295 | $32,892 |
| Bachelor's Degree | $69,821 | $47,797 |
| Graduate Degree | $62,292 | $48,438 |
| Total | $46,678 | $34,496 |
Family Income in Appanoose County
Family Income Brackets in Appanoose County
According to the Appanoose County family income data, there are 564 families falling into the $50,000 to $74,999 income range, which is the most common income bracket and makes up 17.8% of all families. Conversely, the $200,000+ income bracket is the least frequent group with only 86 families (2.7%) belonging to this category.
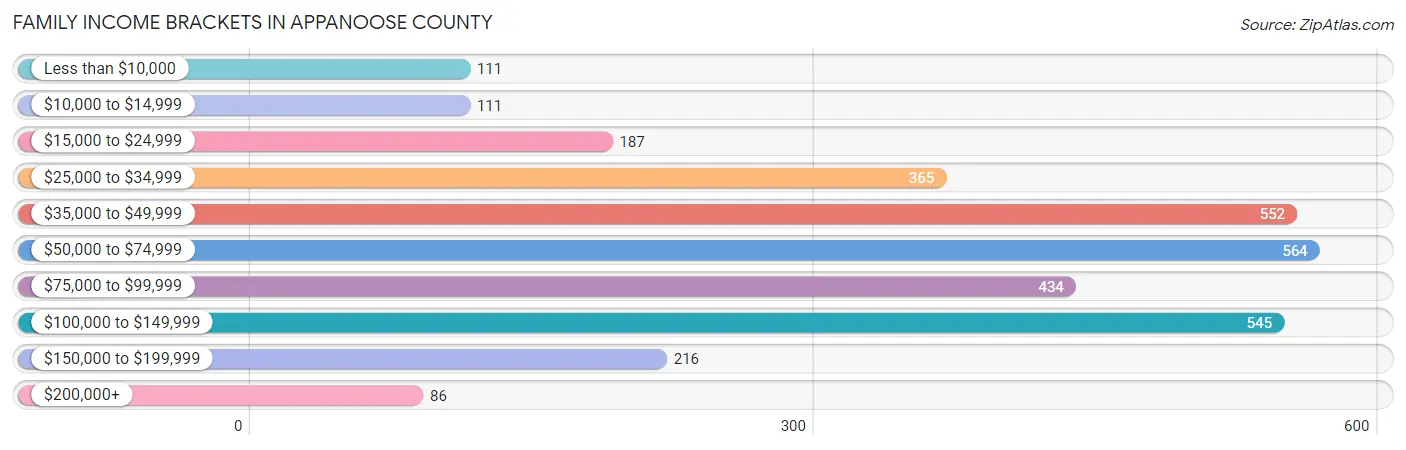
| Income Bracket | # Families | % Families |
| Less than $10,000 | 111 | 3.5% |
| $10,000 to $14,999 | 111 | 3.5% |
| $15,000 to $24,999 | 187 | 5.9% |
| $25,000 to $34,999 | 365 | 11.5% |
| $35,000 to $49,999 | 552 | 17.4% |
| $50,000 to $74,999 | 564 | 17.8% |
| $75,000 to $99,999 | 434 | 13.7% |
| $100,000 to $149,999 | 545 | 17.2% |
| $150,000 to $199,999 | 216 | 6.8% |
| $200,000+ | 86 | 2.7% |
Family Income by Famaliy Size in Appanoose County
6-person families (13 | 0.4%) account for the highest median family income in Appanoose County with $135,750 per family, while 2-person families (1,831 | 57.8%) have the highest median income of $28,557 per family member.
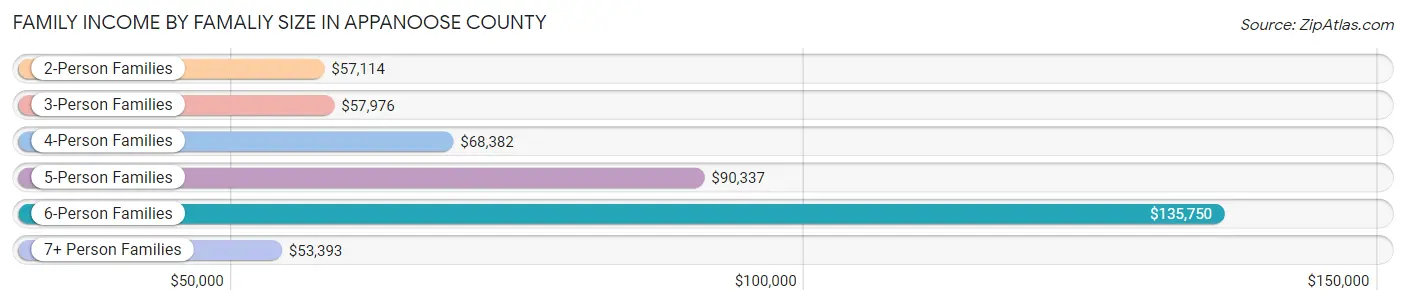
| Income Bracket | # Families | Median Income |
| 2-Person Families | 1,831 (57.8%) | $57,114 |
| 3-Person Families | 684 (21.6%) | $57,976 |
| 4-Person Families | 394 (12.4%) | $68,382 |
| 5-Person Families | 199 (6.3%) | $90,337 |
| 6-Person Families | 13 (0.4%) | $135,750 |
| 7+ Person Families | 49 (1.5%) | $53,393 |
| Total | 3,170 (100.0%) | $60,169 |
Family Income by Number of Earners in Appanoose County
The median family income in Appanoose County is $60,169, with families comprising 3+ earners (249) having the highest median family income of $122,813, while families with no earners (857) have the lowest median family income of $35,082, accounting for 7.9% and 27.0% of families, respectively.
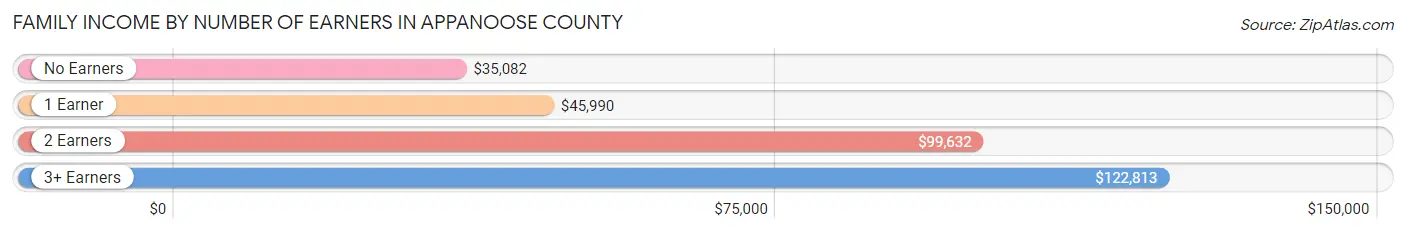
| Number of Earners | # Families | Median Income |
| No Earners | 857 (27.0%) | $35,082 |
| 1 Earner | 991 (31.3%) | $45,990 |
| 2 Earners | 1,073 (33.9%) | $99,632 |
| 3+ Earners | 249 (7.9%) | $122,813 |
| Total | 3,170 (100.0%) | $60,169 |
Household Income in Appanoose County
Household Income Brackets in Appanoose County
With 850 households falling in the category, the $50,000 to $74,999 income range is the most frequent in Appanoose County, accounting for 16.9% of all households. In contrast, only 91 households (1.8%) fall into the $200,000+ income bracket, making it the least populous group.
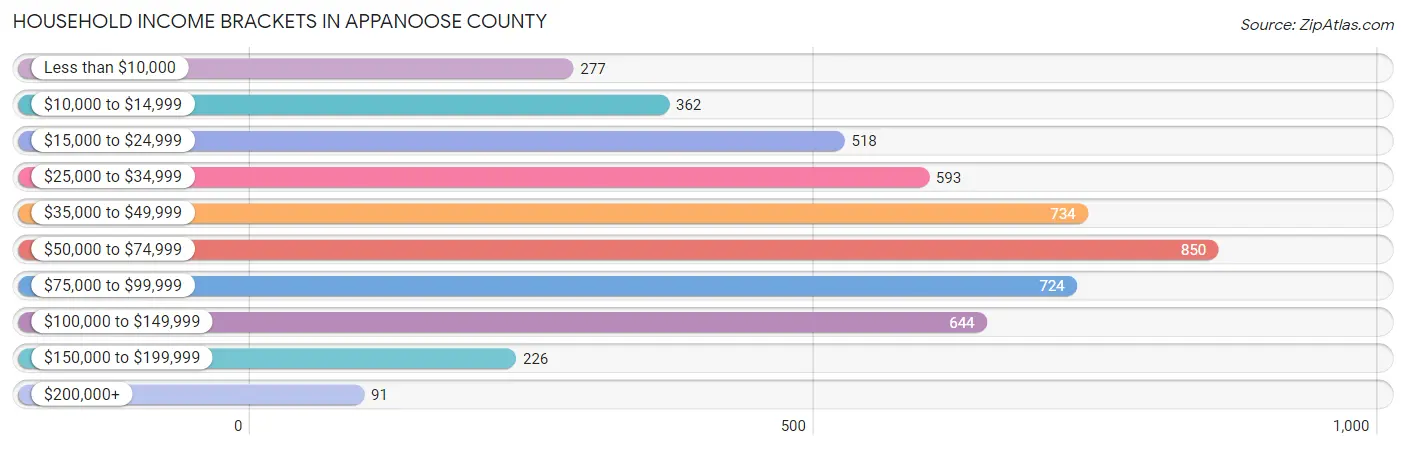
| Income Bracket | # Households | % Households |
| Less than $10,000 | 277 | 5.5% |
| $10,000 to $14,999 | 362 | 7.2% |
| $15,000 to $24,999 | 518 | 10.3% |
| $25,000 to $34,999 | 593 | 11.8% |
| $35,000 to $49,999 | 734 | 14.6% |
| $50,000 to $74,999 | 850 | 16.9% |
| $75,000 to $99,999 | 724 | 14.4% |
| $100,000 to $149,999 | 644 | 12.8% |
| $150,000 to $199,999 | 226 | 4.5% |
| $200,000+ | 91 | 1.8% |
Household Income by Householder Age in Appanoose County
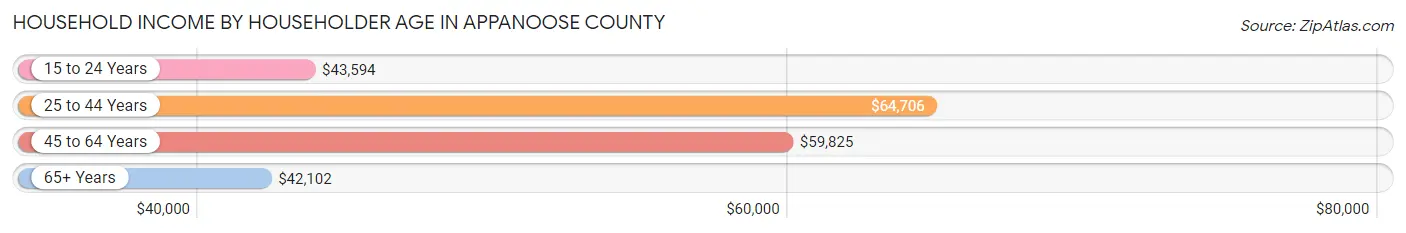
The median household income in Appanoose County is $50,684, with the highest median household income of $64,706 found in the 25 to 44 years age bracket for the primary householder. A total of 1,176 households (23.4%) fall into this category. Meanwhile, the 65+ years age bracket for the primary householder has the lowest median household income of $42,102, with 1,901 households (37.8%) in this group.
| Income Bracket | # Households | Median Income |
| 15 to 24 Years | 156 (3.1%) | $43,594 |
| 25 to 44 Years | 1,176 (23.4%) | $64,706 |
| 45 to 64 Years | 1,795 (35.7%) | $59,825 |
| 65+ Years | 1,901 (37.8%) | $42,102 |
| Total | 5,028 (100.0%) | $50,684 |
Poverty in Appanoose County
Income Below Poverty by Sex and Age in Appanoose County
With 17.6% poverty level for males and 17.1% for females among the residents of Appanoose County, 6 to 11 year old males and 5 year old females are the most vulnerable to poverty, with 174 males (34.6%) and 36 females (36.4%) in their respective age groups living below the poverty level.
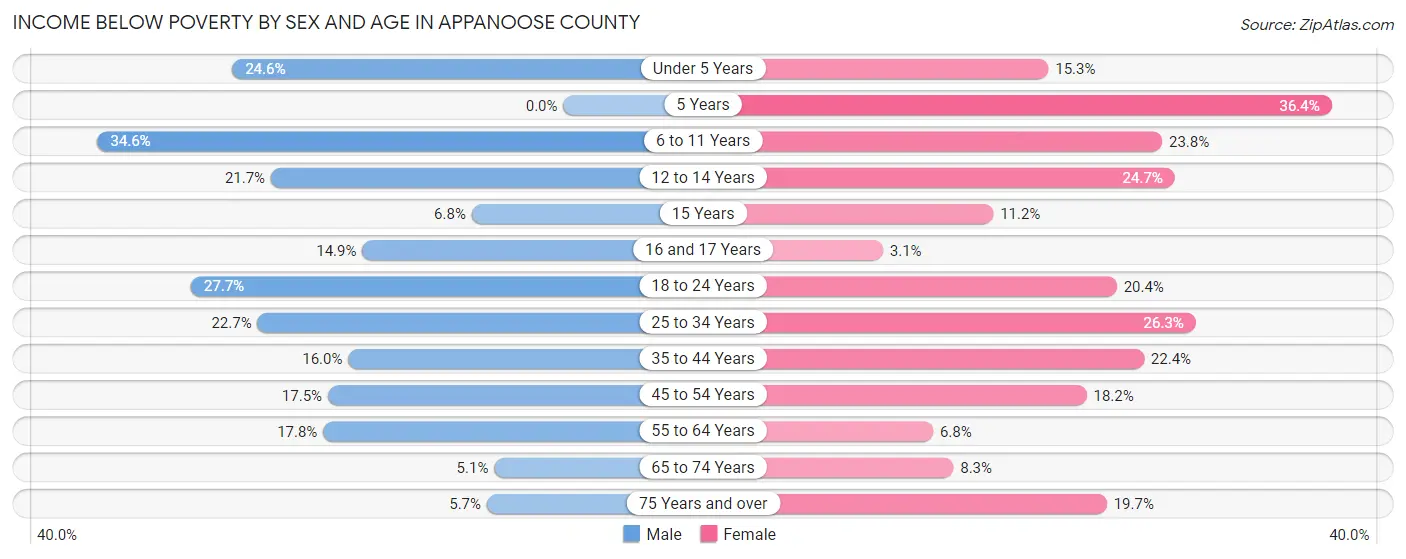
| Age Bracket | Male | Female |
| Under 5 Years | 73 (24.6%) | 46 (15.3%) |
| 5 Years | 0 (0.0%) | 36 (36.4%) |
| 6 to 11 Years | 174 (34.6%) | 122 (23.8%) |
| 12 to 14 Years | 56 (21.7%) | 43 (24.7%) |
| 15 Years | 7 (6.8%) | 10 (11.2%) |
| 16 and 17 Years | 20 (14.9%) | 4 (3.0%) |
| 18 to 24 Years | 128 (27.7%) | 79 (20.4%) |
| 25 to 34 Years | 139 (22.7%) | 165 (26.3%) |
| 35 to 44 Years | 110 (16.0%) | 142 (22.4%) |
| 45 to 54 Years | 132 (17.5%) | 131 (18.2%) |
| 55 to 64 Years | 156 (17.8%) | 61 (6.8%) |
| 65 to 74 Years | 40 (5.1%) | 69 (8.3%) |
| 75 Years and over | 29 (5.7%) | 132 (19.7%) |
| Total | 1,064 (17.6%) | 1,040 (17.1%) |
Income Above Poverty by Sex and Age in Appanoose County
According to the poverty statistics in Appanoose County, males aged 5 years and females aged 16 and 17 years are the age groups that are most secure financially, with 100.0% of males and 97.0% of females in these age groups living above the poverty line.
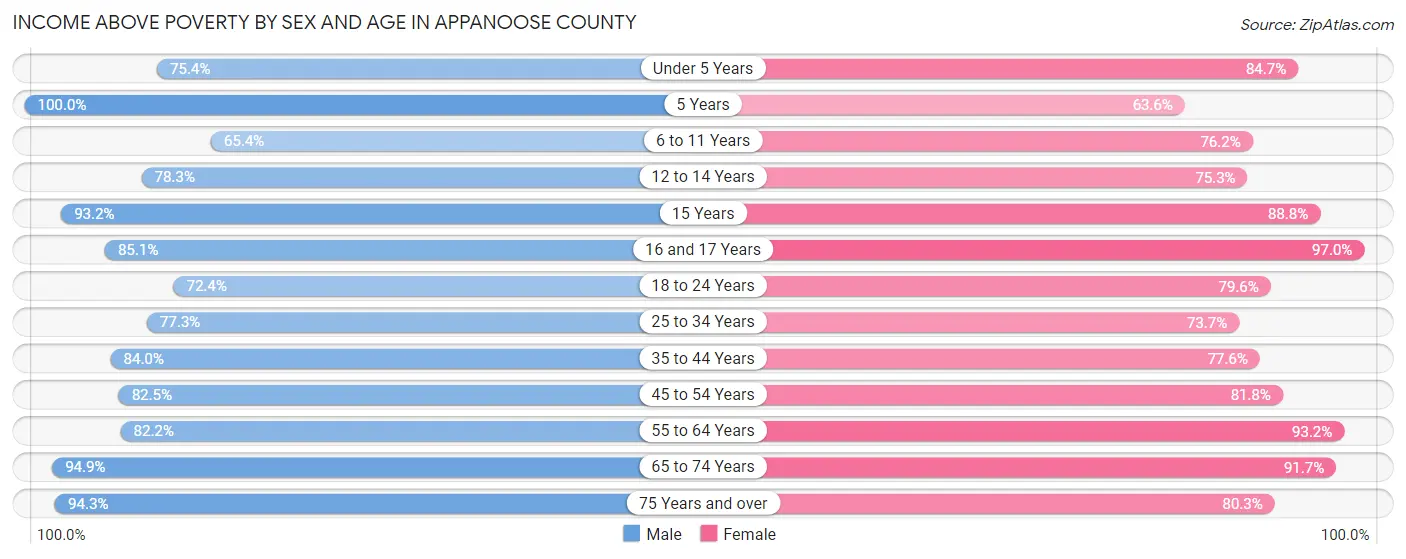
| Age Bracket | Male | Female |
| Under 5 Years | 224 (75.4%) | 254 (84.7%) |
| 5 Years | 70 (100.0%) | 63 (63.6%) |
| 6 to 11 Years | 329 (65.4%) | 391 (76.2%) |
| 12 to 14 Years | 202 (78.3%) | 131 (75.3%) |
| 15 Years | 96 (93.2%) | 79 (88.8%) |
| 16 and 17 Years | 114 (85.1%) | 127 (97.0%) |
| 18 to 24 Years | 335 (72.4%) | 308 (79.6%) |
| 25 to 34 Years | 473 (77.3%) | 463 (73.7%) |
| 35 to 44 Years | 579 (84.0%) | 491 (77.6%) |
| 45 to 54 Years | 623 (82.5%) | 590 (81.8%) |
| 55 to 64 Years | 719 (82.2%) | 840 (93.2%) |
| 65 to 74 Years | 739 (94.9%) | 764 (91.7%) |
| 75 Years and over | 482 (94.3%) | 539 (80.3%) |
| Total | 4,985 (82.4%) | 5,040 (82.9%) |
Income Below Poverty Among Married-Couple Families in Appanoose County
The poverty statistics for married-couple families in Appanoose County show that 8.2% or 202 of the total 2,472 families live below the poverty line. Families with 5 or more children have the highest poverty rate of 59.1%, comprising of 13 families. On the other hand, families with no children have the lowest poverty rate of 3.3%, which includes 58 families.
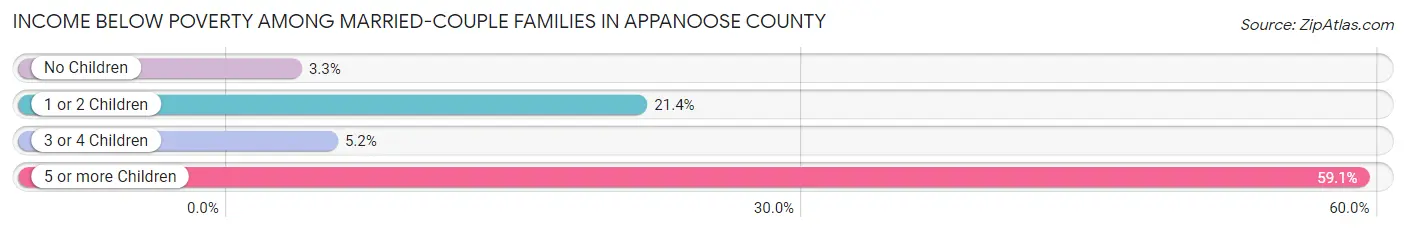
| Children | Above Poverty | Below Poverty |
| No Children | 1,678 (96.7%) | 58 (3.3%) |
| 1 or 2 Children | 456 (78.6%) | 124 (21.4%) |
| 3 or 4 Children | 127 (94.8%) | 7 (5.2%) |
| 5 or more Children | 9 (40.9%) | 13 (59.1%) |
| Total | 2,270 (91.8%) | 202 (8.2%) |
Income Below Poverty Among Single-Parent Households in Appanoose County
According to the poverty data in Appanoose County, 10.8% or 24 single-father households and 25.0% or 119 single-mother households are living below the poverty line. Among single-father households, those with no children have the highest poverty rate, with 22 households (25.6%) experiencing poverty. Likewise, among single-mother households, those with 5 or more children have the highest poverty rate, with 7 households (100.0%) falling below the poverty line.
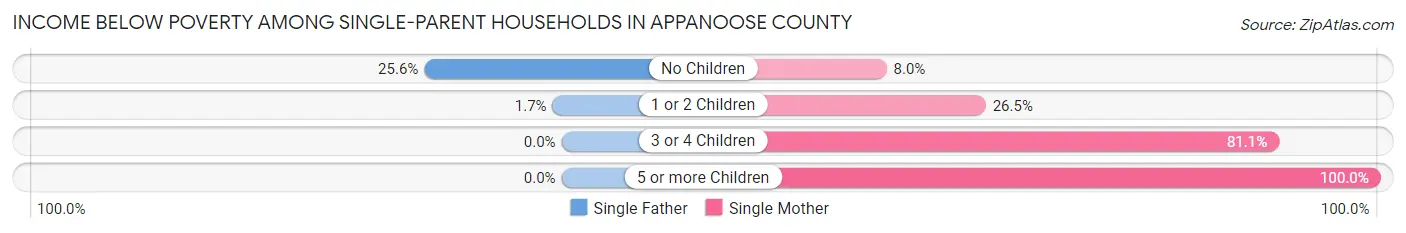
| Children | Single Father | Single Mother |
| No Children | 22 (25.6%) | 14 (8.0%) |
| 1 or 2 Children | 2 (1.7%) | 68 (26.5%) |
| 3 or 4 Children | 0 (0.0%) | 30 (81.1%) |
| 5 or more Children | 0 (0.0%) | 7 (100.0%) |
| Total | 24 (10.8%) | 119 (25.0%) |
Income Below Poverty Among Married-Couple vs Single-Parent Households in Appanoose County
The poverty data for Appanoose County shows that 202 of the married-couple family households (8.2%) and 143 of the single-parent households (20.5%) are living below the poverty level. Within the married-couple family households, those with 5 or more children have the highest poverty rate, with 13 households (59.1%) falling below the poverty line. Among the single-parent households, those with 5 or more children have the highest poverty rate, with 7 household (100.0%) living below poverty.
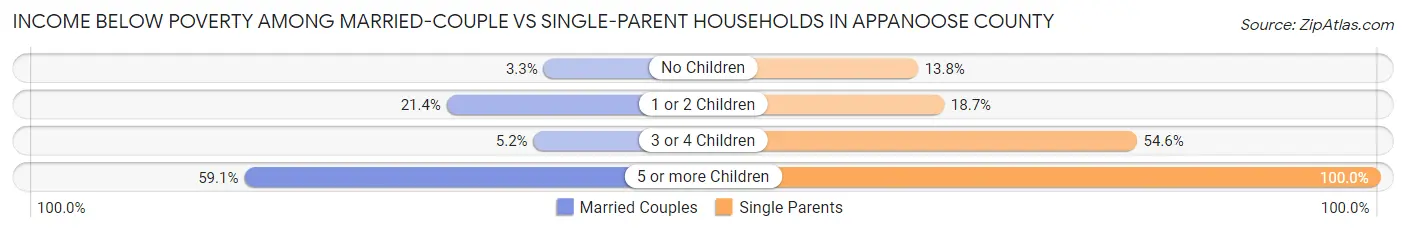
| Children | Married-Couple Families | Single-Parent Households |
| No Children | 58 (3.3%) | 36 (13.8%) |
| 1 or 2 Children | 124 (21.4%) | 70 (18.7%) |
| 3 or 4 Children | 7 (5.2%) | 30 (54.5%) |
| 5 or more Children | 13 (59.1%) | 7 (100.0%) |
| Total | 202 (8.2%) | 143 (20.5%) |
Race in Appanoose County
The most populous races in Appanoose County are White / Caucasian (11,650 | 94.9%), Two or more Races (529 | 4.3%), and Hispanic or Latino (291 | 2.4%).
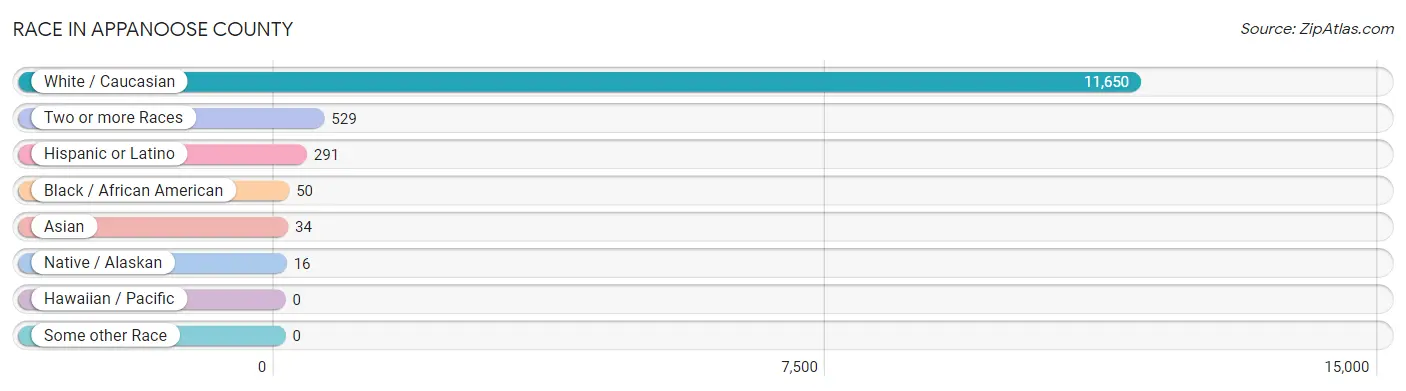
| Race | # Population | % Population |
| Asian | 34 | 0.3% |
| Black / African American | 50 | 0.4% |
| Hawaiian / Pacific | 0 | 0.0% |
| Hispanic or Latino | 291 | 2.4% |
| Native / Alaskan | 16 | 0.1% |
| White / Caucasian | 11,650 | 94.9% |
| Two or more Races | 529 | 4.3% |
| Some other Race | 0 | 0.0% |
| Total | 12,279 | 100.0% |
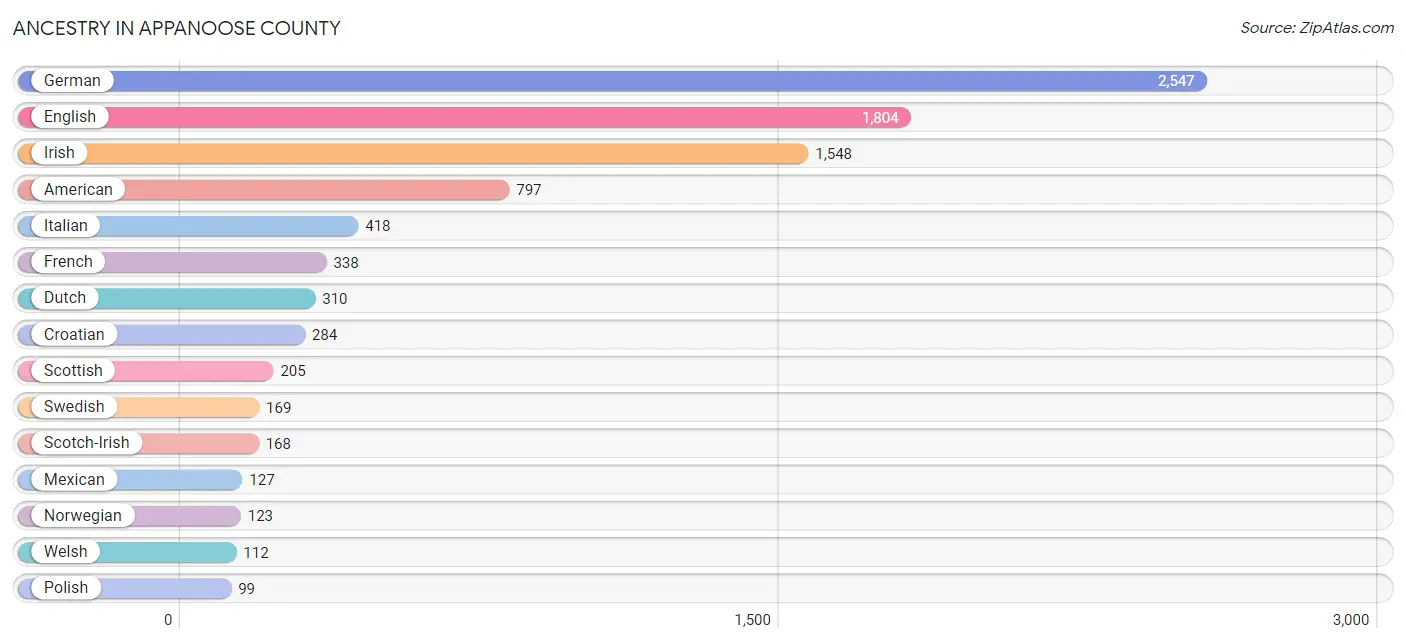
Ancestry in Appanoose County
The most populous ancestries reported in Appanoose County are German (2,547 | 20.7%), English (1,804 | 14.7%), Irish (1,548 | 12.6%), American (797 | 6.5%), and Italian (418 | 3.4%), together accounting for 57.9% of all Appanoose County residents.
| Ancestry | # Population | % Population |
| African | 41 | 0.3% |
| American | 797 | 6.5% |
| Apache | 16 | 0.1% |
| Austrian | 6 | 0.1% |
| Bhutanese | 76 | 0.6% |
| Blackfeet | 3 | 0.0% |
| British | 17 | 0.1% |
| Burmese | 17 | 0.1% |
| Canadian | 5 | 0.0% |
| Celtic | 3 | 0.0% |
| Central American | 42 | 0.3% |
| Cherokee | 32 | 0.3% |
| Croatian | 284 | 2.3% |
| Czech | 66 | 0.5% |
| Czechoslovakian | 5 | 0.0% |
| Danish | 25 | 0.2% |
| Dutch | 310 | 2.5% |
| Eastern European | 18 | 0.2% |
| English | 1,804 | 14.7% |
| European | 84 | 0.7% |
| French | 338 | 2.8% |
| French Canadian | 22 | 0.2% |
| German | 2,547 | 20.7% |
| Greek | 1 | 0.0% |
| Iranian | 27 | 0.2% |
| Irish | 1,548 | 12.6% |
| Italian | 418 | 3.4% |
| Korean | 20 | 0.2% |
| Mexican | 127 | 1.0% |
| Northern European | 5 | 0.0% |
| Norwegian | 123 | 1.0% |
| Pakistani | 2 | 0.0% |
| Pennsylvania German | 6 | 0.1% |
| Polish | 99 | 0.8% |
| Portuguese | 9 | 0.1% |
| Puerto Rican | 76 | 0.6% |
| Russian | 15 | 0.1% |
| Salvadoran | 42 | 0.3% |
| Scandinavian | 39 | 0.3% |
| Scotch-Irish | 168 | 1.4% |
| Scottish | 205 | 1.7% |
| Sioux | 37 | 0.3% |
| Slovak | 7 | 0.1% |
| Spaniard | 46 | 0.4% |
| Subsaharan African | 41 | 0.3% |
| Swedish | 169 | 1.4% |
| Swiss | 28 | 0.2% |
| Thai | 10 | 0.1% |
| Welsh | 112 | 0.9% |
| West Indian | 41 | 0.3% | View All 50 Rows |
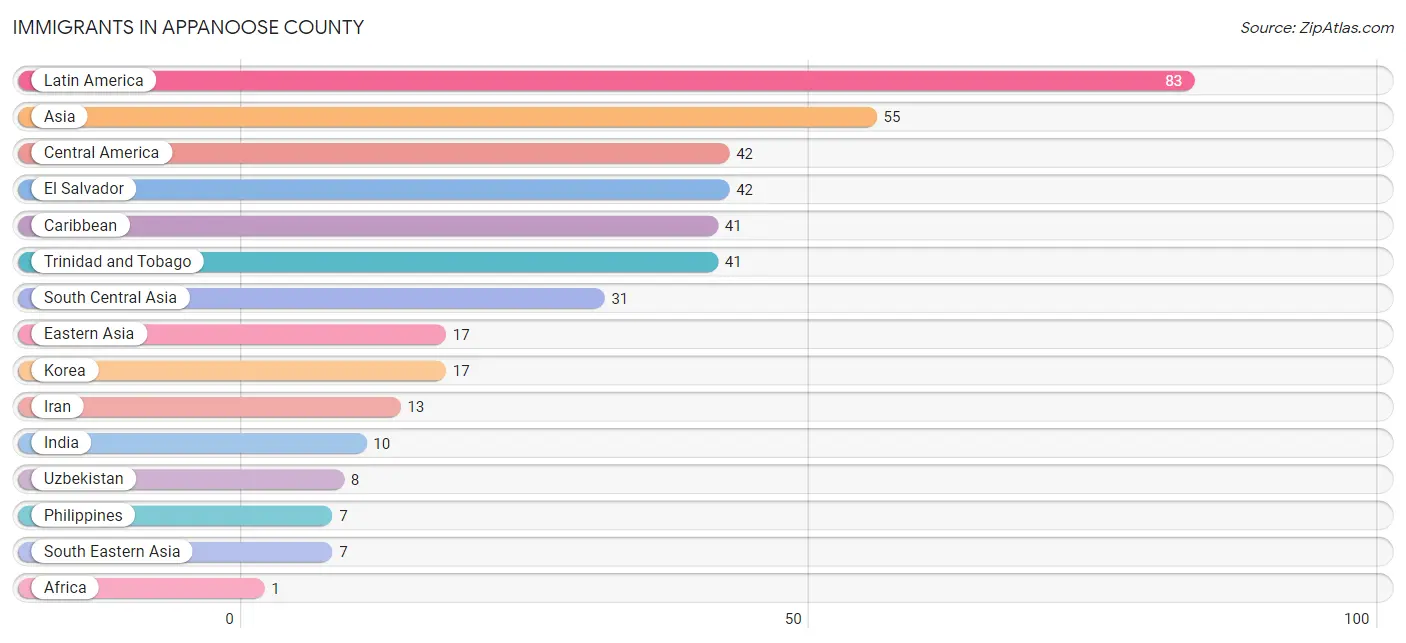
Immigrants in Appanoose County
The most numerous immigrant groups reported in Appanoose County came from Latin America (83 | 0.7%), Asia (55 | 0.4%), Central America (42 | 0.3%), El Salvador (42 | 0.3%), and Caribbean (41 | 0.3%), together accounting for 2.1% of all Appanoose County residents.
| Immigration Origin | # Population | % Population |
| Africa | 1 | 0.0% |
| Asia | 55 | 0.4% |
| Caribbean | 41 | 0.3% |
| Central America | 42 | 0.3% |
| Eastern Asia | 17 | 0.1% |
| Egypt | 1 | 0.0% |
| El Salvador | 42 | 0.3% |
| India | 10 | 0.1% |
| Iran | 13 | 0.1% |
| Korea | 17 | 0.1% |
| Latin America | 83 | 0.7% |
| Northern Africa | 1 | 0.0% |
| Philippines | 7 | 0.1% |
| South Central Asia | 31 | 0.3% |
| South Eastern Asia | 7 | 0.1% |
| Trinidad and Tobago | 41 | 0.3% |
| Uzbekistan | 8 | 0.1% | View All 17 Rows |
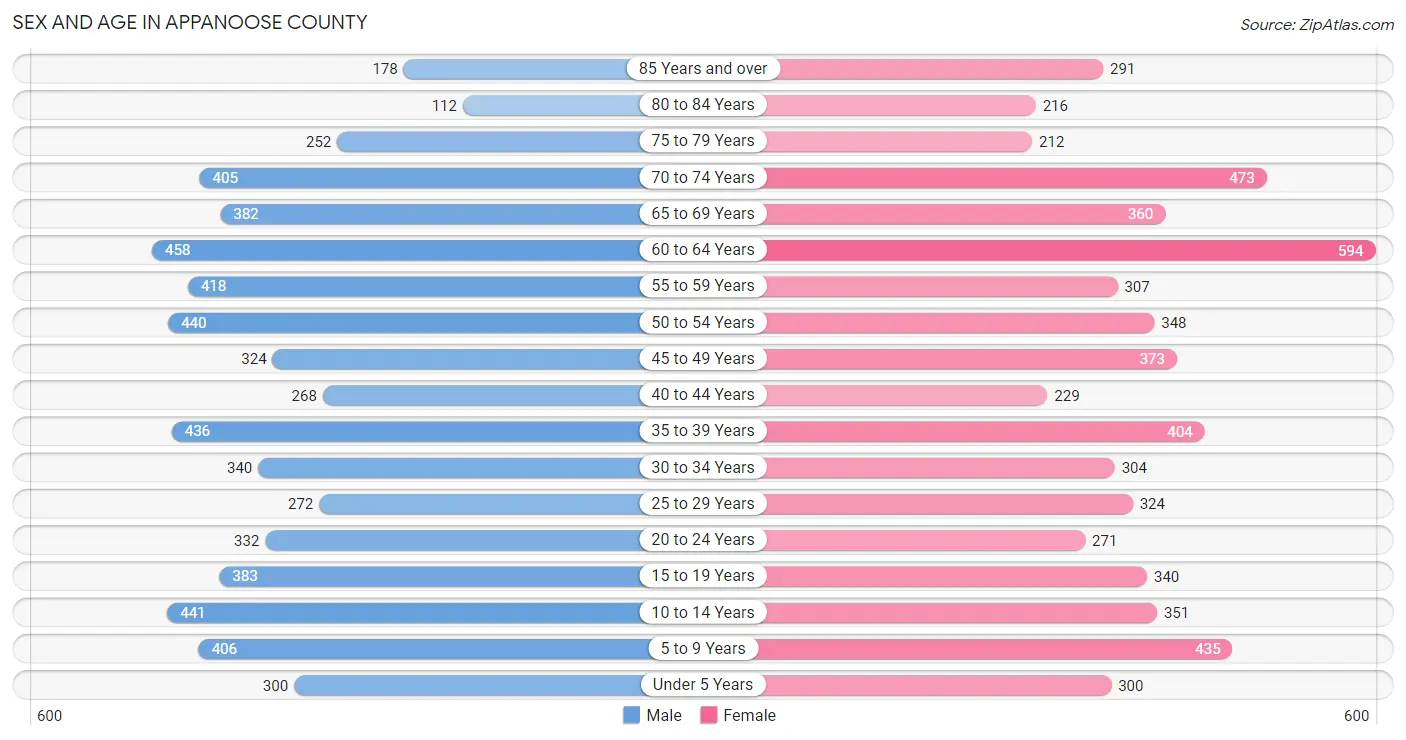
Sex and Age in Appanoose County
Sex and Age in Appanoose County
The most populous age groups in Appanoose County are 60 to 64 Years (458 | 7.4%) for men and 60 to 64 Years (594 | 9.7%) for women.
| Age Bracket | Male | Female |
| Under 5 Years | 300 (4.9%) | 300 (4.9%) |
| 5 to 9 Years | 406 (6.6%) | 435 (7.1%) |
| 10 to 14 Years | 441 (7.2%) | 351 (5.7%) |
| 15 to 19 Years | 383 (6.2%) | 340 (5.5%) |
| 20 to 24 Years | 332 (5.4%) | 271 (4.4%) |
| 25 to 29 Years | 272 (4.4%) | 324 (5.3%) |
| 30 to 34 Years | 340 (5.5%) | 304 (5.0%) |
| 35 to 39 Years | 436 (7.1%) | 404 (6.6%) |
| 40 to 44 Years | 268 (4.4%) | 229 (3.7%) |
| 45 to 49 Years | 324 (5.3%) | 373 (6.1%) |
| 50 to 54 Years | 440 (7.2%) | 348 (5.7%) |
| 55 to 59 Years | 418 (6.8%) | 307 (5.0%) |
| 60 to 64 Years | 458 (7.4%) | 594 (9.7%) |
| 65 to 69 Years | 382 (6.2%) | 360 (5.9%) |
| 70 to 74 Years | 405 (6.6%) | 473 (7.7%) |
| 75 to 79 Years | 252 (4.1%) | 212 (3.5%) |
| 80 to 84 Years | 112 (1.8%) | 216 (3.5%) |
| 85 Years and over | 178 (2.9%) | 291 (4.8%) |
| Total | 6,147 (100.0%) | 6,132 (100.0%) |
Families and Households in Appanoose County
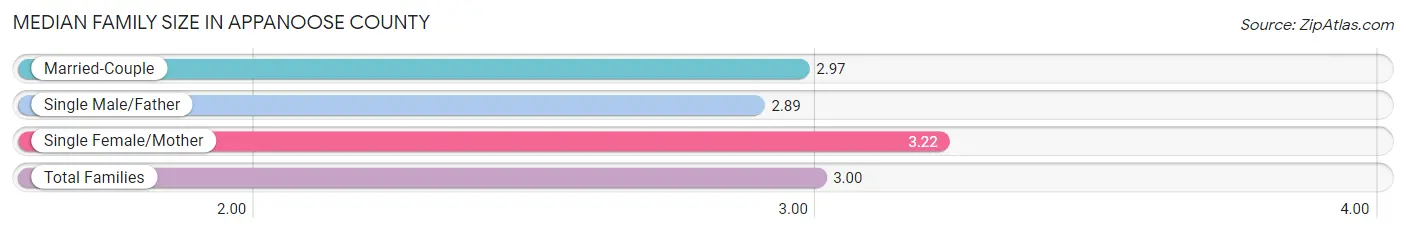
Median Family Size in Appanoose County
The median family size in Appanoose County is 3.00 persons per family, with single female/mother families (476 | 15.0%) accounting for the largest median family size of 3.22 persons per family. On the other hand, single male/father families (222 | 7.0%) represent the smallest median family size with 2.89 persons per family.
| Family Type | # Families | Family Size |
| Married-Couple | 2,472 (78.0%) | 2.97 |
| Single Male/Father | 222 (7.0%) | 2.89 |
| Single Female/Mother | 476 (15.0%) | 3.22 |
| Total Families | 3,170 (100.0%) | 3.00 |
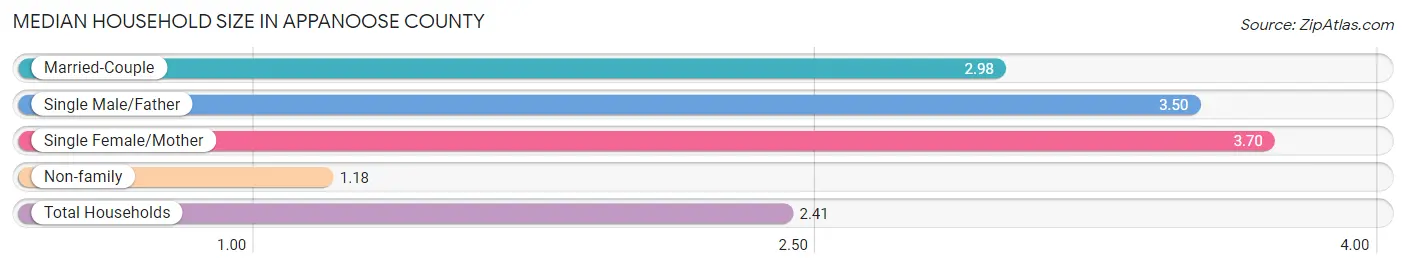
Median Household Size in Appanoose County
The median household size in Appanoose County is 2.41 persons per household, with single female/mother households (476 | 9.5%) accounting for the largest median household size of 3.7 persons per household. non-family households (1,858 | 36.9%) represent the smallest median household size with 1.18 persons per household.
| Household Type | # Households | Household Size |
| Married-Couple | 2,472 (49.2%) | 2.98 |
| Single Male/Father | 222 (4.4%) | 3.50 |
| Single Female/Mother | 476 (9.5%) | 3.70 |
| Non-family | 1,858 (36.9%) | 1.18 |
| Total Households | 5,028 (100.0%) | 2.41 |
Household Size by Marriage Status in Appanoose County
Out of a total of 5,028 households in Appanoose County, 3,170 (63.0%) are family households, while 1,858 (36.9%) are nonfamily households. The most numerous type of family households are 2-person households, comprising 1,670, and the most common type of nonfamily households are 1-person households, comprising 1,603.
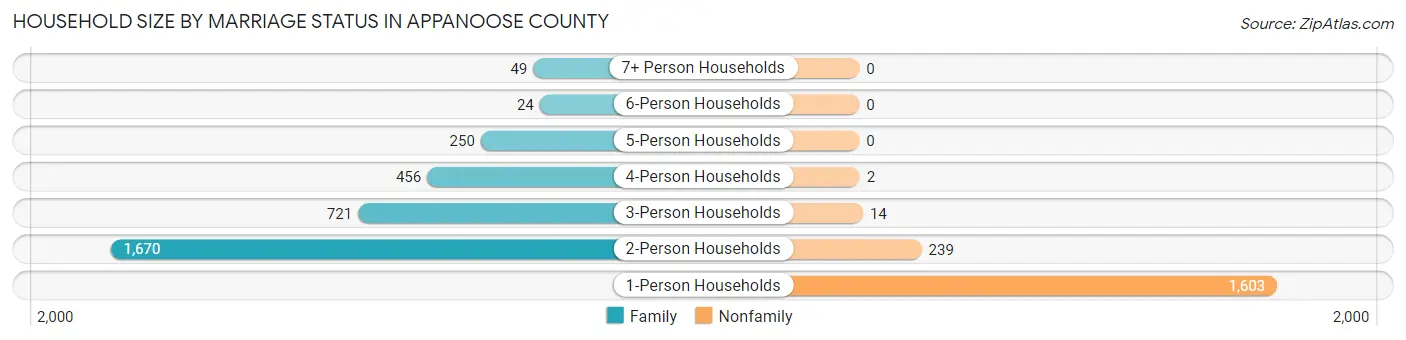
| Household Size | Family Households | Nonfamily Households |
| 1-Person Households | - | 1,603 (31.9%) |
| 2-Person Households | 1,670 (33.2%) | 239 (4.8%) |
| 3-Person Households | 721 (14.3%) | 14 (0.3%) |
| 4-Person Households | 456 (9.1%) | 2 (0.0%) |
| 5-Person Households | 250 (5.0%) | 0 (0.0%) |
| 6-Person Households | 24 (0.5%) | 0 (0.0%) |
| 7+ Person Households | 49 (1.0%) | 0 (0.0%) |
| Total | 3,170 (63.0%) | 1,858 (36.9%) |
Female Fertility in Appanoose County
Fertility by Age in Appanoose County
Average fertility rate in Appanoose County is 45.0 births per 1,000 women. Women in the age bracket of 20 to 34 years have the highest fertility rate with 87.0 births per 1,000 women. Women in the age bracket of 20 to 34 years acount for 75.0% of all women with births.
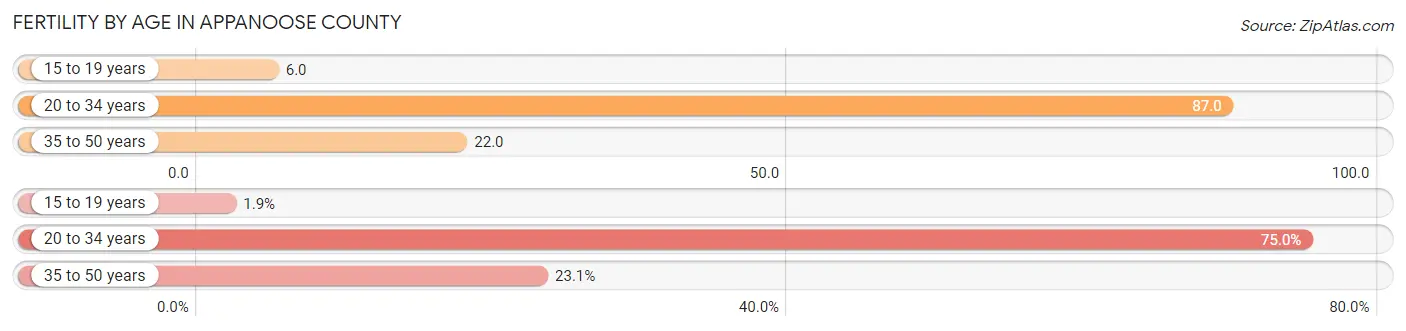
| Age Bracket | Women with Births | Births / 1,000 Women |
| 15 to 19 years | 2 (1.9%) | 6.0 |
| 20 to 34 years | 78 (75.0%) | 87.0 |
| 35 to 50 years | 24 (23.1%) | 22.0 |
| Total | 104 (100.0%) | 45.0 |
Fertility by Age by Marriage Status in Appanoose County
78.8% of women with births (104) in Appanoose County are married. The highest percentage of unmarried women with births falls into 15 to 19 years age bracket with 100.0% of them unmarried at the time of birth, while the lowest percentage of unmarried women with births belong to 35 to 50 years age bracket with 8.3% of them unmarried.
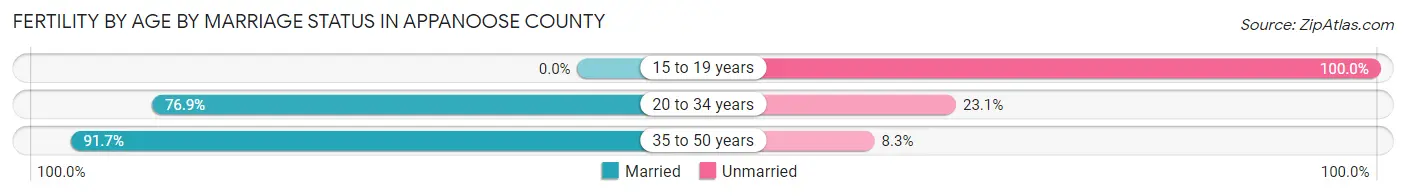
| Age Bracket | Married | Unmarried |
| 15 to 19 years | 0 (0.0%) | 2 (100.0%) |
| 20 to 34 years | 60 (76.9%) | 18 (23.1%) |
| 35 to 50 years | 22 (91.7%) | 2 (8.3%) |
| Total | 82 (78.8%) | 22 (21.1%) |
Fertility by Education in Appanoose County
Average fertility rate in Appanoose County is 45.0 births per 1,000 women. Women with the education attainment of graduate degree have the highest fertility rate of 108.0 births per 1,000 women, while women with the education attainment of less than high school have the lowest fertility at 24.0 births per 1,000 women. Women with the education attainment of high school diploma represent 45.2% of all women with births.
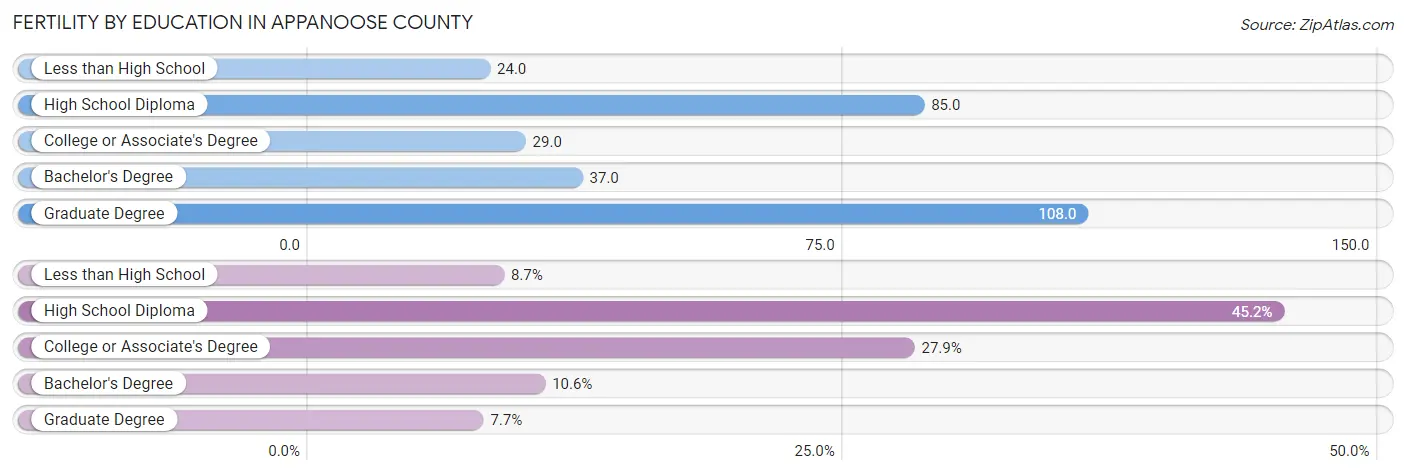
| Educational Attainment | Women with Births | Births / 1,000 Women |
| Less than High School | 9 (8.6%) | 24.0 |
| High School Diploma | 47 (45.2%) | 85.0 |
| College or Associate's Degree | 29 (27.9%) | 29.0 |
| Bachelor's Degree | 11 (10.6%) | 37.0 |
| Graduate Degree | 8 (7.7%) | 108.0 |
| Total | 104 (100.0%) | 45.0 |
Fertility by Education by Marriage Status in Appanoose County
21.1% of women with births in Appanoose County are unmarried. Women with the educational attainment of bachelor's degree are most likely to be married with 100.0% of them married at childbirth, while women with the educational attainment of college or associate's degree are least likely to be married with 41.4% of them unmarried at childbirth.
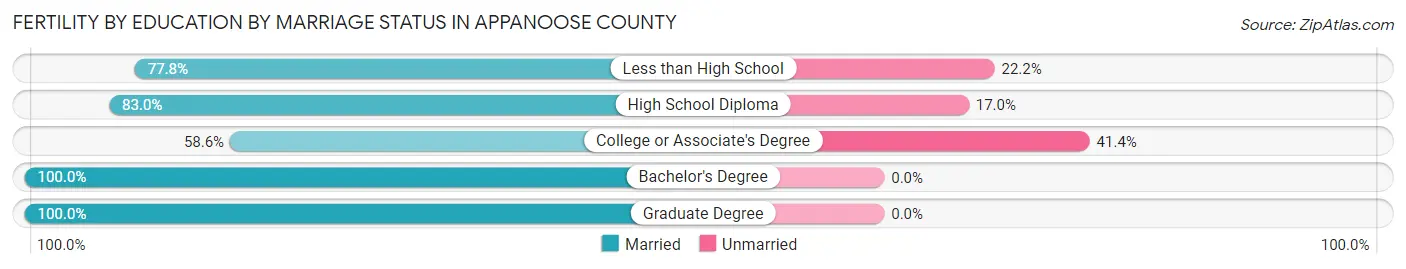
| Educational Attainment | Married | Unmarried |
| Less than High School | 7 (77.8%) | 2 (22.2%) |
| High School Diploma | 39 (83.0%) | 8 (17.0%) |
| College or Associate's Degree | 17 (58.6%) | 12 (41.4%) |
| Bachelor's Degree | 11 (100.0%) | 0 (0.0%) |
| Graduate Degree | 8 (100.0%) | 0 (0.0%) |
| Total | 82 (78.8%) | 22 (21.1%) |
Employment Characteristics in Appanoose County
Employment by Class of Employer in Appanoose County
Among the 4,916 employed individuals in Appanoose County, private company employees (3,235 | 65.8%), self-employed (not incorporated) (491 | 10.0%), and local government employees (377 | 7.7%) make up the most common classes of employment.
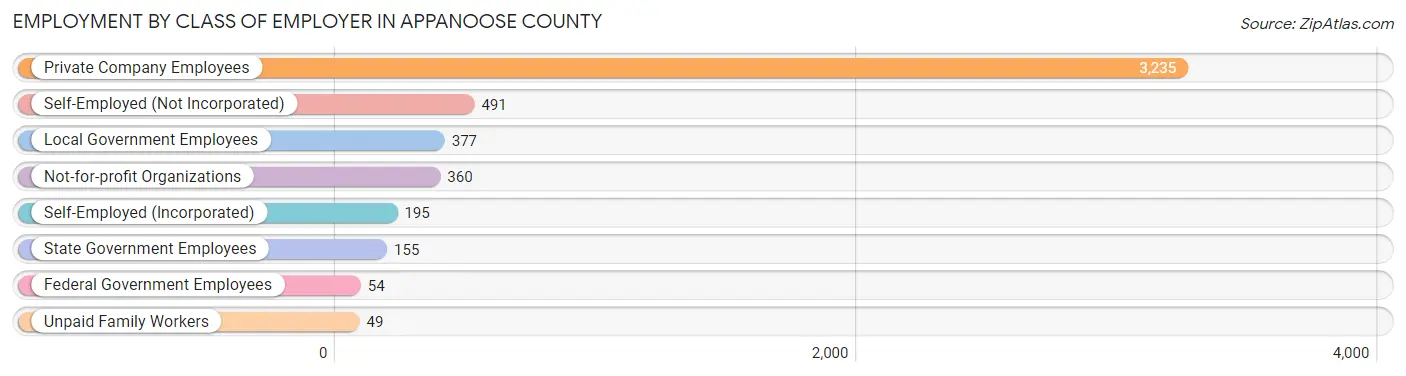
| Employer Class | # Employees | % Employees |
| Private Company Employees | 3,235 | 65.8% |
| Self-Employed (Incorporated) | 195 | 4.0% |
| Self-Employed (Not Incorporated) | 491 | 10.0% |
| Not-for-profit Organizations | 360 | 7.3% |
| Local Government Employees | 377 | 7.7% |
| State Government Employees | 155 | 3.2% |
| Federal Government Employees | 54 | 1.1% |
| Unpaid Family Workers | 49 | 1.0% |
| Total | 4,916 | 100.0% |
Employment Status by Age in Appanoose County
According to the labor force statistics for Appanoose County, out of the total population over 16 years of age (9,854), 53.9% or 5,311 individuals are in the labor force, with 6.1% or 324 of them unemployed. The age group with the highest labor force participation rate is 25 to 29 years, with 77.7% or 463 individuals in the labor force. Within the labor force, the 20 to 24 years age range has the highest percentage of unemployed individuals, with 18.9% or 80 of them being unemployed.
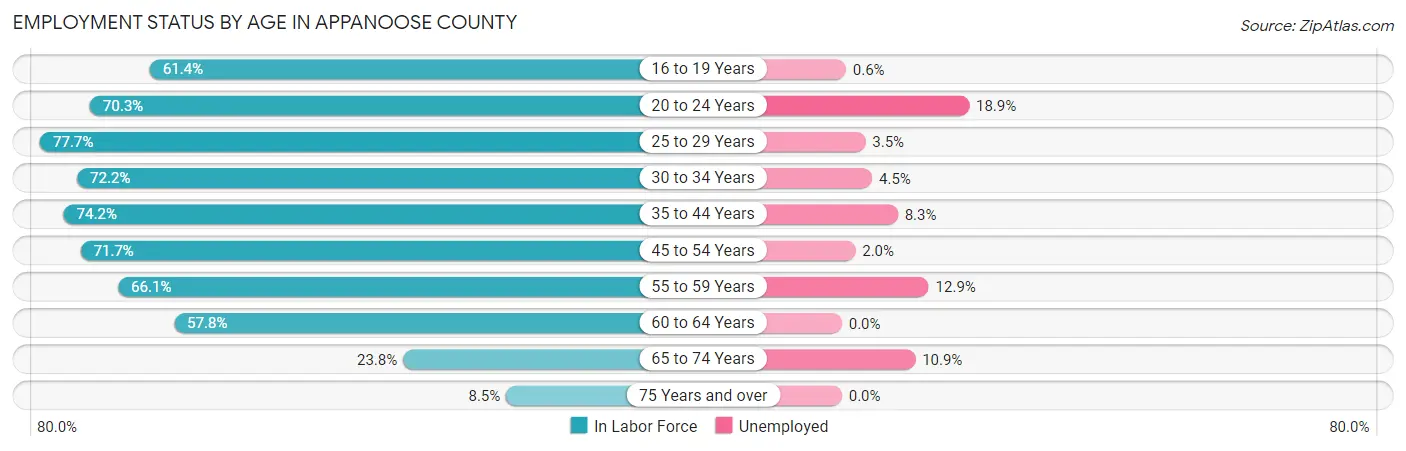
| Age Bracket | In Labor Force | Unemployed |
| 16 to 19 Years | 326 (61.4%) | 2 (0.6%) |
| 20 to 24 Years | 424 (70.3%) | 80 (18.9%) |
| 25 to 29 Years | 463 (77.7%) | 16 (3.5%) |
| 30 to 34 Years | 465 (72.2%) | 21 (4.5%) |
| 35 to 44 Years | 992 (74.2%) | 82 (8.3%) |
| 45 to 54 Years | 1,065 (71.7%) | 21 (2.0%) |
| 55 to 59 Years | 479 (66.1%) | 62 (12.9%) |
| 60 to 64 Years | 608 (57.8%) | 0 (0.0%) |
| 65 to 74 Years | 386 (23.8%) | 42 (10.9%) |
| 75 Years and over | 107 (8.5%) | 0 (0.0%) |
| Total | 5,311 (53.9%) | 324 (6.1%) |
Employment Status by Educational Attainment in Appanoose County
According to labor force statistics for Appanoose County, 69.7% of individuals (4,070) out of the total population between 25 and 64 years of age (5,839) are in the labor force, with 5.0% or 204 of them being unemployed. The group with the highest labor force participation rate are those with the educational attainment of bachelor's degree or higher, with 84.6% or 832 individuals in the labor force. Within the labor force, individuals with less than high school education have the highest percentage of unemployment, with 9.7% or 16 of them being unemployed.
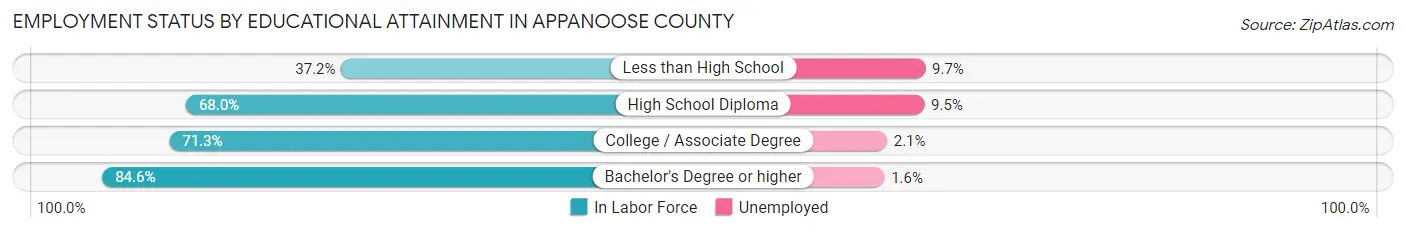
| Educational Attainment | In Labor Force | Unemployed |
| Less than High School | 165 (37.2%) | 43 (9.7%) |
| High School Diploma | 1,461 (68.0%) | 204 (9.5%) |
| College / Associate Degree | 1,614 (71.3%) | 48 (2.1%) |
| Bachelor's Degree or higher | 832 (84.6%) | 16 (1.6%) |
| Total | 4,070 (69.7%) | 292 (5.0%) |
Employment Occupations by Sex in Appanoose County
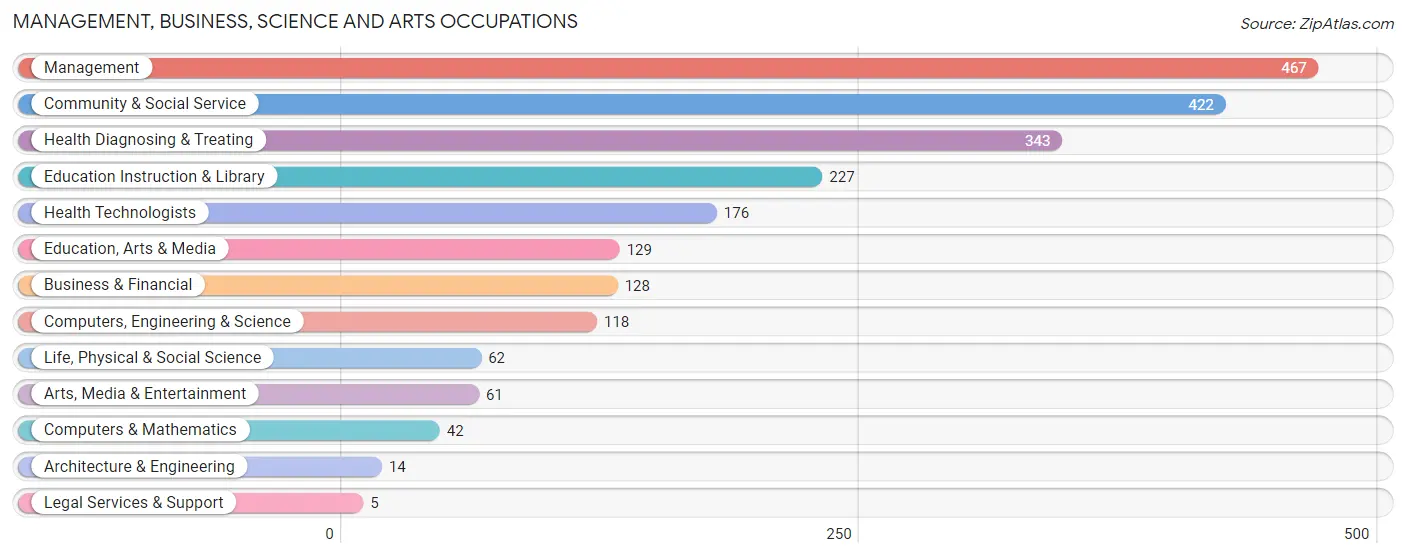
Management, Business, Science and Arts Occupations
The most common Management, Business, Science and Arts occupations in Appanoose County are Management (467 | 9.4%), Community & Social Service (422 | 8.5%), Health Diagnosing & Treating (343 | 6.9%), Education Instruction & Library (227 | 4.5%), and Health Technologists (176 | 3.5%).
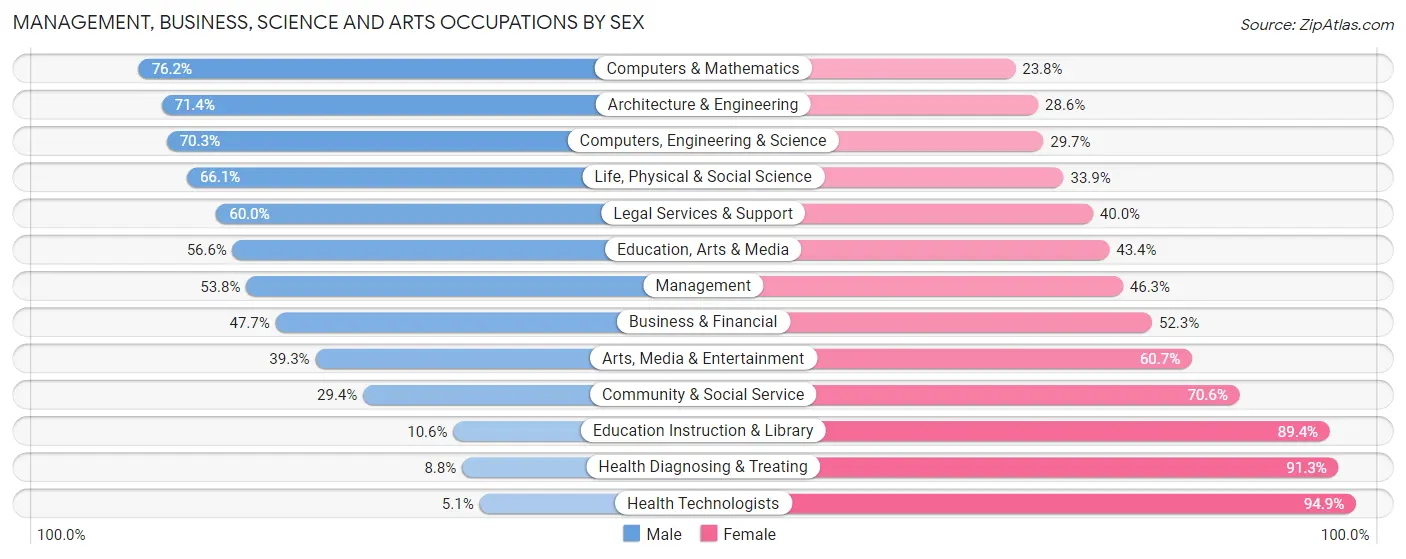
Management, Business, Science and Arts Occupations by Sex
Within the Management, Business, Science and Arts occupations in Appanoose County, the most male-oriented occupations are Computers & Mathematics (76.2%), Architecture & Engineering (71.4%), and Computers, Engineering & Science (70.3%), while the most female-oriented occupations are Health Technologists (94.9%), Health Diagnosing & Treating (91.2%), and Education Instruction & Library (89.4%).
| Occupation | Male | Female |
| Management | 251 (53.7%) | 216 (46.3%) |
| Business & Financial | 61 (47.7%) | 67 (52.3%) |
| Computers, Engineering & Science | 83 (70.3%) | 35 (29.7%) |
| Computers & Mathematics | 32 (76.2%) | 10 (23.8%) |
| Architecture & Engineering | 10 (71.4%) | 4 (28.6%) |
| Life, Physical & Social Science | 41 (66.1%) | 21 (33.9%) |
| Community & Social Service | 124 (29.4%) | 298 (70.6%) |
| Education, Arts & Media | 73 (56.6%) | 56 (43.4%) |
| Legal Services & Support | 3 (60.0%) | 2 (40.0%) |
| Education Instruction & Library | 24 (10.6%) | 203 (89.4%) |
| Arts, Media & Entertainment | 24 (39.3%) | 37 (60.7%) |
| Health Diagnosing & Treating | 30 (8.7%) | 313 (91.2%) |
| Health Technologists | 9 (5.1%) | 167 (94.9%) |
| Total (Category) | 549 (37.1%) | 929 (62.9%) |
| Total (Overall) | 2,537 (50.8%) | 2,452 (49.1%) |
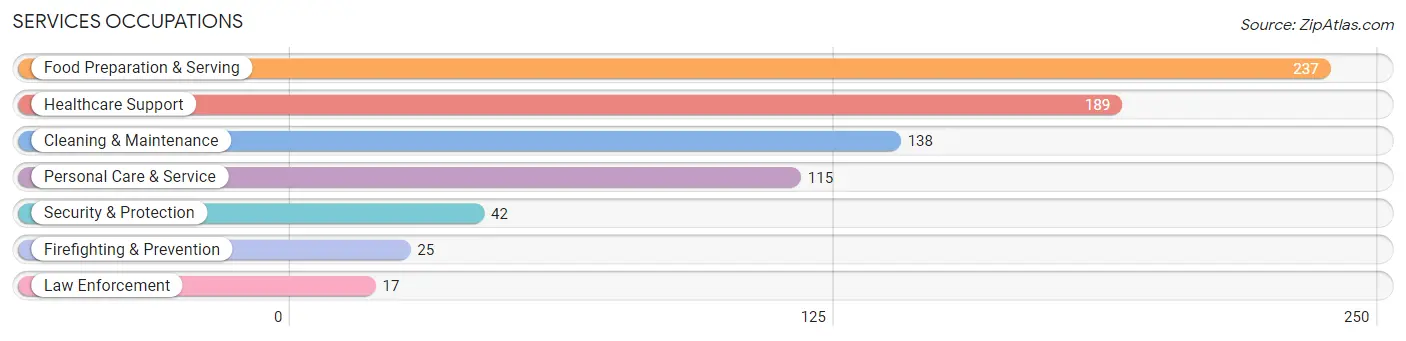
Services Occupations
The most common Services occupations in Appanoose County are Food Preparation & Serving (237 | 4.8%), Healthcare Support (189 | 3.8%), Cleaning & Maintenance (138 | 2.8%), Personal Care & Service (115 | 2.3%), and Security & Protection (42 | 0.8%).
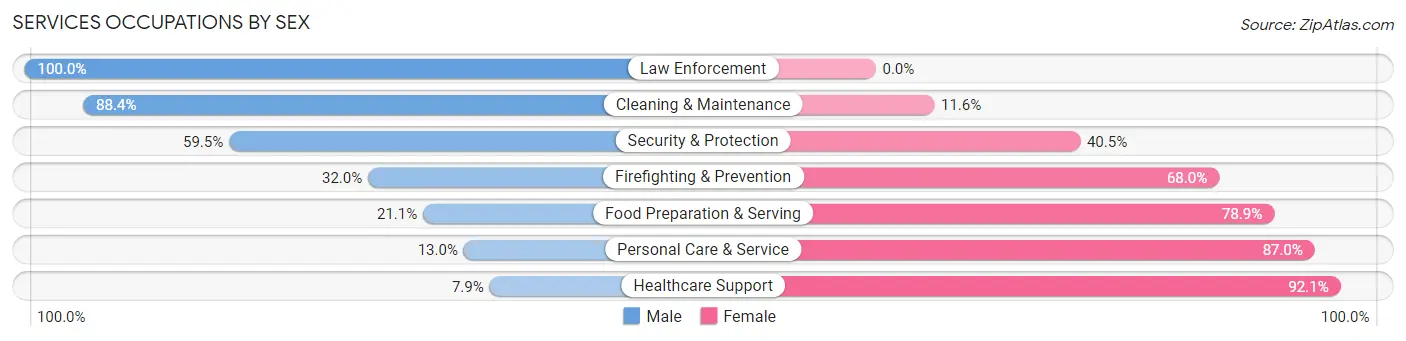
Services Occupations by Sex
Within the Services occupations in Appanoose County, the most male-oriented occupations are Law Enforcement (100.0%), Cleaning & Maintenance (88.4%), and Security & Protection (59.5%), while the most female-oriented occupations are Healthcare Support (92.1%), Personal Care & Service (87.0%), and Food Preparation & Serving (78.9%).
| Occupation | Male | Female |
| Healthcare Support | 15 (7.9%) | 174 (92.1%) |
| Security & Protection | 25 (59.5%) | 17 (40.5%) |
| Firefighting & Prevention | 8 (32.0%) | 17 (68.0%) |
| Law Enforcement | 17 (100.0%) | 0 (0.0%) |
| Food Preparation & Serving | 50 (21.1%) | 187 (78.9%) |
| Cleaning & Maintenance | 122 (88.4%) | 16 (11.6%) |
| Personal Care & Service | 15 (13.0%) | 100 (87.0%) |
| Total (Category) | 227 (31.5%) | 494 (68.5%) |
| Total (Overall) | 2,537 (50.8%) | 2,452 (49.1%) |
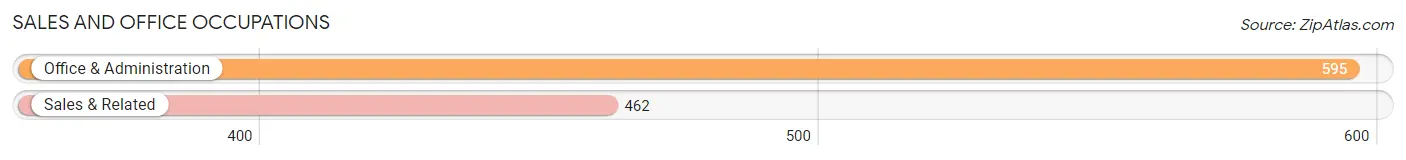
Sales and Office Occupations
The most common Sales and Office occupations in Appanoose County are Office & Administration (595 | 11.9%), and Sales & Related (462 | 9.3%).
Sales and Office Occupations by Sex
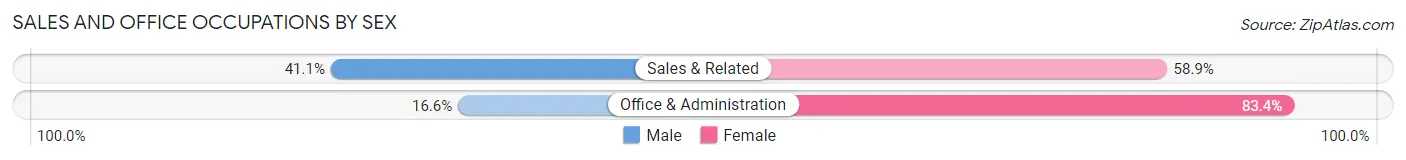
| Occupation | Male | Female |
| Sales & Related | 190 (41.1%) | 272 (58.9%) |
| Office & Administration | 99 (16.6%) | 496 (83.4%) |
| Total (Category) | 289 (27.3%) | 768 (72.7%) |
| Total (Overall) | 2,537 (50.8%) | 2,452 (49.1%) |
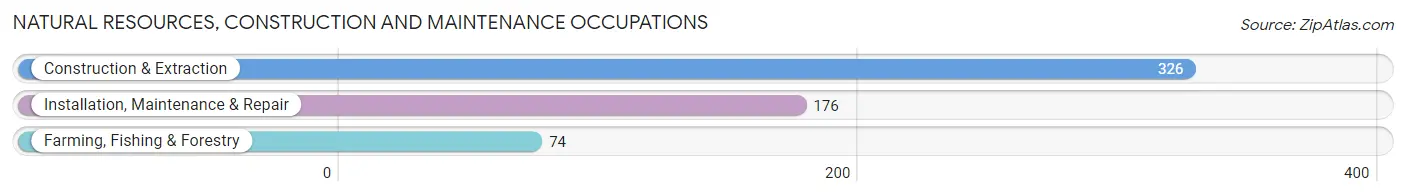
Natural Resources, Construction and Maintenance Occupations
The most common Natural Resources, Construction and Maintenance occupations in Appanoose County are Construction & Extraction (326 | 6.5%), Installation, Maintenance & Repair (176 | 3.5%), and Farming, Fishing & Forestry (74 | 1.5%).
Natural Resources, Construction and Maintenance Occupations by Sex
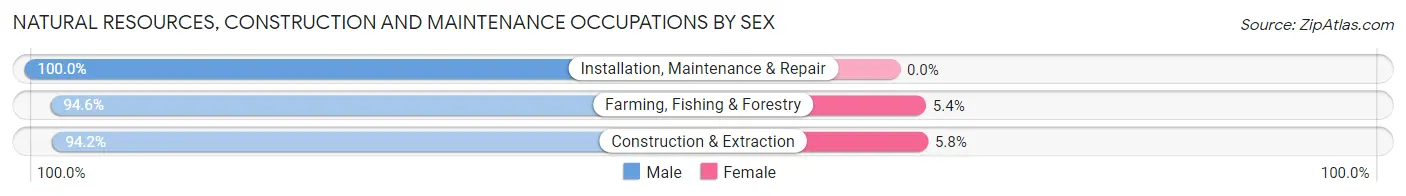
| Occupation | Male | Female |
| Farming, Fishing & Forestry | 70 (94.6%) | 4 (5.4%) |
| Construction & Extraction | 307 (94.2%) | 19 (5.8%) |
| Installation, Maintenance & Repair | 176 (100.0%) | 0 (0.0%) |
| Total (Category) | 553 (96.0%) | 23 (4.0%) |
| Total (Overall) | 2,537 (50.8%) | 2,452 (49.1%) |
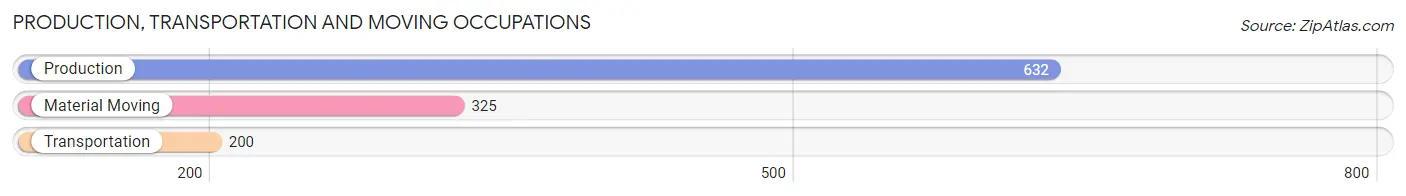
Production, Transportation and Moving Occupations
The most common Production, Transportation and Moving occupations in Appanoose County are Production (632 | 12.7%), Material Moving (325 | 6.5%), and Transportation (200 | 4.0%).
Production, Transportation and Moving Occupations by Sex
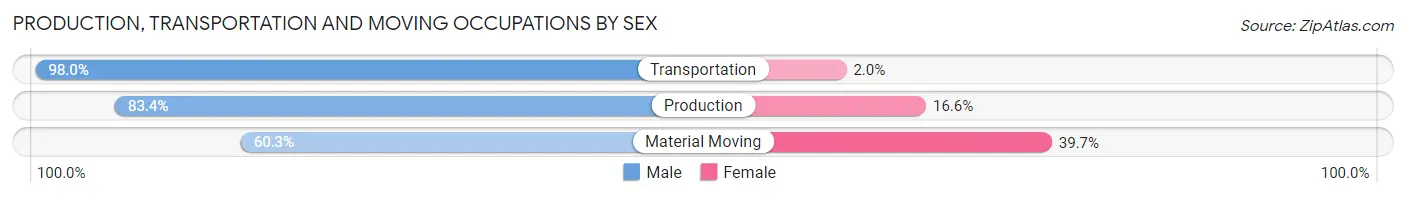
| Occupation | Male | Female |
| Production | 527 (83.4%) | 105 (16.6%) |
| Transportation | 196 (98.0%) | 4 (2.0%) |
| Material Moving | 196 (60.3%) | 129 (39.7%) |
| Total (Category) | 919 (79.4%) | 238 (20.6%) |
| Total (Overall) | 2,537 (50.8%) | 2,452 (49.1%) |
Employment Industries by Sex in Appanoose County
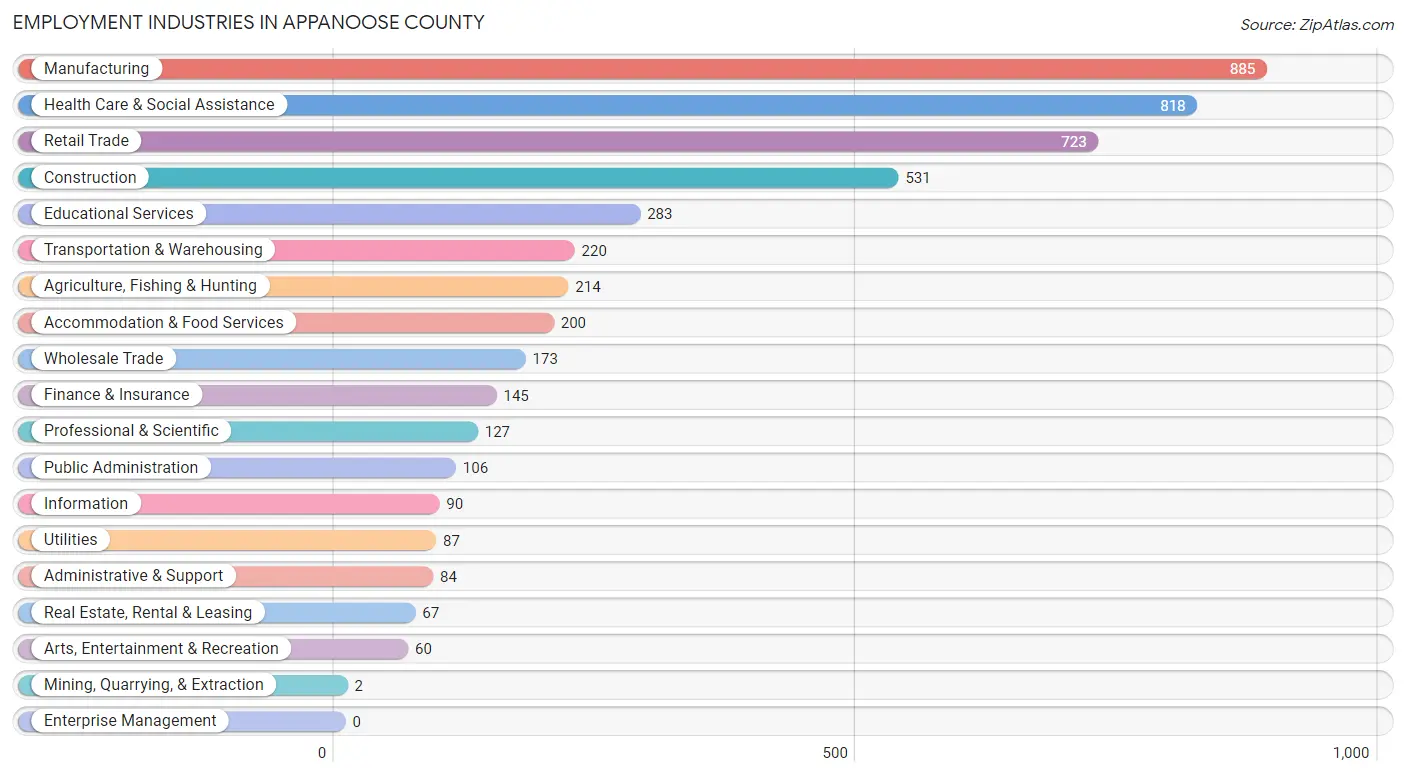
Employment Industries in Appanoose County
The major employment industries in Appanoose County include Manufacturing (885 | 17.7%), Health Care & Social Assistance (818 | 16.4%), Retail Trade (723 | 14.5%), Construction (531 | 10.6%), and Educational Services (283 | 5.7%).
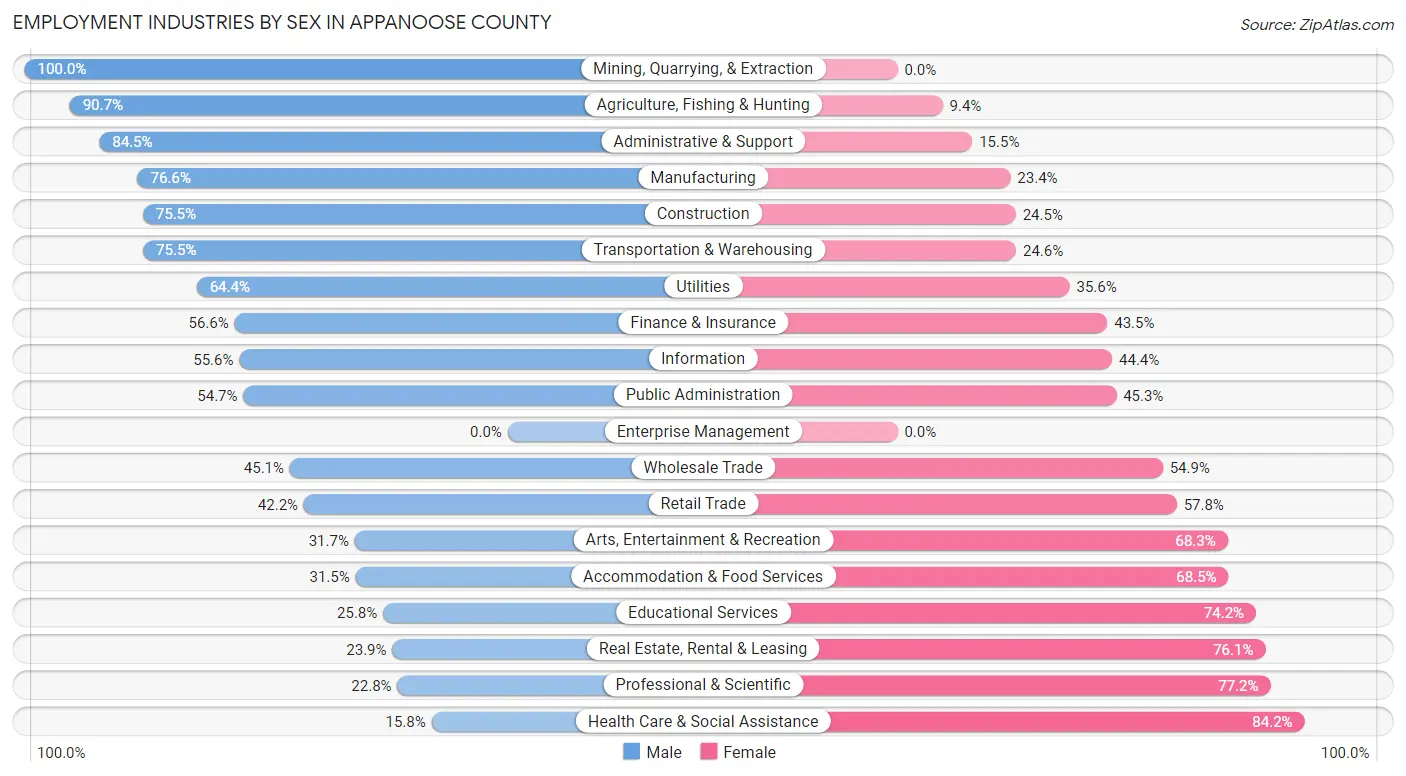
Employment Industries by Sex in Appanoose County
The Appanoose County industries that see more men than women are Mining, Quarrying, & Extraction (100.0%), Agriculture, Fishing & Hunting (90.6%), and Administrative & Support (84.5%), whereas the industries that tend to have a higher number of women are Health Care & Social Assistance (84.2%), Professional & Scientific (77.2%), and Real Estate, Rental & Leasing (76.1%).
| Industry | Male | Female |
| Agriculture, Fishing & Hunting | 194 (90.6%) | 20 (9.3%) |
| Mining, Quarrying, & Extraction | 2 (100.0%) | 0 (0.0%) |
| Construction | 401 (75.5%) | 130 (24.5%) |
| Manufacturing | 678 (76.6%) | 207 (23.4%) |
| Wholesale Trade | 78 (45.1%) | 95 (54.9%) |
| Retail Trade | 305 (42.2%) | 418 (57.8%) |
| Transportation & Warehousing | 166 (75.4%) | 54 (24.5%) |
| Utilities | 56 (64.4%) | 31 (35.6%) |
| Information | 50 (55.6%) | 40 (44.4%) |
| Finance & Insurance | 82 (56.6%) | 63 (43.4%) |
| Real Estate, Rental & Leasing | 16 (23.9%) | 51 (76.1%) |
| Professional & Scientific | 29 (22.8%) | 98 (77.2%) |
| Enterprise Management | 0 (0.0%) | 0 (0.0%) |
| Administrative & Support | 71 (84.5%) | 13 (15.5%) |
| Educational Services | 73 (25.8%) | 210 (74.2%) |
| Health Care & Social Assistance | 129 (15.8%) | 689 (84.2%) |
| Arts, Entertainment & Recreation | 19 (31.7%) | 41 (68.3%) |
| Accommodation & Food Services | 63 (31.5%) | 137 (68.5%) |
| Public Administration | 58 (54.7%) | 48 (45.3%) |
| Total | 2,537 (50.8%) | 2,452 (49.1%) |
Education in Appanoose County
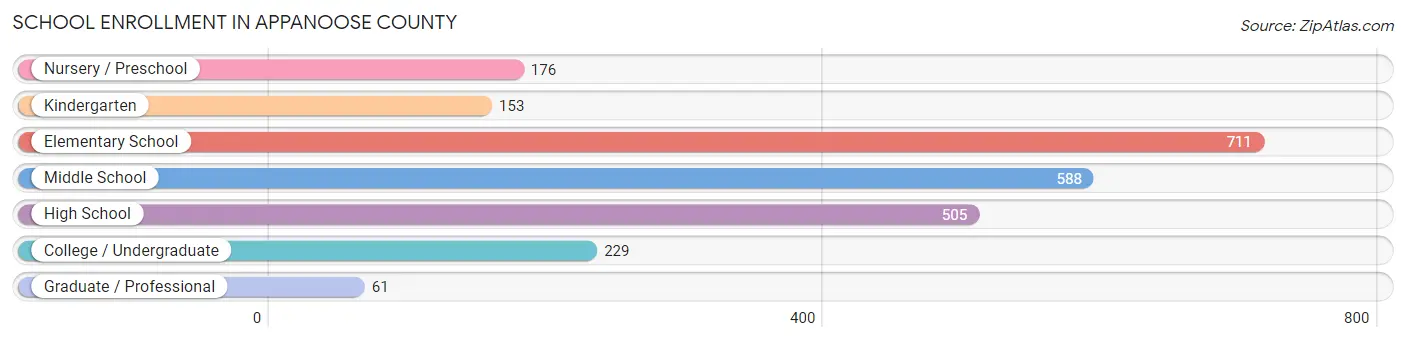
School Enrollment in Appanoose County
The most common levels of schooling among the 2,423 students in Appanoose County are elementary school (711 | 29.3%), middle school (588 | 24.3%), and high school (505 | 20.8%).
| School Level | # Students | % Students |
| Nursery / Preschool | 176 | 7.3% |
| Kindergarten | 153 | 6.3% |
| Elementary School | 711 | 29.3% |
| Middle School | 588 | 24.3% |
| High School | 505 | 20.8% |
| College / Undergraduate | 229 | 9.5% |
| Graduate / Professional | 61 | 2.5% |
| Total | 2,423 | 100.0% |
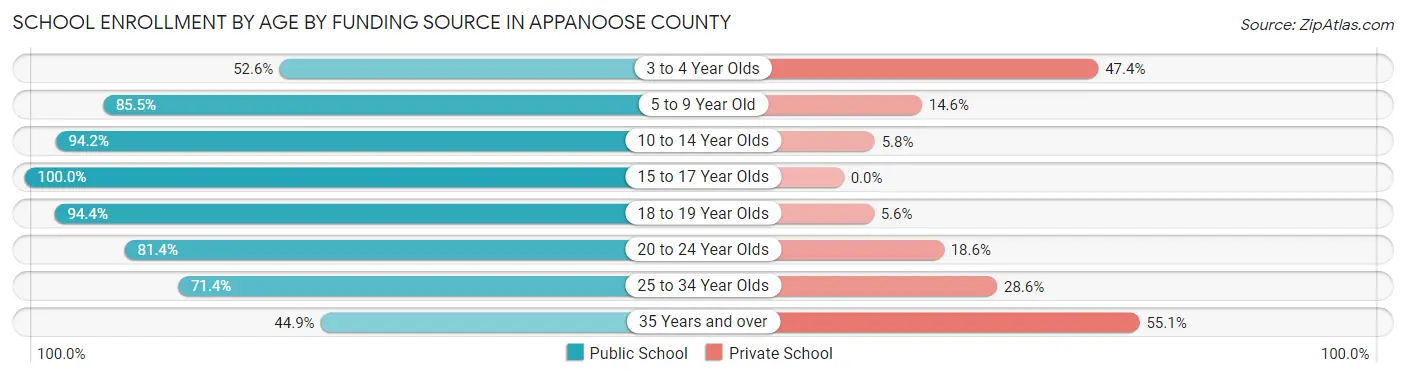
School Enrollment by Age by Funding Source in Appanoose County
Out of a total of 2,423 students who are enrolled in schools in Appanoose County, 279 (11.5%) attend a private institution, while the remaining 2,144 (88.5%) are enrolled in public schools. The age group of 35 years and over has the highest likelihood of being enrolled in private schools, with 27 (55.1% in the age bracket) enrolled. Conversely, the age group of 15 to 17 year olds has the lowest likelihood of being enrolled in a private school, with 377 (100.0% in the age bracket) attending a public institution.
| Age Bracket | Public School | Private School |
| 3 to 4 Year Olds | 51 (52.6%) | 46 (47.4%) |
| 5 to 9 Year Old | 699 (85.5%) | 119 (14.5%) |
| 10 to 14 Year Olds | 717 (94.2%) | 44 (5.8%) |
| 15 to 17 Year Olds | 377 (100.0%) | 0 (0.0%) |
| 18 to 19 Year Olds | 152 (94.4%) | 9 (5.6%) |
| 20 to 24 Year Olds | 96 (81.4%) | 22 (18.6%) |
| 25 to 34 Year Olds | 30 (71.4%) | 12 (28.6%) |
| 35 Years and over | 22 (44.9%) | 27 (55.1%) |
| Total | 2,144 (88.5%) | 279 (11.5%) |
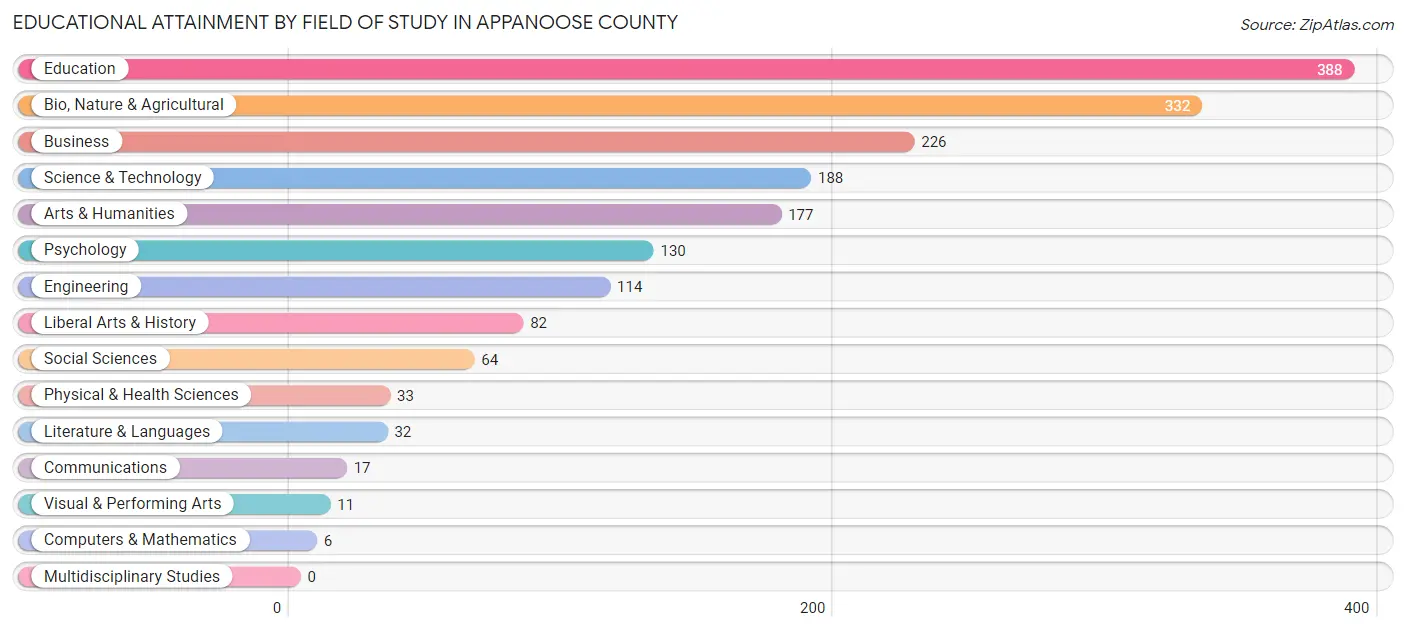
Educational Attainment by Field of Study in Appanoose County
Education (388 | 21.6%), bio, nature & agricultural (332 | 18.4%), business (226 | 12.6%), science & technology (188 | 10.4%), and arts & humanities (177 | 9.8%) are the most common fields of study among 1,800 individuals in Appanoose County who have obtained a bachelor's degree or higher.
| Field of Study | # Graduates | % Graduates |
| Computers & Mathematics | 6 | 0.3% |
| Bio, Nature & Agricultural | 332 | 18.4% |
| Physical & Health Sciences | 33 | 1.8% |
| Psychology | 130 | 7.2% |
| Social Sciences | 64 | 3.6% |
| Engineering | 114 | 6.3% |
| Multidisciplinary Studies | 0 | 0.0% |
| Science & Technology | 188 | 10.4% |
| Business | 226 | 12.6% |
| Education | 388 | 21.6% |
| Literature & Languages | 32 | 1.8% |
| Liberal Arts & History | 82 | 4.6% |
| Visual & Performing Arts | 11 | 0.6% |
| Communications | 17 | 0.9% |
| Arts & Humanities | 177 | 9.8% |
| Total | 1,800 | 100.0% |
Transportation & Commute in Appanoose County
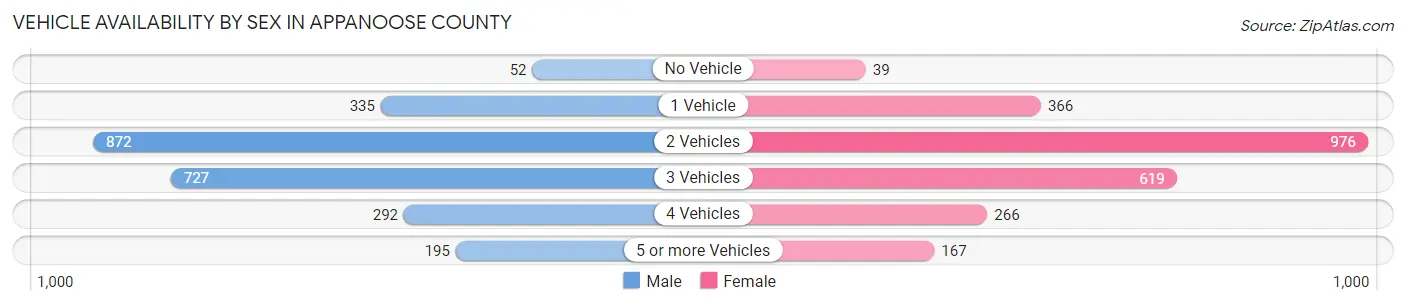
Vehicle Availability by Sex in Appanoose County
The most prevalent vehicle ownership categories in Appanoose County are males with 2 vehicles (872, accounting for 35.3%) and females with 2 vehicles (976, making up 35.8%).
| Vehicles Available | Male | Female |
| No Vehicle | 52 (2.1%) | 39 (1.6%) |
| 1 Vehicle | 335 (13.6%) | 366 (15.0%) |
| 2 Vehicles | 872 (35.3%) | 976 (40.1%) |
| 3 Vehicles | 727 (29.4%) | 619 (25.4%) |
| 4 Vehicles | 292 (11.8%) | 266 (10.9%) |
| 5 or more Vehicles | 195 (7.9%) | 167 (6.9%) |
| Total | 2,473 (100.0%) | 2,433 (100.0%) |
Commute Time in Appanoose County
The most frequently occuring commute durations in Appanoose County are 5 to 9 minutes (869 commuters, 18.6%), 10 to 14 minutes (831 commuters, 17.8%), and 15 to 19 minutes (591 commuters, 12.7%).
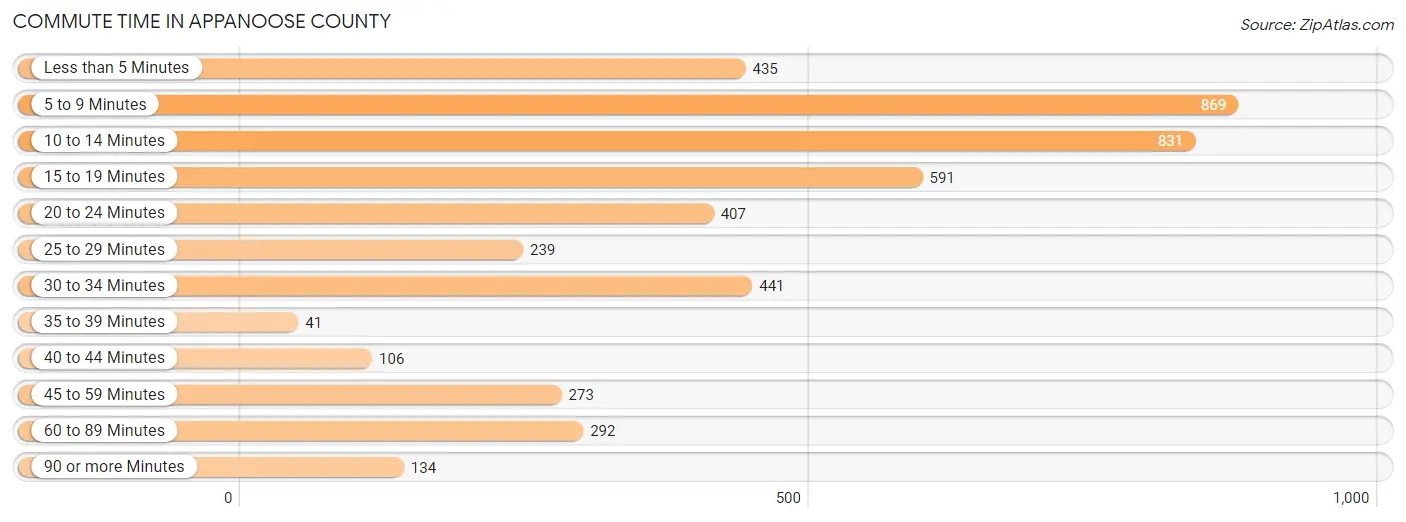
| Commute Time | # Commuters | % Commuters |
| Less than 5 Minutes | 435 | 9.3% |
| 5 to 9 Minutes | 869 | 18.6% |
| 10 to 14 Minutes | 831 | 17.8% |
| 15 to 19 Minutes | 591 | 12.7% |
| 20 to 24 Minutes | 407 | 8.7% |
| 25 to 29 Minutes | 239 | 5.1% |
| 30 to 34 Minutes | 441 | 9.5% |
| 35 to 39 Minutes | 41 | 0.9% |
| 40 to 44 Minutes | 106 | 2.3% |
| 45 to 59 Minutes | 273 | 5.9% |
| 60 to 89 Minutes | 292 | 6.3% |
| 90 or more Minutes | 134 | 2.9% |
Commute Time by Sex in Appanoose County
The most common commute times in Appanoose County are 5 to 9 minutes (431 commuters, 18.9%) for males and 10 to 14 minutes (537 commuters, 22.6%) for females.
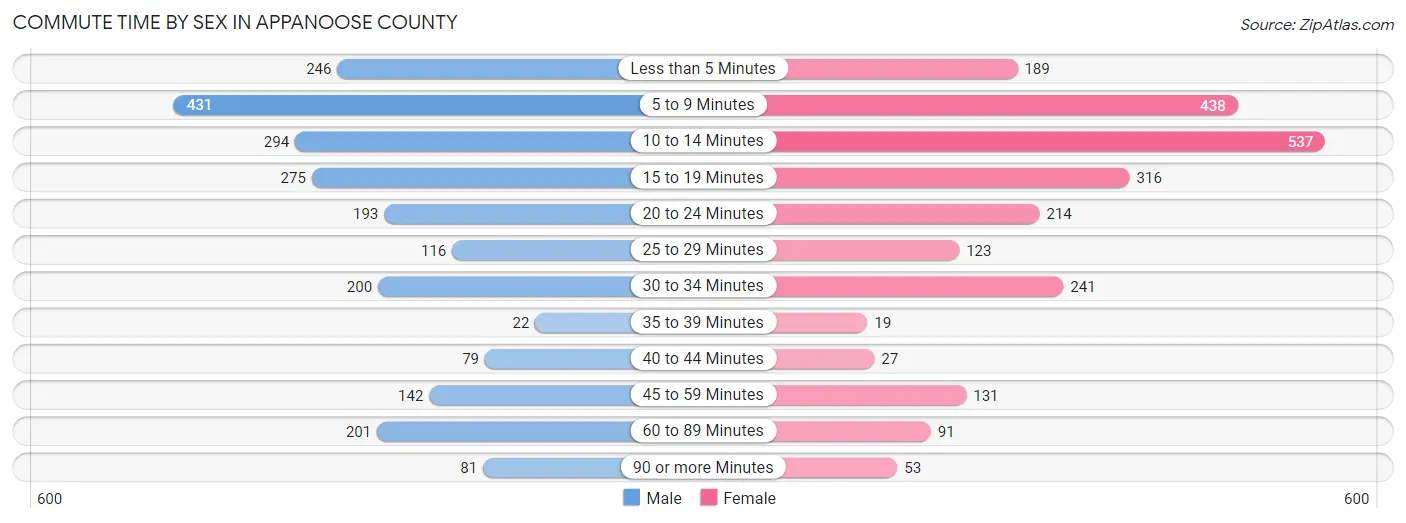
| Commute Time | Male | Female |
| Less than 5 Minutes | 246 (10.8%) | 189 (7.9%) |
| 5 to 9 Minutes | 431 (18.9%) | 438 (18.4%) |
| 10 to 14 Minutes | 294 (12.9%) | 537 (22.6%) |
| 15 to 19 Minutes | 275 (12.1%) | 316 (13.3%) |
| 20 to 24 Minutes | 193 (8.5%) | 214 (9.0%) |
| 25 to 29 Minutes | 116 (5.1%) | 123 (5.2%) |
| 30 to 34 Minutes | 200 (8.8%) | 241 (10.1%) |
| 35 to 39 Minutes | 22 (1.0%) | 19 (0.8%) |
| 40 to 44 Minutes | 79 (3.5%) | 27 (1.1%) |
| 45 to 59 Minutes | 142 (6.2%) | 131 (5.5%) |
| 60 to 89 Minutes | 201 (8.8%) | 91 (3.8%) |
| 90 or more Minutes | 81 (3.5%) | 53 (2.2%) |
Time of Departure to Work by Sex in Appanoose County
The most frequent times of departure to work in Appanoose County are 6:30 AM to 6:59 AM (315, 13.8%) for males and 7:30 AM to 7:59 AM (429, 18.0%) for females.
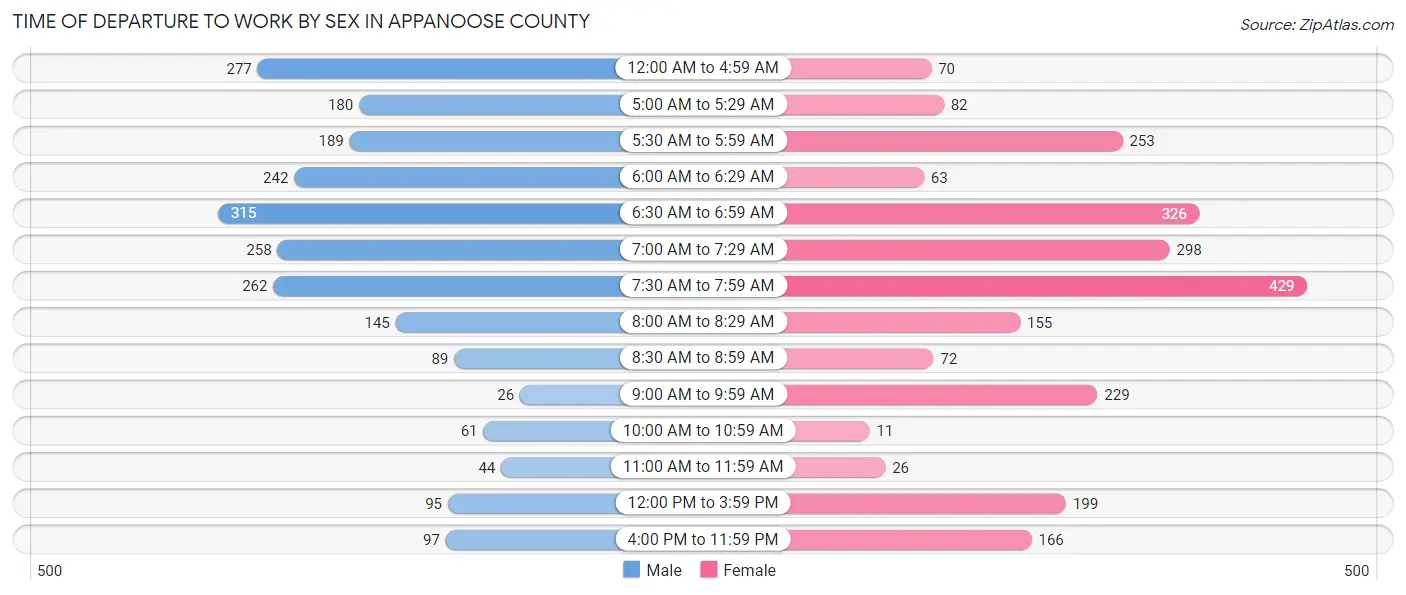
| Time of Departure | Male | Female |
| 12:00 AM to 4:59 AM | 277 (12.1%) | 70 (2.9%) |
| 5:00 AM to 5:29 AM | 180 (7.9%) | 82 (3.5%) |
| 5:30 AM to 5:59 AM | 189 (8.3%) | 253 (10.6%) |
| 6:00 AM to 6:29 AM | 242 (10.6%) | 63 (2.6%) |
| 6:30 AM to 6:59 AM | 315 (13.8%) | 326 (13.7%) |
| 7:00 AM to 7:29 AM | 258 (11.3%) | 298 (12.5%) |
| 7:30 AM to 7:59 AM | 262 (11.5%) | 429 (18.0%) |
| 8:00 AM to 8:29 AM | 145 (6.4%) | 155 (6.5%) |
| 8:30 AM to 8:59 AM | 89 (3.9%) | 72 (3.0%) |
| 9:00 AM to 9:59 AM | 26 (1.1%) | 229 (9.6%) |
| 10:00 AM to 10:59 AM | 61 (2.7%) | 11 (0.5%) |
| 11:00 AM to 11:59 AM | 44 (1.9%) | 26 (1.1%) |
| 12:00 PM to 3:59 PM | 95 (4.2%) | 199 (8.4%) |
| 4:00 PM to 11:59 PM | 97 (4.3%) | 166 (7.0%) |
| Total | 2,280 (100.0%) | 2,379 (100.0%) |
Housing Occupancy in Appanoose County
Occupancy by Ownership in Appanoose County
Of the total 5,028 dwellings in Appanoose County, owner-occupied units account for 3,484 (69.3%), while renter-occupied units make up 1,544 (30.7%).
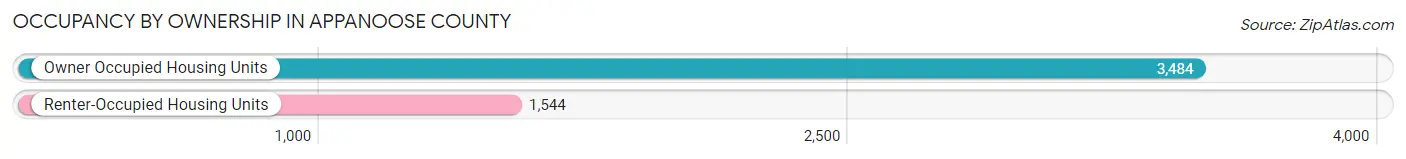
| Occupancy | # Housing Units | % Housing Units |
| Owner Occupied Housing Units | 3,484 | 69.3% |
| Renter-Occupied Housing Units | 1,544 | 30.7% |
| Total Occupied Housing Units | 5,028 | 100.0% |
Occupancy by Household Size in Appanoose County
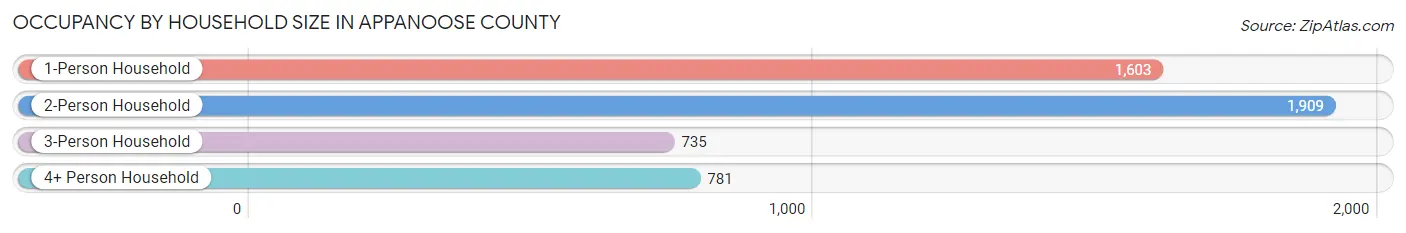
| Household Size | # Housing Units | % Housing Units |
| 1-Person Household | 1,603 | 31.9% |
| 2-Person Household | 1,909 | 38.0% |
| 3-Person Household | 735 | 14.6% |
| 4+ Person Household | 781 | 15.5% |
| Total Housing Units | 5,028 | 100.0% |
Occupancy by Ownership by Household Size in Appanoose County
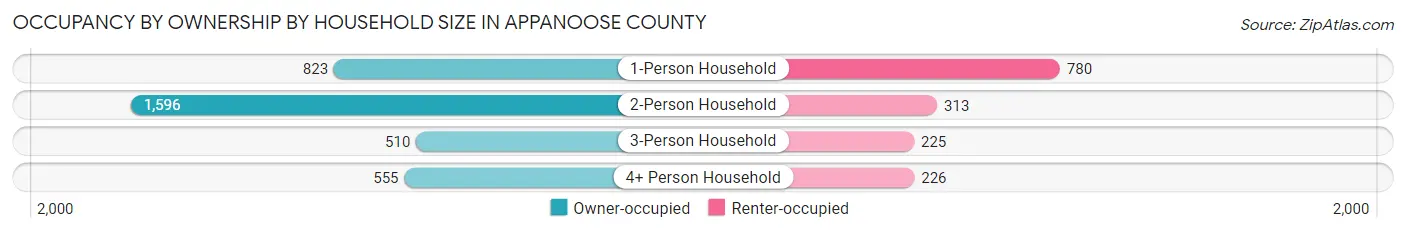
| Household Size | Owner-occupied | Renter-occupied |
| 1-Person Household | 823 (51.3%) | 780 (48.7%) |
| 2-Person Household | 1,596 (83.6%) | 313 (16.4%) |
| 3-Person Household | 510 (69.4%) | 225 (30.6%) |
| 4+ Person Household | 555 (71.1%) | 226 (28.9%) |
| Total Housing Units | 3,484 (69.3%) | 1,544 (30.7%) |
Occupancy by Educational Attainment in Appanoose County
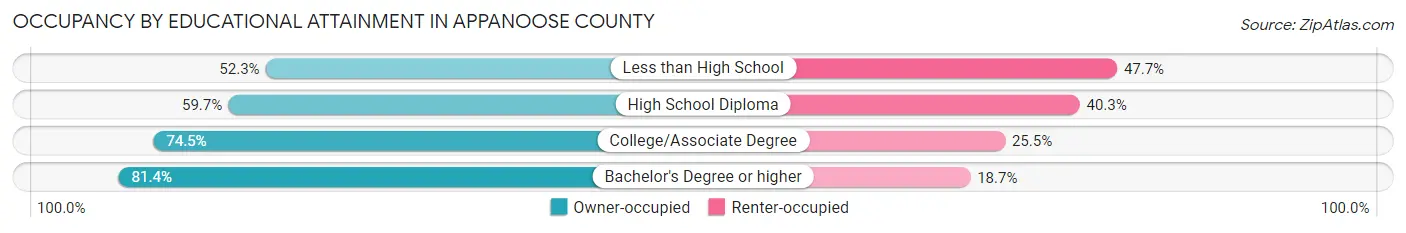
| Household Size | Owner-occupied | Renter-occupied |
| Less than High School | 162 (52.3%) | 148 (47.7%) |
| High School Diploma | 1,043 (59.7%) | 705 (40.3%) |
| College/Associate Degree | 1,481 (74.5%) | 508 (25.5%) |
| Bachelor's Degree or higher | 798 (81.4%) | 183 (18.6%) |
Occupancy by Age of Householder in Appanoose County
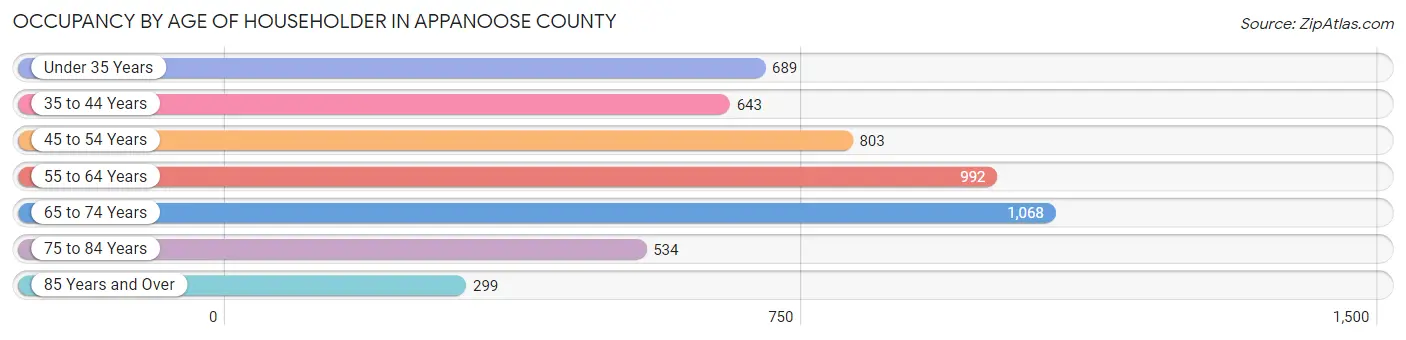
| Age Bracket | # Households | % Households |
| Under 35 Years | 689 | 13.7% |
| 35 to 44 Years | 643 | 12.8% |
| 45 to 54 Years | 803 | 16.0% |
| 55 to 64 Years | 992 | 19.7% |
| 65 to 74 Years | 1,068 | 21.2% |
| 75 to 84 Years | 534 | 10.6% |
| 85 Years and Over | 299 | 5.9% |
| Total | 5,028 | 100.0% |
Housing Finances in Appanoose County
Median Income by Occupancy in Appanoose County
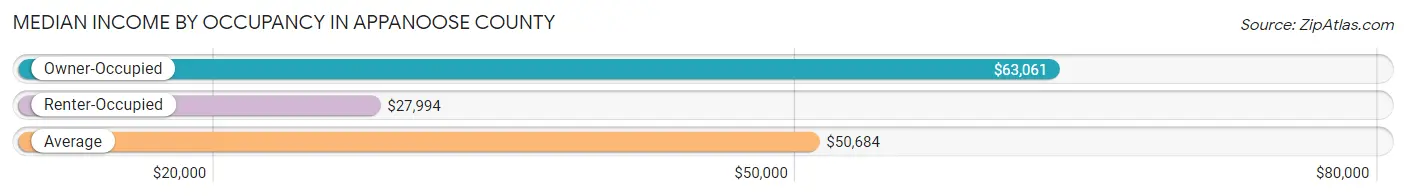
| Occupancy Type | # Households | Median Income |
| Owner-Occupied | 3,484 (69.3%) | $63,061 |
| Renter-Occupied | 1,544 (30.7%) | $27,994 |
| Average | 5,028 (100.0%) | $50,684 |
Occupancy by Householder Income Bracket in Appanoose County
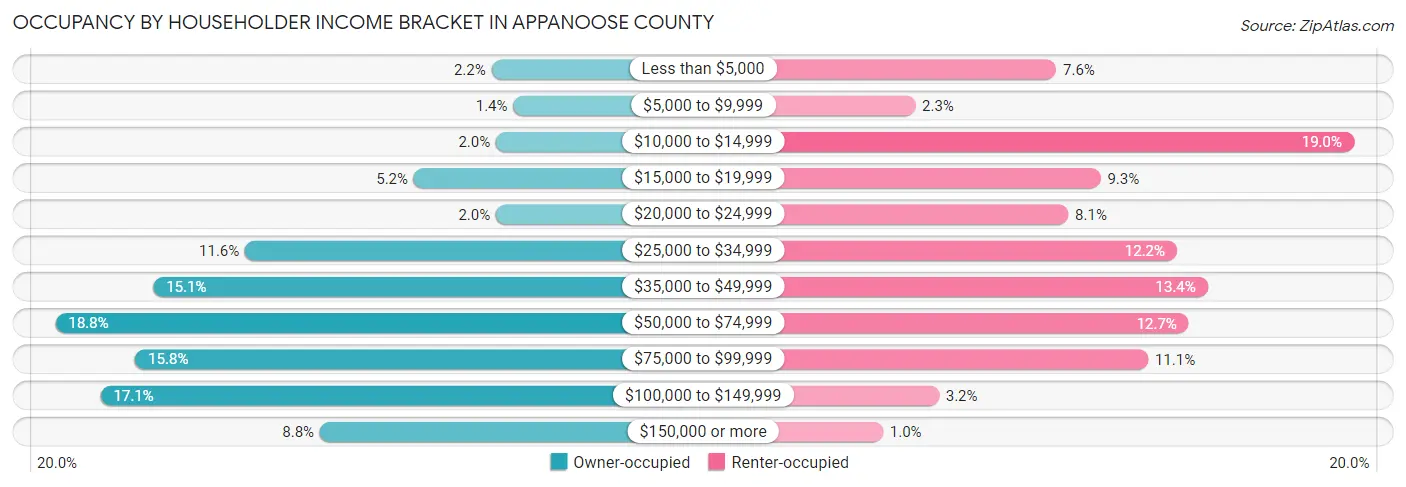
| Income Bracket | Owner-occupied | Renter-occupied |
| Less than $5,000 | 77 (2.2%) | 118 (7.6%) |
| $5,000 to $9,999 | 48 (1.4%) | 35 (2.3%) |
| $10,000 to $14,999 | 71 (2.0%) | 293 (19.0%) |
| $15,000 to $19,999 | 180 (5.2%) | 144 (9.3%) |
| $20,000 to $24,999 | 71 (2.0%) | 125 (8.1%) |
| $25,000 to $34,999 | 404 (11.6%) | 189 (12.2%) |
| $35,000 to $49,999 | 526 (15.1%) | 207 (13.4%) |
| $50,000 to $74,999 | 656 (18.8%) | 196 (12.7%) |
| $75,000 to $99,999 | 550 (15.8%) | 172 (11.1%) |
| $100,000 to $149,999 | 596 (17.1%) | 49 (3.2%) |
| $150,000 or more | 305 (8.7%) | 16 (1.0%) |
| Total | 3,484 (100.0%) | 1,544 (100.0%) |
Monthly Housing Cost Tiers in Appanoose County
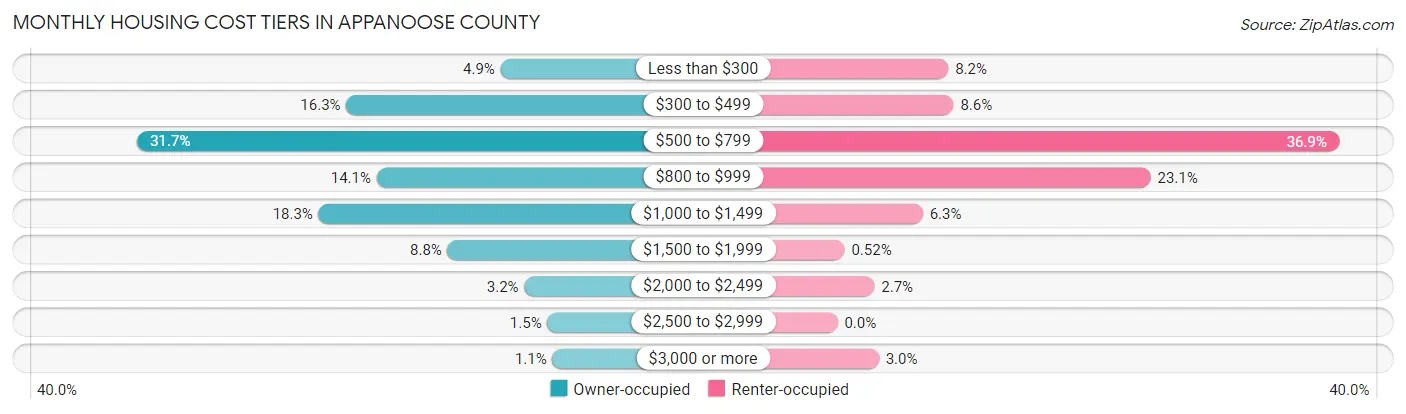
| Monthly Cost | Owner-occupied | Renter-occupied |
| Less than $300 | 172 (4.9%) | 126 (8.2%) |
| $300 to $499 | 568 (16.3%) | 132 (8.6%) |
| $500 to $799 | 1,105 (31.7%) | 570 (36.9%) |
| $800 to $999 | 490 (14.1%) | 356 (23.1%) |
| $1,000 to $1,499 | 639 (18.3%) | 97 (6.3%) |
| $1,500 to $1,999 | 308 (8.8%) | 8 (0.5%) |
| $2,000 to $2,499 | 111 (3.2%) | 42 (2.7%) |
| $2,500 to $2,999 | 52 (1.5%) | 0 (0.0%) |
| $3,000 or more | 39 (1.1%) | 47 (3.0%) |
| Total | 3,484 (100.0%) | 1,544 (100.0%) |
Physical Housing Characteristics in Appanoose County
Housing Structures in Appanoose County
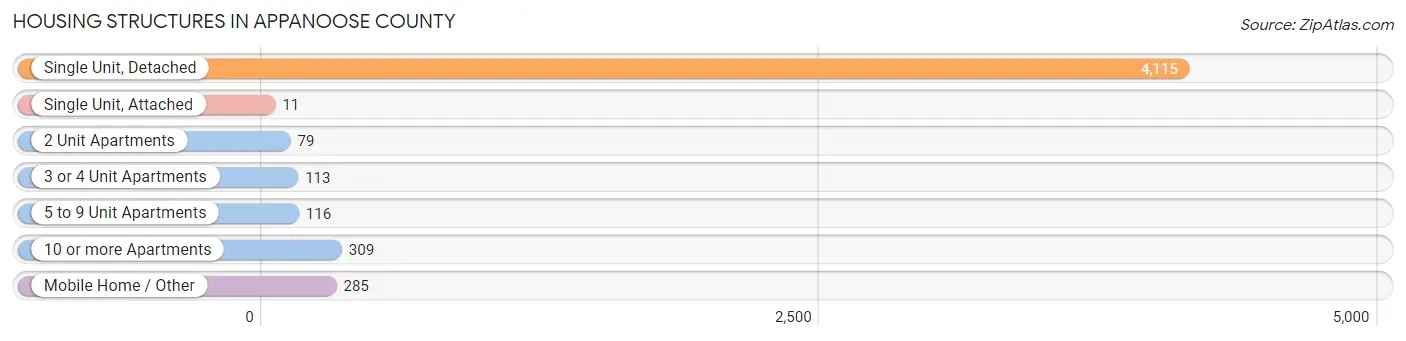
| Structure Type | # Housing Units | % Housing Units |
| Single Unit, Detached | 4,115 | 81.8% |
| Single Unit, Attached | 11 | 0.2% |
| 2 Unit Apartments | 79 | 1.6% |
| 3 or 4 Unit Apartments | 113 | 2.2% |
| 5 to 9 Unit Apartments | 116 | 2.3% |
| 10 or more Apartments | 309 | 6.1% |
| Mobile Home / Other | 285 | 5.7% |
| Total | 5,028 | 100.0% |
Housing Structures by Occupancy in Appanoose County
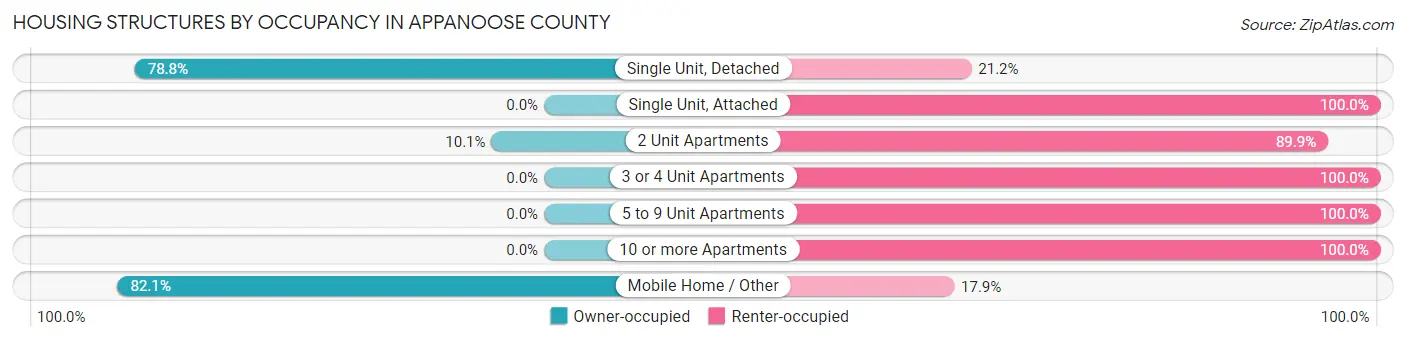
| Structure Type | Owner-occupied | Renter-occupied |
| Single Unit, Detached | 3,242 (78.8%) | 873 (21.2%) |
| Single Unit, Attached | 0 (0.0%) | 11 (100.0%) |
| 2 Unit Apartments | 8 (10.1%) | 71 (89.9%) |
| 3 or 4 Unit Apartments | 0 (0.0%) | 113 (100.0%) |
| 5 to 9 Unit Apartments | 0 (0.0%) | 116 (100.0%) |
| 10 or more Apartments | 0 (0.0%) | 309 (100.0%) |
| Mobile Home / Other | 234 (82.1%) | 51 (17.9%) |
| Total | 3,484 (69.3%) | 1,544 (30.7%) |
Housing Structures by Number of Rooms in Appanoose County
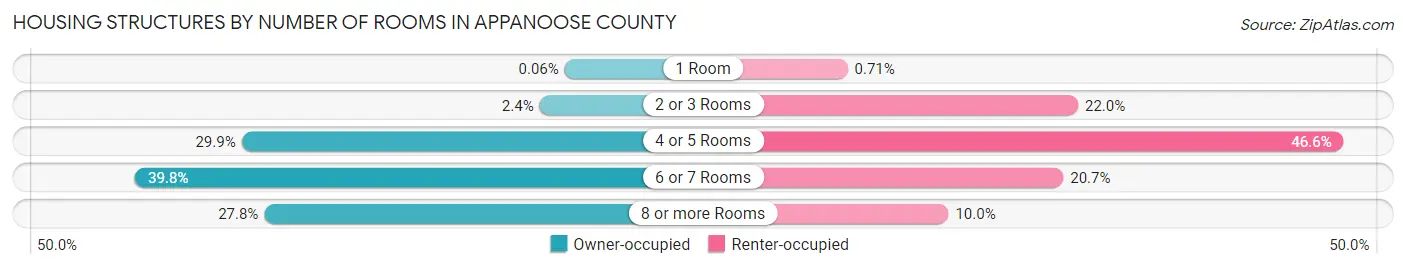
| Number of Rooms | Owner-occupied | Renter-occupied |
| 1 Room | 2 (0.1%) | 11 (0.7%) |
| 2 or 3 Rooms | 83 (2.4%) | 340 (22.0%) |
| 4 or 5 Rooms | 1,043 (29.9%) | 719 (46.6%) |
| 6 or 7 Rooms | 1,386 (39.8%) | 319 (20.7%) |
| 8 or more Rooms | 970 (27.8%) | 155 (10.0%) |
| Total | 3,484 (100.0%) | 1,544 (100.0%) |
Housing Structure by Heating Type in Appanoose County
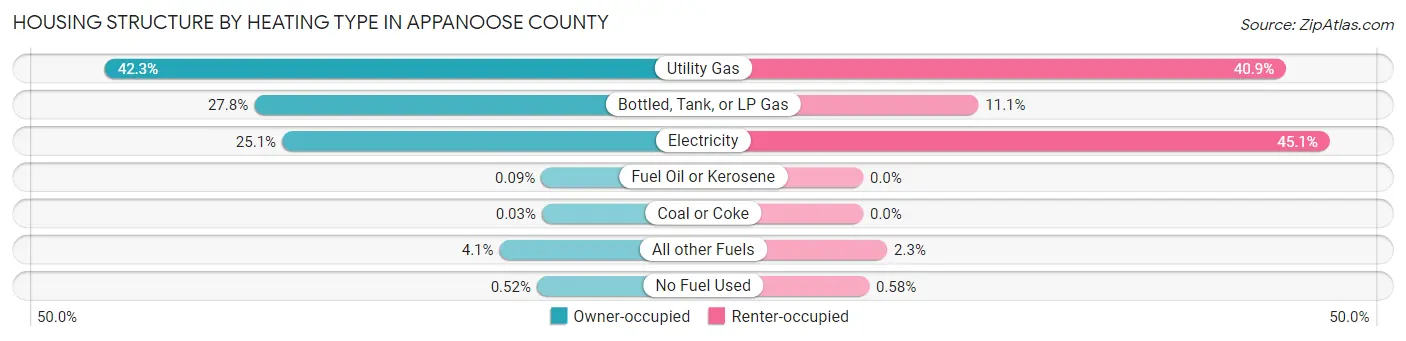
| Heating Type | Owner-occupied | Renter-occupied |
| Utility Gas | 1,472 (42.2%) | 631 (40.9%) |
| Bottled, Tank, or LP Gas | 970 (27.8%) | 172 (11.1%) |
| Electricity | 876 (25.1%) | 696 (45.1%) |
| Fuel Oil or Kerosene | 3 (0.1%) | 0 (0.0%) |
| Coal or Coke | 1 (0.0%) | 0 (0.0%) |
| All other Fuels | 144 (4.1%) | 36 (2.3%) |
| No Fuel Used | 18 (0.5%) | 9 (0.6%) |
| Total | 3,484 (100.0%) | 1,544 (100.0%) |
Household Vehicle Usage in Appanoose County
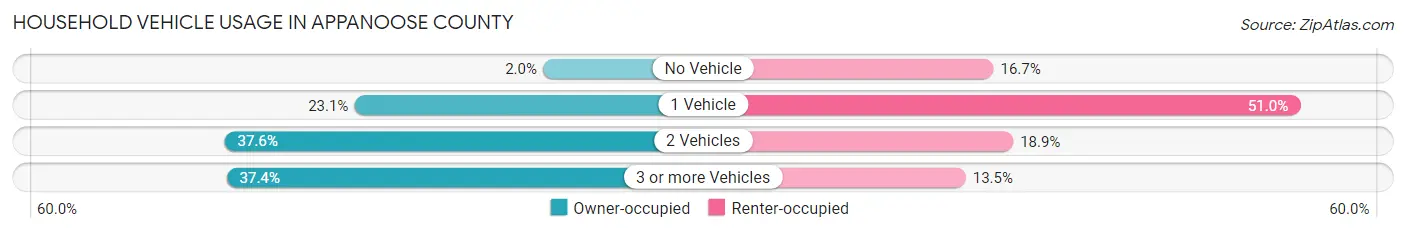
| Vehicles per Household | Owner-occupied | Renter-occupied |
| No Vehicle | 68 (1.9%) | 257 (16.7%) |
| 1 Vehicle | 804 (23.1%) | 787 (51.0%) |
| 2 Vehicles | 1,310 (37.6%) | 291 (18.9%) |
| 3 or more Vehicles | 1,302 (37.4%) | 209 (13.5%) |
| Total | 3,484 (100.0%) | 1,544 (100.0%) |
Real Estate & Mortgages in Appanoose County
Real Estate and Mortgage Overview in Appanoose County
| Characteristic | Without Mortgage | With Mortgage |
| Housing Units | 1,782 | 1,702 |
| Median Property Value | $98,200 | $121,600 |
| Median Household Income | $44,424 | $236 |
| Monthly Housing Costs | $543 | $39 |
| Real Estate Taxes | $1,438 | $51 |
Property Value by Mortgage Status in Appanoose County
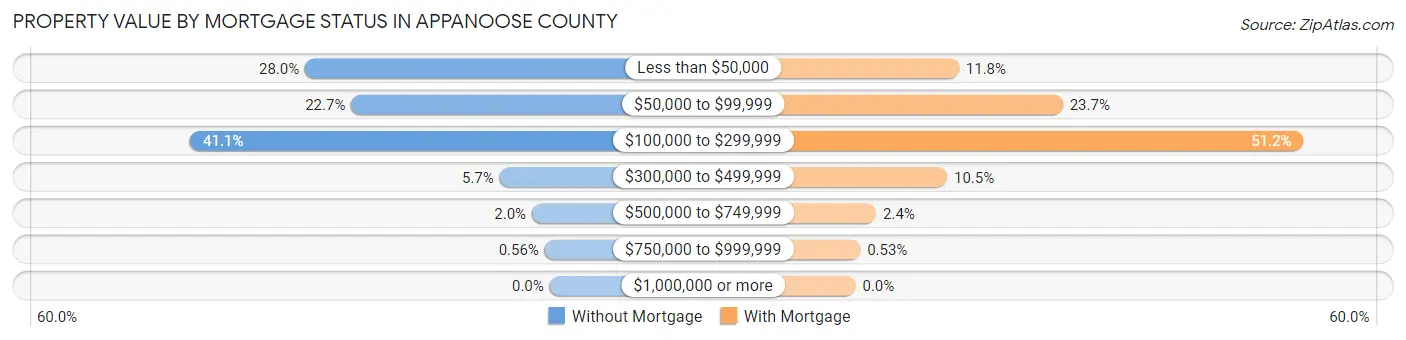
| Property Value | Without Mortgage | With Mortgage |
| Less than $50,000 | 498 (28.0%) | 201 (11.8%) |
| $50,000 to $99,999 | 404 (22.7%) | 403 (23.7%) |
| $100,000 to $299,999 | 732 (41.1%) | 871 (51.2%) |
| $300,000 to $499,999 | 102 (5.7%) | 178 (10.5%) |
| $500,000 to $749,999 | 36 (2.0%) | 40 (2.4%) |
| $750,000 to $999,999 | 10 (0.6%) | 9 (0.5%) |
| $1,000,000 or more | 0 (0.0%) | 0 (0.0%) |
| Total | 1,782 (100.0%) | 1,702 (100.0%) |
Household Income by Mortgage Status in Appanoose County
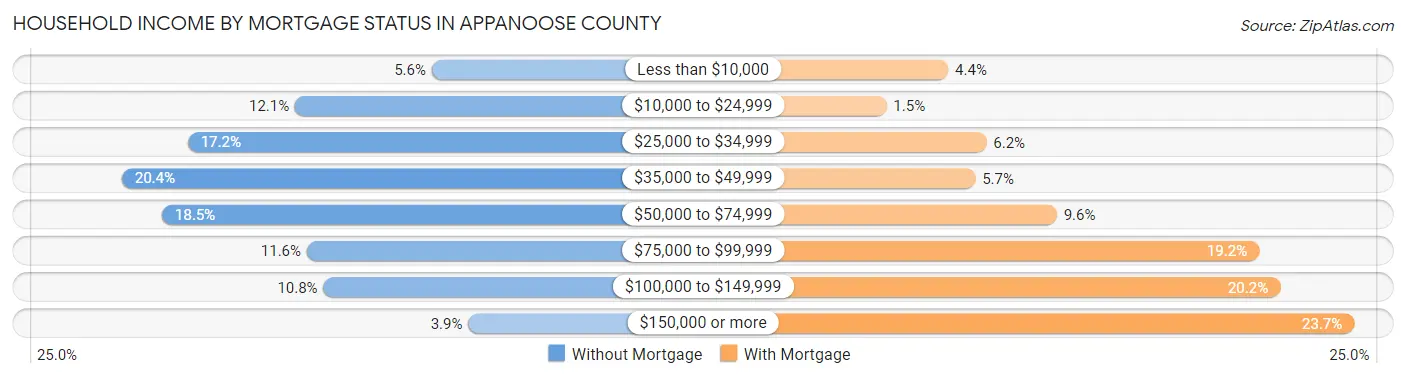
| Household Income | Without Mortgage | With Mortgage |
| Less than $10,000 | 100 (5.6%) | 75 (4.4%) |
| $10,000 to $24,999 | 216 (12.1%) | 25 (1.5%) |
| $25,000 to $34,999 | 307 (17.2%) | 106 (6.2%) |
| $35,000 to $49,999 | 363 (20.4%) | 97 (5.7%) |
| $50,000 to $74,999 | 329 (18.5%) | 163 (9.6%) |
| $75,000 to $99,999 | 206 (11.6%) | 327 (19.2%) |
| $100,000 to $149,999 | 192 (10.8%) | 344 (20.2%) |
| $150,000 or more | 69 (3.9%) | 404 (23.7%) |
| Total | 1,782 (100.0%) | 1,702 (100.0%) |
Property Value to Household Income Ratio in Appanoose County
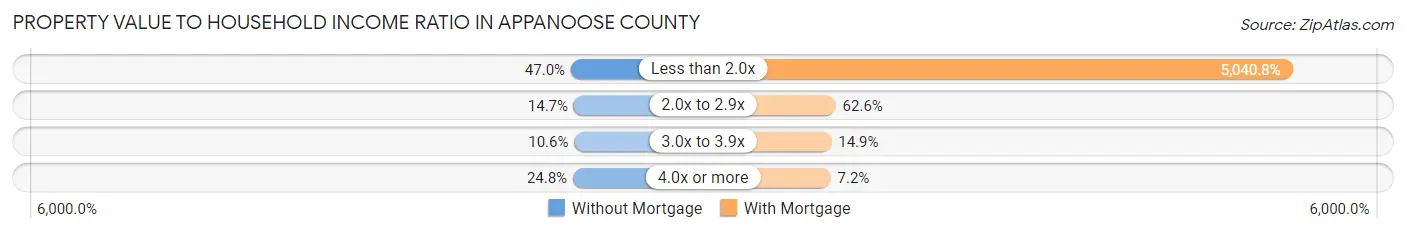
| Value-to-Income Ratio | Without Mortgage | With Mortgage |
| Less than 2.0x | 838 (47.0%) | 85,794 (5,040.8%) |
| 2.0x to 2.9x | 262 (14.7%) | 1,065 (62.6%) |
| 3.0x to 3.9x | 189 (10.6%) | 254 (14.9%) |
| 4.0x or more | 442 (24.8%) | 122 (7.2%) |
| Total | 1,782 (100.0%) | 1,702 (100.0%) |
Real Estate Taxes by Mortgage Status in Appanoose County
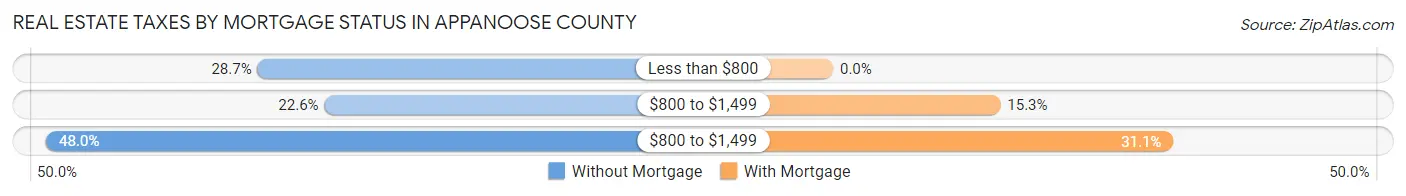
| Property Taxes | Without Mortgage | With Mortgage |
| Less than $800 | 512 (28.7%) | 0 (0.0%) |
| $800 to $1,499 | 403 (22.6%) | 260 (15.3%) |
| $800 to $1,499 | 856 (48.0%) | 529 (31.1%) |
| Total | 1,782 (100.0%) | 1,702 (100.0%) |
Health & Disability in Appanoose County
Health Insurance Coverage by Age in Appanoose County
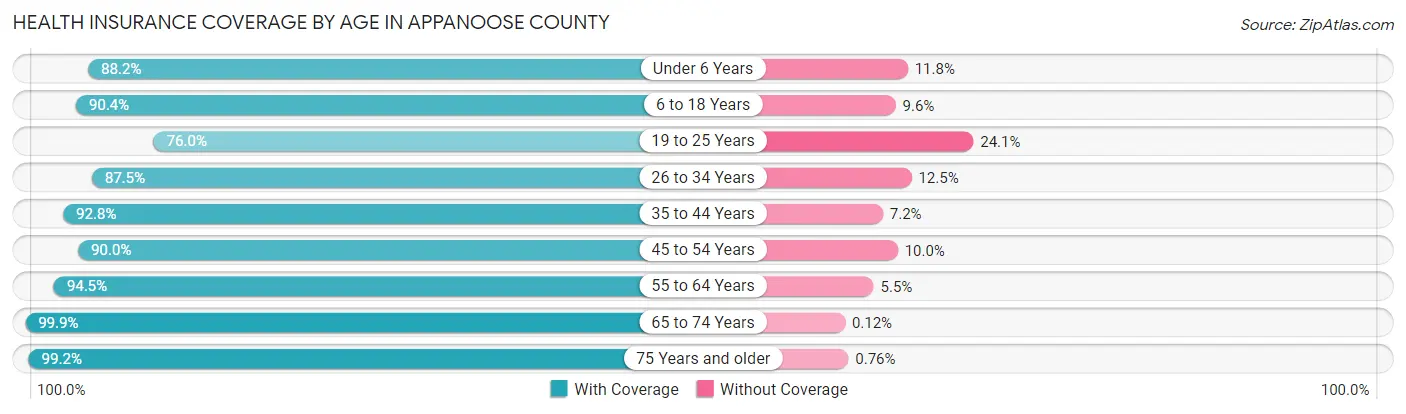
| Age Bracket | With Coverage | Without Coverage |
| Under 6 Years | 678 (88.2%) | 91 (11.8%) |
| 6 to 18 Years | 1,889 (90.4%) | 200 (9.6%) |
| 19 to 25 Years | 619 (75.9%) | 196 (24.0%) |
| 26 to 34 Years | 977 (87.5%) | 140 (12.5%) |
| 35 to 44 Years | 1,227 (92.8%) | 95 (7.2%) |
| 45 to 54 Years | 1,329 (90.0%) | 147 (10.0%) |
| 55 to 64 Years | 1,679 (94.5%) | 97 (5.5%) |
| 65 to 74 Years | 1,610 (99.9%) | 2 (0.1%) |
| 75 Years and older | 1,173 (99.2%) | 9 (0.8%) |
| Total | 11,181 (92.0%) | 977 (8.0%) |
Health Insurance Coverage by Citizenship Status in Appanoose County
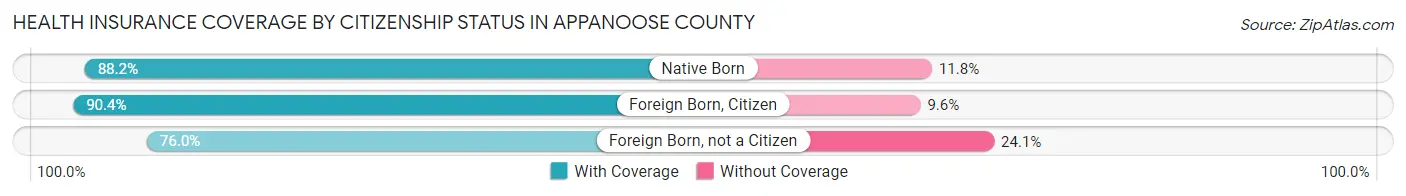
| Citizenship Status | With Coverage | Without Coverage |
| Native Born | 678 (88.2%) | 91 (11.8%) |
| Foreign Born, Citizen | 1,889 (90.4%) | 200 (9.6%) |
| Foreign Born, not a Citizen | 619 (75.9%) | 196 (24.0%) |
Health Insurance Coverage by Household Income in Appanoose County
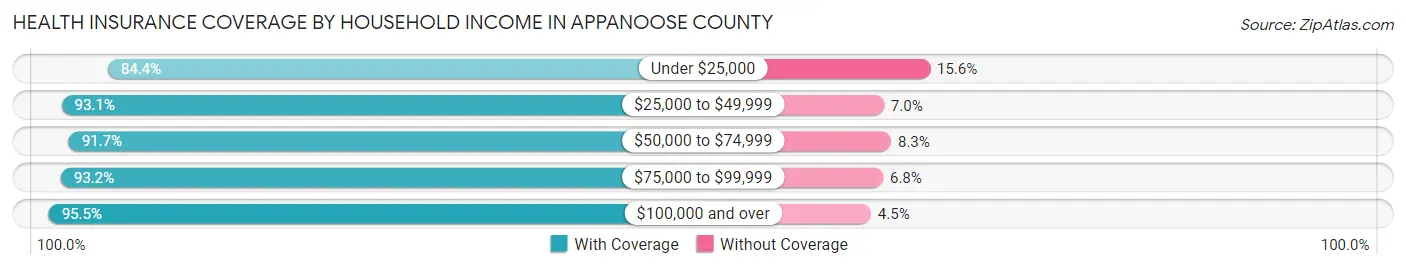
| Household Income | With Coverage | Without Coverage |
| Under $25,000 | 1,585 (84.4%) | 293 (15.6%) |
| $25,000 to $49,999 | 2,596 (93.0%) | 194 (7.0%) |
| $50,000 to $74,999 | 2,546 (91.7%) | 230 (8.3%) |
| $75,000 to $99,999 | 1,853 (93.2%) | 135 (6.8%) |
| $100,000 and over | 2,555 (95.5%) | 121 (4.5%) |
Public vs Private Health Insurance Coverage by Age in Appanoose County
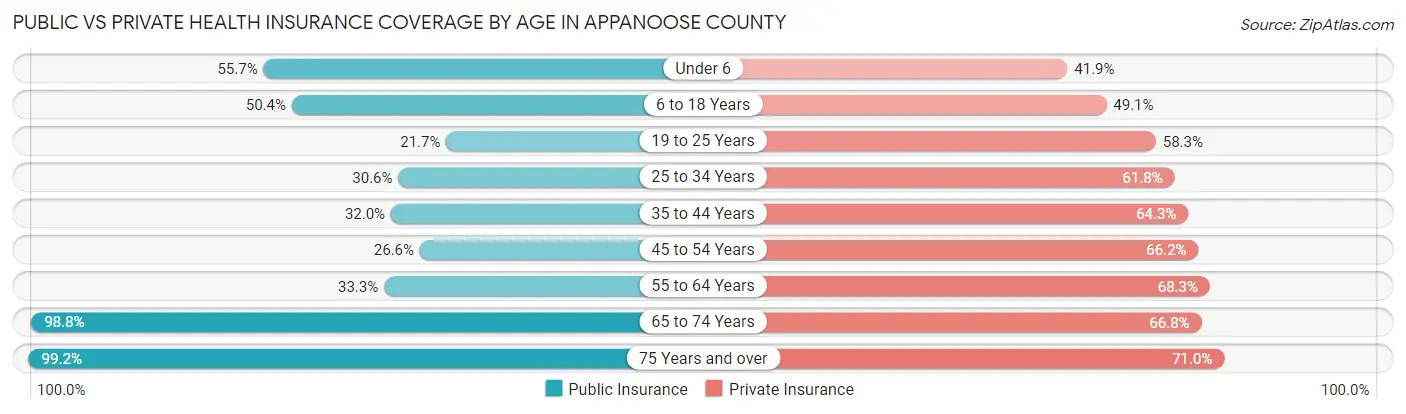
| Age Bracket | Public Insurance | Private Insurance |
| Under 6 | 428 (55.7%) | 322 (41.9%) |
| 6 to 18 Years | 1,053 (50.4%) | 1,026 (49.1%) |
| 19 to 25 Years | 177 (21.7%) | 475 (58.3%) |
| 25 to 34 Years | 342 (30.6%) | 690 (61.8%) |
| 35 to 44 Years | 423 (32.0%) | 850 (64.3%) |
| 45 to 54 Years | 393 (26.6%) | 977 (66.2%) |
| 55 to 64 Years | 591 (33.3%) | 1,213 (68.3%) |
| 65 to 74 Years | 1,592 (98.8%) | 1,076 (66.7%) |
| 75 Years and over | 1,173 (99.2%) | 839 (71.0%) |
| Total | 6,172 (50.8%) | 7,468 (61.4%) |
Disability Status by Sex by Age in Appanoose County
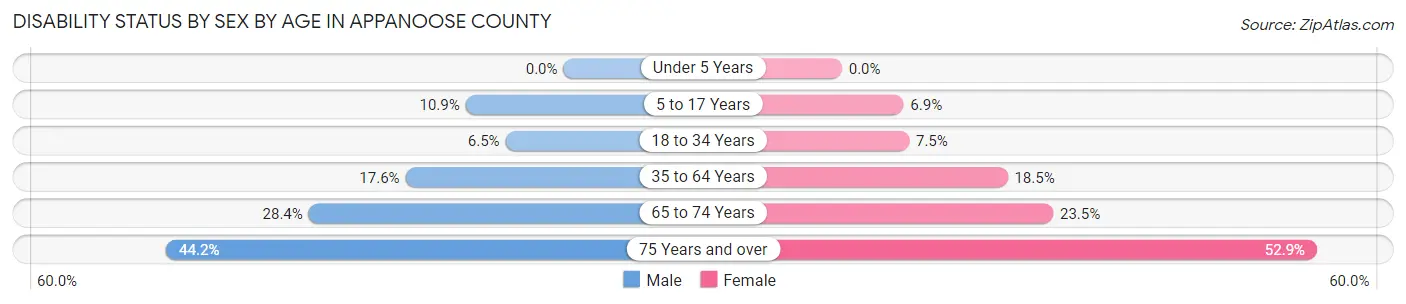
| Age Bracket | Male | Female |
| Under 5 Years | 0 (0.0%) | 0 (0.0%) |
| 5 to 17 Years | 118 (10.9%) | 69 (6.9%) |
| 18 to 34 Years | 70 (6.5%) | 76 (7.5%) |
| 35 to 64 Years | 408 (17.6%) | 416 (18.4%) |
| 65 to 74 Years | 221 (28.4%) | 196 (23.5%) |
| 75 Years and over | 226 (44.2%) | 355 (52.9%) |
Disability Class by Sex by Age in Appanoose County
Disability Class: Hearing Difficulty
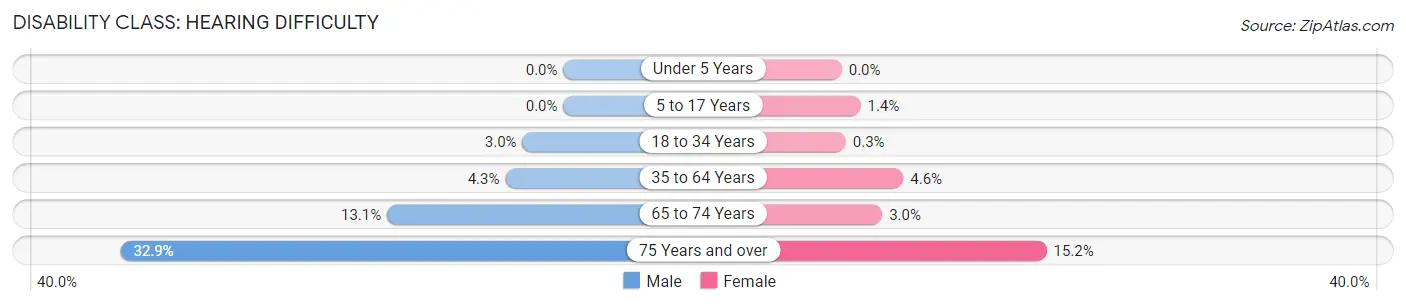
| Age Bracket | Male | Female |
| Under 5 Years | 0 (0.0%) | 0 (0.0%) |
| 5 to 17 Years | 0 (0.0%) | 14 (1.4%) |
| 18 to 34 Years | 33 (3.0%) | 3 (0.3%) |
| 35 to 64 Years | 100 (4.3%) | 103 (4.6%) |
| 65 to 74 Years | 102 (13.1%) | 25 (3.0%) |
| 75 Years and over | 168 (32.9%) | 102 (15.2%) |
Disability Class: Vision Difficulty
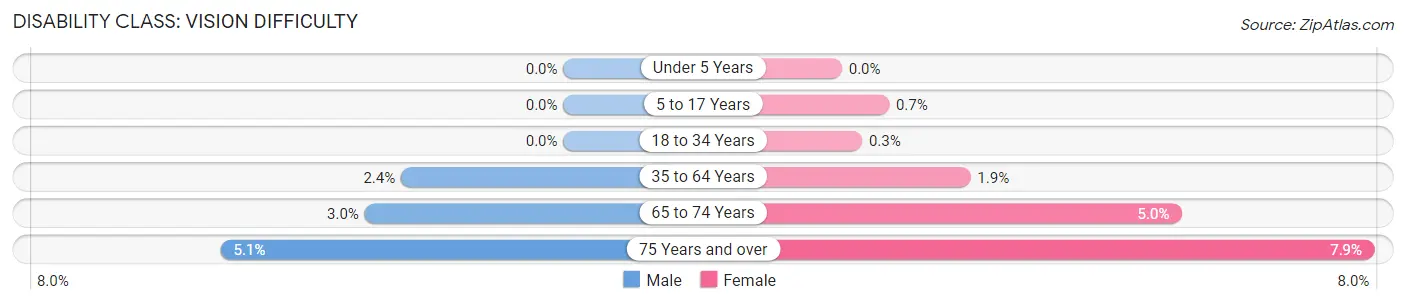
| Age Bracket | Male | Female |
| Under 5 Years | 0 (0.0%) | 0 (0.0%) |
| 5 to 17 Years | 0 (0.0%) | 7 (0.7%) |
| 18 to 34 Years | 0 (0.0%) | 3 (0.3%) |
| 35 to 64 Years | 56 (2.4%) | 43 (1.9%) |
| 65 to 74 Years | 23 (2.9%) | 42 (5.0%) |
| 75 Years and over | 26 (5.1%) | 53 (7.9%) |
Disability Class: Cognitive Difficulty
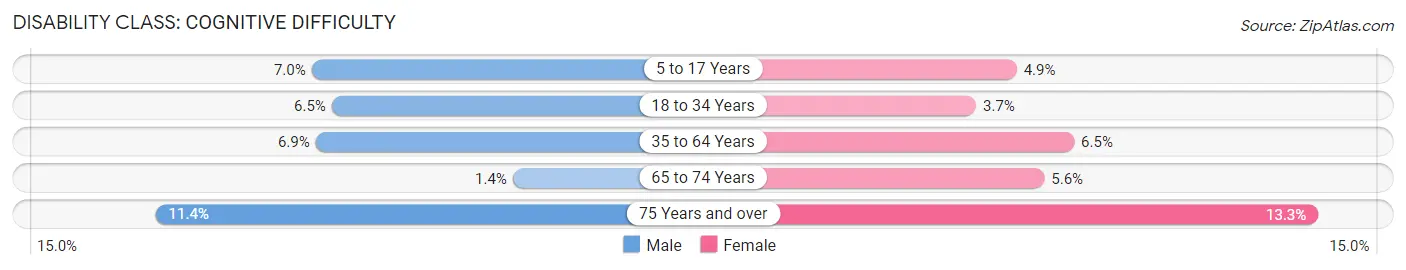
| Age Bracket | Male | Female |
| 5 to 17 Years | 76 (7.0%) | 49 (4.9%) |
| 18 to 34 Years | 70 (6.5%) | 38 (3.7%) |
| 35 to 64 Years | 160 (6.9%) | 146 (6.5%) |
| 65 to 74 Years | 11 (1.4%) | 47 (5.6%) |
| 75 Years and over | 58 (11.4%) | 89 (13.3%) |
Disability Class: Ambulatory Difficulty
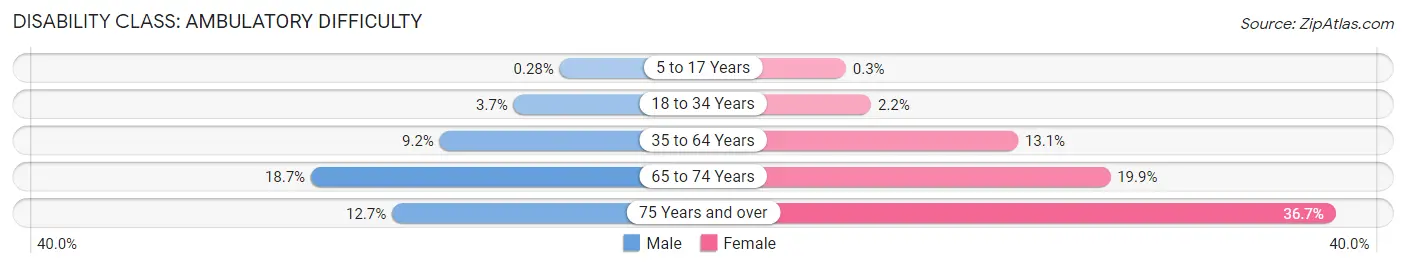
| Age Bracket | Male | Female |
| 5 to 17 Years | 3 (0.3%) | 3 (0.3%) |
| 18 to 34 Years | 40 (3.7%) | 22 (2.2%) |
| 35 to 64 Years | 213 (9.2%) | 295 (13.1%) |
| 65 to 74 Years | 146 (18.7%) | 166 (19.9%) |
| 75 Years and over | 65 (12.7%) | 246 (36.7%) |
Disability Class: Self-Care Difficulty
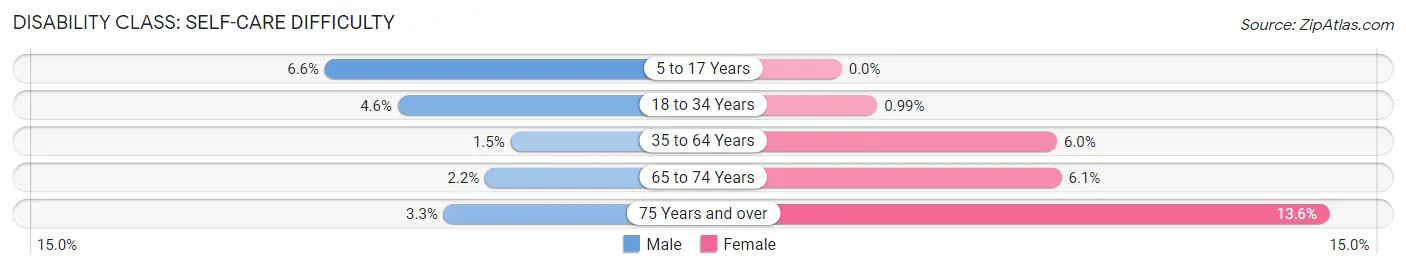
| Age Bracket | Male | Female |
| 5 to 17 Years | 72 (6.6%) | 0 (0.0%) |
| 18 to 34 Years | 50 (4.6%) | 10 (1.0%) |
| 35 to 64 Years | 34 (1.5%) | 135 (6.0%) |
| 65 to 74 Years | 17 (2.2%) | 51 (6.1%) |
| 75 Years and over | 17 (3.3%) | 91 (13.6%) |
Technology Access in Appanoose County
Computing Device Access in Appanoose County
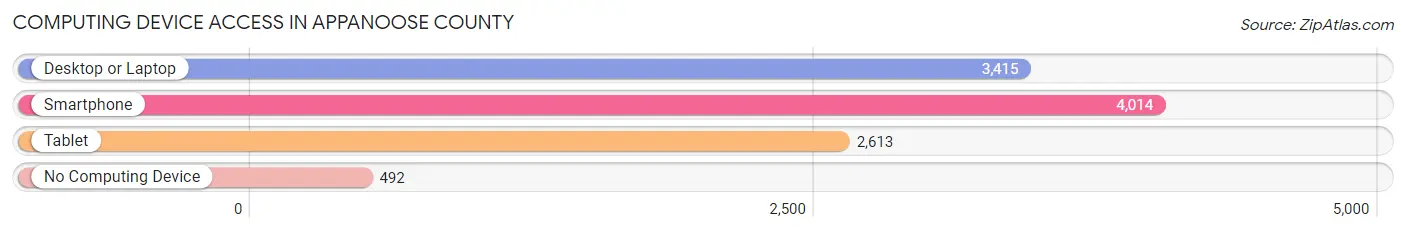
| Device Type | # Households | % Households |
| Desktop or Laptop | 3,415 | 67.9% |
| Smartphone | 4,014 | 79.8% |
| Tablet | 2,613 | 52.0% |
| No Computing Device | 492 | 9.8% |
| Total | 5,028 | 100.0% |
Internet Access in Appanoose County
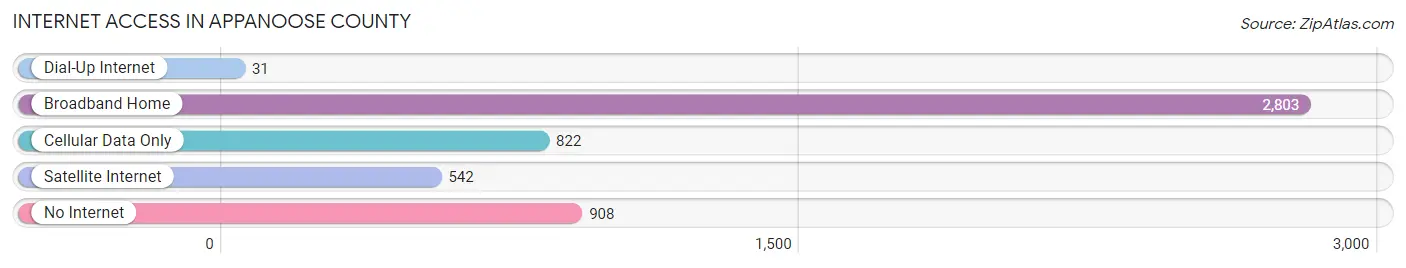
| Internet Type | # Households | % Households |
| Dial-Up Internet | 31 | 0.6% |
| Broadband Home | 2,803 | 55.7% |
| Cellular Data Only | 822 | 16.4% |
| Satellite Internet | 542 | 10.8% |
| No Internet | 908 | 18.1% |
| Total | 5,028 | 100.0% |
Appanoose County Summary
Appanoose County is located in the south-central region of Iowa, and is part of the Des Moines–West Des Moines Metropolitan Statistical Area. The county seat is Centerville, and the county has a total area of 576 square miles. As of the 2010 census, the population was 12,884.
History
Appanoose County was established in 1843 and was named after the Appanoose Indians, a Native American tribe that lived in the area. The county was originally part of the Black Hawk Purchase, a large tract of land purchased by the United States government from the Sauk and Fox tribes in 1832. The county was organized in 1846 and Centerville was chosen as the county seat.
The first settlers in Appanoose County were mostly of English and Irish descent. They were followed by German and Scandinavian immigrants in the late 19th century. The county was largely agricultural, with corn, oats, and hay being the main crops. The county also had a thriving livestock industry, with cattle, hogs, and sheep being raised.
Geography
Appanoose County is located in the south-central region of Iowa, and is part of the Des Moines–West Des Moines Metropolitan Statistical Area. The county has a total area of 576 square miles, and is bordered by Davis, Van Buren, Monroe, Wapello, Lucas, and Wayne counties. The county is mostly flat, with rolling hills in the northern and western parts. The highest point in the county is located in the northwest corner, at an elevation of 1,068 feet.
The county is drained by the Chariton River, which flows through the center of the county. The Chariton River is a tributary of the Des Moines River, which flows into the Mississippi River. The county also has several small lakes, including Lake Rathbun, which is the largest lake in the county.
Economy
Appanoose County has a diverse economy, with agriculture, manufacturing, and services being the main industries. The county is home to several large agricultural operations, including hog farms, cattle ranches, and grain farms. The county is also home to several manufacturing companies, including a large food processing plant and a furniture factory.
The county also has a thriving service sector, with several hospitals, banks, and retail stores. The county is also home to several educational institutions, including a community college and a vocational school.
Demographics
As of the 2010 census, the population of Appanoose County was 12,884. The population is mostly white (96.2%), with small percentages of African Americans (1.2%), Asians (0.7%), and Native Americans (0.3%). The median household income is $45,845, and the median age is 40.7 years.
Appanoose County is a rural county, with most of the population living in small towns and villages. The largest city in the county is Centerville, which is the county seat and has a population of 5,528. Other cities in the county include Mystic, Moulton, and Moravia.
Common Questions
What is Per Capita Income in Appanoose County?
Per Capita income in Appanoose County is $28,109.
What is the Median Family Income in Appanoose County?
Median Family Income in Appanoose County is $60,169.
What is the Median Household income in Appanoose County?
Median Household Income in Appanoose County is $50,684.
What is Income or Wage Gap in Appanoose County?
Income or Wage Gap in Appanoose County is 24.5%.
Women in Appanoose County earn 75.5 cents for every dollar earned by a man.
What is Family Income Deficit in Appanoose County?
Family Income Deficit in Appanoose County is $11,090.
Families that are below poverty line in Appanoose County earn $11,090 less on average than the poverty threshold level.
What is Inequality or Gini Index in Appanoose County?
Inequality or Gini Index in Appanoose County is 0.44.
What is the Total Population of Appanoose County?
Total Population of Appanoose County is 12,279.
What is the Total Male Population of Appanoose County?
Total Male Population of Appanoose County is 6,147.
What is the Total Female Population of Appanoose County?
Total Female Population of Appanoose County is 6,132.
What is the Ratio of Males per 100 Females in Appanoose County?
There are 100.24 Males per 100 Females in Appanoose County.
What is the Ratio of Females per 100 Males in Appanoose County?
There are 99.76 Females per 100 Males in Appanoose County.
What is the Median Population Age in Appanoose County?
Median Population Age in Appanoose County is 45.0 Years.
What is the Average Family Size in Appanoose County
Average Family Size in Appanoose County is 3.0 People.
What is the Average Household Size in Appanoose County
Average Household Size in Appanoose County is 2.4 People.
How Large is the Labor Force in Appanoose County?
There are 5,311 People in the Labor Forcein in Appanoose County.
What is the Percentage of People in the Labor Force in Appanoose County?
53.9% of People are in the Labor Force in Appanoose County.
What is the Unemployment Rate in Appanoose County?
Unemployment Rate in Appanoose County is 6.1%.