Blue Grass, IA Map & Demographics
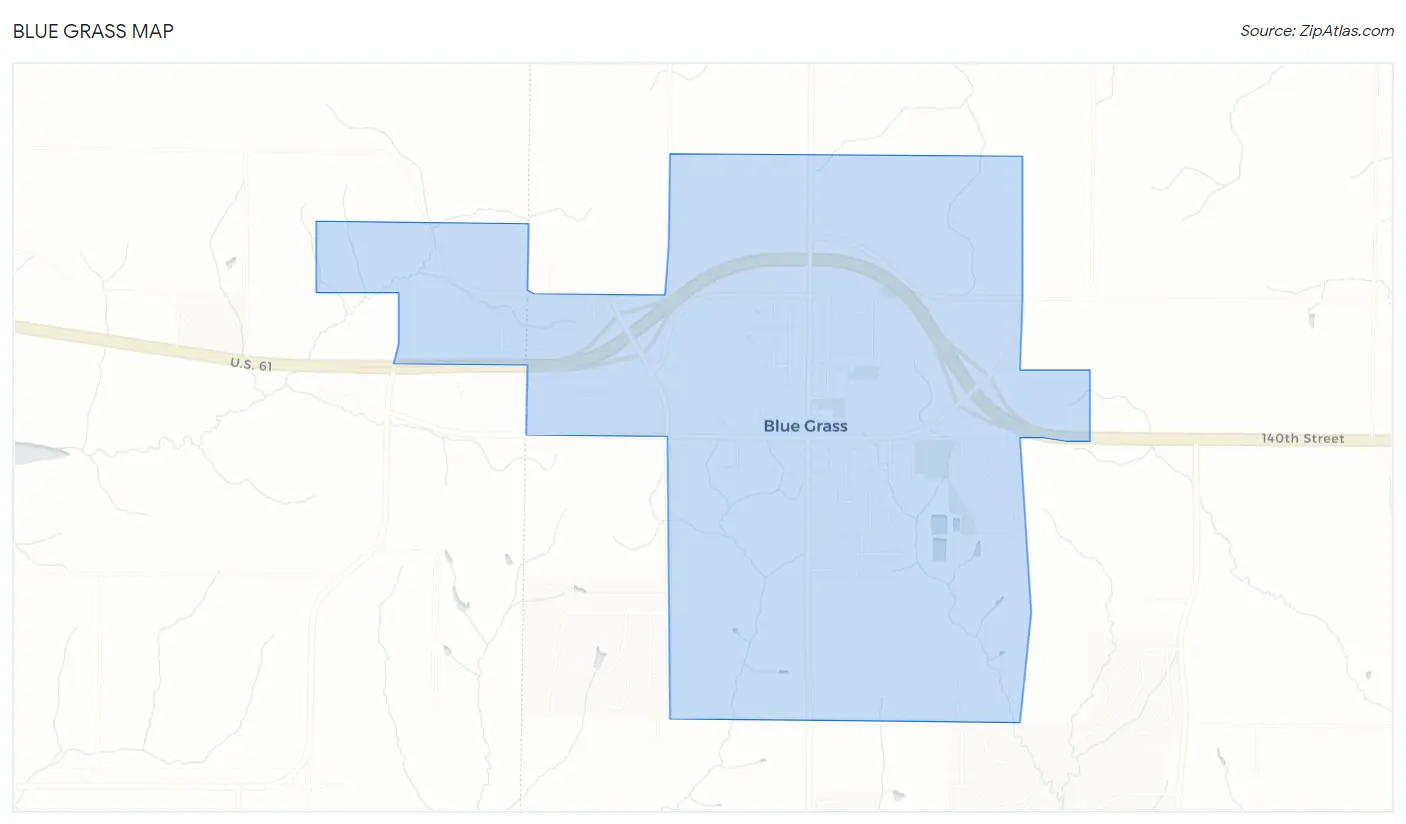
Blue Grass Map
Blue Grass Overview
$43,266
PER CAPITA INCOME
$103,317
AVG FAMILY INCOME
$78,125
AVG HOUSEHOLD INCOME
33.5%
WAGE / INCOME GAP [ % ]
66.5¢/ $1
WAGE / INCOME GAP [ $ ]
0.45
INEQUALITY / GINI INDEX
1,873
TOTAL POPULATION
838
MALE POPULATION
1,035
FEMALE POPULATION
80.97
MALES / 100 FEMALES
123.51
FEMALES / 100 MALES
45.2
MEDIAN AGE
2.6
AVG FAMILY SIZE
2.2
AVG HOUSEHOLD SIZE
895
LABOR FORCE [ PEOPLE ]
60.3%
PERCENT IN LABOR FORCE
6.2%
UNEMPLOYMENT RATE
Blue Grass Zip Codes
Blue Grass Area Codes
Income in Blue Grass
Income Overview in Blue Grass
Per Capita Income in Blue Grass is $43,266, while median incomes of families and households are $103,317 and $78,125 respectively.
| Characteristic | Number | Measure |
| Per Capita Income | 1,873 | $43,266 |
| Median Family Income | 583 | $103,317 |
| Mean Family Income | 583 | $117,642 |
| Median Household Income | 831 | $78,125 |
| Mean Household Income | 831 | $98,866 |
| Income Deficit | 583 | $0 |
| Wage / Income Gap (%) | 1,873 | 33.50% |
| Wage / Income Gap ($) | 1,873 | 66.50¢ per $1 |
| Gini / Inequality Index | 1,873 | 0.45 |
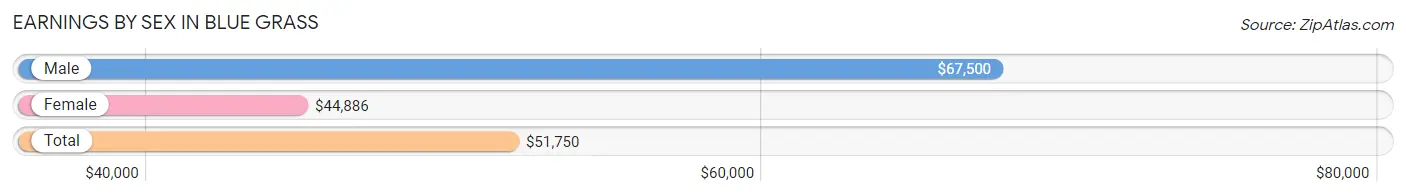
Earnings by Sex in Blue Grass
Average Earnings in Blue Grass are $51,750, $67,500 for men and $44,886 for women, a difference of 33.5%.
| Sex | Number | Average Earnings |
| Male | 428 (47.2%) | $67,500 |
| Female | 479 (52.8%) | $44,886 |
| Total | 907 (100.0%) | $51,750 |
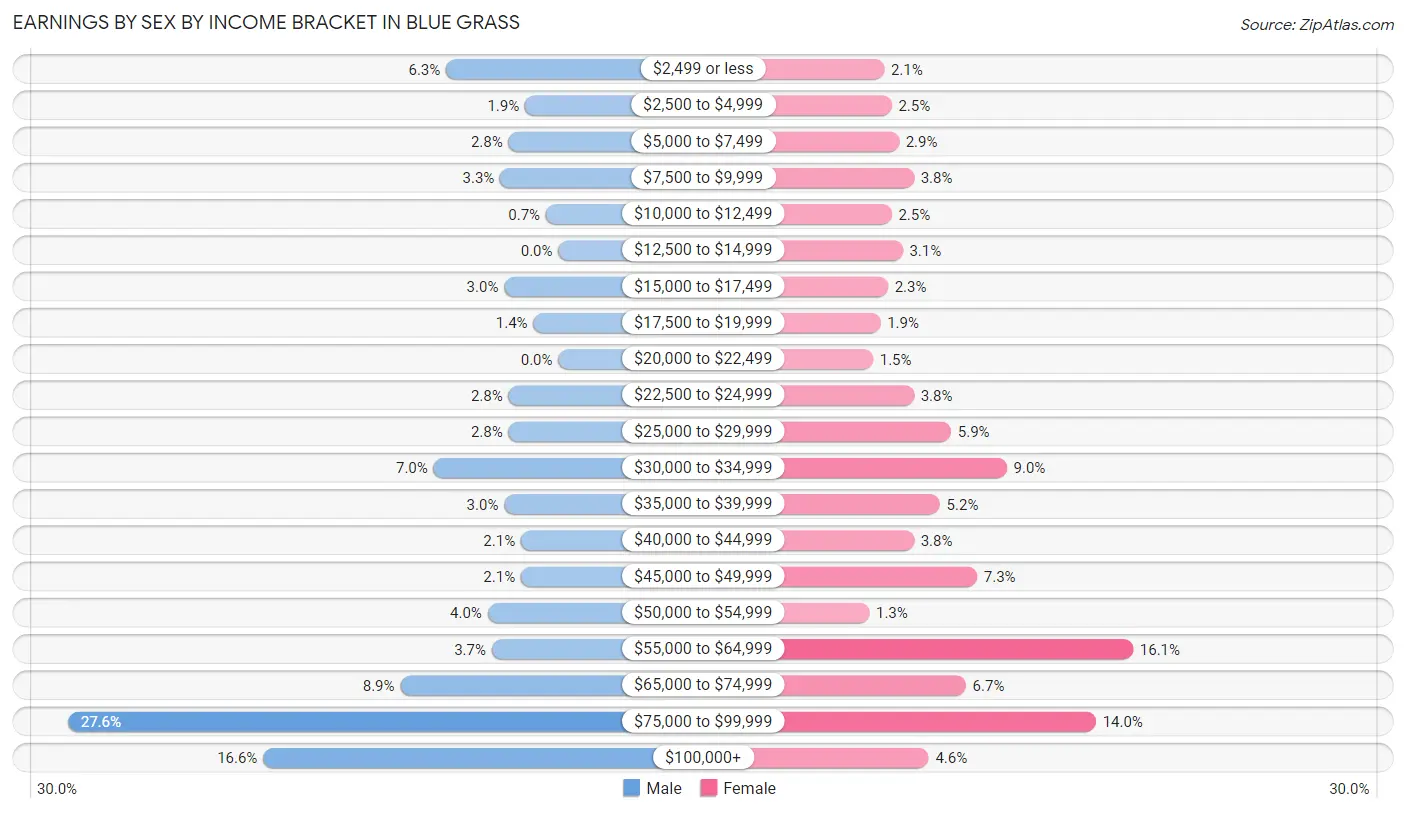
Earnings by Sex by Income Bracket in Blue Grass
The most common earnings brackets in Blue Grass are $75,000 to $99,999 for men (118 | 27.6%) and $55,000 to $64,999 for women (77 | 16.1%).
| Income | Male | Female |
| $2,499 or less | 27 (6.3%) | 10 (2.1%) |
| $2,500 to $4,999 | 8 (1.9%) | 12 (2.5%) |
| $5,000 to $7,499 | 12 (2.8%) | 14 (2.9%) |
| $7,500 to $9,999 | 14 (3.3%) | 18 (3.8%) |
| $10,000 to $12,499 | 3 (0.7%) | 12 (2.5%) |
| $12,500 to $14,999 | 0 (0.0%) | 15 (3.1%) |
| $15,000 to $17,499 | 13 (3.0%) | 11 (2.3%) |
| $17,500 to $19,999 | 6 (1.4%) | 9 (1.9%) |
| $20,000 to $22,499 | 0 (0.0%) | 7 (1.5%) |
| $22,500 to $24,999 | 12 (2.8%) | 18 (3.8%) |
| $25,000 to $29,999 | 12 (2.8%) | 28 (5.9%) |
| $30,000 to $34,999 | 30 (7.0%) | 43 (9.0%) |
| $35,000 to $39,999 | 13 (3.0%) | 25 (5.2%) |
| $40,000 to $44,999 | 9 (2.1%) | 18 (3.8%) |
| $45,000 to $49,999 | 9 (2.1%) | 35 (7.3%) |
| $50,000 to $54,999 | 17 (4.0%) | 6 (1.3%) |
| $55,000 to $64,999 | 16 (3.7%) | 77 (16.1%) |
| $65,000 to $74,999 | 38 (8.9%) | 32 (6.7%) |
| $75,000 to $99,999 | 118 (27.6%) | 67 (14.0%) |
| $100,000+ | 71 (16.6%) | 22 (4.6%) |
| Total | 428 (100.0%) | 479 (100.0%) |
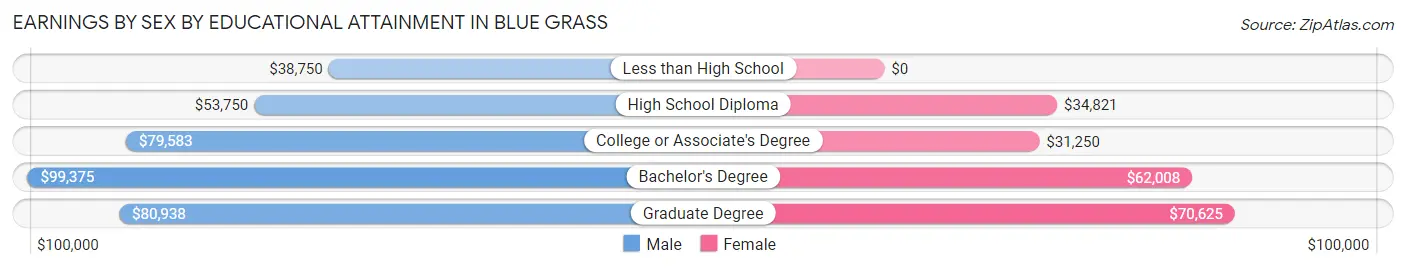
Earnings by Sex by Educational Attainment in Blue Grass
Average earnings in Blue Grass are $77,563 for men and $46,146 for women, a difference of 40.5%. Men with an educational attainment of bachelor's degree enjoy the highest average annual earnings of $99,375, while those with less than high school education earn the least with $38,750. Women with an educational attainment of graduate degree earn the most with the average annual earnings of $70,625, while those with college or associate's degree education have the smallest earnings of $31,250.
| Educational Attainment | Male Income | Female Income |
| Less than High School | $38,750 | $0 |
| High School Diploma | $53,750 | $34,821 |
| College or Associate's Degree | $79,583 | $31,250 |
| Bachelor's Degree | $99,375 | $62,008 |
| Graduate Degree | $80,938 | $70,625 |
| Total | $77,563 | $46,146 |
Family Income in Blue Grass
Family Income Brackets in Blue Grass
According to the Blue Grass family income data, there are 168 families falling into the $100,000 to $149,999 income range, which is the most common income bracket and makes up 28.8% of all families. Conversely, the $10,000 to $14,999 income bracket is the least frequent group with only 3 families (0.5%) belonging to this category.
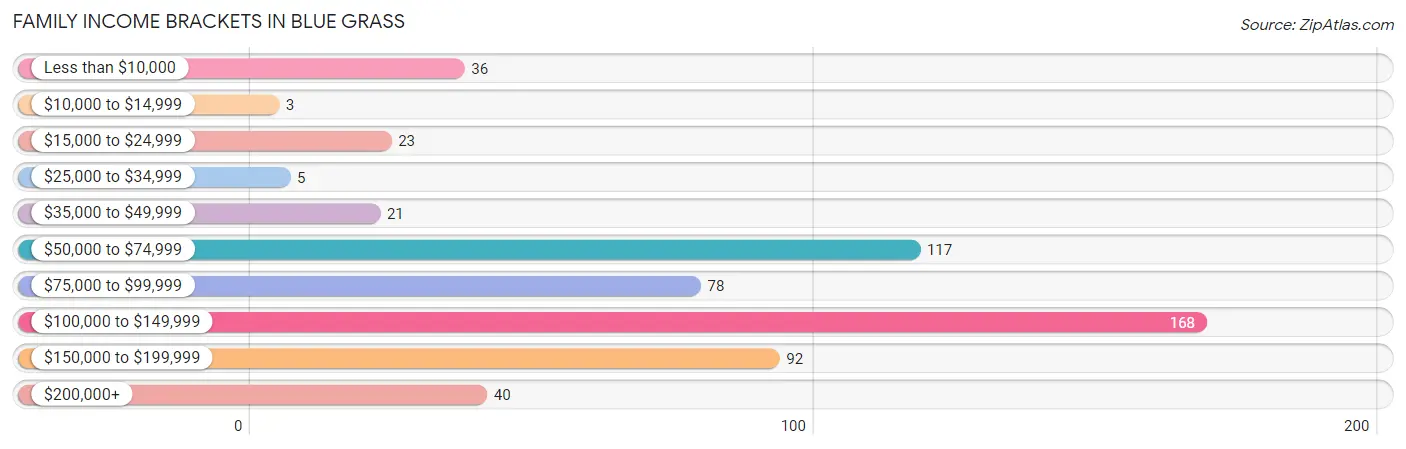
| Income Bracket | # Families | % Families |
| Less than $10,000 | 36 | 6.2% |
| $10,000 to $14,999 | 3 | 0.5% |
| $15,000 to $24,999 | 23 | 3.9% |
| $25,000 to $34,999 | 5 | 0.9% |
| $35,000 to $49,999 | 21 | 3.6% |
| $50,000 to $74,999 | 117 | 20.1% |
| $75,000 to $99,999 | 78 | 13.4% |
| $100,000 to $149,999 | 168 | 28.8% |
| $150,000 to $199,999 | 92 | 15.8% |
| $200,000+ | 40 | 6.9% |
Family Income by Famaliy Size in Blue Grass
4-person families (96 | 16.5%) account for the highest median family income in Blue Grass with $123,750 per family, while 2-person families (365 | 62.6%) have the highest median income of $43,646 per family member.
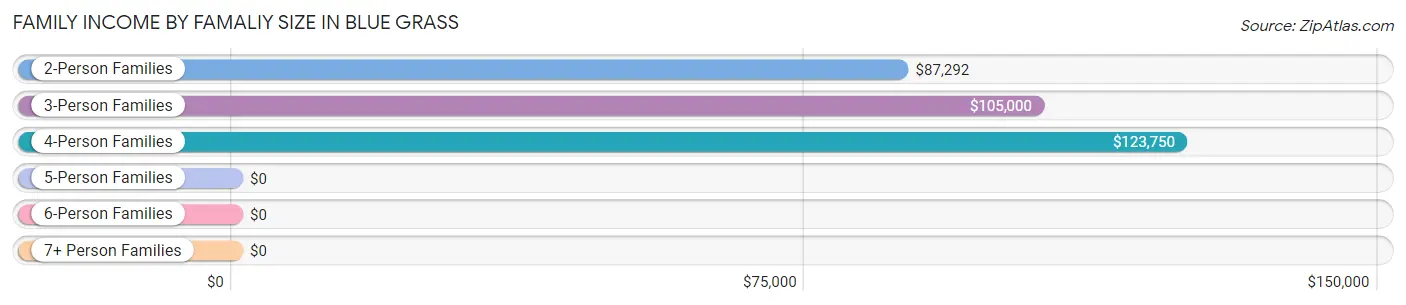
| Income Bracket | # Families | Median Income |
| 2-Person Families | 365 (62.6%) | $87,292 |
| 3-Person Families | 94 (16.1%) | $105,000 |
| 4-Person Families | 96 (16.5%) | $123,750 |
| 5-Person Families | 17 (2.9%) | $0 |
| 6-Person Families | 6 (1.0%) | $0 |
| 7+ Person Families | 5 (0.9%) | $0 |
| Total | 583 (100.0%) | $103,317 |
Family Income by Number of Earners in Blue Grass
The median family income in Blue Grass is $103,317, with families comprising 3+ earners (44) having the highest median family income of $150,278, while families with no earners (152) have the lowest median family income of $52,500, accounting for 7.5% and 26.1% of families, respectively.
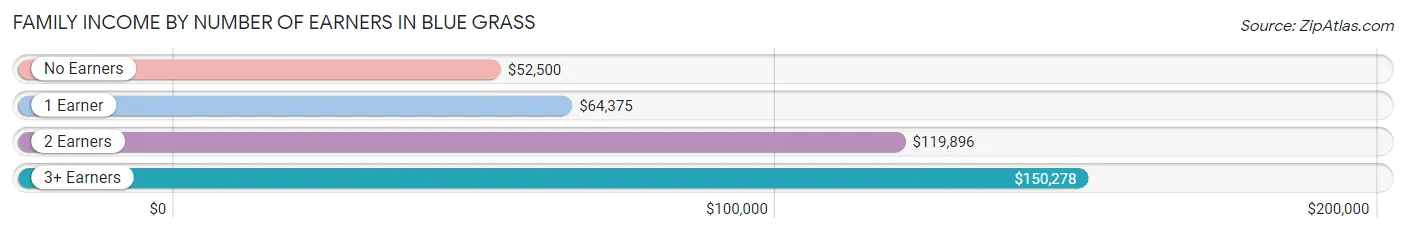
| Number of Earners | # Families | Median Income |
| No Earners | 152 (26.1%) | $52,500 |
| 1 Earner | 127 (21.8%) | $64,375 |
| 2 Earners | 260 (44.6%) | $119,896 |
| 3+ Earners | 44 (7.5%) | $150,278 |
| Total | 583 (100.0%) | $103,317 |
Household Income in Blue Grass
Household Income Brackets in Blue Grass
With 185 households falling in the category, the $100,000 to $149,999 income range is the most frequent in Blue Grass, accounting for 22.3% of all households. In contrast, only 29 households (3.5%) fall into the $10,000 to $14,999 income bracket, making it the least populous group.
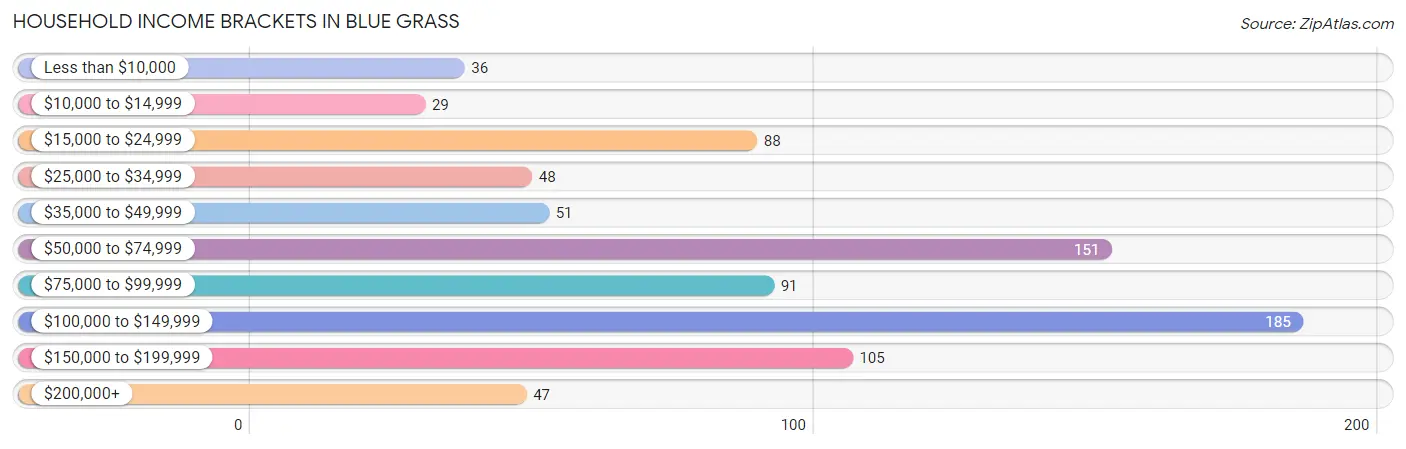
| Income Bracket | # Households | % Households |
| Less than $10,000 | 36 | 4.3% |
| $10,000 to $14,999 | 29 | 3.5% |
| $15,000 to $24,999 | 88 | 10.6% |
| $25,000 to $34,999 | 48 | 5.8% |
| $35,000 to $49,999 | 51 | 6.1% |
| $50,000 to $74,999 | 151 | 18.2% |
| $75,000 to $99,999 | 91 | 11.0% |
| $100,000 to $149,999 | 185 | 22.3% |
| $150,000 to $199,999 | 105 | 12.6% |
| $200,000+ | 47 | 5.7% |
Household Income by Householder Age in Blue Grass
The median household income in Blue Grass is $78,125, with the highest median household income of $102,933 found in the 45 to 64 years age bracket for the primary householder. A total of 383 households (46.1%) fall into this category. Meanwhile, the 15 to 24 years age bracket for the primary householder has the lowest median household income of $0, with 14 households (1.7%) in this group.
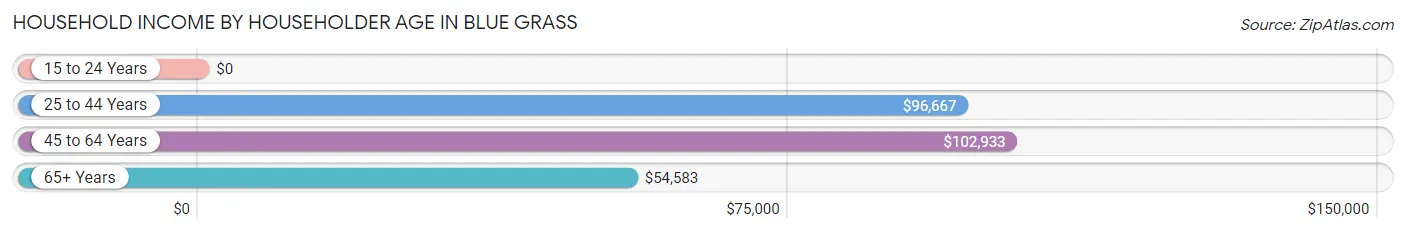
| Income Bracket | # Households | Median Income |
| 15 to 24 Years | 14 (1.7%) | $0 |
| 25 to 44 Years | 202 (24.3%) | $96,667 |
| 45 to 64 Years | 383 (46.1%) | $102,933 |
| 65+ Years | 232 (27.9%) | $54,583 |
| Total | 831 (100.0%) | $78,125 |
Poverty in Blue Grass
Income Below Poverty by Sex and Age in Blue Grass
With 10.7% poverty level for males and 10.9% for females among the residents of Blue Grass, 12 to 14 year old males and 5 year old females are the most vulnerable to poverty, with 4 males (30.8%) and 7 females (50.0%) in their respective age groups living below the poverty level.
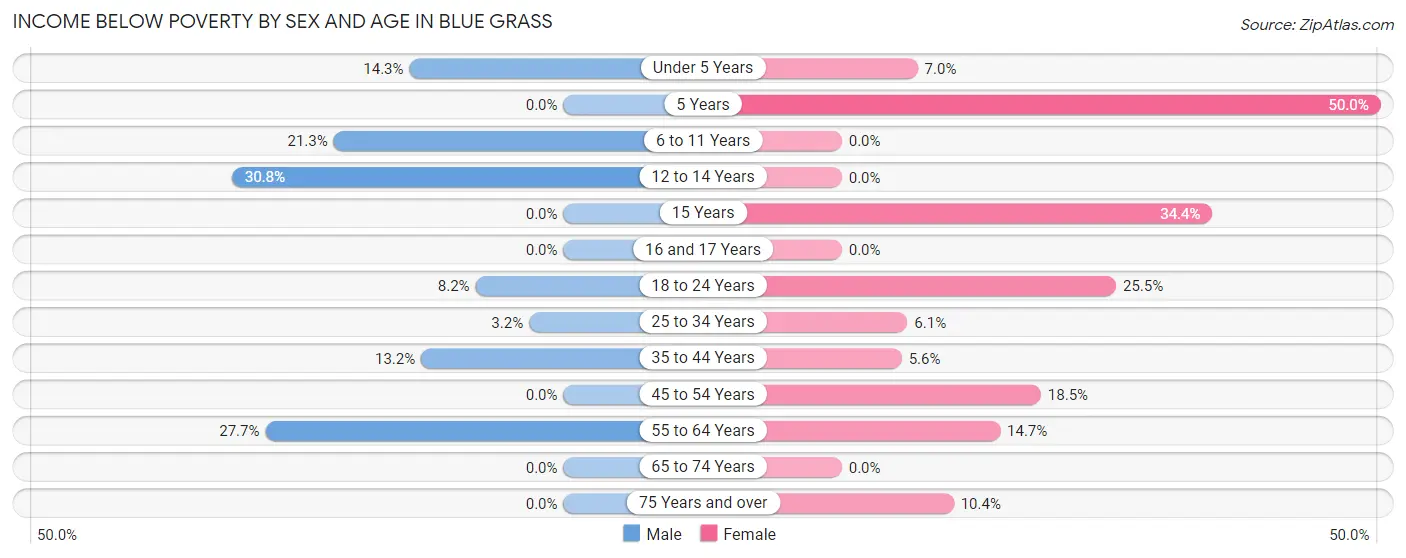
| Age Bracket | Male | Female |
| Under 5 Years | 9 (14.3%) | 5 (7.0%) |
| 5 Years | 0 (0.0%) | 7 (50.0%) |
| 6 to 11 Years | 16 (21.3%) | 0 (0.0%) |
| 12 to 14 Years | 4 (30.8%) | 0 (0.0%) |
| 15 Years | 0 (0.0%) | 11 (34.4%) |
| 16 and 17 Years | 0 (0.0%) | 0 (0.0%) |
| 18 to 24 Years | 4 (8.2%) | 14 (25.5%) |
| 25 to 34 Years | 3 (3.2%) | 7 (6.1%) |
| 35 to 44 Years | 14 (13.2%) | 5 (5.6%) |
| 45 to 54 Years | 0 (0.0%) | 34 (18.5%) |
| 55 to 64 Years | 39 (27.7%) | 21 (14.7%) |
| 65 to 74 Years | 0 (0.0%) | 0 (0.0%) |
| 75 Years and over | 0 (0.0%) | 8 (10.4%) |
| Total | 89 (10.7%) | 112 (10.9%) |
Income Above Poverty by Sex and Age in Blue Grass
According to the poverty statistics in Blue Grass, males aged 5 years and females aged 6 to 11 years are the age groups that are most secure financially, with 100.0% of males and 100.0% of females in these age groups living above the poverty line.
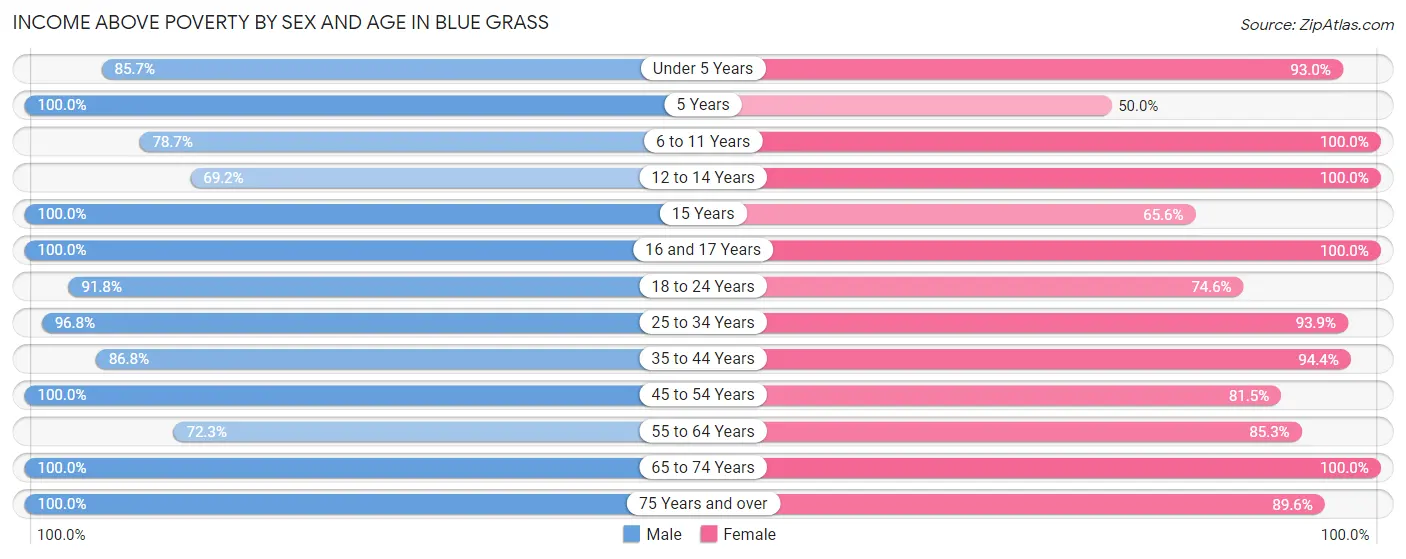
| Age Bracket | Male | Female |
| Under 5 Years | 54 (85.7%) | 66 (93.0%) |
| 5 Years | 6 (100.0%) | 7 (50.0%) |
| 6 to 11 Years | 59 (78.7%) | 64 (100.0%) |
| 12 to 14 Years | 9 (69.2%) | 25 (100.0%) |
| 15 Years | 14 (100.0%) | 21 (65.6%) |
| 16 and 17 Years | 16 (100.0%) | 20 (100.0%) |
| 18 to 24 Years | 45 (91.8%) | 41 (74.6%) |
| 25 to 34 Years | 91 (96.8%) | 108 (93.9%) |
| 35 to 44 Years | 92 (86.8%) | 85 (94.4%) |
| 45 to 54 Years | 87 (100.0%) | 150 (81.5%) |
| 55 to 64 Years | 102 (72.3%) | 122 (85.3%) |
| 65 to 74 Years | 107 (100.0%) | 138 (100.0%) |
| 75 Years and over | 62 (100.0%) | 69 (89.6%) |
| Total | 744 (89.3%) | 916 (89.1%) |
Income Below Poverty Among Married-Couple Families in Blue Grass
The poverty statistics for married-couple families in Blue Grass show that 7.2% or 32 of the total 444 families live below the poverty line. Families with no children have the highest poverty rate of 10.4%, comprising of 32 families. On the other hand, families with 1 or 2 children have the lowest poverty rate of 0.0%, which includes 0 families.
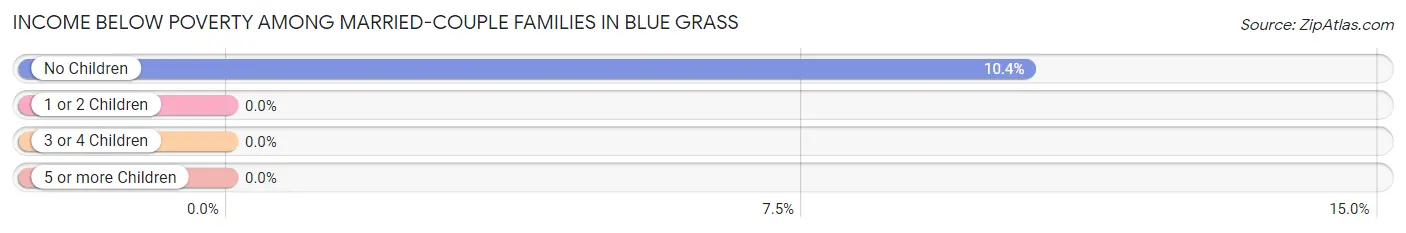
| Children | Above Poverty | Below Poverty |
| No Children | 275 (89.6%) | 32 (10.4%) |
| 1 or 2 Children | 122 (100.0%) | 0 (0.0%) |
| 3 or 4 Children | 10 (100.0%) | 0 (0.0%) |
| 5 or more Children | 5 (100.0%) | 0 (0.0%) |
| Total | 412 (92.8%) | 32 (7.2%) |
Income Below Poverty Among Single-Parent Households in Blue Grass
According to the poverty data in Blue Grass, 55.6% or 15 single-father households and 13.4% or 15 single-mother households are living below the poverty line. Among single-father households, those with no children have the highest poverty rate, with 12 households (100.0%) experiencing poverty. Likewise, among single-mother households, those with 5 or more children have the highest poverty rate, with 3 households (100.0%) falling below the poverty line.
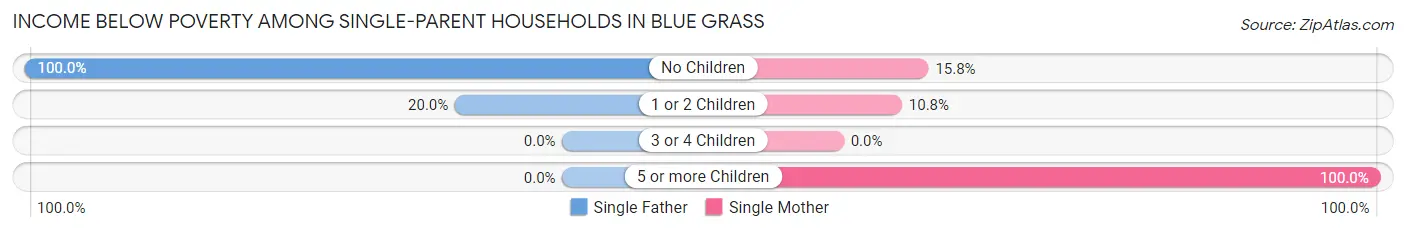
| Children | Single Father | Single Mother |
| No Children | 12 (100.0%) | 3 (15.8%) |
| 1 or 2 Children | 3 (20.0%) | 9 (10.8%) |
| 3 or 4 Children | 0 (0.0%) | 0 (0.0%) |
| 5 or more Children | 0 (0.0%) | 3 (100.0%) |
| Total | 15 (55.6%) | 15 (13.4%) |
Income Below Poverty Among Married-Couple vs Single-Parent Households in Blue Grass
The poverty data for Blue Grass shows that 32 of the married-couple family households (7.2%) and 30 of the single-parent households (21.6%) are living below the poverty level. Within the married-couple family households, those with no children have the highest poverty rate, with 32 households (10.4%) falling below the poverty line. Among the single-parent households, those with 5 or more children have the highest poverty rate, with 3 household (100.0%) living below poverty.
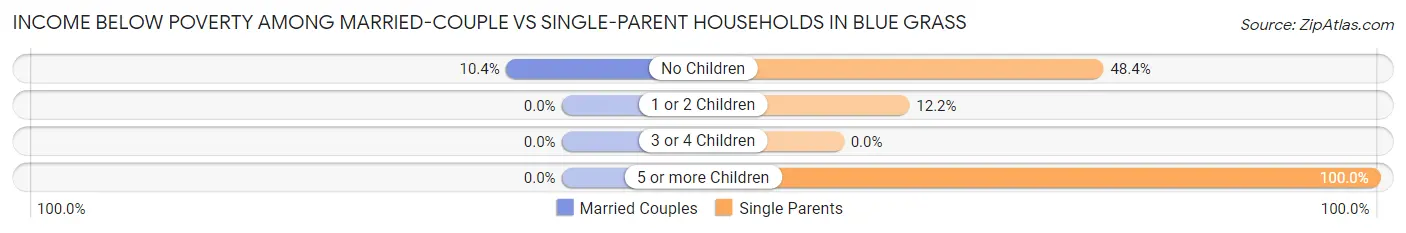
| Children | Married-Couple Families | Single-Parent Households |
| No Children | 32 (10.4%) | 15 (48.4%) |
| 1 or 2 Children | 0 (0.0%) | 12 (12.2%) |
| 3 or 4 Children | 0 (0.0%) | 0 (0.0%) |
| 5 or more Children | 0 (0.0%) | 3 (100.0%) |
| Total | 32 (7.2%) | 30 (21.6%) |
Race in Blue Grass
The most populous races in Blue Grass are White / Caucasian (1,716 | 91.6%), Hispanic or Latino (106 | 5.7%), and Two or more Races (93 | 5.0%).
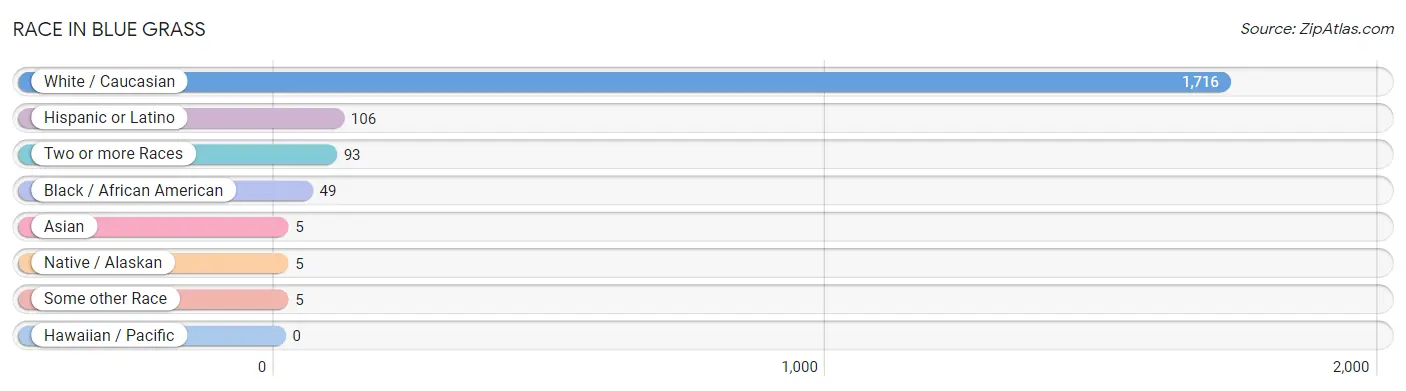
| Race | # Population | % Population |
| Asian | 5 | 0.3% |
| Black / African American | 49 | 2.6% |
| Hawaiian / Pacific | 0 | 0.0% |
| Hispanic or Latino | 106 | 5.7% |
| Native / Alaskan | 5 | 0.3% |
| White / Caucasian | 1,716 | 91.6% |
| Two or more Races | 93 | 5.0% |
| Some other Race | 5 | 0.3% |
| Total | 1,873 | 100.0% |
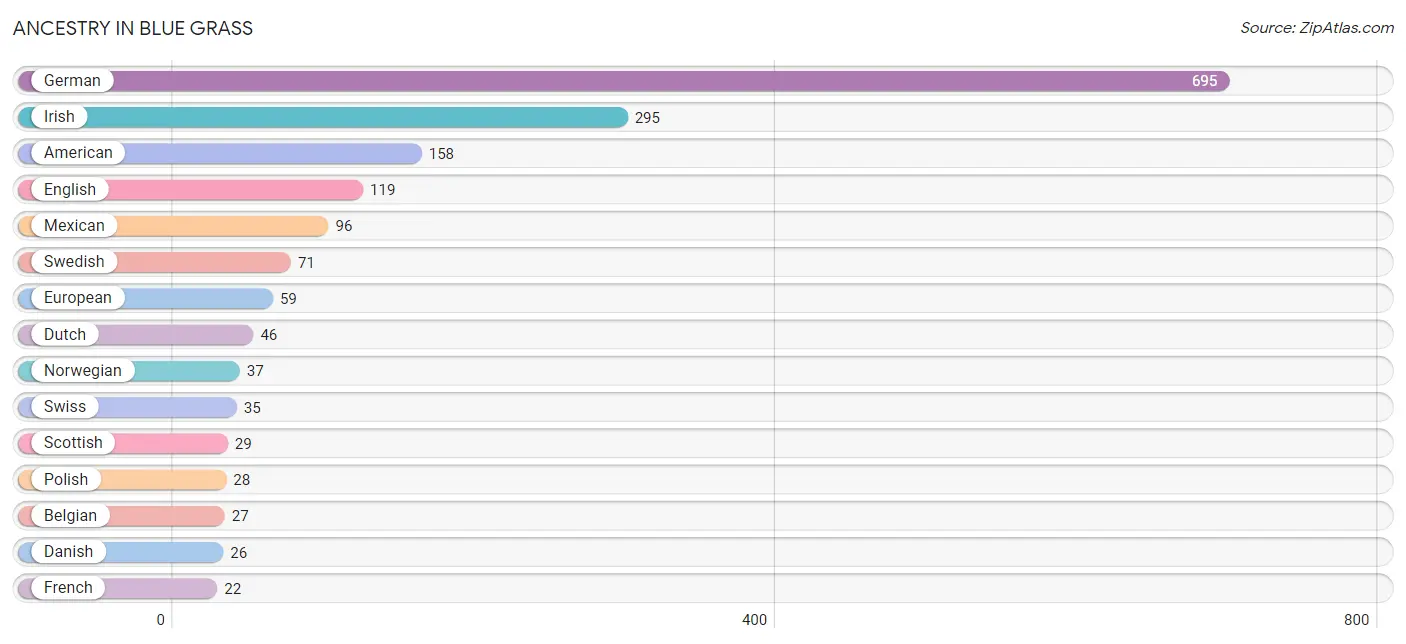
Ancestry in Blue Grass
The most populous ancestries reported in Blue Grass are German (695 | 37.1%), Irish (295 | 15.8%), American (158 | 8.4%), English (119 | 6.4%), and Mexican (96 | 5.1%), together accounting for 72.8% of all Blue Grass residents.
| Ancestry | # Population | % Population |
| American | 158 | 8.4% |
| Australian | 3 | 0.2% |
| Austrian | 12 | 0.6% |
| Belgian | 27 | 1.4% |
| British | 7 | 0.4% |
| Burmese | 14 | 0.7% |
| Croatian | 3 | 0.2% |
| Czech | 3 | 0.2% |
| Danish | 26 | 1.4% |
| Dutch | 46 | 2.5% |
| Eastern European | 3 | 0.2% |
| English | 119 | 6.4% |
| European | 59 | 3.2% |
| French | 22 | 1.2% |
| German | 695 | 37.1% |
| Irish | 295 | 15.8% |
| Italian | 14 | 0.7% |
| Korean | 8 | 0.4% |
| Mexican | 96 | 5.1% |
| Norwegian | 37 | 2.0% |
| Ottawa | 4 | 0.2% |
| Polish | 28 | 1.5% |
| Puerto Rican | 4 | 0.2% |
| Russian | 3 | 0.2% |
| Scotch-Irish | 7 | 0.4% |
| Scottish | 29 | 1.5% |
| Sioux | 4 | 0.2% |
| Slovene | 3 | 0.2% |
| Spaniard | 5 | 0.3% |
| Spanish | 1 | 0.1% |
| Swedish | 71 | 3.8% |
| Swiss | 35 | 1.9% |
| Welsh | 18 | 1.0% | View All 33 Rows |
Immigrants in Blue Grass
The most numerous immigrant groups reported in Blue Grass came from Europe (27 | 1.4%), Northern Europe (27 | 1.4%), Asia (5 | 0.3%), Eastern Asia (5 | 0.3%), and Korea (5 | 0.3%), together accounting for 3.7% of all Blue Grass residents.
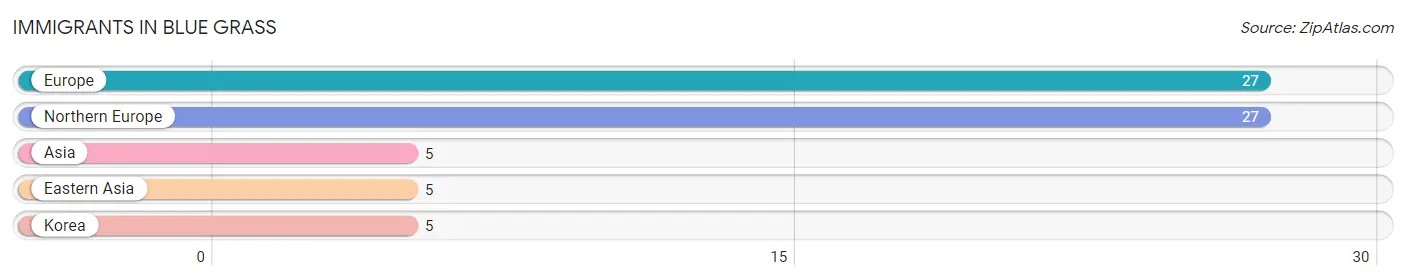
| Immigration Origin | # Population | % Population |
| Asia | 5 | 0.3% |
| Eastern Asia | 5 | 0.3% |
| Europe | 27 | 1.4% |
| Korea | 5 | 0.3% |
| Northern Europe | 27 | 1.4% | View All 5 Rows |
Sex and Age in Blue Grass
Sex and Age in Blue Grass
The most populous age groups in Blue Grass are 55 to 59 Years (75 | 8.9%) for men and 50 to 54 Years (141 | 13.6%) for women.
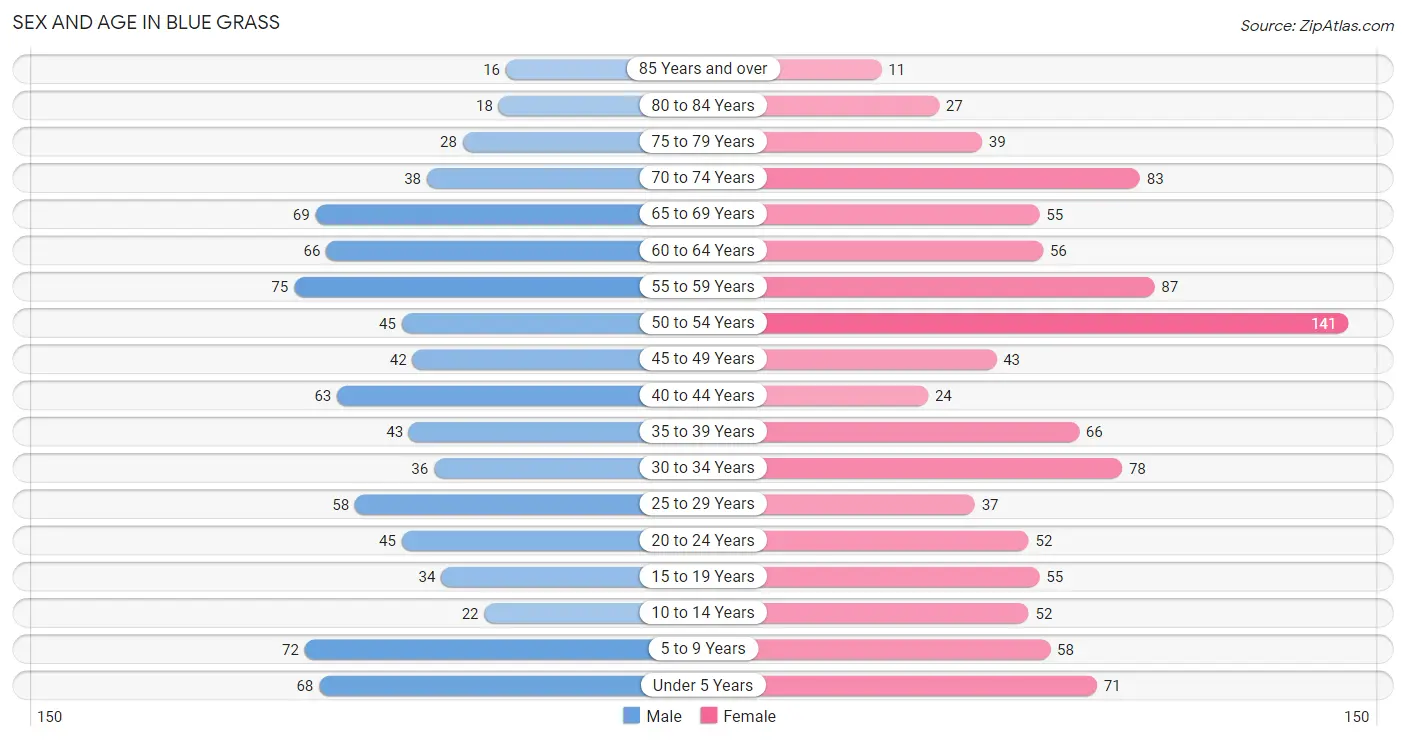
| Age Bracket | Male | Female |
| Under 5 Years | 68 (8.1%) | 71 (6.9%) |
| 5 to 9 Years | 72 (8.6%) | 58 (5.6%) |
| 10 to 14 Years | 22 (2.6%) | 52 (5.0%) |
| 15 to 19 Years | 34 (4.1%) | 55 (5.3%) |
| 20 to 24 Years | 45 (5.4%) | 52 (5.0%) |
| 25 to 29 Years | 58 (6.9%) | 37 (3.6%) |
| 30 to 34 Years | 36 (4.3%) | 78 (7.5%) |
| 35 to 39 Years | 43 (5.1%) | 66 (6.4%) |
| 40 to 44 Years | 63 (7.5%) | 24 (2.3%) |
| 45 to 49 Years | 42 (5.0%) | 43 (4.2%) |
| 50 to 54 Years | 45 (5.4%) | 141 (13.6%) |
| 55 to 59 Years | 75 (8.9%) | 87 (8.4%) |
| 60 to 64 Years | 66 (7.9%) | 56 (5.4%) |
| 65 to 69 Years | 69 (8.2%) | 55 (5.3%) |
| 70 to 74 Years | 38 (4.5%) | 83 (8.0%) |
| 75 to 79 Years | 28 (3.3%) | 39 (3.8%) |
| 80 to 84 Years | 18 (2.1%) | 27 (2.6%) |
| 85 Years and over | 16 (1.9%) | 11 (1.1%) |
| Total | 838 (100.0%) | 1,035 (100.0%) |
Families and Households in Blue Grass
Median Family Size in Blue Grass
The median family size in Blue Grass is 2.58 persons per family, with married-couple families (444 | 76.2%) accounting for the largest median family size of 2.66 persons per family. On the other hand, single male/father families (27 | 4.6%) represent the smallest median family size with 2.04 persons per family.
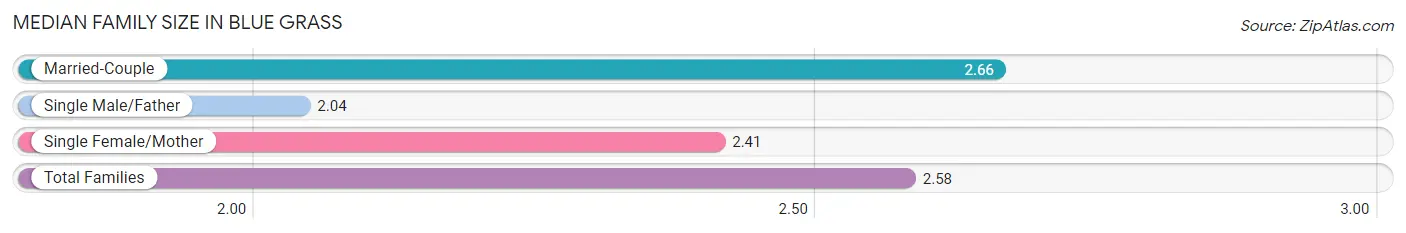
| Family Type | # Families | Family Size |
| Married-Couple | 444 (76.2%) | 2.66 |
| Single Male/Father | 27 (4.6%) | 2.04 |
| Single Female/Mother | 112 (19.2%) | 2.41 |
| Total Families | 583 (100.0%) | 2.58 |
Median Household Size in Blue Grass
The median household size in Blue Grass is 2.25 persons per household, with married-couple households (444 | 53.4%) accounting for the largest median household size of 2.71 persons per household. non-family households (248 | 29.8%) represent the smallest median household size with 1.29 persons per household.
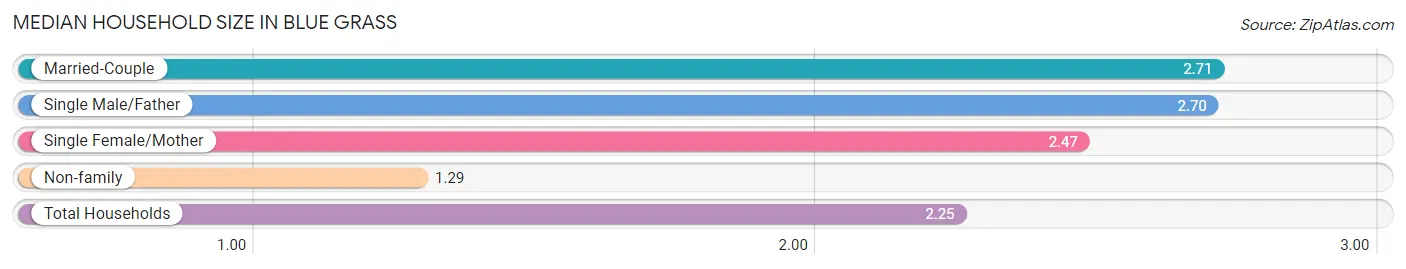
| Household Type | # Households | Household Size |
| Married-Couple | 444 (53.4%) | 2.71 |
| Single Male/Father | 27 (3.3%) | 2.70 |
| Single Female/Mother | 112 (13.5%) | 2.47 |
| Non-family | 248 (29.8%) | 1.29 |
| Total Households | 831 (100.0%) | 2.25 |
Household Size by Marriage Status in Blue Grass
Out of a total of 831 households in Blue Grass, 583 (70.2%) are family households, while 248 (29.8%) are nonfamily households. The most numerous type of family households are 2-person households, comprising 345, and the most common type of nonfamily households are 1-person households, comprising 207.
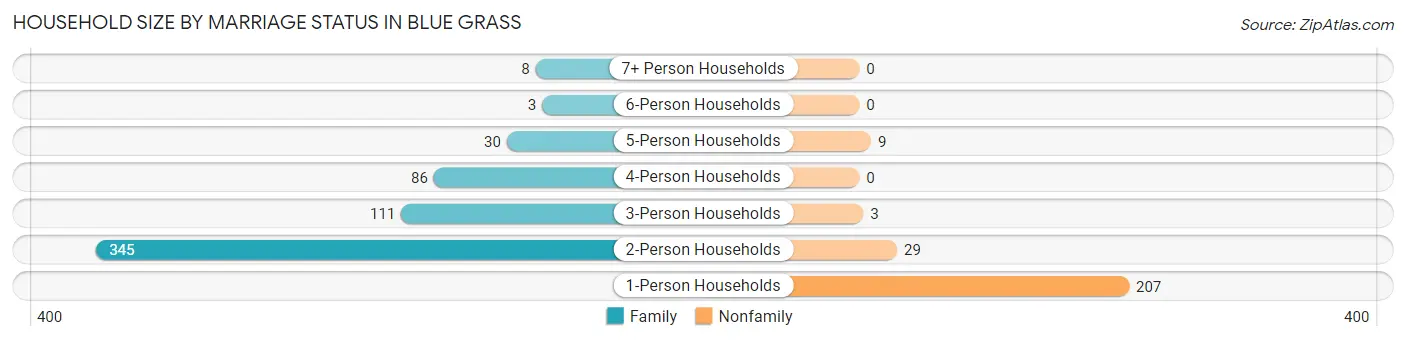
| Household Size | Family Households | Nonfamily Households |
| 1-Person Households | - | 207 (24.9%) |
| 2-Person Households | 345 (41.5%) | 29 (3.5%) |
| 3-Person Households | 111 (13.4%) | 3 (0.4%) |
| 4-Person Households | 86 (10.3%) | 0 (0.0%) |
| 5-Person Households | 30 (3.6%) | 9 (1.1%) |
| 6-Person Households | 3 (0.4%) | 0 (0.0%) |
| 7+ Person Households | 8 (1.0%) | 0 (0.0%) |
| Total | 583 (70.2%) | 248 (29.8%) |
Female Fertility in Blue Grass
Fertility by Age in Blue Grass
Average fertility rate in Blue Grass is 51.0 births per 1,000 women. Women in the age bracket of 20 to 34 years have the highest fertility rate with 120.0 births per 1,000 women. Women in the age bracket of 20 to 34 years acount for 100.0% of all women with births.
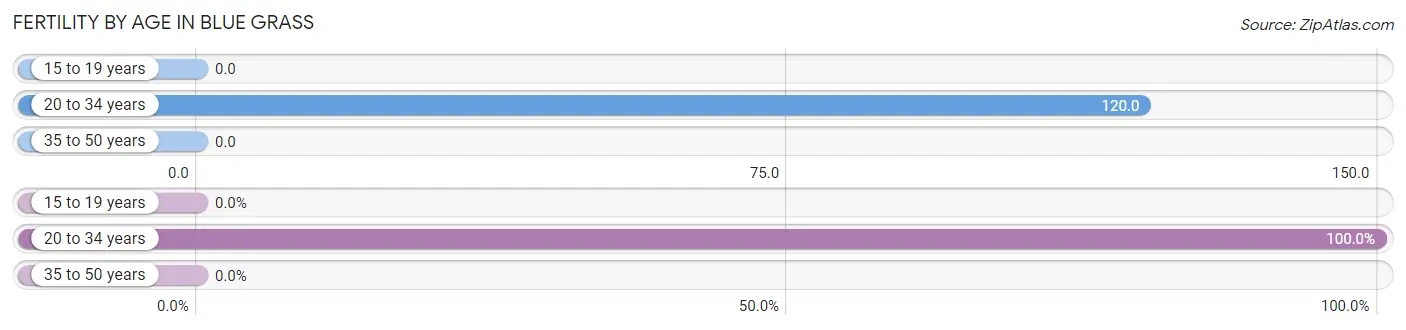
| Age Bracket | Women with Births | Births / 1,000 Women |
| 15 to 19 years | 0 (0.0%) | 0.0 |
| 20 to 34 years | 20 (100.0%) | 120.0 |
| 35 to 50 years | 0 (0.0%) | 0.0 |
| Total | 20 (100.0%) | 51.0 |
Fertility by Age by Marriage Status in Blue Grass
85.0% of women with births (20) in Blue Grass are married. The highest percentage of unmarried women with births falls into 20 to 34 years age bracket with 15.0% of them unmarried at the time of birth, while the lowest percentage of unmarried women with births belong to 20 to 34 years age bracket with 15.0% of them unmarried.
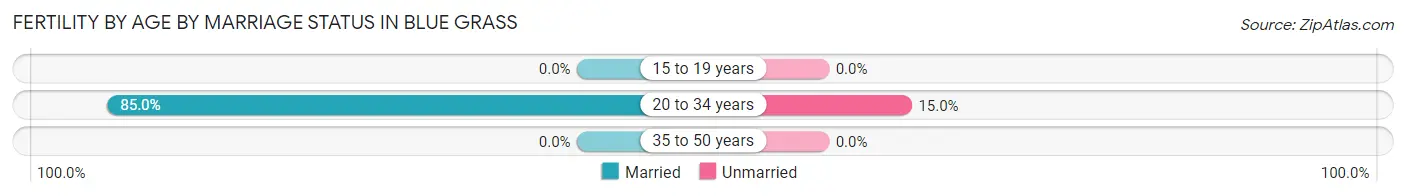
| Age Bracket | Married | Unmarried |
| 15 to 19 years | 0 (0.0%) | 0 (0.0%) |
| 20 to 34 years | 17 (85.0%) | 3 (15.0%) |
| 35 to 50 years | 0 (0.0%) | 0 (0.0%) |
| Total | 17 (85.0%) | 3 (15.0%) |
Fertility by Education in Blue Grass
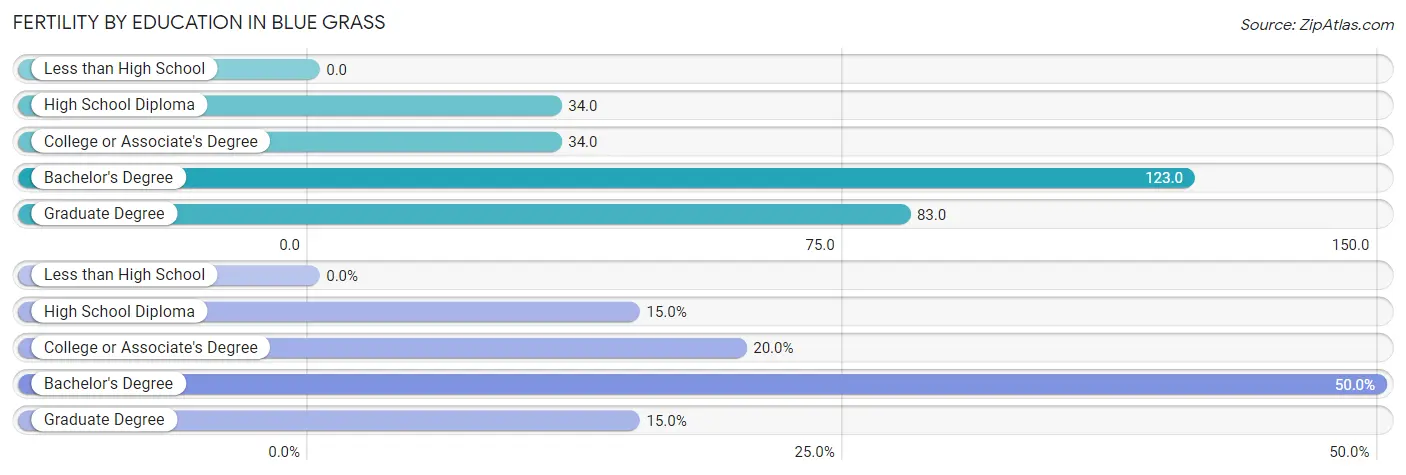
| Educational Attainment | Women with Births | Births / 1,000 Women |
| Less than High School | 0 (0.0%) | 0.0 |
| High School Diploma | 3 (15.0%) | 34.0 |
| College or Associate's Degree | 4 (20.0%) | 34.0 |
| Bachelor's Degree | 10 (50.0%) | 123.0 |
| Graduate Degree | 3 (15.0%) | 83.0 |
| Total | 20 (100.0%) | 51.0 |
Fertility by Education by Marriage Status in Blue Grass
15.0% of women with births in Blue Grass are unmarried. Women with the educational attainment of college or associate's degree are most likely to be married with 100.0% of them married at childbirth, while women with the educational attainment of high school diploma are least likely to be married with 100.0% of them unmarried at childbirth.
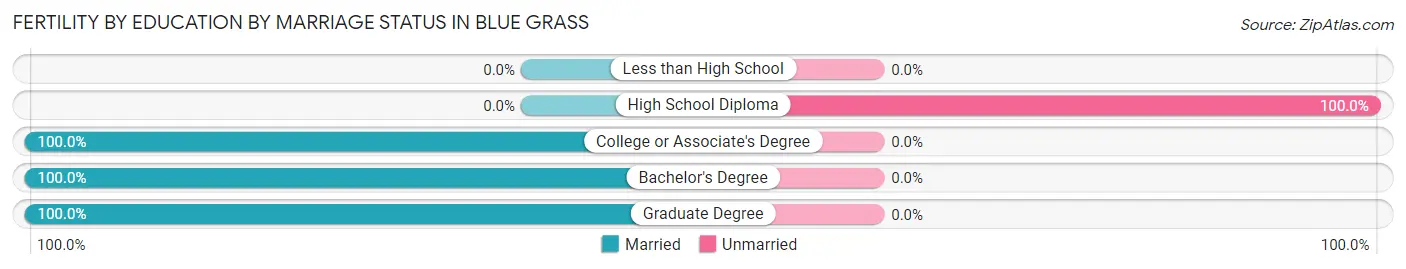
| Educational Attainment | Married | Unmarried |
| Less than High School | 0 (0.0%) | 0 (0.0%) |
| High School Diploma | 0 (0.0%) | 3 (100.0%) |
| College or Associate's Degree | 4 (100.0%) | 0 (0.0%) |
| Bachelor's Degree | 10 (100.0%) | 0 (0.0%) |
| Graduate Degree | 3 (100.0%) | 0 (0.0%) |
| Total | 17 (85.0%) | 3 (15.0%) |
Employment Characteristics in Blue Grass
Employment by Class of Employer in Blue Grass
Among the 813 employed individuals in Blue Grass, private company employees (590 | 72.6%), not-for-profit organizations (54 | 6.6%), and local government employees (54 | 6.6%) make up the most common classes of employment.
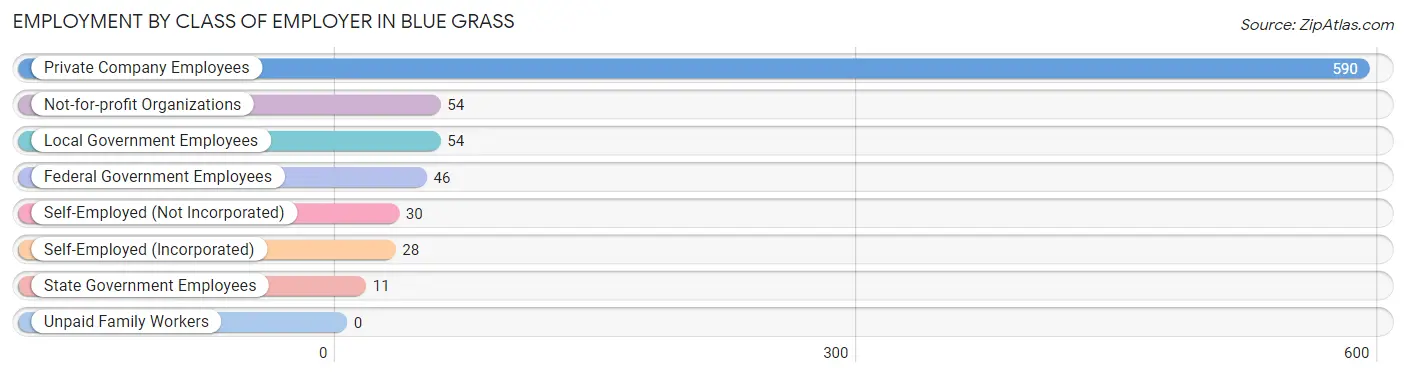
| Employer Class | # Employees | % Employees |
| Private Company Employees | 590 | 72.6% |
| Self-Employed (Incorporated) | 28 | 3.4% |
| Self-Employed (Not Incorporated) | 30 | 3.7% |
| Not-for-profit Organizations | 54 | 6.6% |
| Local Government Employees | 54 | 6.6% |
| State Government Employees | 11 | 1.3% |
| Federal Government Employees | 46 | 5.7% |
| Unpaid Family Workers | 0 | 0.0% |
| Total | 813 | 100.0% |
Employment Status by Age in Blue Grass
According to the labor force statistics for Blue Grass, out of the total population over 16 years of age (1,484), 60.3% or 895 individuals are in the labor force, with 6.2% or 55 of them unemployed. The age group with the highest labor force participation rate is 35 to 44 years, with 90.8% or 178 individuals in the labor force. Within the labor force, the 16 to 19 years age range has the highest percentage of unemployed individuals, with 58.3% or 21 of them being unemployed.
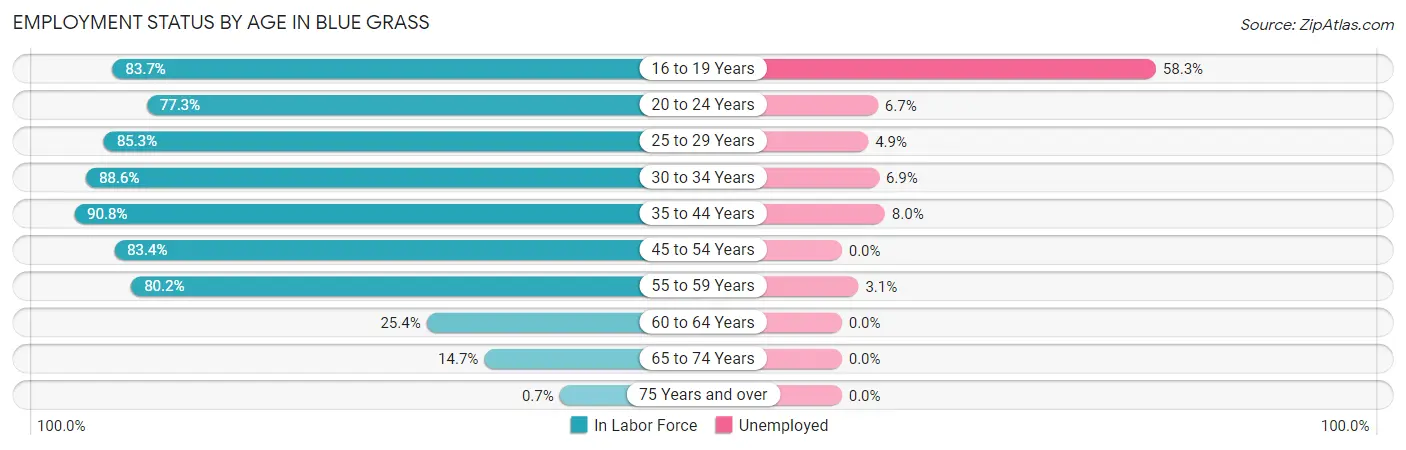
| Age Bracket | In Labor Force | Unemployed |
| 16 to 19 Years | 36 (83.7%) | 21 (58.3%) |
| 20 to 24 Years | 75 (77.3%) | 5 (6.7%) |
| 25 to 29 Years | 81 (85.3%) | 4 (4.9%) |
| 30 to 34 Years | 101 (88.6%) | 7 (6.9%) |
| 35 to 44 Years | 178 (90.8%) | 14 (8.0%) |
| 45 to 54 Years | 226 (83.4%) | 0 (0.0%) |
| 55 to 59 Years | 130 (80.2%) | 4 (3.1%) |
| 60 to 64 Years | 31 (25.4%) | 0 (0.0%) |
| 65 to 74 Years | 36 (14.7%) | 0 (0.0%) |
| 75 Years and over | 1 (0.7%) | 0 (0.0%) |
| Total | 895 (60.3%) | 55 (6.2%) |
Employment Status by Educational Attainment in Blue Grass
According to labor force statistics for Blue Grass, 77.8% of individuals (747) out of the total population between 25 and 64 years of age (960) are in the labor force, with 3.9% or 29 of them being unemployed. The group with the highest labor force participation rate are those with the educational attainment of bachelor's degree or higher, with 87.5% or 294 individuals in the labor force. Within the labor force, individuals with bachelor's degree or higher education have the highest percentage of unemployment, with 7.5% or 22 of them being unemployed.
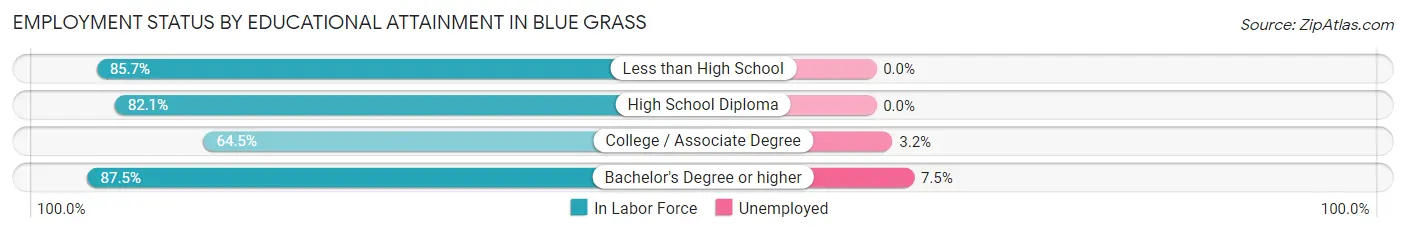
| Educational Attainment | In Labor Force | Unemployed |
| Less than High School | 18 (85.7%) | 0 (0.0%) |
| High School Diploma | 215 (82.1%) | 0 (0.0%) |
| College / Associate Degree | 220 (64.5%) | 11 (3.2%) |
| Bachelor's Degree or higher | 294 (87.5%) | 25 (7.5%) |
| Total | 747 (77.8%) | 37 (3.9%) |
Employment Occupations by Sex in Blue Grass
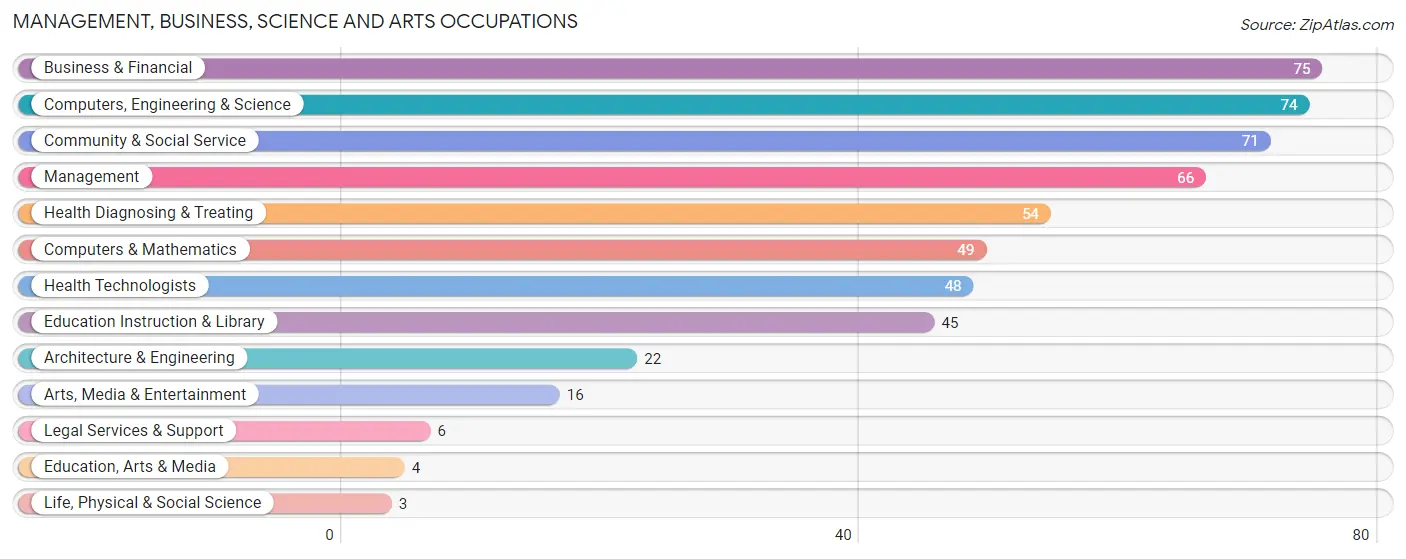
Management, Business, Science and Arts Occupations
The most common Management, Business, Science and Arts occupations in Blue Grass are Business & Financial (75 | 9.0%), Computers, Engineering & Science (74 | 8.8%), Community & Social Service (71 | 8.5%), Management (66 | 7.9%), and Health Diagnosing & Treating (54 | 6.5%).
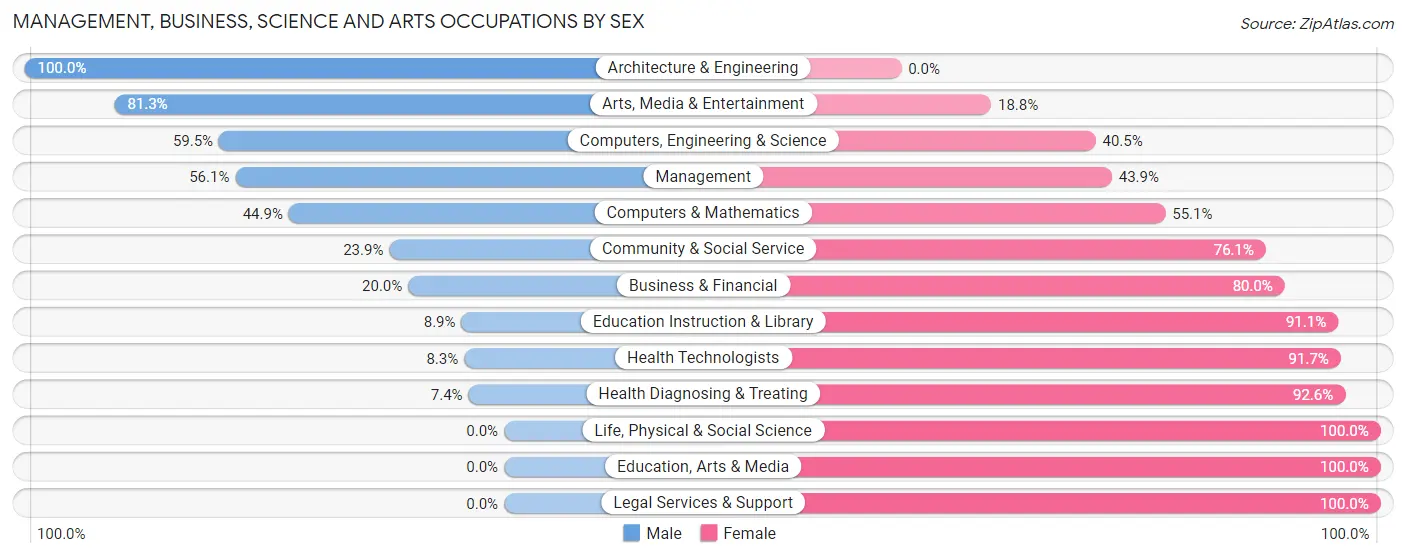
Management, Business, Science and Arts Occupations by Sex
Within the Management, Business, Science and Arts occupations in Blue Grass, the most male-oriented occupations are Architecture & Engineering (100.0%), Arts, Media & Entertainment (81.2%), and Computers, Engineering & Science (59.5%), while the most female-oriented occupations are Life, Physical & Social Science (100.0%), Education, Arts & Media (100.0%), and Legal Services & Support (100.0%).
| Occupation | Male | Female |
| Management | 37 (56.1%) | 29 (43.9%) |
| Business & Financial | 15 (20.0%) | 60 (80.0%) |
| Computers, Engineering & Science | 44 (59.5%) | 30 (40.5%) |
| Computers & Mathematics | 22 (44.9%) | 27 (55.1%) |
| Architecture & Engineering | 22 (100.0%) | 0 (0.0%) |
| Life, Physical & Social Science | 0 (0.0%) | 3 (100.0%) |
| Community & Social Service | 17 (23.9%) | 54 (76.1%) |
| Education, Arts & Media | 0 (0.0%) | 4 (100.0%) |
| Legal Services & Support | 0 (0.0%) | 6 (100.0%) |
| Education Instruction & Library | 4 (8.9%) | 41 (91.1%) |
| Arts, Media & Entertainment | 13 (81.2%) | 3 (18.8%) |
| Health Diagnosing & Treating | 4 (7.4%) | 50 (92.6%) |
| Health Technologists | 4 (8.3%) | 44 (91.7%) |
| Total (Category) | 117 (34.4%) | 223 (65.6%) |
| Total (Overall) | 396 (47.4%) | 440 (52.6%) |
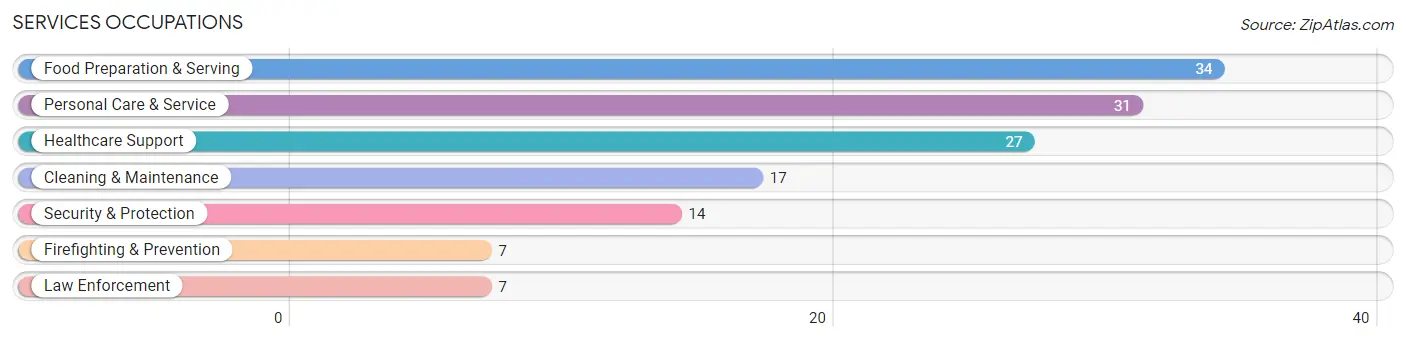
Services Occupations
The most common Services occupations in Blue Grass are Food Preparation & Serving (34 | 4.1%), Personal Care & Service (31 | 3.7%), Healthcare Support (27 | 3.2%), Cleaning & Maintenance (17 | 2.0%), and Security & Protection (14 | 1.7%).
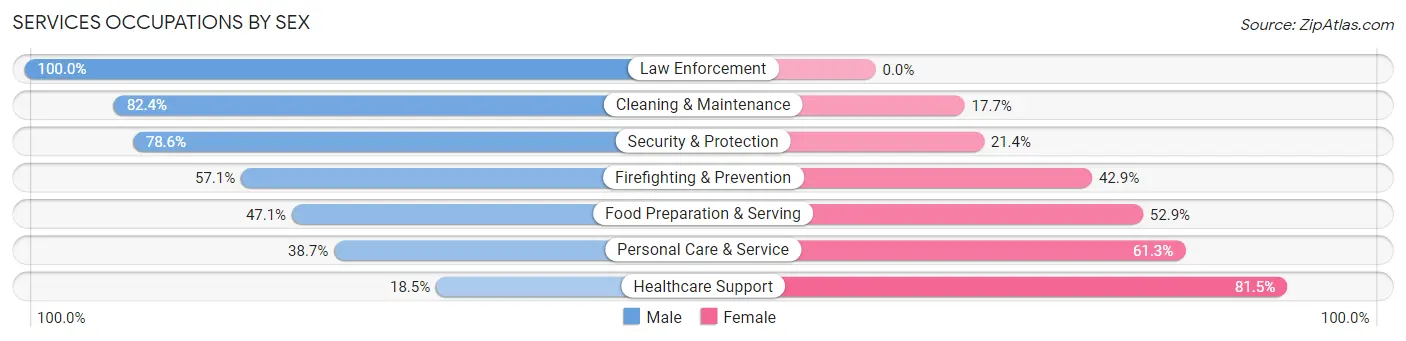
Services Occupations by Sex
Within the Services occupations in Blue Grass, the most male-oriented occupations are Law Enforcement (100.0%), Cleaning & Maintenance (82.4%), and Security & Protection (78.6%), while the most female-oriented occupations are Healthcare Support (81.5%), Personal Care & Service (61.3%), and Food Preparation & Serving (52.9%).
| Occupation | Male | Female |
| Healthcare Support | 5 (18.5%) | 22 (81.5%) |
| Security & Protection | 11 (78.6%) | 3 (21.4%) |
| Firefighting & Prevention | 4 (57.1%) | 3 (42.9%) |
| Law Enforcement | 7 (100.0%) | 0 (0.0%) |
| Food Preparation & Serving | 16 (47.1%) | 18 (52.9%) |
| Cleaning & Maintenance | 14 (82.4%) | 3 (17.6%) |
| Personal Care & Service | 12 (38.7%) | 19 (61.3%) |
| Total (Category) | 58 (47.1%) | 65 (52.8%) |
| Total (Overall) | 396 (47.4%) | 440 (52.6%) |
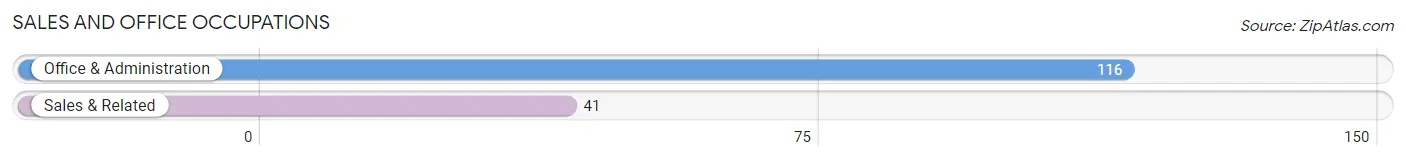
Sales and Office Occupations
The most common Sales and Office occupations in Blue Grass are Office & Administration (116 | 13.9%), and Sales & Related (41 | 4.9%).
Sales and Office Occupations by Sex
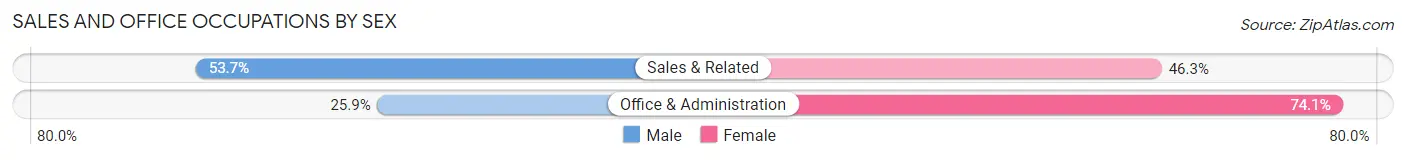
| Occupation | Male | Female |
| Sales & Related | 22 (53.7%) | 19 (46.3%) |
| Office & Administration | 30 (25.9%) | 86 (74.1%) |
| Total (Category) | 52 (33.1%) | 105 (66.9%) |
| Total (Overall) | 396 (47.4%) | 440 (52.6%) |
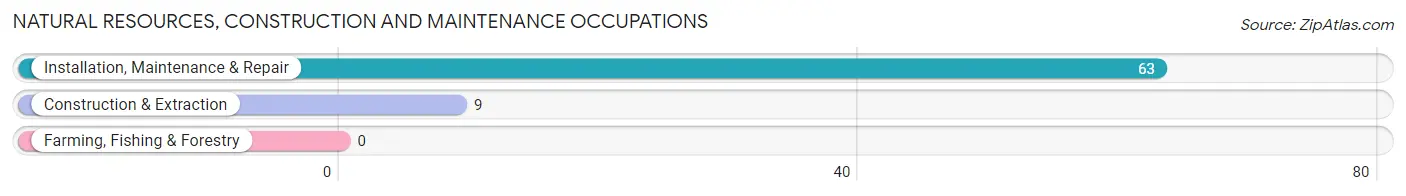
Natural Resources, Construction and Maintenance Occupations
The most common Natural Resources, Construction and Maintenance occupations in Blue Grass are Installation, Maintenance & Repair (63 | 7.5%), and Construction & Extraction (9 | 1.1%).
Natural Resources, Construction and Maintenance Occupations by Sex
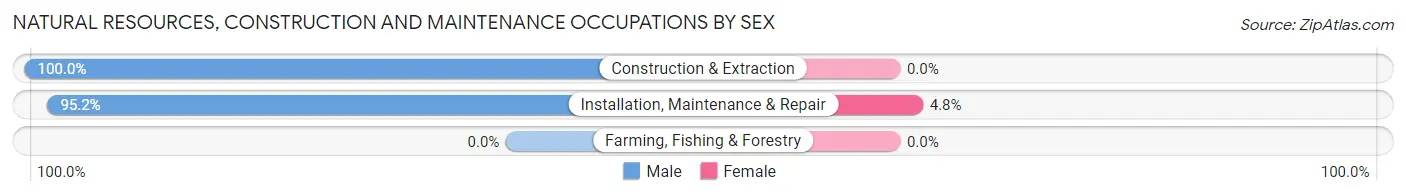
| Occupation | Male | Female |
| Farming, Fishing & Forestry | 0 (0.0%) | 0 (0.0%) |
| Construction & Extraction | 9 (100.0%) | 0 (0.0%) |
| Installation, Maintenance & Repair | 60 (95.2%) | 3 (4.8%) |
| Total (Category) | 69 (95.8%) | 3 (4.2%) |
| Total (Overall) | 396 (47.4%) | 440 (52.6%) |
Production, Transportation and Moving Occupations
The most common Production, Transportation and Moving occupations in Blue Grass are Material Moving (72 | 8.6%), Production (46 | 5.5%), and Transportation (26 | 3.1%).
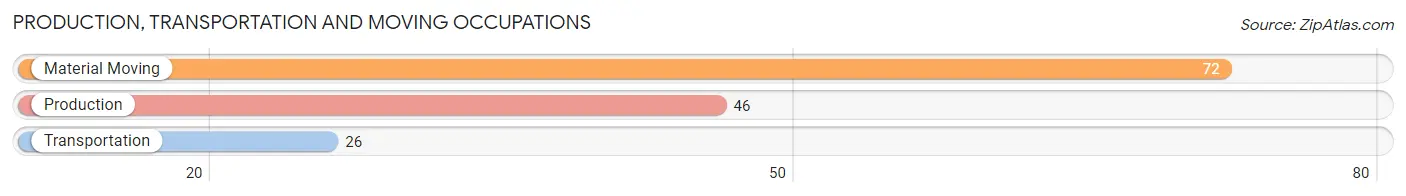
Production, Transportation and Moving Occupations by Sex
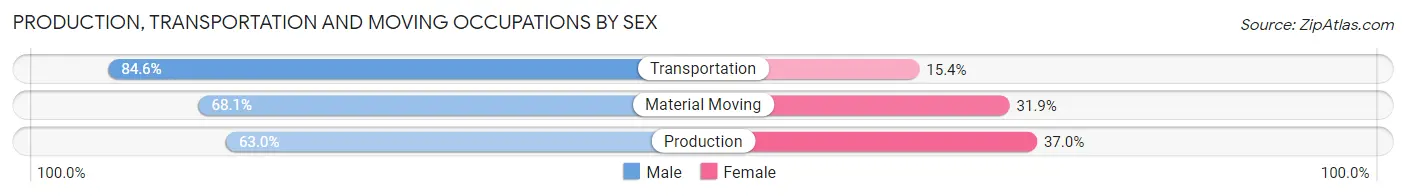
| Occupation | Male | Female |
| Production | 29 (63.0%) | 17 (37.0%) |
| Transportation | 22 (84.6%) | 4 (15.4%) |
| Material Moving | 49 (68.1%) | 23 (31.9%) |
| Total (Category) | 100 (69.4%) | 44 (30.6%) |
| Total (Overall) | 396 (47.4%) | 440 (52.6%) |
Employment Industries by Sex in Blue Grass
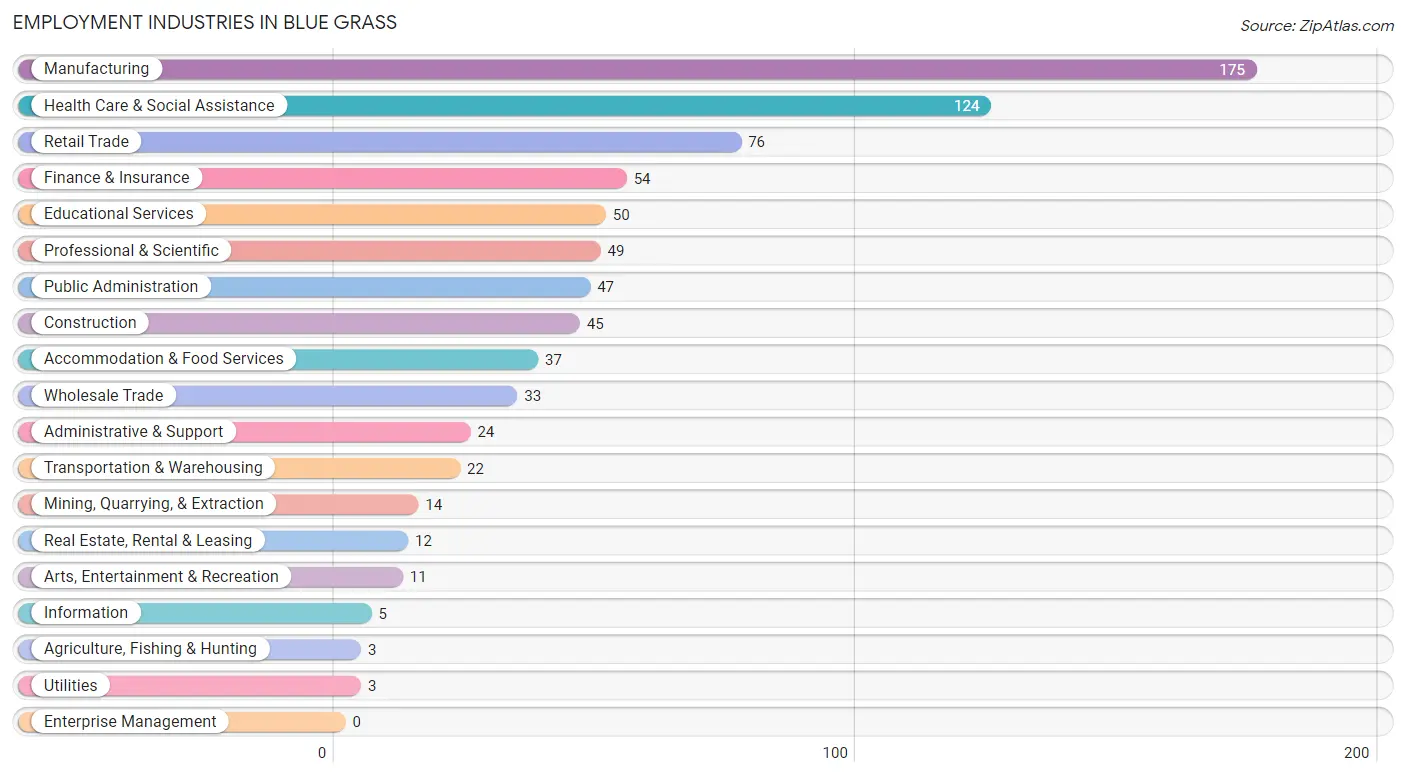
Employment Industries in Blue Grass
The major employment industries in Blue Grass include Manufacturing (175 | 20.9%), Health Care & Social Assistance (124 | 14.8%), Retail Trade (76 | 9.1%), Finance & Insurance (54 | 6.5%), and Educational Services (50 | 6.0%).
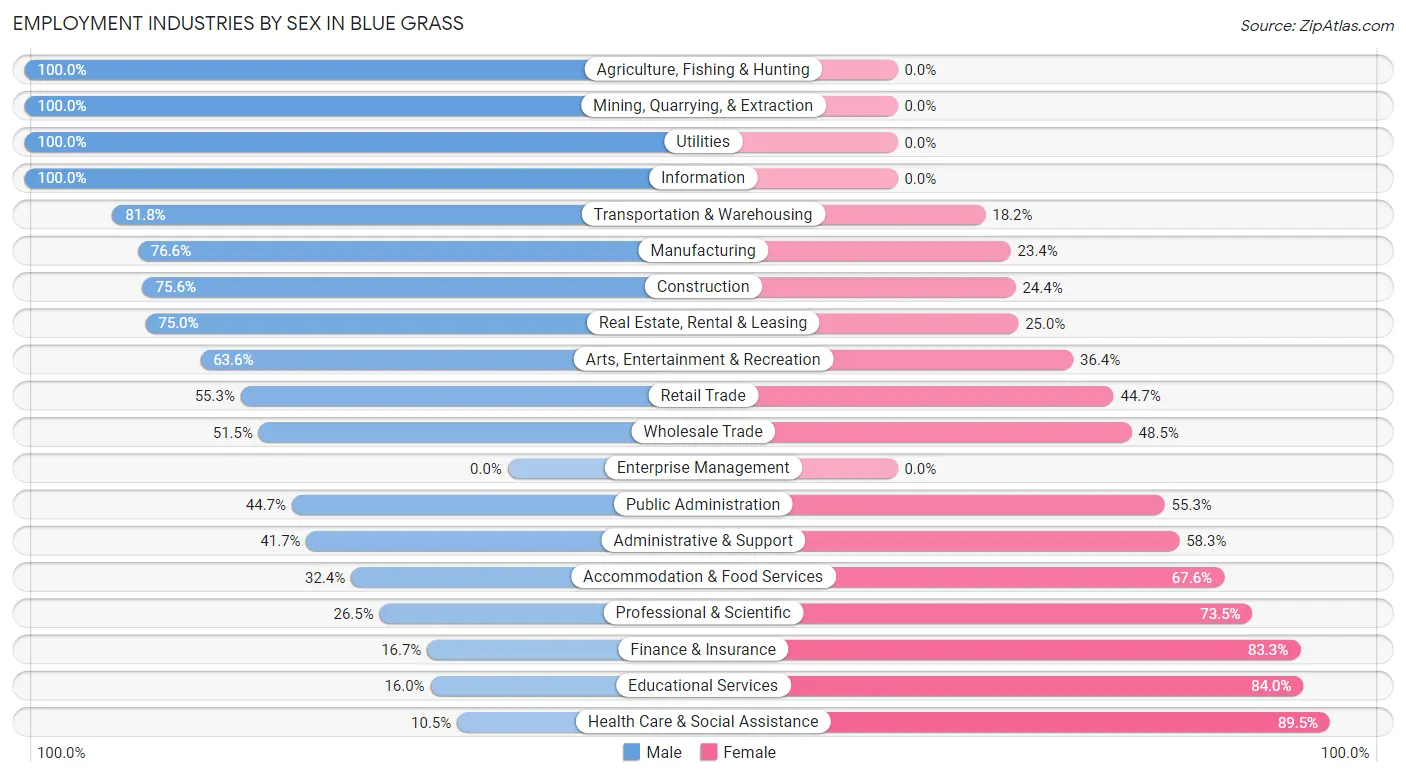
Employment Industries by Sex in Blue Grass
The Blue Grass industries that see more men than women are Agriculture, Fishing & Hunting (100.0%), Mining, Quarrying, & Extraction (100.0%), and Utilities (100.0%), whereas the industries that tend to have a higher number of women are Health Care & Social Assistance (89.5%), Educational Services (84.0%), and Finance & Insurance (83.3%).
| Industry | Male | Female |
| Agriculture, Fishing & Hunting | 3 (100.0%) | 0 (0.0%) |
| Mining, Quarrying, & Extraction | 14 (100.0%) | 0 (0.0%) |
| Construction | 34 (75.6%) | 11 (24.4%) |
| Manufacturing | 134 (76.6%) | 41 (23.4%) |
| Wholesale Trade | 17 (51.5%) | 16 (48.5%) |
| Retail Trade | 42 (55.3%) | 34 (44.7%) |
| Transportation & Warehousing | 18 (81.8%) | 4 (18.2%) |
| Utilities | 3 (100.0%) | 0 (0.0%) |
| Information | 5 (100.0%) | 0 (0.0%) |
| Finance & Insurance | 9 (16.7%) | 45 (83.3%) |
| Real Estate, Rental & Leasing | 9 (75.0%) | 3 (25.0%) |
| Professional & Scientific | 13 (26.5%) | 36 (73.5%) |
| Enterprise Management | 0 (0.0%) | 0 (0.0%) |
| Administrative & Support | 10 (41.7%) | 14 (58.3%) |
| Educational Services | 8 (16.0%) | 42 (84.0%) |
| Health Care & Social Assistance | 13 (10.5%) | 111 (89.5%) |
| Arts, Entertainment & Recreation | 7 (63.6%) | 4 (36.4%) |
| Accommodation & Food Services | 12 (32.4%) | 25 (67.6%) |
| Public Administration | 21 (44.7%) | 26 (55.3%) |
| Total | 396 (47.4%) | 440 (52.6%) |
Education in Blue Grass
School Enrollment in Blue Grass
The most common levels of schooling among the 376 students in Blue Grass are elementary school (104 | 27.7%), high school (85 | 22.6%), and middle school (68 | 18.1%).
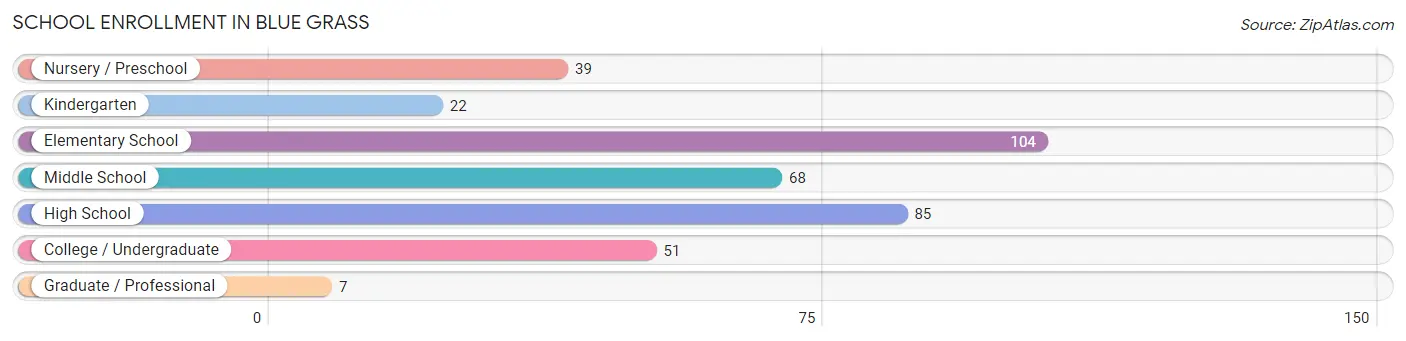
| School Level | # Students | % Students |
| Nursery / Preschool | 39 | 10.4% |
| Kindergarten | 22 | 5.9% |
| Elementary School | 104 | 27.7% |
| Middle School | 68 | 18.1% |
| High School | 85 | 22.6% |
| College / Undergraduate | 51 | 13.6% |
| Graduate / Professional | 7 | 1.9% |
| Total | 376 | 100.0% |
School Enrollment by Age by Funding Source in Blue Grass
Out of a total of 376 students who are enrolled in schools in Blue Grass, 60 (16.0%) attend a private institution, while the remaining 316 (84.0%) are enrolled in public schools. The age group of 20 to 24 year olds has the highest likelihood of being enrolled in private schools, with 22 (55.0% in the age bracket) enrolled. Conversely, the age group of 18 to 19 year olds has the lowest likelihood of being enrolled in a private school, with 7 (100.0% in the age bracket) attending a public institution.
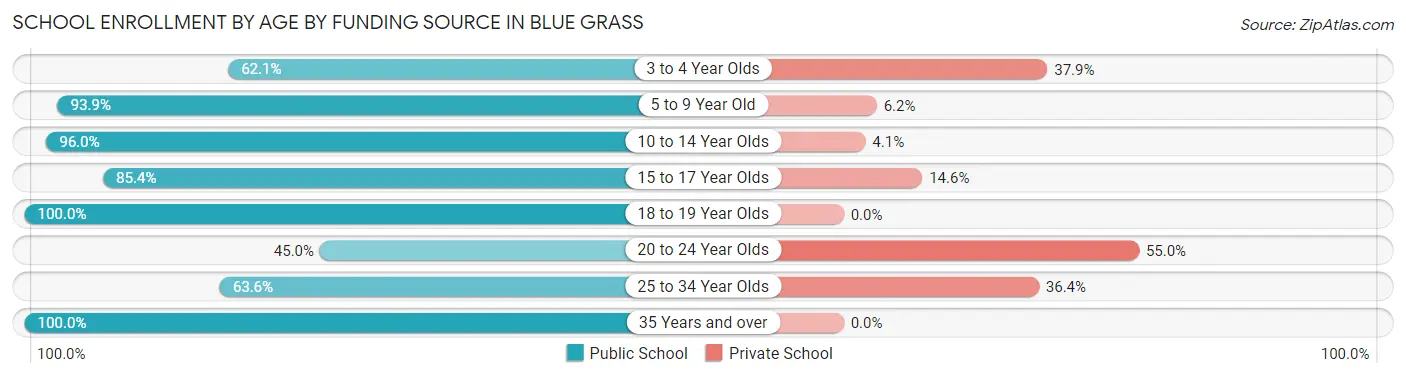
| Age Bracket | Public School | Private School |
| 3 to 4 Year Olds | 18 (62.1%) | 11 (37.9%) |
| 5 to 9 Year Old | 122 (93.9%) | 8 (6.1%) |
| 10 to 14 Year Olds | 71 (96.0%) | 3 (4.1%) |
| 15 to 17 Year Olds | 70 (85.4%) | 12 (14.6%) |
| 18 to 19 Year Olds | 7 (100.0%) | 0 (0.0%) |
| 20 to 24 Year Olds | 18 (45.0%) | 22 (55.0%) |
| 25 to 34 Year Olds | 7 (63.6%) | 4 (36.4%) |
| 35 Years and over | 3 (100.0%) | 0 (0.0%) |
| Total | 316 (84.0%) | 60 (16.0%) |
Educational Attainment by Field of Study in Blue Grass
Business (162 | 35.3%), education (92 | 20.0%), science & technology (50 | 10.9%), engineering (23 | 5.0%), and psychology (21 | 4.6%) are the most common fields of study among 459 individuals in Blue Grass who have obtained a bachelor's degree or higher.
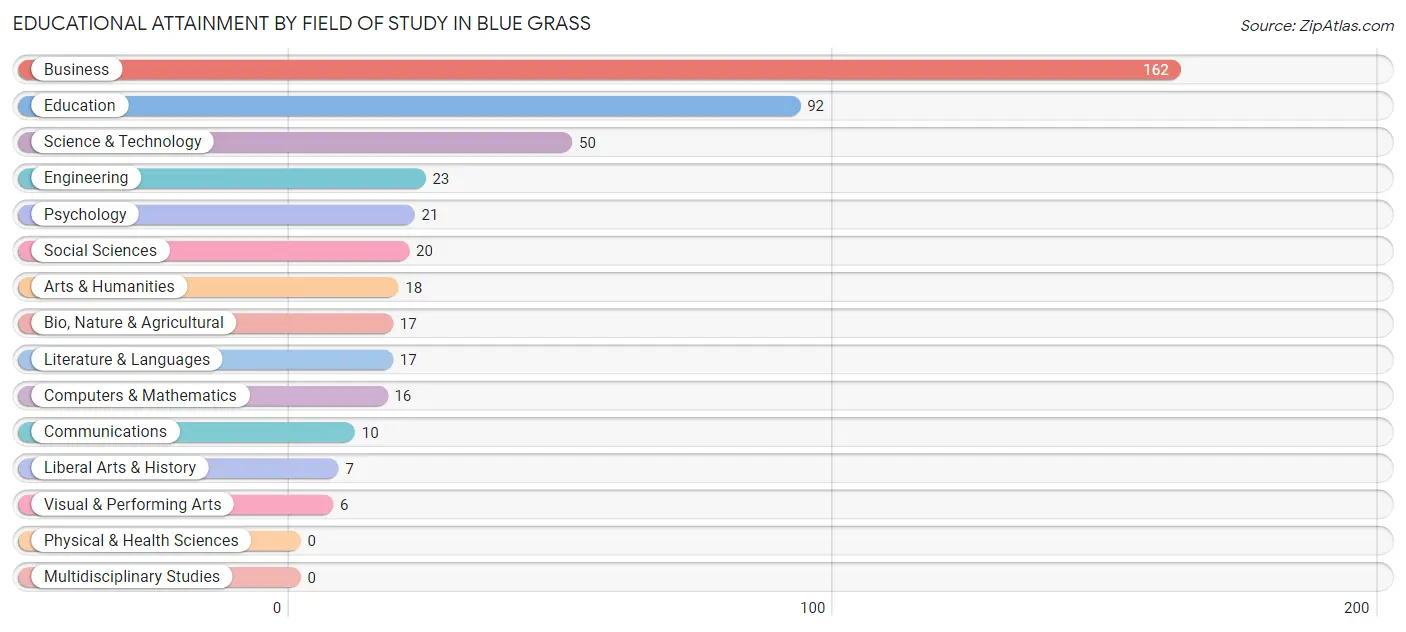
| Field of Study | # Graduates | % Graduates |
| Computers & Mathematics | 16 | 3.5% |
| Bio, Nature & Agricultural | 17 | 3.7% |
| Physical & Health Sciences | 0 | 0.0% |
| Psychology | 21 | 4.6% |
| Social Sciences | 20 | 4.4% |
| Engineering | 23 | 5.0% |
| Multidisciplinary Studies | 0 | 0.0% |
| Science & Technology | 50 | 10.9% |
| Business | 162 | 35.3% |
| Education | 92 | 20.0% |
| Literature & Languages | 17 | 3.7% |
| Liberal Arts & History | 7 | 1.5% |
| Visual & Performing Arts | 6 | 1.3% |
| Communications | 10 | 2.2% |
| Arts & Humanities | 18 | 3.9% |
| Total | 459 | 100.0% |
Transportation & Commute in Blue Grass
Vehicle Availability by Sex in Blue Grass
The most prevalent vehicle ownership categories in Blue Grass are males with 2 vehicles (168, accounting for 44.7%) and females with 2 vehicles (200, making up 38.4%).
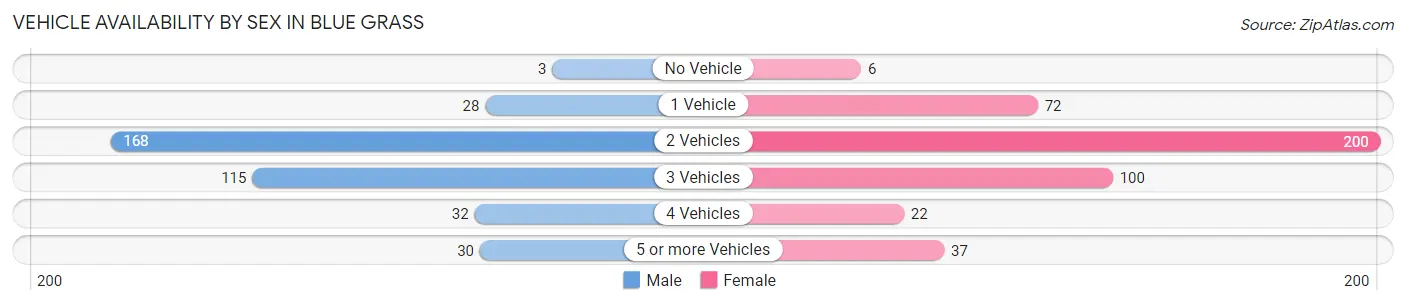
| Vehicles Available | Male | Female |
| No Vehicle | 3 (0.8%) | 6 (1.4%) |
| 1 Vehicle | 28 (7.4%) | 72 (16.5%) |
| 2 Vehicles | 168 (44.7%) | 200 (45.8%) |
| 3 Vehicles | 115 (30.6%) | 100 (22.9%) |
| 4 Vehicles | 32 (8.5%) | 22 (5.0%) |
| 5 or more Vehicles | 30 (8.0%) | 37 (8.5%) |
| Total | 376 (100.0%) | 437 (100.0%) |
Commute Time in Blue Grass
The most frequently occuring commute durations in Blue Grass are 20 to 24 minutes (180 commuters, 25.0%), 25 to 29 minutes (157 commuters, 21.8%), and 30 to 34 minutes (88 commuters, 12.2%).
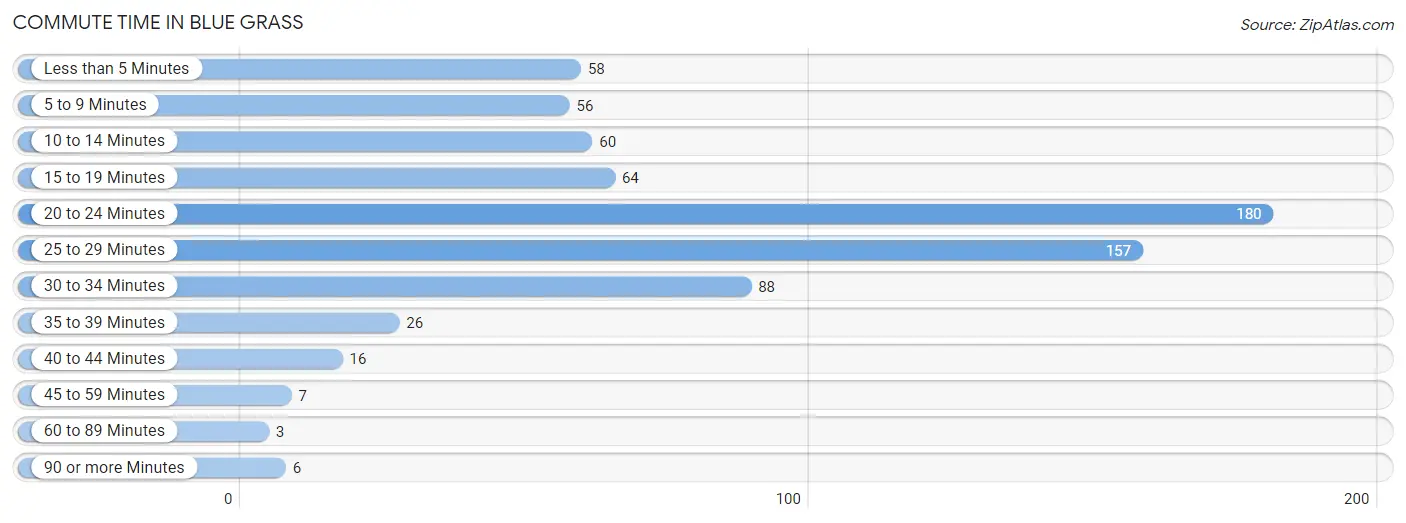
| Commute Time | # Commuters | % Commuters |
| Less than 5 Minutes | 58 | 8.0% |
| 5 to 9 Minutes | 56 | 7.8% |
| 10 to 14 Minutes | 60 | 8.3% |
| 15 to 19 Minutes | 64 | 8.9% |
| 20 to 24 Minutes | 180 | 25.0% |
| 25 to 29 Minutes | 157 | 21.8% |
| 30 to 34 Minutes | 88 | 12.2% |
| 35 to 39 Minutes | 26 | 3.6% |
| 40 to 44 Minutes | 16 | 2.2% |
| 45 to 59 Minutes | 7 | 1.0% |
| 60 to 89 Minutes | 3 | 0.4% |
| 90 or more Minutes | 6 | 0.8% |
Commute Time by Sex in Blue Grass
The most common commute times in Blue Grass are 20 to 24 minutes (114 commuters, 34.3%) for males and 25 to 29 minutes (100 commuters, 25.7%) for females.
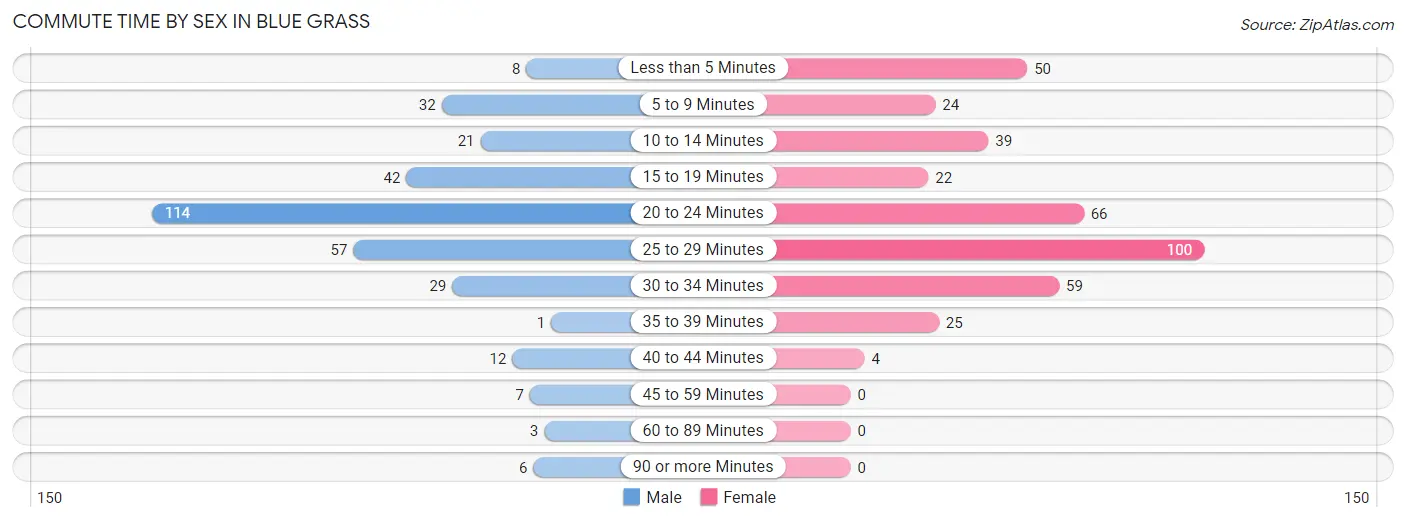
| Commute Time | Male | Female |
| Less than 5 Minutes | 8 (2.4%) | 50 (12.9%) |
| 5 to 9 Minutes | 32 (9.6%) | 24 (6.2%) |
| 10 to 14 Minutes | 21 (6.3%) | 39 (10.0%) |
| 15 to 19 Minutes | 42 (12.7%) | 22 (5.7%) |
| 20 to 24 Minutes | 114 (34.3%) | 66 (17.0%) |
| 25 to 29 Minutes | 57 (17.2%) | 100 (25.7%) |
| 30 to 34 Minutes | 29 (8.7%) | 59 (15.2%) |
| 35 to 39 Minutes | 1 (0.3%) | 25 (6.4%) |
| 40 to 44 Minutes | 12 (3.6%) | 4 (1.0%) |
| 45 to 59 Minutes | 7 (2.1%) | 0 (0.0%) |
| 60 to 89 Minutes | 3 (0.9%) | 0 (0.0%) |
| 90 or more Minutes | 6 (1.8%) | 0 (0.0%) |
Time of Departure to Work by Sex in Blue Grass
The most frequent times of departure to work in Blue Grass are 12:00 AM to 4:59 AM (59, 17.8%) for males and 7:00 AM to 7:29 AM (116, 29.8%) for females.
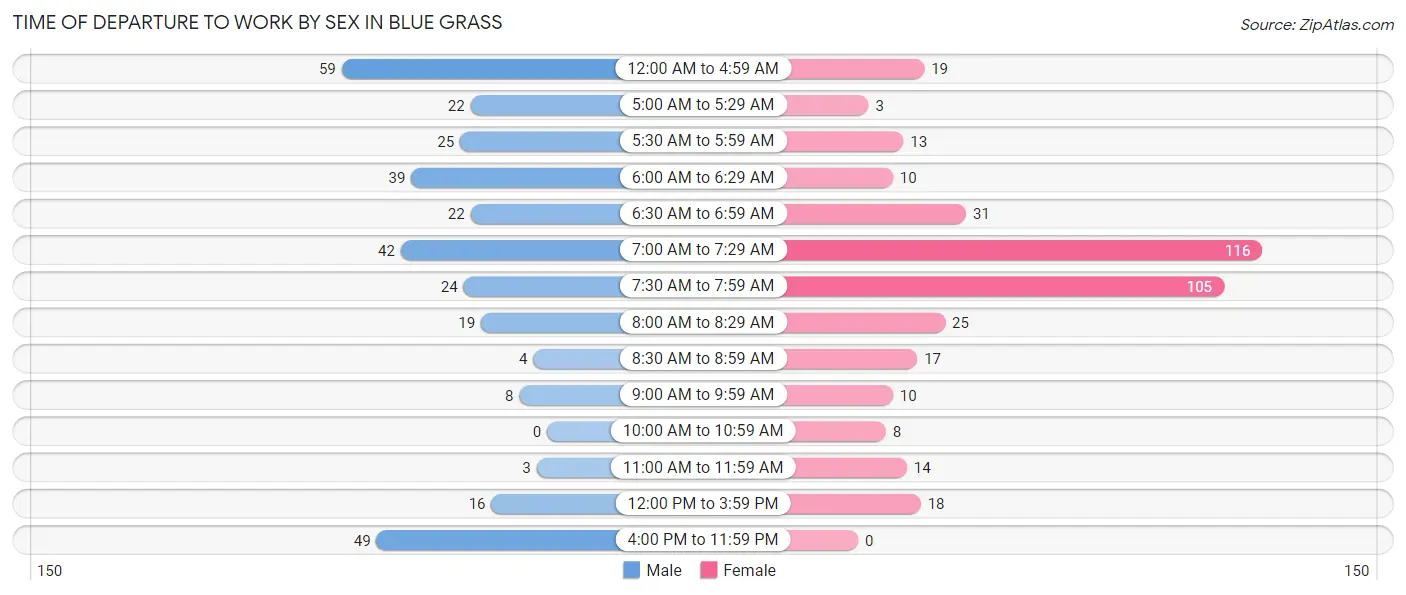
| Time of Departure | Male | Female |
| 12:00 AM to 4:59 AM | 59 (17.8%) | 19 (4.9%) |
| 5:00 AM to 5:29 AM | 22 (6.6%) | 3 (0.8%) |
| 5:30 AM to 5:59 AM | 25 (7.5%) | 13 (3.3%) |
| 6:00 AM to 6:29 AM | 39 (11.7%) | 10 (2.6%) |
| 6:30 AM to 6:59 AM | 22 (6.6%) | 31 (8.0%) |
| 7:00 AM to 7:29 AM | 42 (12.7%) | 116 (29.8%) |
| 7:30 AM to 7:59 AM | 24 (7.2%) | 105 (27.0%) |
| 8:00 AM to 8:29 AM | 19 (5.7%) | 25 (6.4%) |
| 8:30 AM to 8:59 AM | 4 (1.2%) | 17 (4.4%) |
| 9:00 AM to 9:59 AM | 8 (2.4%) | 10 (2.6%) |
| 10:00 AM to 10:59 AM | 0 (0.0%) | 8 (2.1%) |
| 11:00 AM to 11:59 AM | 3 (0.9%) | 14 (3.6%) |
| 12:00 PM to 3:59 PM | 16 (4.8%) | 18 (4.6%) |
| 4:00 PM to 11:59 PM | 49 (14.8%) | 0 (0.0%) |
| Total | 332 (100.0%) | 389 (100.0%) |
Housing Occupancy in Blue Grass
Occupancy by Ownership in Blue Grass
Of the total 831 dwellings in Blue Grass, owner-occupied units account for 692 (83.3%), while renter-occupied units make up 139 (16.7%).
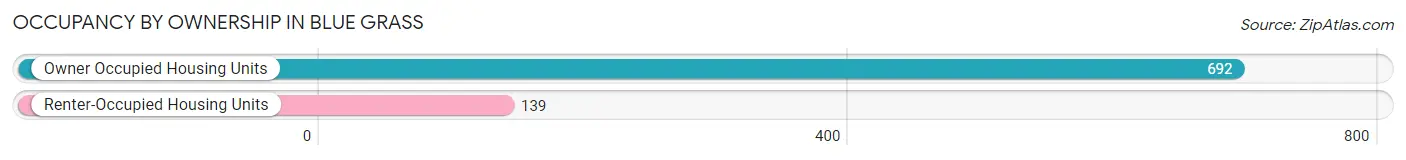
| Occupancy | # Housing Units | % Housing Units |
| Owner Occupied Housing Units | 692 | 83.3% |
| Renter-Occupied Housing Units | 139 | 16.7% |
| Total Occupied Housing Units | 831 | 100.0% |
Occupancy by Household Size in Blue Grass
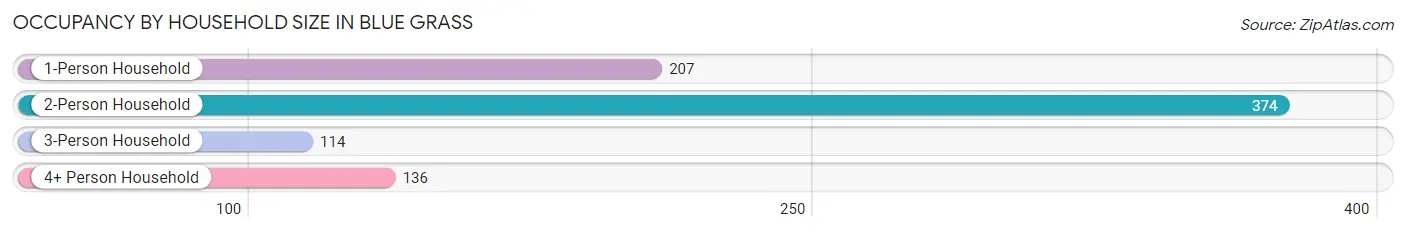
| Household Size | # Housing Units | % Housing Units |
| 1-Person Household | 207 | 24.9% |
| 2-Person Household | 374 | 45.0% |
| 3-Person Household | 114 | 13.7% |
| 4+ Person Household | 136 | 16.4% |
| Total Housing Units | 831 | 100.0% |
Occupancy by Ownership by Household Size in Blue Grass
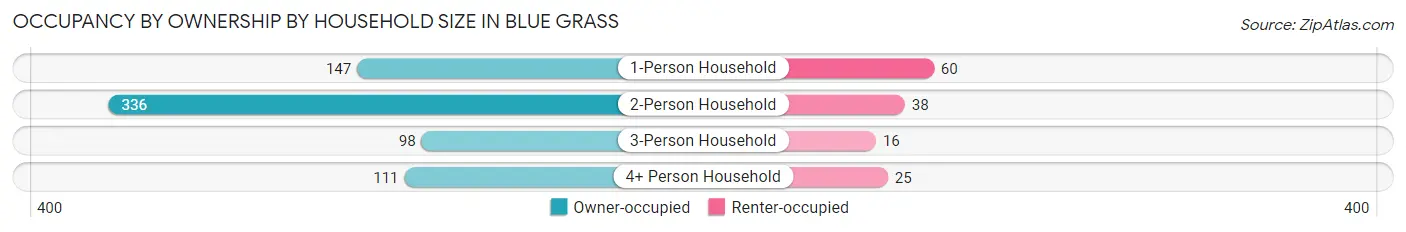
| Household Size | Owner-occupied | Renter-occupied |
| 1-Person Household | 147 (71.0%) | 60 (29.0%) |
| 2-Person Household | 336 (89.8%) | 38 (10.2%) |
| 3-Person Household | 98 (86.0%) | 16 (14.0%) |
| 4+ Person Household | 111 (81.6%) | 25 (18.4%) |
| Total Housing Units | 692 (83.3%) | 139 (16.7%) |
Occupancy by Educational Attainment in Blue Grass
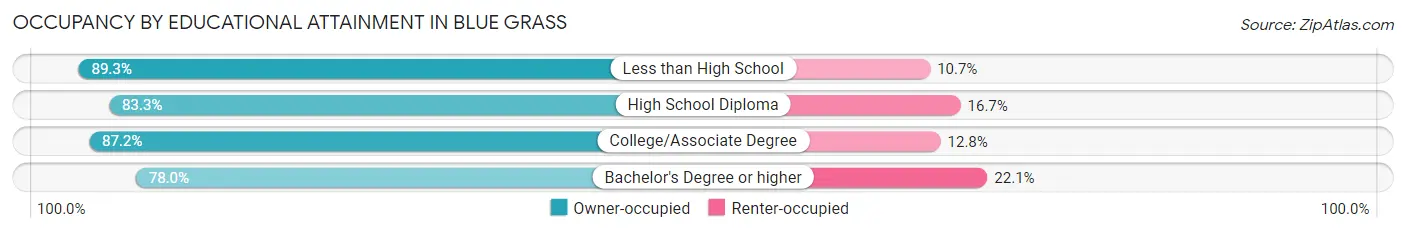
| Household Size | Owner-occupied | Renter-occupied |
| Less than High School | 25 (89.3%) | 3 (10.7%) |
| High School Diploma | 189 (83.3%) | 38 (16.7%) |
| College/Associate Degree | 273 (87.2%) | 40 (12.8%) |
| Bachelor's Degree or higher | 205 (77.9%) | 58 (22.1%) |
Occupancy by Age of Householder in Blue Grass
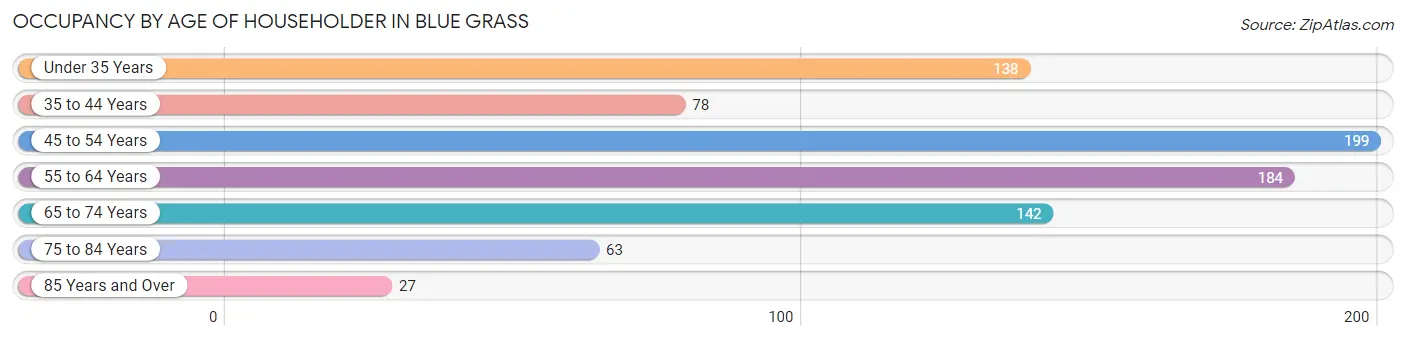
| Age Bracket | # Households | % Households |
| Under 35 Years | 138 | 16.6% |
| 35 to 44 Years | 78 | 9.4% |
| 45 to 54 Years | 199 | 23.9% |
| 55 to 64 Years | 184 | 22.1% |
| 65 to 74 Years | 142 | 17.1% |
| 75 to 84 Years | 63 | 7.6% |
| 85 Years and Over | 27 | 3.3% |
| Total | 831 | 100.0% |
Housing Finances in Blue Grass
Median Income by Occupancy in Blue Grass
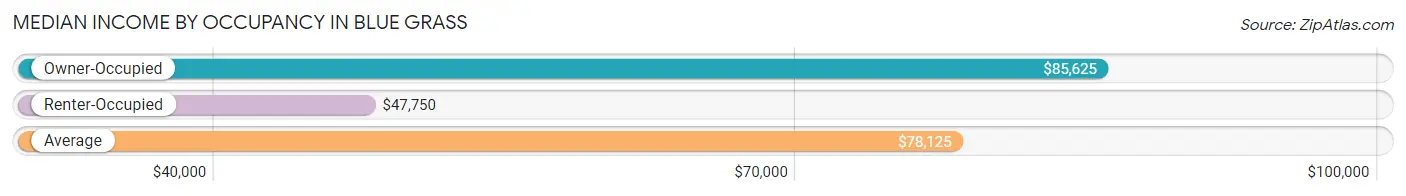
| Occupancy Type | # Households | Median Income |
| Owner-Occupied | 692 (83.3%) | $85,625 |
| Renter-Occupied | 139 (16.7%) | $47,750 |
| Average | 831 (100.0%) | $78,125 |
Occupancy by Householder Income Bracket in Blue Grass
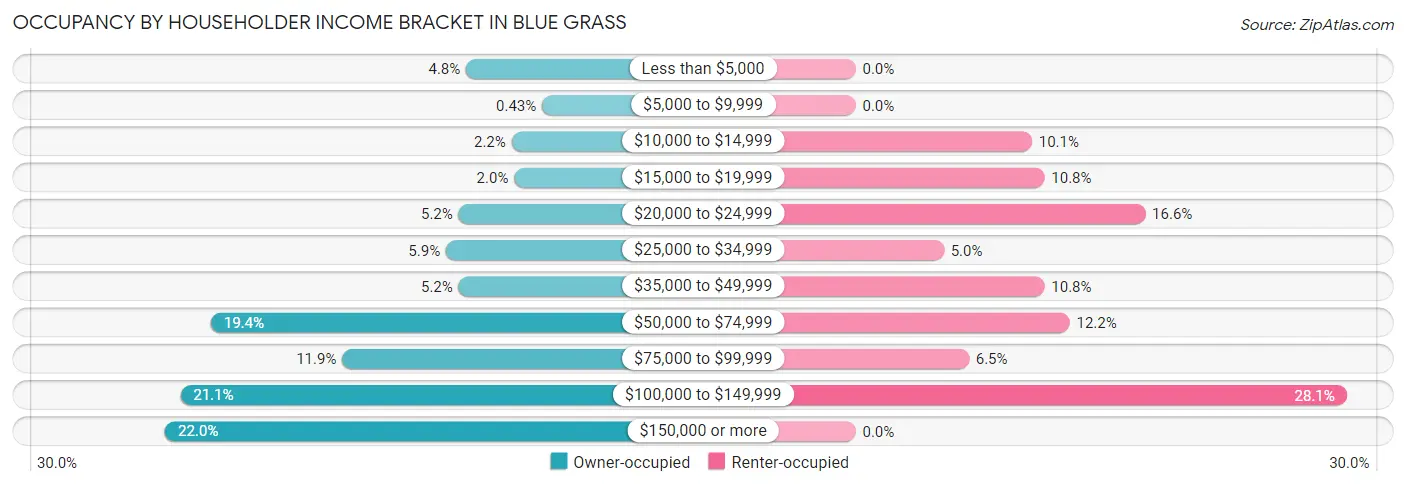
| Income Bracket | Owner-occupied | Renter-occupied |
| Less than $5,000 | 33 (4.8%) | 0 (0.0%) |
| $5,000 to $9,999 | 3 (0.4%) | 0 (0.0%) |
| $10,000 to $14,999 | 15 (2.2%) | 14 (10.1%) |
| $15,000 to $19,999 | 14 (2.0%) | 15 (10.8%) |
| $20,000 to $24,999 | 36 (5.2%) | 23 (16.6%) |
| $25,000 to $34,999 | 41 (5.9%) | 7 (5.0%) |
| $35,000 to $49,999 | 36 (5.2%) | 15 (10.8%) |
| $50,000 to $74,999 | 134 (19.4%) | 17 (12.2%) |
| $75,000 to $99,999 | 82 (11.8%) | 9 (6.5%) |
| $100,000 to $149,999 | 146 (21.1%) | 39 (28.1%) |
| $150,000 or more | 152 (22.0%) | 0 (0.0%) |
| Total | 692 (100.0%) | 139 (100.0%) |
Monthly Housing Cost Tiers in Blue Grass
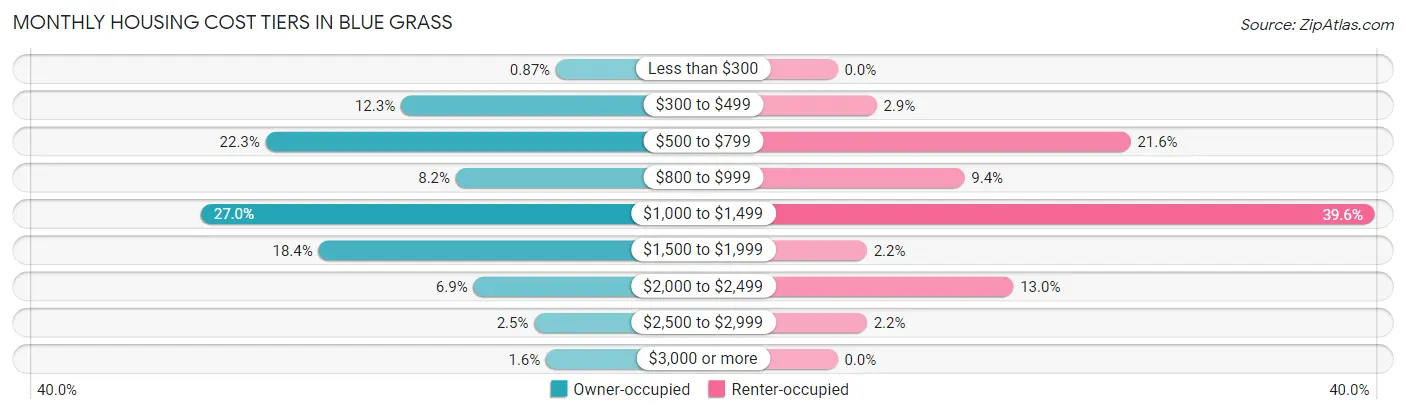
| Monthly Cost | Owner-occupied | Renter-occupied |
| Less than $300 | 6 (0.9%) | 0 (0.0%) |
| $300 to $499 | 85 (12.3%) | 4 (2.9%) |
| $500 to $799 | 154 (22.3%) | 30 (21.6%) |
| $800 to $999 | 57 (8.2%) | 13 (9.3%) |
| $1,000 to $1,499 | 187 (27.0%) | 55 (39.6%) |
| $1,500 to $1,999 | 127 (18.3%) | 3 (2.2%) |
| $2,000 to $2,499 | 48 (6.9%) | 18 (13.0%) |
| $2,500 to $2,999 | 17 (2.5%) | 3 (2.2%) |
| $3,000 or more | 11 (1.6%) | 0 (0.0%) |
| Total | 692 (100.0%) | 139 (100.0%) |
Physical Housing Characteristics in Blue Grass
Housing Structures in Blue Grass
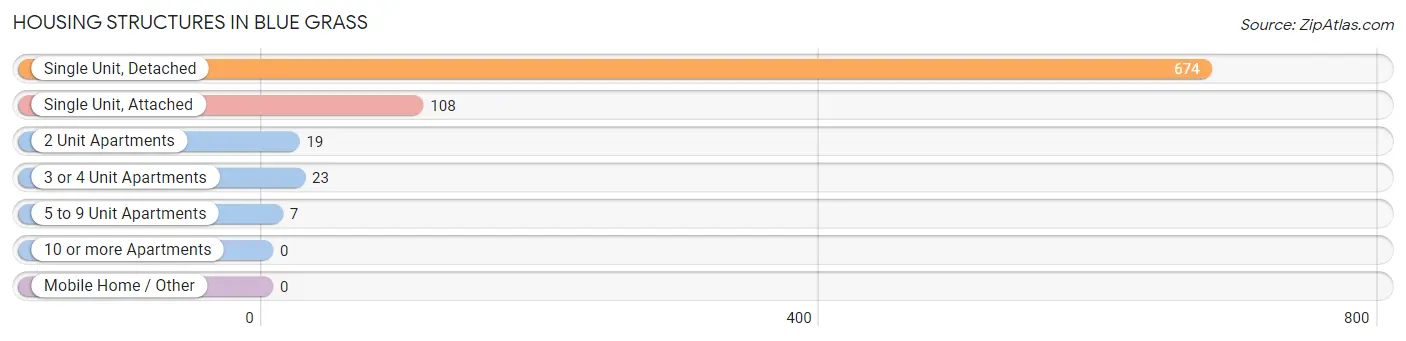
| Structure Type | # Housing Units | % Housing Units |
| Single Unit, Detached | 674 | 81.1% |
| Single Unit, Attached | 108 | 13.0% |
| 2 Unit Apartments | 19 | 2.3% |
| 3 or 4 Unit Apartments | 23 | 2.8% |
| 5 to 9 Unit Apartments | 7 | 0.8% |
| 10 or more Apartments | 0 | 0.0% |
| Mobile Home / Other | 0 | 0.0% |
| Total | 831 | 100.0% |
Housing Structures by Occupancy in Blue Grass
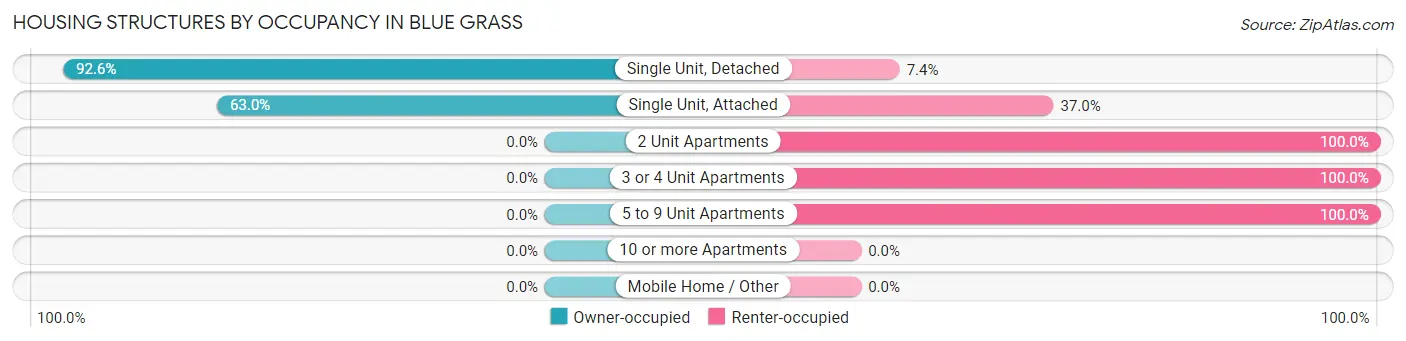
| Structure Type | Owner-occupied | Renter-occupied |
| Single Unit, Detached | 624 (92.6%) | 50 (7.4%) |
| Single Unit, Attached | 68 (63.0%) | 40 (37.0%) |
| 2 Unit Apartments | 0 (0.0%) | 19 (100.0%) |
| 3 or 4 Unit Apartments | 0 (0.0%) | 23 (100.0%) |
| 5 to 9 Unit Apartments | 0 (0.0%) | 7 (100.0%) |
| 10 or more Apartments | 0 (0.0%) | 0 (0.0%) |
| Mobile Home / Other | 0 (0.0%) | 0 (0.0%) |
| Total | 692 (83.3%) | 139 (16.7%) |
Housing Structures by Number of Rooms in Blue Grass
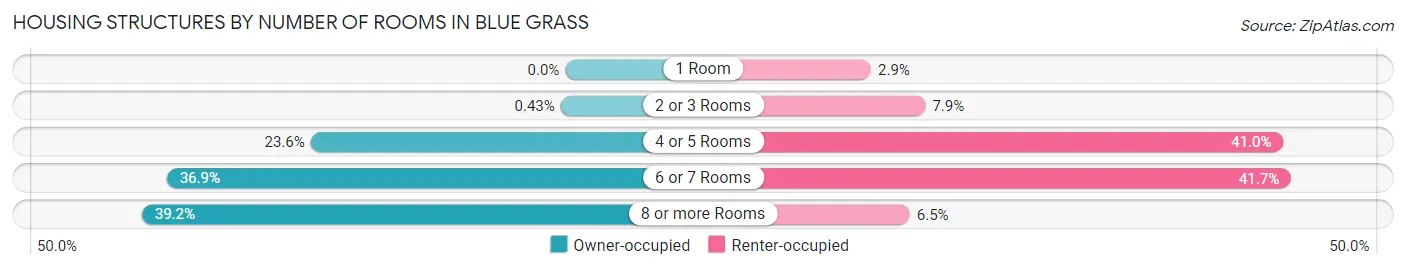
| Number of Rooms | Owner-occupied | Renter-occupied |
| 1 Room | 0 (0.0%) | 4 (2.9%) |
| 2 or 3 Rooms | 3 (0.4%) | 11 (7.9%) |
| 4 or 5 Rooms | 163 (23.5%) | 57 (41.0%) |
| 6 or 7 Rooms | 255 (36.8%) | 58 (41.7%) |
| 8 or more Rooms | 271 (39.2%) | 9 (6.5%) |
| Total | 692 (100.0%) | 139 (100.0%) |
Housing Structure by Heating Type in Blue Grass
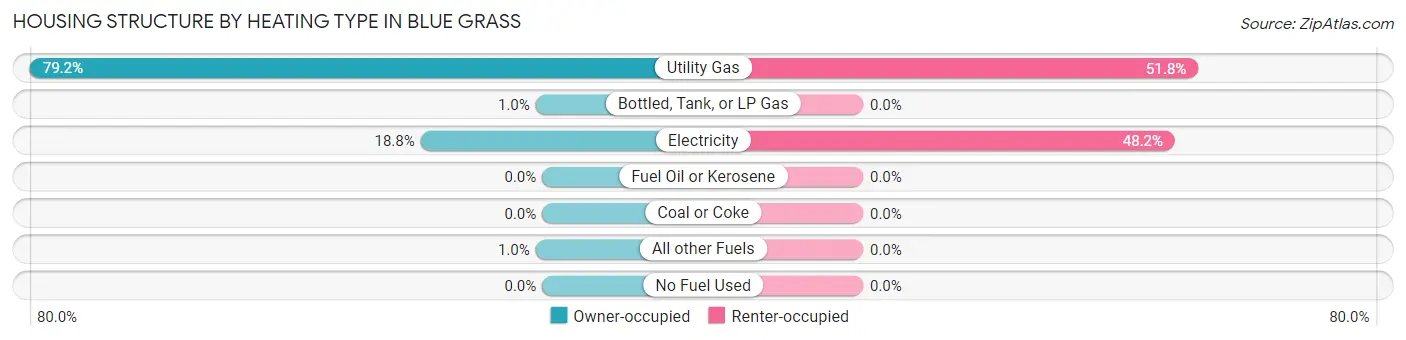
| Heating Type | Owner-occupied | Renter-occupied |
| Utility Gas | 548 (79.2%) | 72 (51.8%) |
| Bottled, Tank, or LP Gas | 7 (1.0%) | 0 (0.0%) |
| Electricity | 130 (18.8%) | 67 (48.2%) |
| Fuel Oil or Kerosene | 0 (0.0%) | 0 (0.0%) |
| Coal or Coke | 0 (0.0%) | 0 (0.0%) |
| All other Fuels | 7 (1.0%) | 0 (0.0%) |
| No Fuel Used | 0 (0.0%) | 0 (0.0%) |
| Total | 692 (100.0%) | 139 (100.0%) |
Household Vehicle Usage in Blue Grass
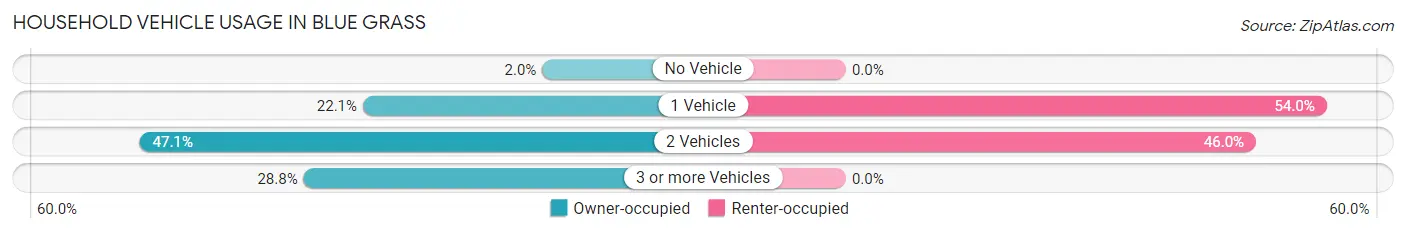
| Vehicles per Household | Owner-occupied | Renter-occupied |
| No Vehicle | 14 (2.0%) | 0 (0.0%) |
| 1 Vehicle | 153 (22.1%) | 75 (54.0%) |
| 2 Vehicles | 326 (47.1%) | 64 (46.0%) |
| 3 or more Vehicles | 199 (28.8%) | 0 (0.0%) |
| Total | 692 (100.0%) | 139 (100.0%) |
Real Estate & Mortgages in Blue Grass
Real Estate and Mortgage Overview in Blue Grass
| Characteristic | Without Mortgage | With Mortgage |
| Housing Units | 281 | 411 |
| Median Property Value | $187,200 | $205,100 |
| Median Household Income | $64,408 | $89 |
| Monthly Housing Costs | $596 | $11 |
| Real Estate Taxes | $2,929 | $18 |
Property Value by Mortgage Status in Blue Grass
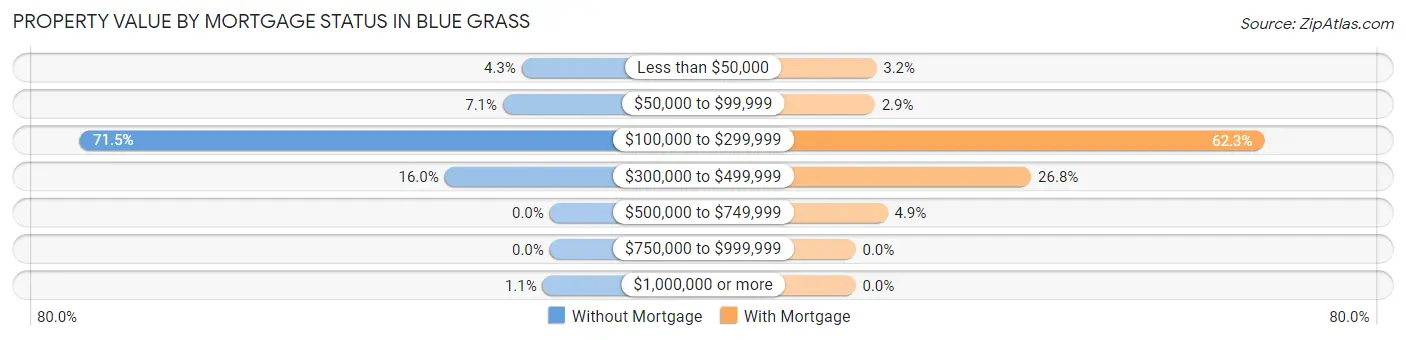
| Property Value | Without Mortgage | With Mortgage |
| Less than $50,000 | 12 (4.3%) | 13 (3.2%) |
| $50,000 to $99,999 | 20 (7.1%) | 12 (2.9%) |
| $100,000 to $299,999 | 201 (71.5%) | 256 (62.3%) |
| $300,000 to $499,999 | 45 (16.0%) | 110 (26.8%) |
| $500,000 to $749,999 | 0 (0.0%) | 20 (4.9%) |
| $750,000 to $999,999 | 0 (0.0%) | 0 (0.0%) |
| $1,000,000 or more | 3 (1.1%) | 0 (0.0%) |
| Total | 281 (100.0%) | 411 (100.0%) |
Household Income by Mortgage Status in Blue Grass
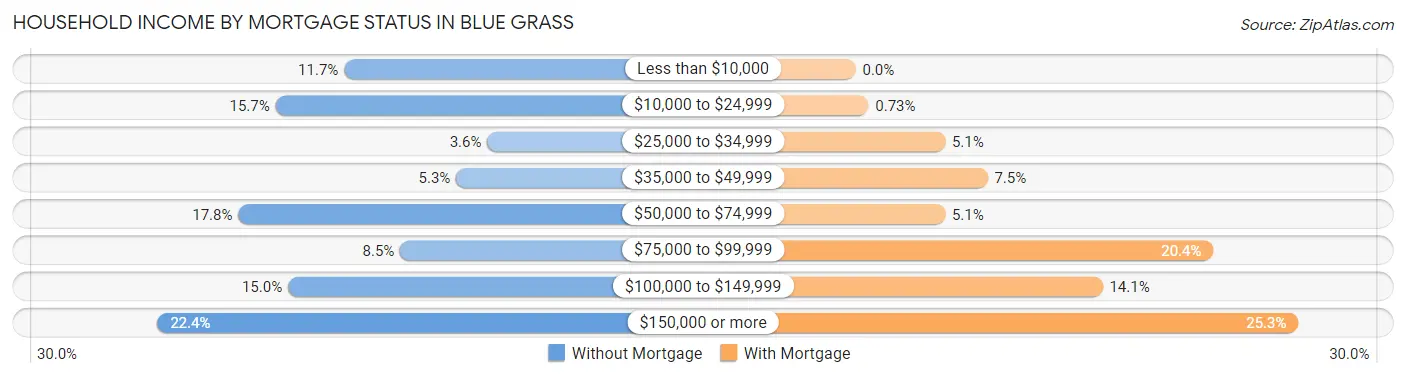
| Household Income | Without Mortgage | With Mortgage |
| Less than $10,000 | 33 (11.7%) | 0 (0.0%) |
| $10,000 to $24,999 | 44 (15.7%) | 3 (0.7%) |
| $25,000 to $34,999 | 10 (3.6%) | 21 (5.1%) |
| $35,000 to $49,999 | 15 (5.3%) | 31 (7.5%) |
| $50,000 to $74,999 | 50 (17.8%) | 21 (5.1%) |
| $75,000 to $99,999 | 24 (8.5%) | 84 (20.4%) |
| $100,000 to $149,999 | 42 (14.9%) | 58 (14.1%) |
| $150,000 or more | 63 (22.4%) | 104 (25.3%) |
| Total | 281 (100.0%) | 411 (100.0%) |
Property Value to Household Income Ratio in Blue Grass
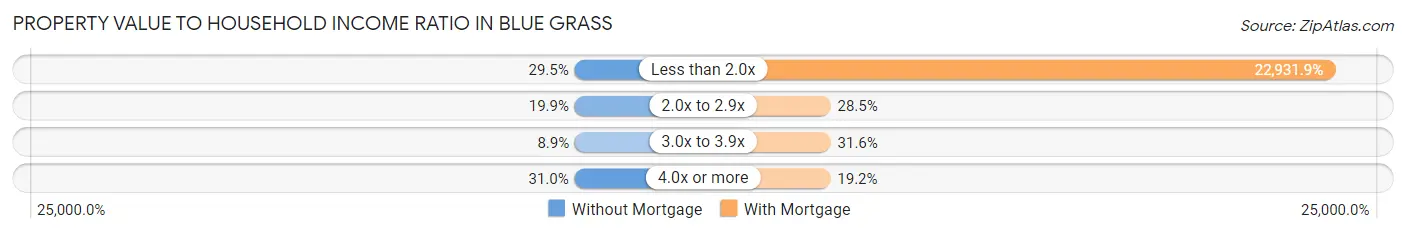
| Value-to-Income Ratio | Without Mortgage | With Mortgage |
| Less than 2.0x | 83 (29.5%) | 94,250 (22,931.9%) |
| 2.0x to 2.9x | 56 (19.9%) | 117 (28.5%) |
| 3.0x to 3.9x | 25 (8.9%) | 130 (31.6%) |
| 4.0x or more | 87 (31.0%) | 79 (19.2%) |
| Total | 281 (100.0%) | 411 (100.0%) |
Real Estate Taxes by Mortgage Status in Blue Grass
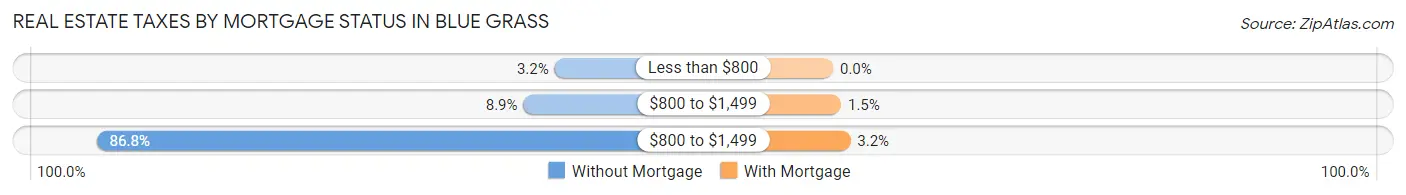
| Property Taxes | Without Mortgage | With Mortgage |
| Less than $800 | 9 (3.2%) | 0 (0.0%) |
| $800 to $1,499 | 25 (8.9%) | 6 (1.5%) |
| $800 to $1,499 | 244 (86.8%) | 13 (3.2%) |
| Total | 281 (100.0%) | 411 (100.0%) |
Health & Disability in Blue Grass
Health Insurance Coverage by Age in Blue Grass
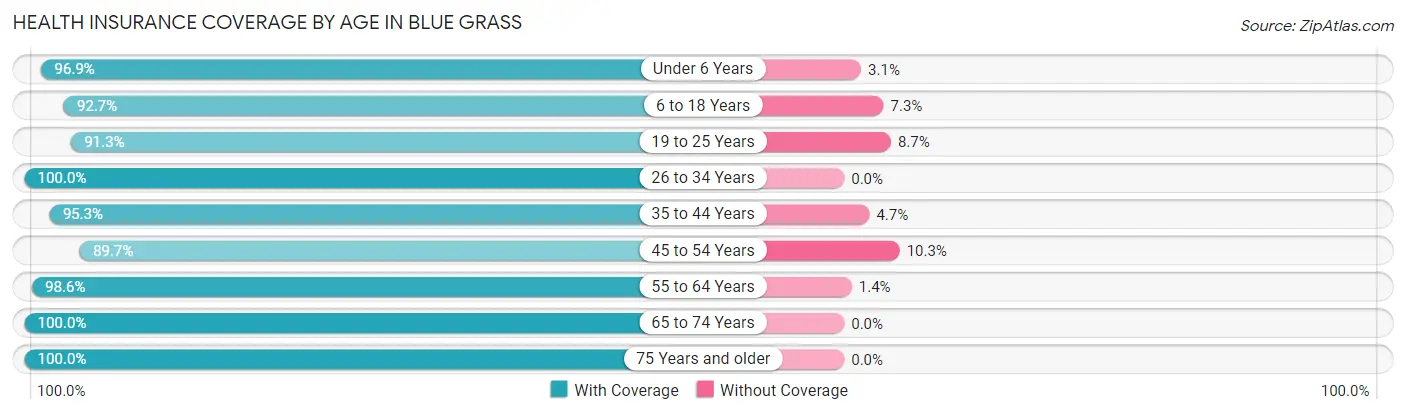
| Age Bracket | With Coverage | Without Coverage |
| Under 6 Years | 154 (96.9%) | 5 (3.1%) |
| 6 to 18 Years | 253 (92.7%) | 20 (7.3%) |
| 19 to 25 Years | 105 (91.3%) | 10 (8.7%) |
| 26 to 34 Years | 191 (100.0%) | 0 (0.0%) |
| 35 to 44 Years | 183 (95.3%) | 9 (4.7%) |
| 45 to 54 Years | 243 (89.7%) | 28 (10.3%) |
| 55 to 64 Years | 280 (98.6%) | 4 (1.4%) |
| 65 to 74 Years | 245 (100.0%) | 0 (0.0%) |
| 75 Years and older | 139 (100.0%) | 0 (0.0%) |
| Total | 1,793 (95.9%) | 76 (4.1%) |
Health Insurance Coverage by Citizenship Status in Blue Grass
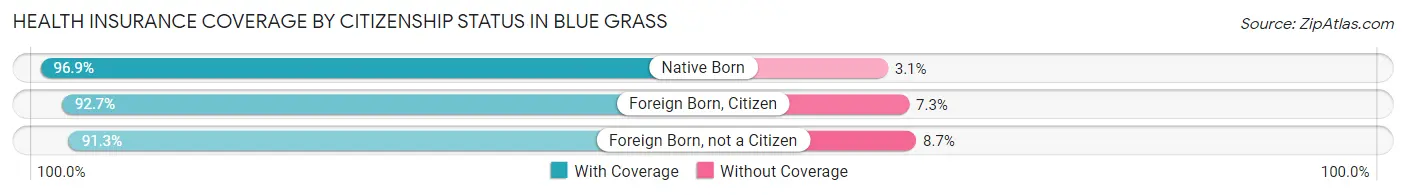
| Citizenship Status | With Coverage | Without Coverage |
| Native Born | 154 (96.9%) | 5 (3.1%) |
| Foreign Born, Citizen | 253 (92.7%) | 20 (7.3%) |
| Foreign Born, not a Citizen | 105 (91.3%) | 10 (8.7%) |
Health Insurance Coverage by Household Income in Blue Grass
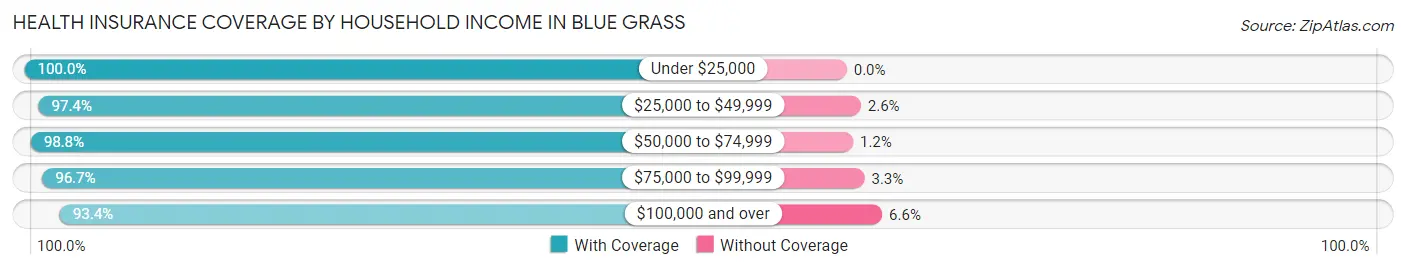
| Household Income | With Coverage | Without Coverage |
| Under $25,000 | 206 (100.0%) | 0 (0.0%) |
| $25,000 to $49,999 | 185 (97.4%) | 5 (2.6%) |
| $50,000 to $74,999 | 337 (98.8%) | 4 (1.2%) |
| $75,000 to $99,999 | 233 (96.7%) | 8 (3.3%) |
| $100,000 and over | 832 (93.4%) | 59 (6.6%) |
Public vs Private Health Insurance Coverage by Age in Blue Grass
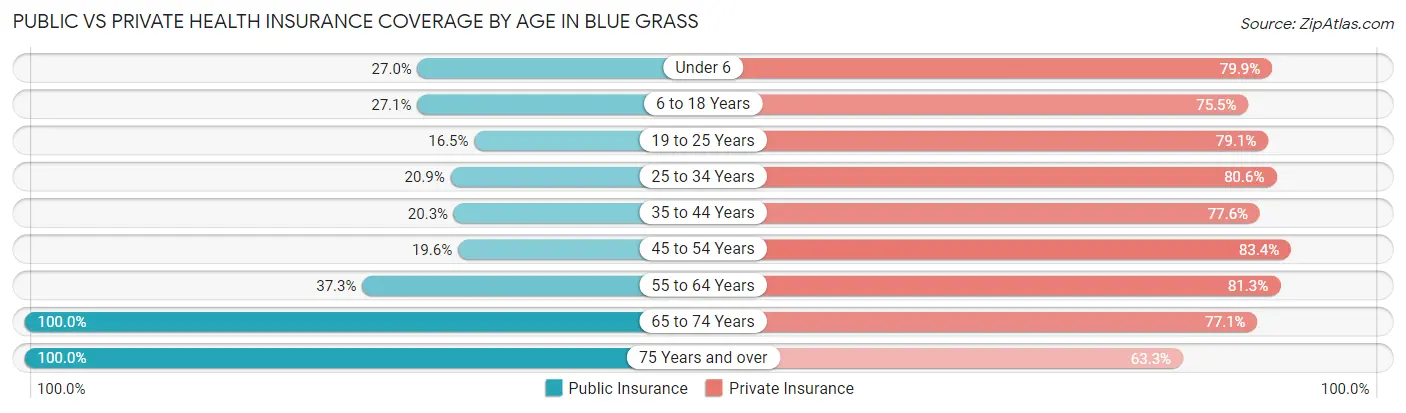
| Age Bracket | Public Insurance | Private Insurance |
| Under 6 | 43 (27.0%) | 127 (79.9%) |
| 6 to 18 Years | 74 (27.1%) | 206 (75.5%) |
| 19 to 25 Years | 19 (16.5%) | 91 (79.1%) |
| 25 to 34 Years | 40 (20.9%) | 154 (80.6%) |
| 35 to 44 Years | 39 (20.3%) | 149 (77.6%) |
| 45 to 54 Years | 53 (19.6%) | 226 (83.4%) |
| 55 to 64 Years | 106 (37.3%) | 231 (81.3%) |
| 65 to 74 Years | 245 (100.0%) | 189 (77.1%) |
| 75 Years and over | 139 (100.0%) | 88 (63.3%) |
| Total | 758 (40.6%) | 1,461 (78.2%) |
Disability Status by Sex by Age in Blue Grass
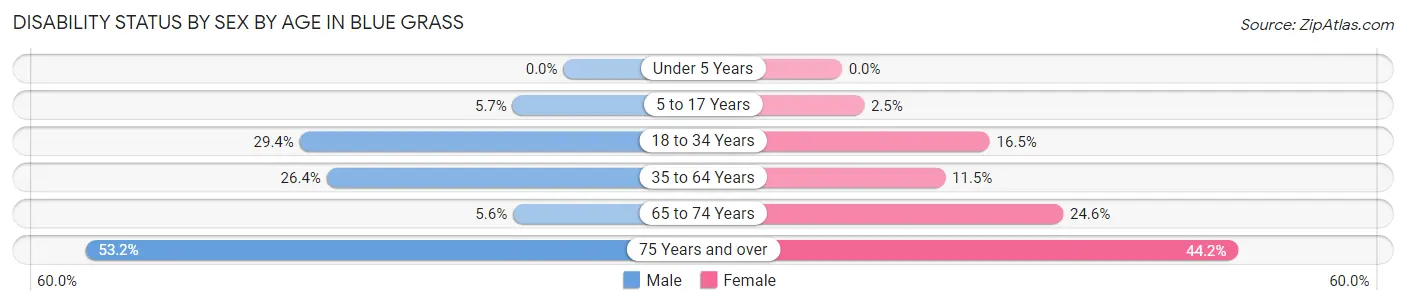
| Age Bracket | Male | Female |
| Under 5 Years | 0 (0.0%) | 0 (0.0%) |
| 5 to 17 Years | 7 (5.7%) | 4 (2.5%) |
| 18 to 34 Years | 42 (29.4%) | 28 (16.5%) |
| 35 to 64 Years | 87 (26.4%) | 48 (11.5%) |
| 65 to 74 Years | 6 (5.6%) | 34 (24.6%) |
| 75 Years and over | 33 (53.2%) | 34 (44.2%) |
Disability Class by Sex by Age in Blue Grass
Disability Class: Hearing Difficulty
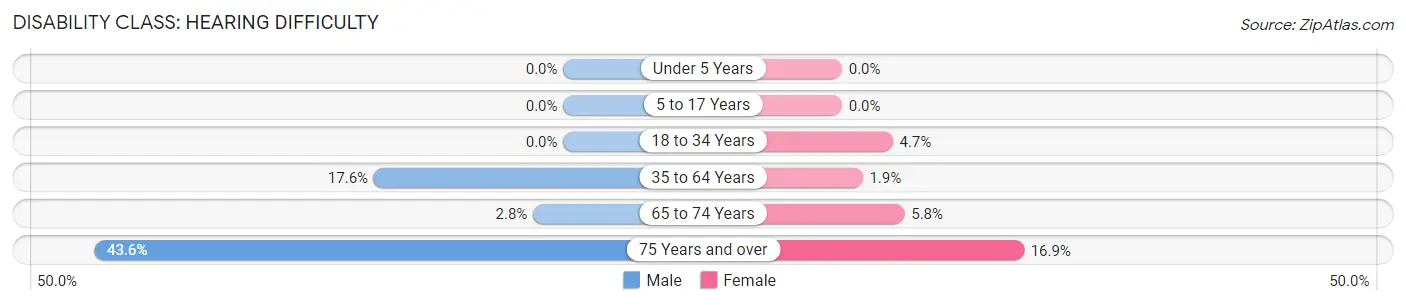
| Age Bracket | Male | Female |
| Under 5 Years | 0 (0.0%) | 0 (0.0%) |
| 5 to 17 Years | 0 (0.0%) | 0 (0.0%) |
| 18 to 34 Years | 0 (0.0%) | 8 (4.7%) |
| 35 to 64 Years | 58 (17.6%) | 8 (1.9%) |
| 65 to 74 Years | 3 (2.8%) | 8 (5.8%) |
| 75 Years and over | 27 (43.5%) | 13 (16.9%) |
Disability Class: Vision Difficulty
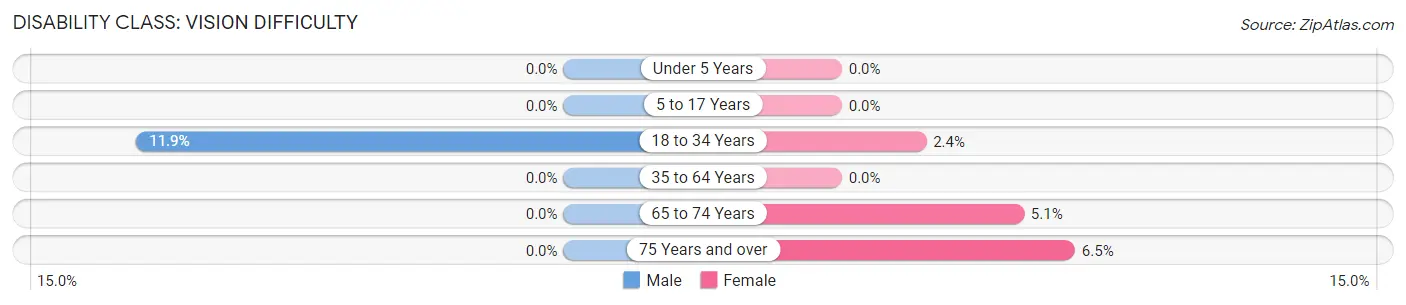
| Age Bracket | Male | Female |
| Under 5 Years | 0 (0.0%) | 0 (0.0%) |
| 5 to 17 Years | 0 (0.0%) | 0 (0.0%) |
| 18 to 34 Years | 17 (11.9%) | 4 (2.4%) |
| 35 to 64 Years | 0 (0.0%) | 0 (0.0%) |
| 65 to 74 Years | 0 (0.0%) | 7 (5.1%) |
| 75 Years and over | 0 (0.0%) | 5 (6.5%) |
Disability Class: Cognitive Difficulty
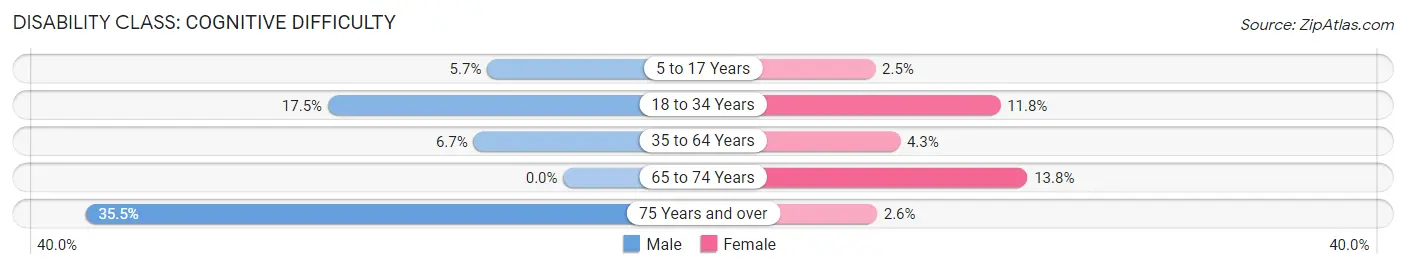
| Age Bracket | Male | Female |
| 5 to 17 Years | 7 (5.7%) | 4 (2.5%) |
| 18 to 34 Years | 25 (17.5%) | 20 (11.8%) |
| 35 to 64 Years | 22 (6.7%) | 18 (4.3%) |
| 65 to 74 Years | 0 (0.0%) | 19 (13.8%) |
| 75 Years and over | 22 (35.5%) | 2 (2.6%) |
Disability Class: Ambulatory Difficulty
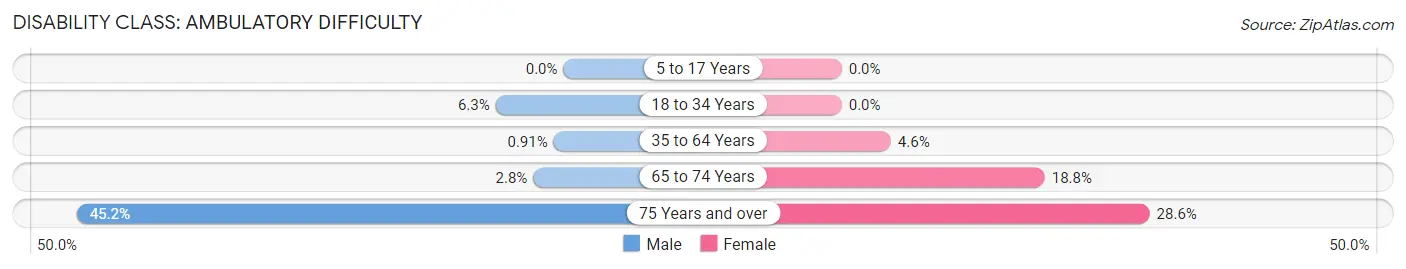
| Age Bracket | Male | Female |
| 5 to 17 Years | 0 (0.0%) | 0 (0.0%) |
| 18 to 34 Years | 9 (6.3%) | 0 (0.0%) |
| 35 to 64 Years | 3 (0.9%) | 19 (4.6%) |
| 65 to 74 Years | 3 (2.8%) | 26 (18.8%) |
| 75 Years and over | 28 (45.2%) | 22 (28.6%) |
Disability Class: Self-Care Difficulty
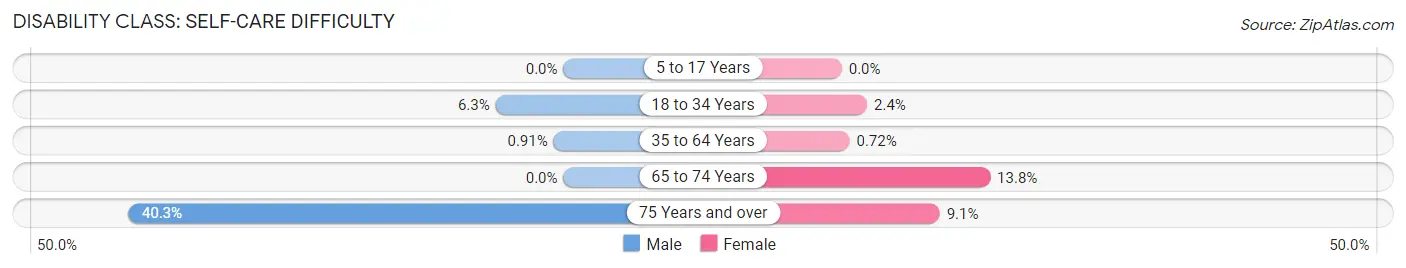
| Age Bracket | Male | Female |
| 5 to 17 Years | 0 (0.0%) | 0 (0.0%) |
| 18 to 34 Years | 9 (6.3%) | 4 (2.4%) |
| 35 to 64 Years | 3 (0.9%) | 3 (0.7%) |
| 65 to 74 Years | 0 (0.0%) | 19 (13.8%) |
| 75 Years and over | 25 (40.3%) | 7 (9.1%) |
Technology Access in Blue Grass
Computing Device Access in Blue Grass
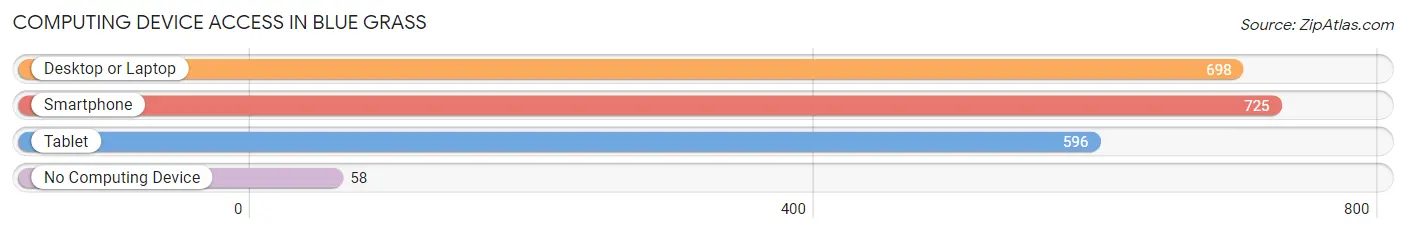
| Device Type | # Households | % Households |
| Desktop or Laptop | 698 | 84.0% |
| Smartphone | 725 | 87.2% |
| Tablet | 596 | 71.7% |
| No Computing Device | 58 | 7.0% |
| Total | 831 | 100.0% |
Internet Access in Blue Grass
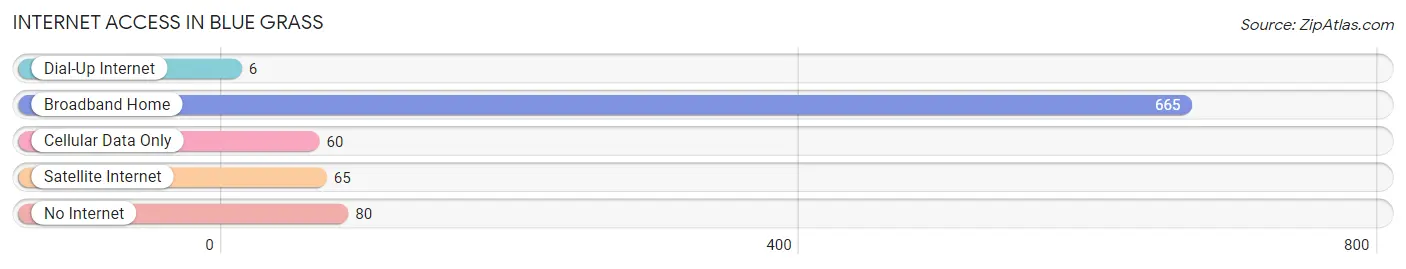
| Internet Type | # Households | % Households |
| Dial-Up Internet | 6 | 0.7% |
| Broadband Home | 665 | 80.0% |
| Cellular Data Only | 60 | 7.2% |
| Satellite Internet | 65 | 7.8% |
| No Internet | 80 | 9.6% |
| Total | 831 | 100.0% |
Blue Grass Summary
Geography
Blue Grass, Iowa is located in Scott County, Iowa, in the United States. It is situated on the banks of the Mississippi River, approximately 10 miles north of Davenport. The city is bordered by the cities of Davenport, Bettendorf, and Eldridge. Blue Grass is located in the Quad Cities metropolitan area, which includes the cities of Davenport, Bettendorf, Moline, and Rock Island. The city has a total area of 2.2 square miles, all of which is land.
History
Blue Grass was founded in 1837 by a group of settlers from Pennsylvania. The town was named after the bluegrass that grew in the area. The first post office was established in 1845. The town was incorporated in 1853.
In the late 19th century, Blue Grass was a thriving agricultural community. The town was home to several grain elevators, a flour mill, and a creamery. The town also had a railroad station, which connected it to the rest of the Quad Cities.
In the early 20th century, Blue Grass experienced a period of growth and prosperity. The town was home to several businesses, including a bank, a hotel, a movie theater, and a variety of stores. The town also had a public library and a high school.
In the late 20th century, Blue Grass experienced a period of decline. Many of the businesses closed, and the population decreased. In the early 21st century, the town has experienced a resurgence, with new businesses opening and the population increasing.
Economy
Blue Grass is a small town with a population of approximately 2,000 people. The town is primarily a bedroom community, with many of its residents commuting to the larger cities in the Quad Cities area for work. The town is home to several small businesses, including a grocery store, a hardware store, and a few restaurants.
The town is also home to several manufacturing companies, including a plastics manufacturer and a metal fabrication company. The town is also home to a number of farms, which produce corn, soybeans, and other crops.
Demographics
As of the 2010 census, the population of Blue Grass was 2,039. The racial makeup of the town was 97.3% White, 0.7% African American, 0.3% Native American, 0.3% Asian, 0.1% Pacific Islander, 0.3% from other races, and 1.0% from two or more races. Hispanic or Latino of any race were 1.3% of the population.
The median household income in Blue Grass was $50,938, and the median family income was $60,000. The per capita income was $25,938. About 5.3% of families and 7.2% of the population were below the poverty line, including 8.3% of those under age 18 and 5.2% of those age 65 or over.
Conclusion
Blue Grass, Iowa is a small town located in Scott County, Iowa. The town was founded in 1837 and has a population of approximately 2,000 people. The town is primarily a bedroom community, with many of its residents commuting to the larger cities in the Quad Cities area for work. The town is home to several small businesses, manufacturing companies, and farms. The town has experienced a period of decline in the late 20th century, but has experienced a resurgence in the early 21st century. The population of Blue Grass is 97.3% White, 0.7% African American, 0.3% Native American, 0.3% Asian, 0.1% Pacific Islander, 0.3% from other races, and 1.0% from two or more races. The median household income in Blue Grass is $50,938, and the median family income is $60,000.
Common Questions
What is Per Capita Income in Blue Grass?
Per Capita income in Blue Grass is $43,266.
What is the Median Family Income in Blue Grass?
Median Family Income in Blue Grass is $103,317.
What is the Median Household income in Blue Grass?
Median Household Income in Blue Grass is $78,125.
What is Income or Wage Gap in Blue Grass?
Income or Wage Gap in Blue Grass is 33.5%.
Women in Blue Grass earn 66.5 cents for every dollar earned by a man.
What is Inequality or Gini Index in Blue Grass?
Inequality or Gini Index in Blue Grass is 0.45.
What is the Total Population of Blue Grass?
Total Population of Blue Grass is 1,873.
What is the Total Male Population of Blue Grass?
Total Male Population of Blue Grass is 838.
What is the Total Female Population of Blue Grass?
Total Female Population of Blue Grass is 1,035.
What is the Ratio of Males per 100 Females in Blue Grass?
There are 80.97 Males per 100 Females in Blue Grass.
What is the Ratio of Females per 100 Males in Blue Grass?
There are 123.51 Females per 100 Males in Blue Grass.
What is the Median Population Age in Blue Grass?
Median Population Age in Blue Grass is 45.2 Years.
What is the Average Family Size in Blue Grass
Average Family Size in Blue Grass is 2.6 People.
What is the Average Household Size in Blue Grass
Average Household Size in Blue Grass is 2.2 People.
How Large is the Labor Force in Blue Grass?
There are 895 People in the Labor Forcein in Blue Grass.
What is the Percentage of People in the Labor Force in Blue Grass?
60.3% of People are in the Labor Force in Blue Grass.
What is the Unemployment Rate in Blue Grass?
Unemployment Rate in Blue Grass is 6.2%.