Bloomfield, IA Map & Demographics
Bloomfield Map
Bloomfield Overview
$30,240
PER CAPITA INCOME
$66,818
AVG FAMILY INCOME
$58,047
AVG HOUSEHOLD INCOME
21.8%
WAGE / INCOME GAP [ % ]
78.2¢/ $1
WAGE / INCOME GAP [ $ ]
$6,850
FAMILY INCOME DEFICIT
0.37
INEQUALITY / GINI INDEX
2,687
TOTAL POPULATION
1,256
MALE POPULATION
1,431
FEMALE POPULATION
87.77
MALES / 100 FEMALES
113.93
FEMALES / 100 MALES
39.6
MEDIAN AGE
2.9
AVG FAMILY SIZE
2.4
AVG HOUSEHOLD SIZE
1,225
LABOR FORCE [ PEOPLE ]
59.0%
PERCENT IN LABOR FORCE
1.8%
UNEMPLOYMENT RATE
Bloomfield Zip Codes
Bloomfield Area Codes
Income in Bloomfield
Income Overview in Bloomfield
Per Capita Income in Bloomfield is $30,240, while median incomes of families and households are $66,818 and $58,047 respectively.
| Characteristic | Number | Measure |
| Per Capita Income | 2,687 | $30,240 |
| Median Family Income | 720 | $66,818 |
| Mean Family Income | 720 | $79,781 |
| Median Household Income | 1,105 | $58,047 |
| Mean Household Income | 1,105 | $69,770 |
| Income Deficit | 720 | $6,850 |
| Wage / Income Gap (%) | 2,687 | 21.78% |
| Wage / Income Gap ($) | 2,687 | 78.22¢ per $1 |
| Gini / Inequality Index | 2,687 | 0.37 |
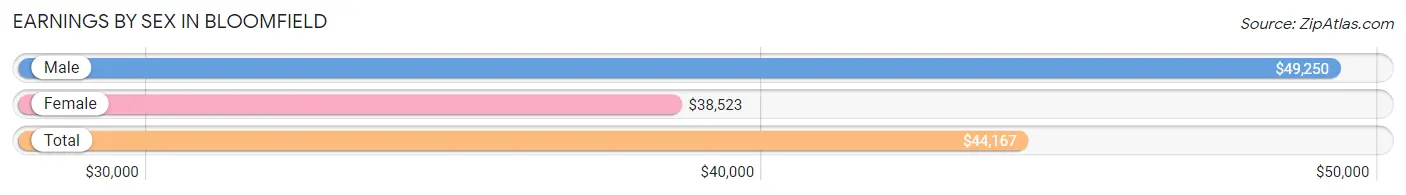
Earnings by Sex in Bloomfield
Average Earnings in Bloomfield are $44,167, $49,250 for men and $38,523 for women, a difference of 21.8%.
| Sex | Number | Average Earnings |
| Male | 752 (55.5%) | $49,250 |
| Female | 602 (44.5%) | $38,523 |
| Total | 1,354 (100.0%) | $44,167 |
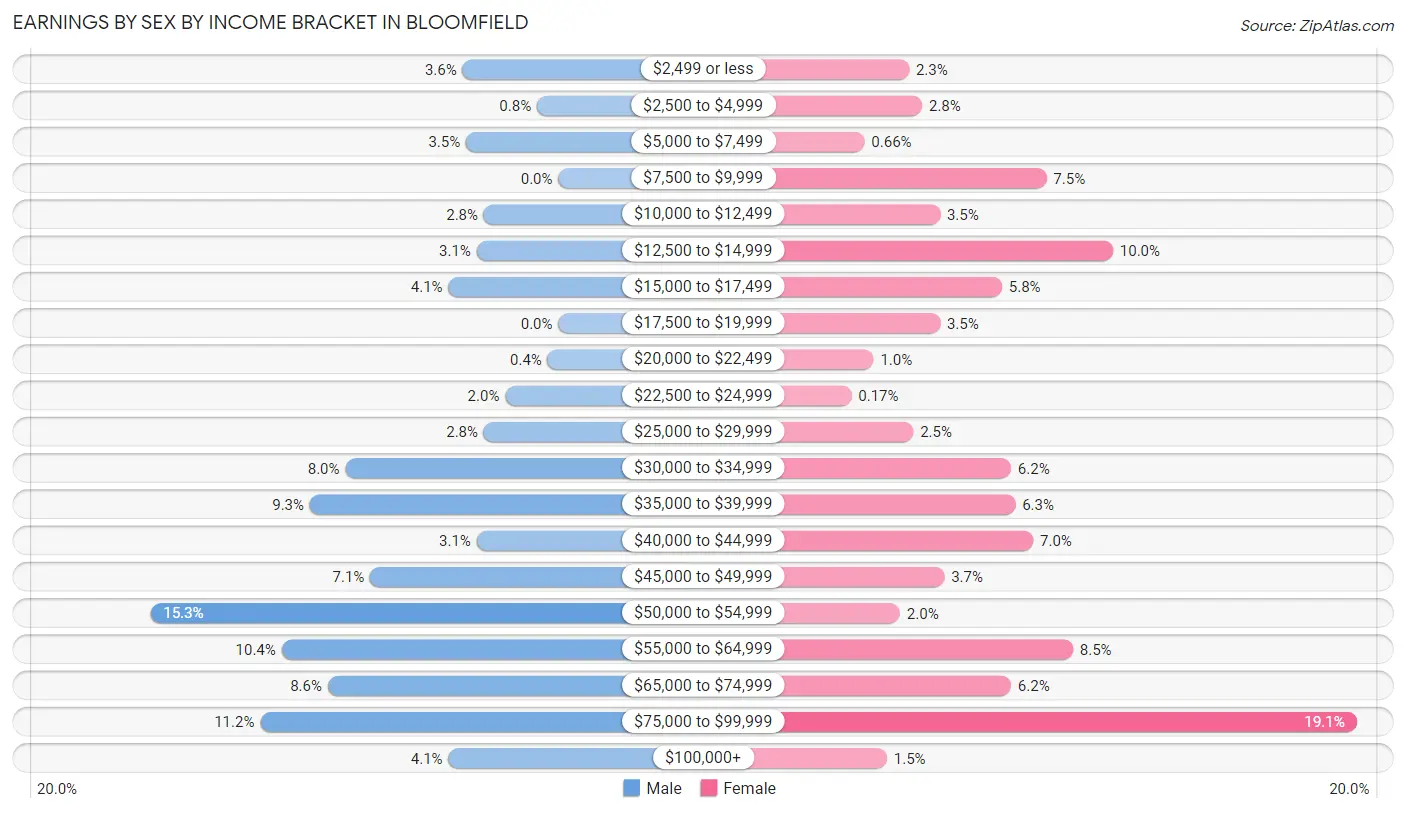
Earnings by Sex by Income Bracket in Bloomfield
The most common earnings brackets in Bloomfield are $50,000 to $54,999 for men (115 | 15.3%) and $75,000 to $99,999 for women (115 | 19.1%).
| Income | Male | Female |
| $2,499 or less | 27 (3.6%) | 14 (2.3%) |
| $2,500 to $4,999 | 6 (0.8%) | 17 (2.8%) |
| $5,000 to $7,499 | 26 (3.5%) | 4 (0.7%) |
| $7,500 to $9,999 | 0 (0.0%) | 45 (7.5%) |
| $10,000 to $12,499 | 21 (2.8%) | 21 (3.5%) |
| $12,500 to $14,999 | 23 (3.1%) | 60 (10.0%) |
| $15,000 to $17,499 | 31 (4.1%) | 35 (5.8%) |
| $17,500 to $19,999 | 0 (0.0%) | 21 (3.5%) |
| $20,000 to $22,499 | 3 (0.4%) | 6 (1.0%) |
| $22,500 to $24,999 | 15 (2.0%) | 1 (0.2%) |
| $25,000 to $29,999 | 21 (2.8%) | 15 (2.5%) |
| $30,000 to $34,999 | 60 (8.0%) | 37 (6.1%) |
| $35,000 to $39,999 | 70 (9.3%) | 38 (6.3%) |
| $40,000 to $44,999 | 23 (3.1%) | 42 (7.0%) |
| $45,000 to $49,999 | 53 (7.0%) | 22 (3.6%) |
| $50,000 to $54,999 | 115 (15.3%) | 12 (2.0%) |
| $55,000 to $64,999 | 78 (10.4%) | 51 (8.5%) |
| $65,000 to $74,999 | 65 (8.6%) | 37 (6.1%) |
| $75,000 to $99,999 | 84 (11.2%) | 115 (19.1%) |
| $100,000+ | 31 (4.1%) | 9 (1.5%) |
| Total | 752 (100.0%) | 602 (100.0%) |
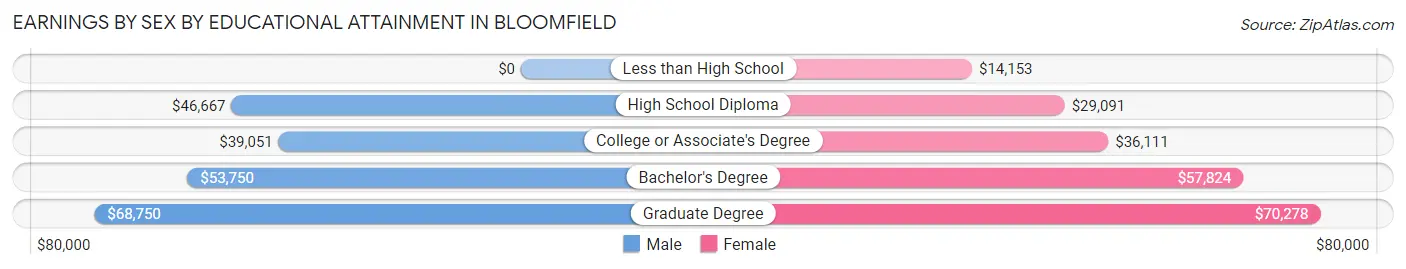
Earnings by Sex by Educational Attainment in Bloomfield
Average earnings in Bloomfield are $50,714 for men and $41,111 for women, a difference of 18.9%. Men with an educational attainment of graduate degree enjoy the highest average annual earnings of $68,750, while those with college or associate's degree education earn the least with $39,051. Women with an educational attainment of graduate degree earn the most with the average annual earnings of $70,278, while those with less than high school education have the smallest earnings of $14,153.
| Educational Attainment | Male Income | Female Income |
| Less than High School | - | - |
| High School Diploma | $46,667 | $29,091 |
| College or Associate's Degree | $39,051 | $36,111 |
| Bachelor's Degree | $53,750 | $57,824 |
| Graduate Degree | $68,750 | $70,278 |
| Total | $50,714 | $41,111 |
Family Income in Bloomfield
Family Income Brackets in Bloomfield
According to the Bloomfield family income data, there are 158 families falling into the $50,000 to $74,999 income range, which is the most common income bracket and makes up 21.9% of all families. Conversely, the $10,000 to $14,999 income bracket is the least frequent group with only 3 families (0.4%) belonging to this category.
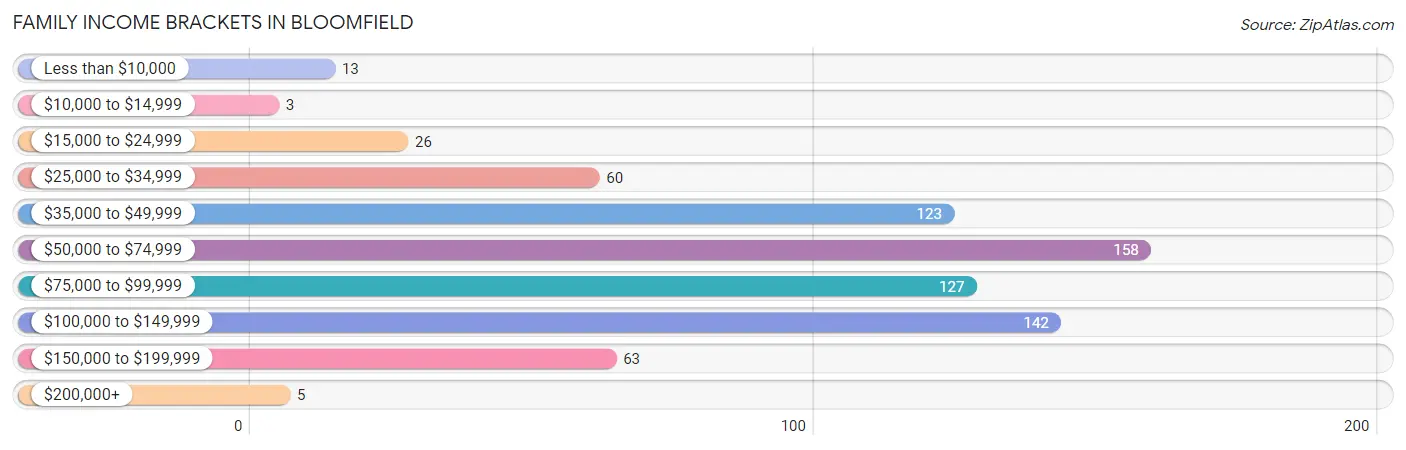
| Income Bracket | # Families | % Families |
| Less than $10,000 | 13 | 1.8% |
| $10,000 to $14,999 | 3 | 0.4% |
| $15,000 to $24,999 | 26 | 3.6% |
| $25,000 to $34,999 | 60 | 8.3% |
| $35,000 to $49,999 | 123 | 17.1% |
| $50,000 to $74,999 | 158 | 21.9% |
| $75,000 to $99,999 | 127 | 17.6% |
| $100,000 to $149,999 | 142 | 19.7% |
| $150,000 to $199,999 | 63 | 8.8% |
| $200,000+ | 5 | 0.7% |
Family Income by Famaliy Size in Bloomfield
4-person families (133 | 18.5%) account for the highest median family income in Bloomfield with $104,844 per family, while 2-person families (341 | 47.4%) have the highest median income of $37,625 per family member.
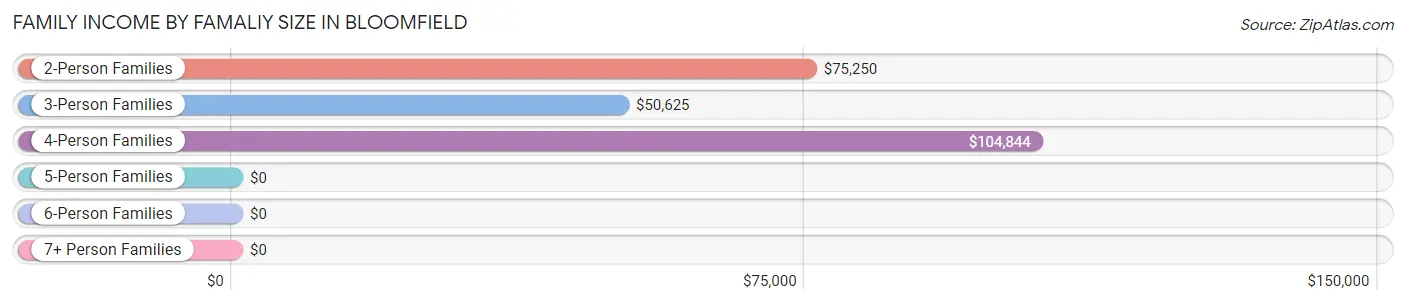
| Income Bracket | # Families | Median Income |
| 2-Person Families | 341 (47.4%) | $75,250 |
| 3-Person Families | 180 (25.0%) | $50,625 |
| 4-Person Families | 133 (18.5%) | $104,844 |
| 5-Person Families | 52 (7.2%) | $0 |
| 6-Person Families | 8 (1.1%) | $0 |
| 7+ Person Families | 6 (0.8%) | $0 |
| Total | 720 (100.0%) | $66,818 |
Family Income by Number of Earners in Bloomfield
The median family income in Bloomfield is $66,818, with families comprising 2 earners (236) having the highest median family income of $104,881, while families with 1 earner (321) have the lowest median family income of $48,750, accounting for 32.8% and 44.6% of families, respectively.
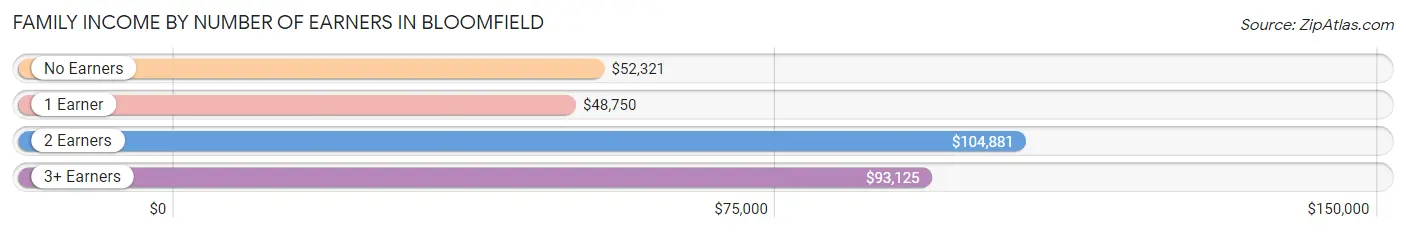
| Number of Earners | # Families | Median Income |
| No Earners | 107 (14.9%) | $52,321 |
| 1 Earner | 321 (44.6%) | $48,750 |
| 2 Earners | 236 (32.8%) | $104,881 |
| 3+ Earners | 56 (7.8%) | $93,125 |
| Total | 720 (100.0%) | $66,818 |
Household Income in Bloomfield
Household Income Brackets in Bloomfield
With 218 households falling in the category, the $50,000 to $74,999 income range is the most frequent in Bloomfield, accounting for 19.7% of all households. In contrast, only 6 households (0.5%) fall into the $200,000+ income bracket, making it the least populous group.
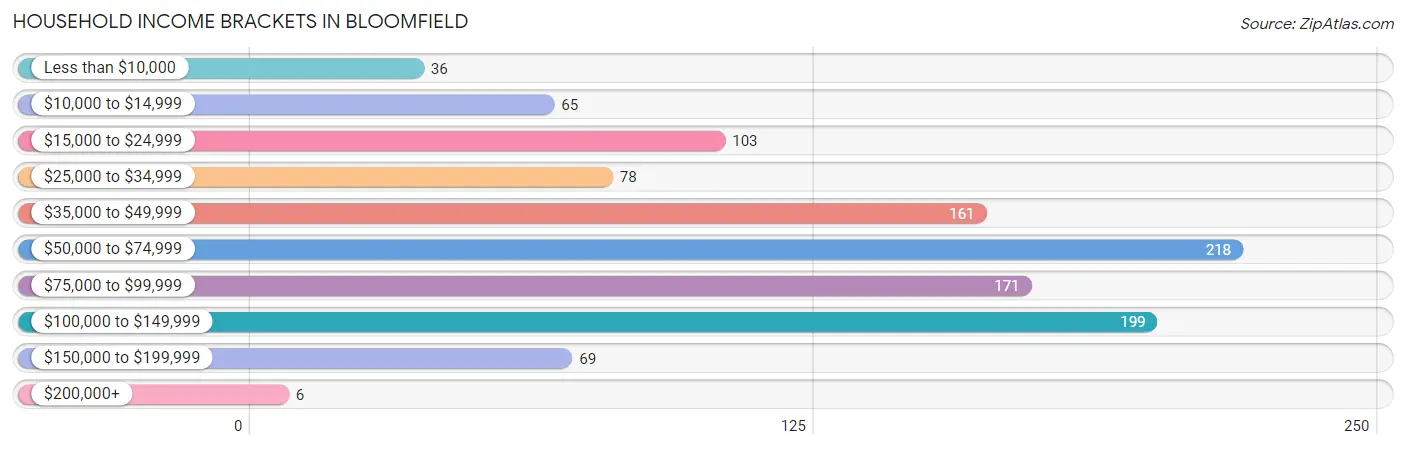
| Income Bracket | # Households | % Households |
| Less than $10,000 | 36 | 3.3% |
| $10,000 to $14,999 | 65 | 5.9% |
| $15,000 to $24,999 | 103 | 9.3% |
| $25,000 to $34,999 | 78 | 7.1% |
| $35,000 to $49,999 | 161 | 14.6% |
| $50,000 to $74,999 | 218 | 19.7% |
| $75,000 to $99,999 | 171 | 15.5% |
| $100,000 to $149,999 | 199 | 18.0% |
| $150,000 to $199,999 | 69 | 6.2% |
| $200,000+ | 6 | 0.5% |
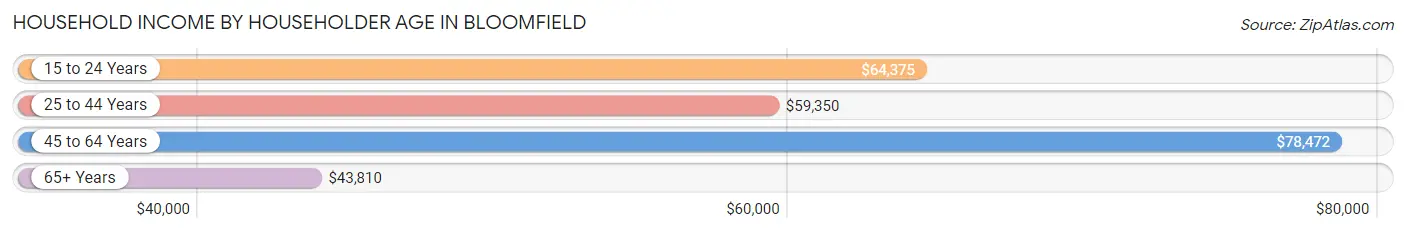
Household Income by Householder Age in Bloomfield
The median household income in Bloomfield is $58,047, with the highest median household income of $78,472 found in the 45 to 64 years age bracket for the primary householder. A total of 335 households (30.3%) fall into this category. Meanwhile, the 65+ years age bracket for the primary householder has the lowest median household income of $43,810, with 372 households (33.7%) in this group.
| Income Bracket | # Households | Median Income |
| 15 to 24 Years | 25 (2.3%) | $64,375 |
| 25 to 44 Years | 373 (33.8%) | $59,350 |
| 45 to 64 Years | 335 (30.3%) | $78,472 |
| 65+ Years | 372 (33.7%) | $43,810 |
| Total | 1,105 (100.0%) | $58,047 |
Poverty in Bloomfield
Income Below Poverty by Sex and Age in Bloomfield
With 7.3% poverty level for males and 12.4% for females among the residents of Bloomfield, 6 to 11 year old males and 25 to 34 year old females are the most vulnerable to poverty, with 30 males (53.6%) and 70 females (44.3%) in their respective age groups living below the poverty level.
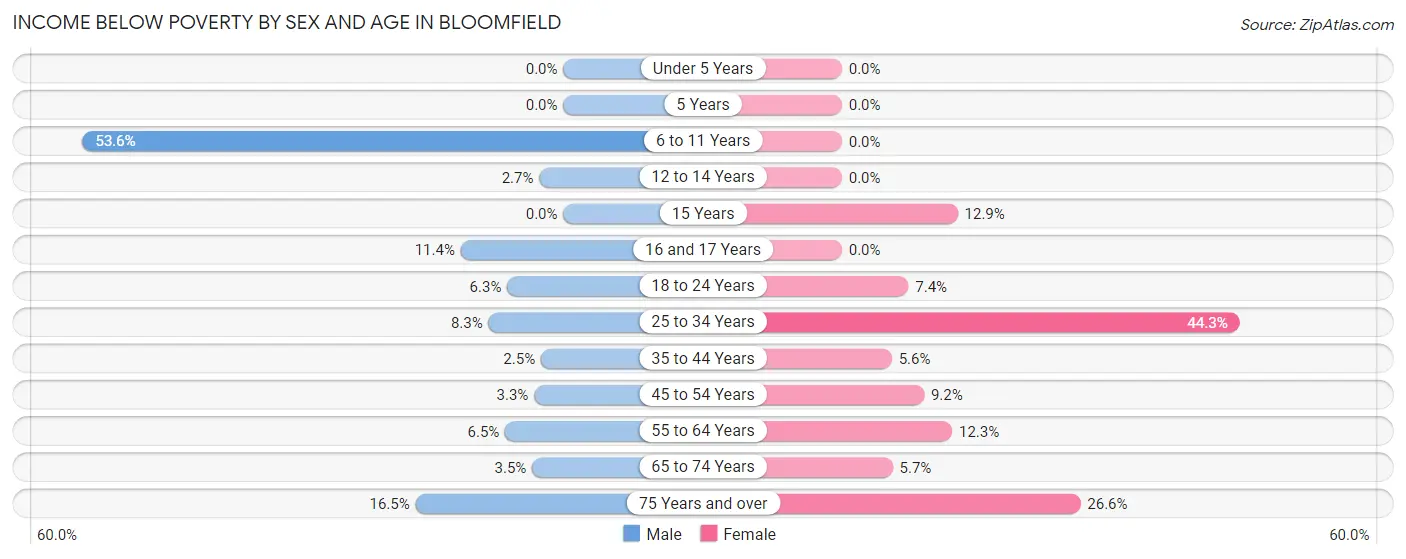
| Age Bracket | Male | Female |
| Under 5 Years | 0 (0.0%) | 0 (0.0%) |
| 5 Years | 0 (0.0%) | 0 (0.0%) |
| 6 to 11 Years | 30 (53.6%) | 0 (0.0%) |
| 12 to 14 Years | 3 (2.7%) | 0 (0.0%) |
| 15 Years | 0 (0.0%) | 4 (12.9%) |
| 16 and 17 Years | 4 (11.4%) | 0 (0.0%) |
| 18 to 24 Years | 3 (6.2%) | 4 (7.4%) |
| 25 to 34 Years | 15 (8.3%) | 70 (44.3%) |
| 35 to 44 Years | 5 (2.5%) | 10 (5.6%) |
| 45 to 54 Years | 5 (3.3%) | 13 (9.1%) |
| 55 to 64 Years | 7 (6.5%) | 21 (12.3%) |
| 65 to 74 Years | 5 (3.5%) | 9 (5.7%) |
| 75 Years and over | 13 (16.5%) | 38 (26.6%) |
| Total | 90 (7.3%) | 169 (12.4%) |
Income Above Poverty by Sex and Age in Bloomfield
According to the poverty statistics in Bloomfield, males aged under 5 years and females aged under 5 years are the age groups that are most secure financially, with 100.0% of males and 100.0% of females in these age groups living above the poverty line.
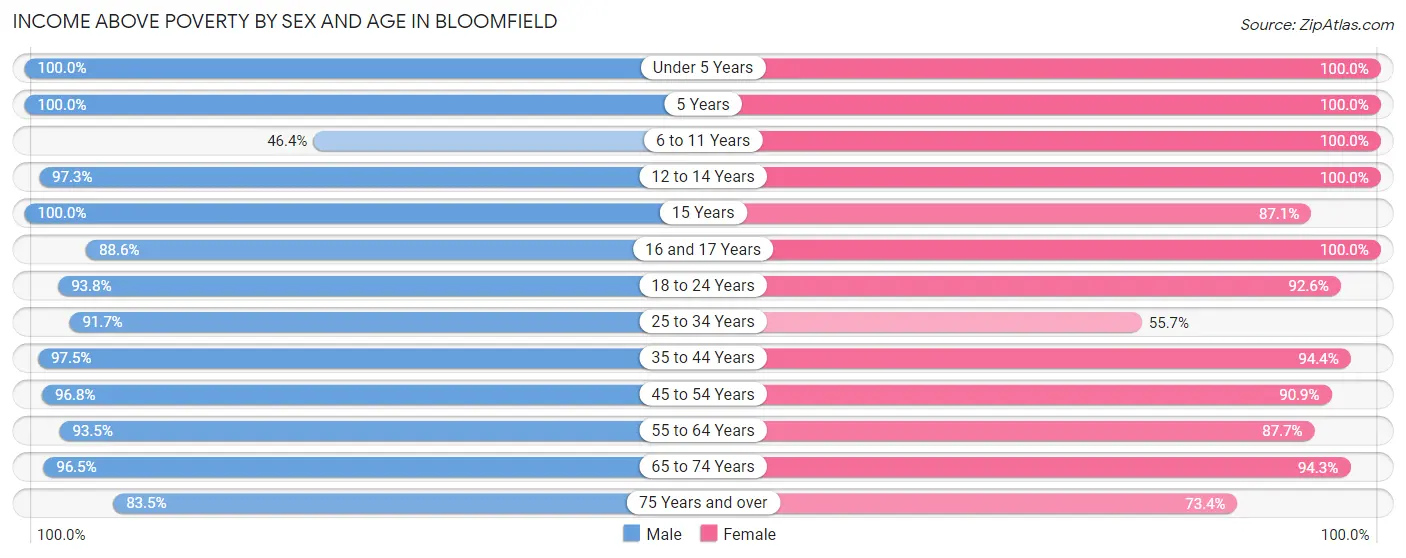
| Age Bracket | Male | Female |
| Under 5 Years | 68 (100.0%) | 67 (100.0%) |
| 5 Years | 21 (100.0%) | 16 (100.0%) |
| 6 to 11 Years | 26 (46.4%) | 161 (100.0%) |
| 12 to 14 Years | 109 (97.3%) | 42 (100.0%) |
| 15 Years | 19 (100.0%) | 27 (87.1%) |
| 16 and 17 Years | 31 (88.6%) | 36 (100.0%) |
| 18 to 24 Years | 45 (93.8%) | 50 (92.6%) |
| 25 to 34 Years | 165 (91.7%) | 88 (55.7%) |
| 35 to 44 Years | 196 (97.5%) | 170 (94.4%) |
| 45 to 54 Years | 149 (96.8%) | 129 (90.8%) |
| 55 to 64 Years | 101 (93.5%) | 150 (87.7%) |
| 65 to 74 Years | 139 (96.5%) | 150 (94.3%) |
| 75 Years and over | 66 (83.5%) | 105 (73.4%) |
| Total | 1,135 (92.6%) | 1,191 (87.6%) |
Income Below Poverty Among Married-Couple Families in Bloomfield
The poverty statistics for married-couple families in Bloomfield show that 5.2% or 25 of the total 480 families live below the poverty line. Families with 3 or 4 children have the highest poverty rate of 19.2%, comprising of 5 families. On the other hand, families with 1 or 2 children have the lowest poverty rate of 2.1%, which includes 4 families.
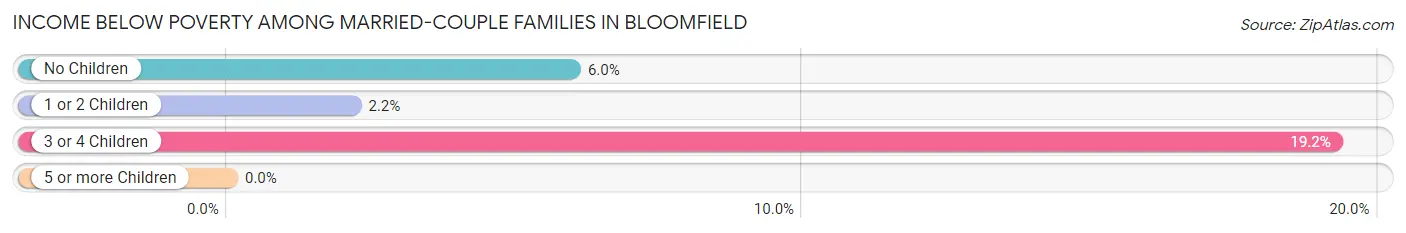
| Children | Above Poverty | Below Poverty |
| No Children | 252 (94.0%) | 16 (6.0%) |
| 1 or 2 Children | 182 (97.9%) | 4 (2.1%) |
| 3 or 4 Children | 21 (80.8%) | 5 (19.2%) |
| 5 or more Children | 0 (0.0%) | 0 (0.0%) |
| Total | 455 (94.8%) | 25 (5.2%) |
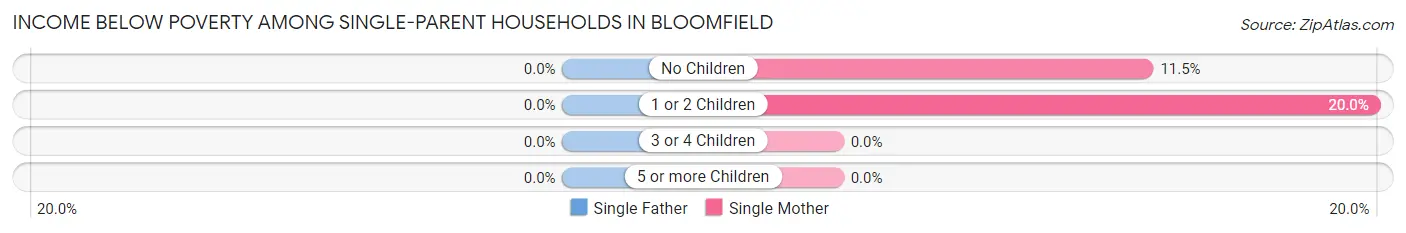
Income Below Poverty Among Single-Parent Households in Bloomfield
| Children | Single Father | Single Mother |
| No Children | 0 (0.0%) | 3 (11.5%) |
| 1 or 2 Children | 0 (0.0%) | 18 (20.0%) |
| 3 or 4 Children | 0 (0.0%) | 0 (0.0%) |
| 5 or more Children | 0 (0.0%) | 0 (0.0%) |
| Total | 0 (0.0%) | 21 (16.8%) |
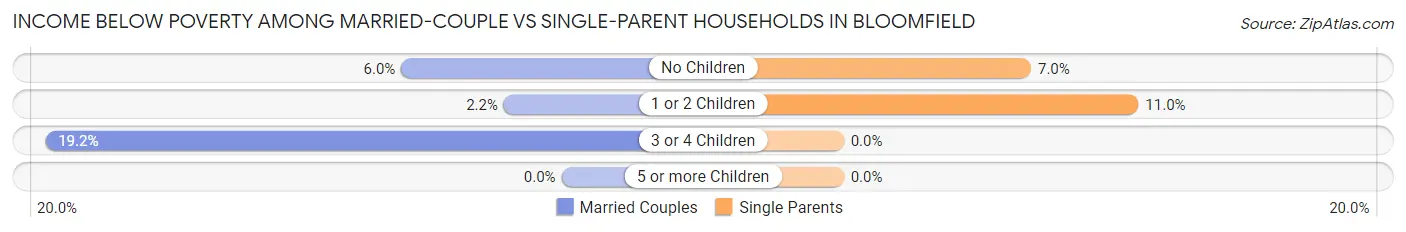
Income Below Poverty Among Married-Couple vs Single-Parent Households in Bloomfield
The poverty data for Bloomfield shows that 25 of the married-couple family households (5.2%) and 21 of the single-parent households (8.7%) are living below the poverty level. Within the married-couple family households, those with 3 or 4 children have the highest poverty rate, with 5 households (19.2%) falling below the poverty line. Among the single-parent households, those with 1 or 2 children have the highest poverty rate, with 18 household (11.0%) living below poverty.
| Children | Married-Couple Families | Single-Parent Households |
| No Children | 16 (6.0%) | 3 (7.0%) |
| 1 or 2 Children | 4 (2.1%) | 18 (11.0%) |
| 3 or 4 Children | 5 (19.2%) | 0 (0.0%) |
| 5 or more Children | 0 (0.0%) | 0 (0.0%) |
| Total | 25 (5.2%) | 21 (8.7%) |
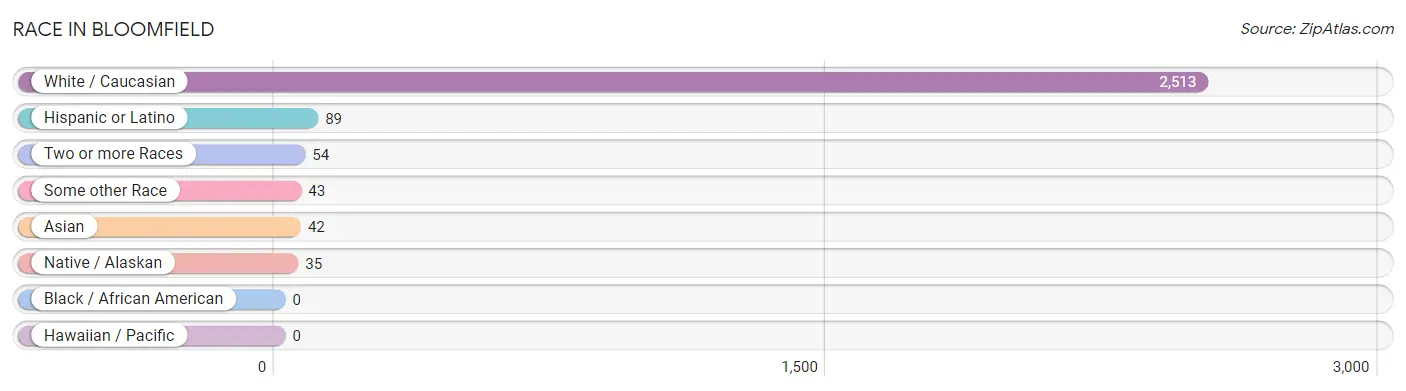
Race in Bloomfield
The most populous races in Bloomfield are White / Caucasian (2,513 | 93.5%), Hispanic or Latino (89 | 3.3%), and Two or more Races (54 | 2.0%).
| Race | # Population | % Population |
| Asian | 42 | 1.6% |
| Black / African American | 0 | 0.0% |
| Hawaiian / Pacific | 0 | 0.0% |
| Hispanic or Latino | 89 | 3.3% |
| Native / Alaskan | 35 | 1.3% |
| White / Caucasian | 2,513 | 93.5% |
| Two or more Races | 54 | 2.0% |
| Some other Race | 43 | 1.6% |
| Total | 2,687 | 100.0% |
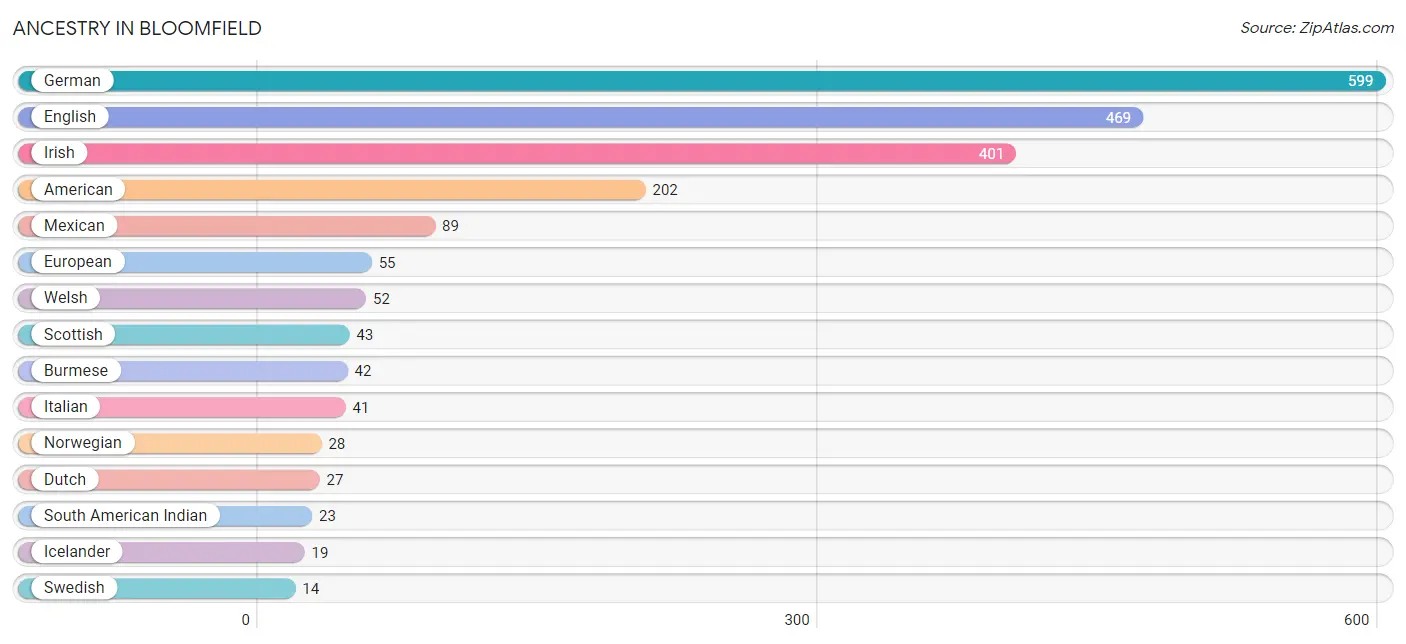
Ancestry in Bloomfield
The most populous ancestries reported in Bloomfield are German (599 | 22.3%), English (469 | 17.4%), Irish (401 | 14.9%), American (202 | 7.5%), and Mexican (89 | 3.3%), together accounting for 65.5% of all Bloomfield residents.
| Ancestry | # Population | % Population |
| American | 202 | 7.5% |
| British | 11 | 0.4% |
| Burmese | 42 | 1.6% |
| Croatian | 3 | 0.1% |
| Danish | 10 | 0.4% |
| Dutch | 27 | 1.0% |
| English | 469 | 17.4% |
| European | 55 | 2.1% |
| French | 10 | 0.4% |
| German | 599 | 22.3% |
| Icelander | 19 | 0.7% |
| Irish | 401 | 14.9% |
| Italian | 41 | 1.5% |
| Mexican | 89 | 3.3% |
| Mexican American Indian | 12 | 0.4% |
| Norwegian | 28 | 1.0% |
| Portuguese | 10 | 0.4% |
| Russian | 5 | 0.2% |
| Scotch-Irish | 6 | 0.2% |
| Scottish | 43 | 1.6% |
| South American Indian | 23 | 0.9% |
| Swedish | 14 | 0.5% |
| Welsh | 52 | 1.9% | View All 23 Rows |
Immigrants in Bloomfield
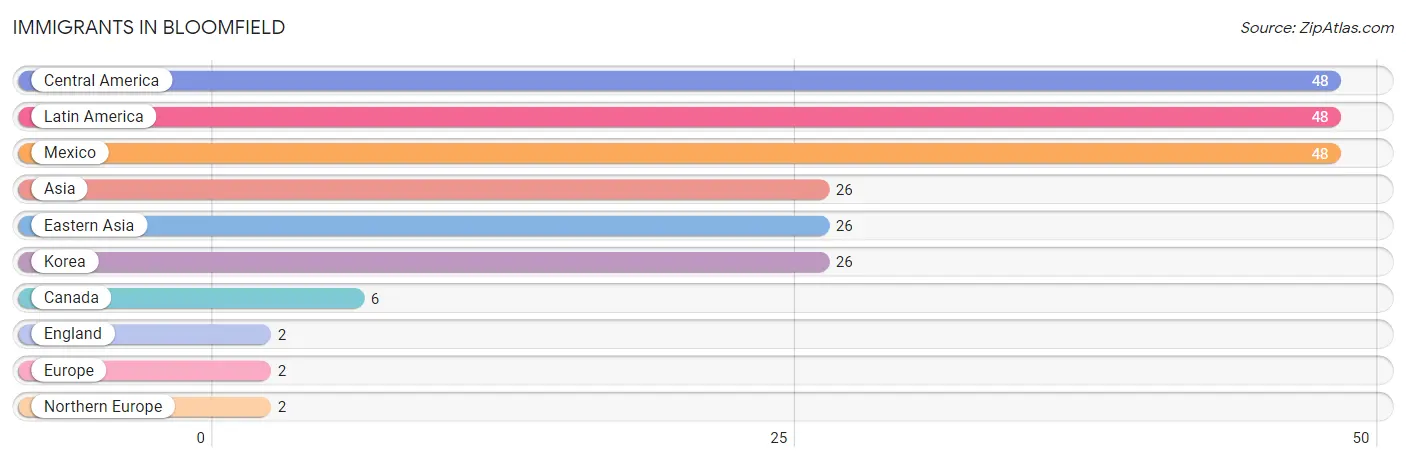
The most numerous immigrant groups reported in Bloomfield came from Central America (48 | 1.8%), Latin America (48 | 1.8%), Mexico (48 | 1.8%), Asia (26 | 1.0%), and Eastern Asia (26 | 1.0%), together accounting for 7.3% of all Bloomfield residents.
| Immigration Origin | # Population | % Population |
| Asia | 26 | 1.0% |
| Canada | 6 | 0.2% |
| Central America | 48 | 1.8% |
| Eastern Asia | 26 | 1.0% |
| England | 2 | 0.1% |
| Europe | 2 | 0.1% |
| Korea | 26 | 1.0% |
| Latin America | 48 | 1.8% |
| Mexico | 48 | 1.8% |
| Northern Europe | 2 | 0.1% | View All 10 Rows |
Sex and Age in Bloomfield
Sex and Age in Bloomfield
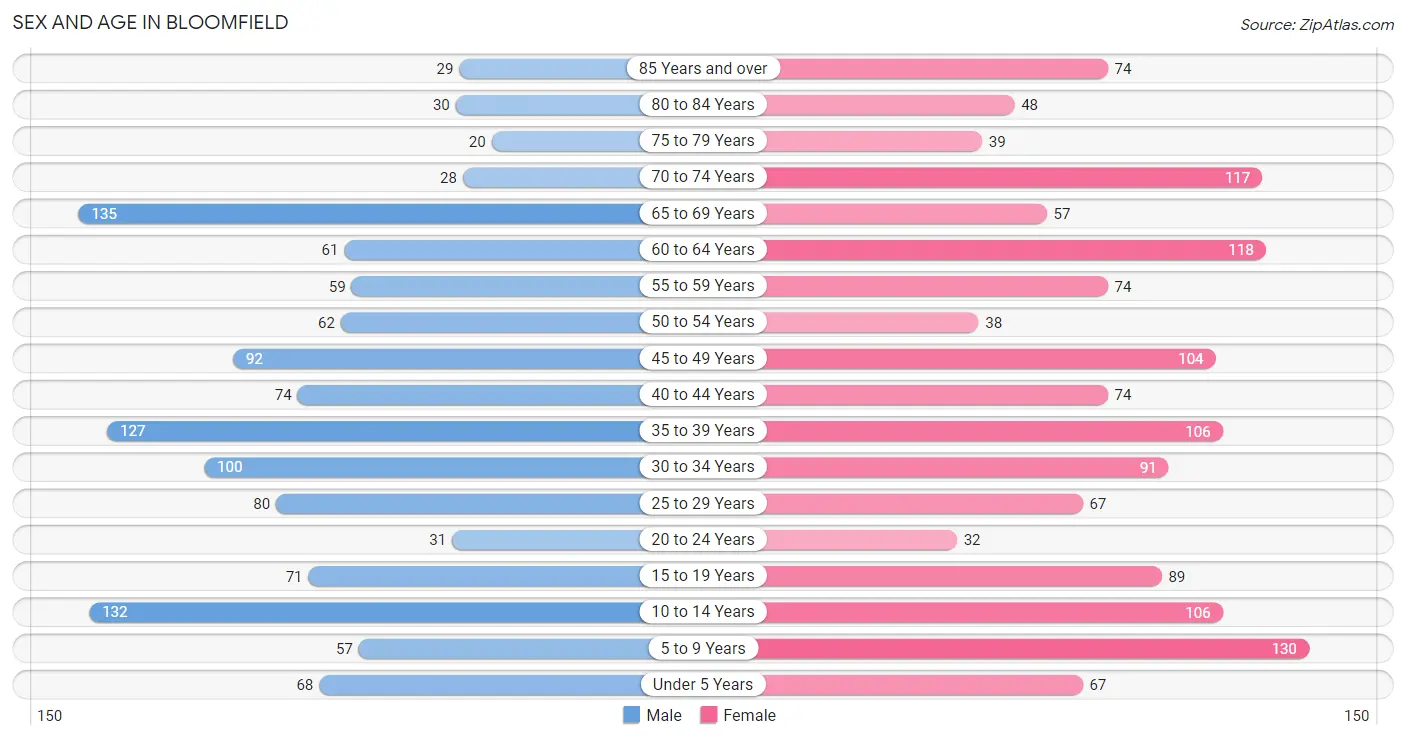
The most populous age groups in Bloomfield are 65 to 69 Years (135 | 10.7%) for men and 5 to 9 Years (130 | 9.1%) for women.
| Age Bracket | Male | Female |
| Under 5 Years | 68 (5.4%) | 67 (4.7%) |
| 5 to 9 Years | 57 (4.5%) | 130 (9.1%) |
| 10 to 14 Years | 132 (10.5%) | 106 (7.4%) |
| 15 to 19 Years | 71 (5.7%) | 89 (6.2%) |
| 20 to 24 Years | 31 (2.5%) | 32 (2.2%) |
| 25 to 29 Years | 80 (6.4%) | 67 (4.7%) |
| 30 to 34 Years | 100 (8.0%) | 91 (6.4%) |
| 35 to 39 Years | 127 (10.1%) | 106 (7.4%) |
| 40 to 44 Years | 74 (5.9%) | 74 (5.2%) |
| 45 to 49 Years | 92 (7.3%) | 104 (7.3%) |
| 50 to 54 Years | 62 (4.9%) | 38 (2.7%) |
| 55 to 59 Years | 59 (4.7%) | 74 (5.2%) |
| 60 to 64 Years | 61 (4.9%) | 118 (8.3%) |
| 65 to 69 Years | 135 (10.7%) | 57 (4.0%) |
| 70 to 74 Years | 28 (2.2%) | 117 (8.2%) |
| 75 to 79 Years | 20 (1.6%) | 39 (2.7%) |
| 80 to 84 Years | 30 (2.4%) | 48 (3.4%) |
| 85 Years and over | 29 (2.3%) | 74 (5.2%) |
| Total | 1,256 (100.0%) | 1,431 (100.0%) |
Families and Households in Bloomfield
Median Family Size in Bloomfield
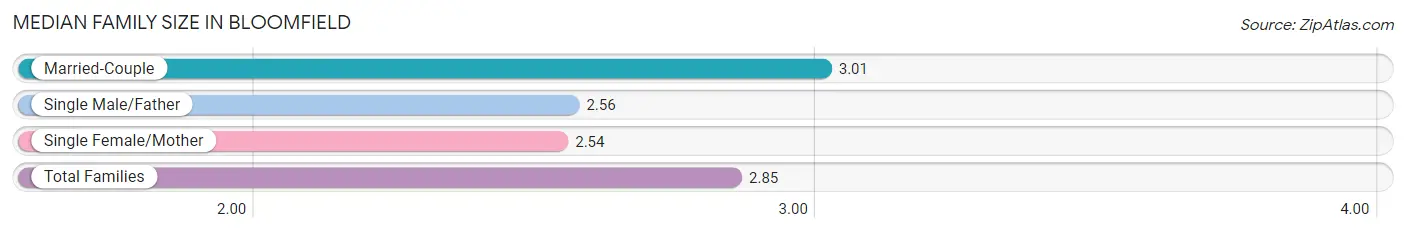
The median family size in Bloomfield is 2.85 persons per family, with married-couple families (480 | 66.7%) accounting for the largest median family size of 3.01 persons per family. On the other hand, single female/mother families (125 | 17.4%) represent the smallest median family size with 2.54 persons per family.
| Family Type | # Families | Family Size |
| Married-Couple | 480 (66.7%) | 3.01 |
| Single Male/Father | 115 (16.0%) | 2.56 |
| Single Female/Mother | 125 (17.4%) | 2.54 |
| Total Families | 720 (100.0%) | 2.85 |
Median Household Size in Bloomfield
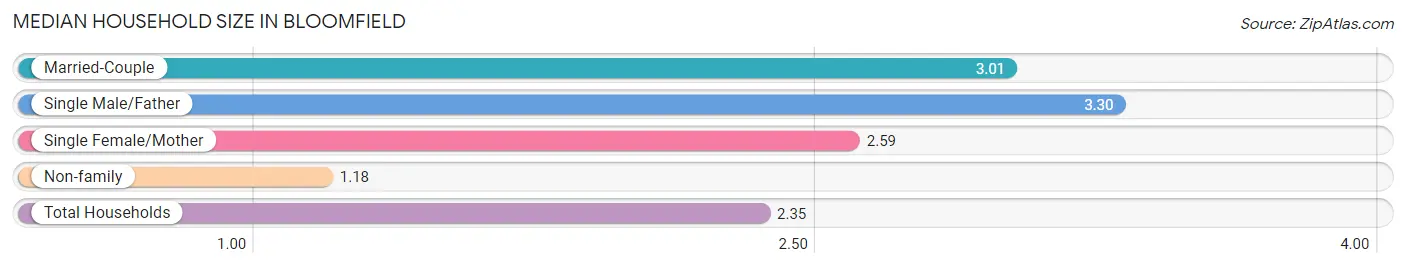
The median household size in Bloomfield is 2.35 persons per household, with single male/father households (115 | 10.4%) accounting for the largest median household size of 3.3 persons per household. non-family households (385 | 34.8%) represent the smallest median household size with 1.18 persons per household.
| Household Type | # Households | Household Size |
| Married-Couple | 480 (43.4%) | 3.01 |
| Single Male/Father | 115 (10.4%) | 3.30 |
| Single Female/Mother | 125 (11.3%) | 2.59 |
| Non-family | 385 (34.8%) | 1.18 |
| Total Households | 1,105 (100.0%) | 2.35 |
Household Size by Marriage Status in Bloomfield
Out of a total of 1,105 households in Bloomfield, 720 (65.2%) are family households, while 385 (34.8%) are nonfamily households. The most numerous type of family households are 2-person households, comprising 330, and the most common type of nonfamily households are 1-person households, comprising 348.
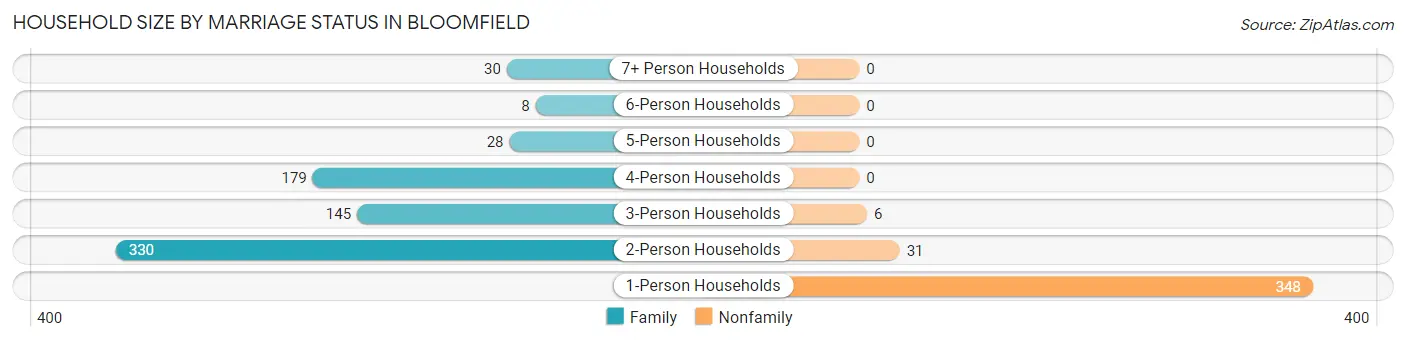
| Household Size | Family Households | Nonfamily Households |
| 1-Person Households | - | 348 (31.5%) |
| 2-Person Households | 330 (29.9%) | 31 (2.8%) |
| 3-Person Households | 145 (13.1%) | 6 (0.5%) |
| 4-Person Households | 179 (16.2%) | 0 (0.0%) |
| 5-Person Households | 28 (2.5%) | 0 (0.0%) |
| 6-Person Households | 8 (0.7%) | 0 (0.0%) |
| 7+ Person Households | 30 (2.7%) | 0 (0.0%) |
| Total | 720 (65.2%) | 385 (34.8%) |
Female Fertility in Bloomfield
Fertility by Age in Bloomfield
Average fertility rate in Bloomfield is 86.0 births per 1,000 women. Women in the age bracket of 20 to 34 years have the highest fertility rate with 237.0 births per 1,000 women. Women in the age bracket of 20 to 34 years acount for 91.8% of all women with births.
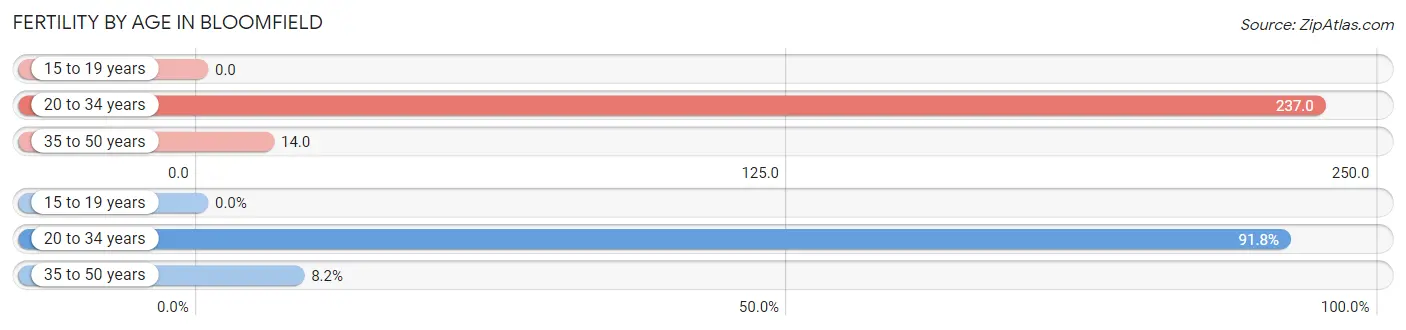
| Age Bracket | Women with Births | Births / 1,000 Women |
| 15 to 19 years | 0 (0.0%) | 0.0 |
| 20 to 34 years | 45 (91.8%) | 237.0 |
| 35 to 50 years | 4 (8.2%) | 14.0 |
| Total | 49 (100.0%) | 86.0 |
Fertility by Age by Marriage Status in Bloomfield
71.4% of women with births (49) in Bloomfield are married. The highest percentage of unmarried women with births falls into 35 to 50 years age bracket with 100.0% of them unmarried at the time of birth, while the lowest percentage of unmarried women with births belong to 20 to 34 years age bracket with 22.2% of them unmarried.
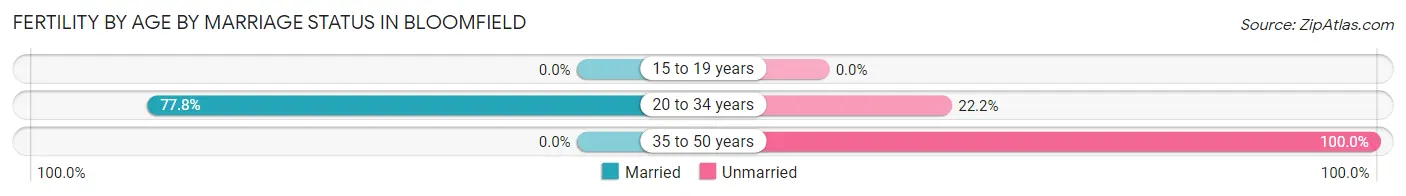
| Age Bracket | Married | Unmarried |
| 15 to 19 years | 0 (0.0%) | 0 (0.0%) |
| 20 to 34 years | 35 (77.8%) | 10 (22.2%) |
| 35 to 50 years | 0 (0.0%) | 4 (100.0%) |
| Total | 35 (71.4%) | 14 (28.6%) |
Fertility by Education in Bloomfield
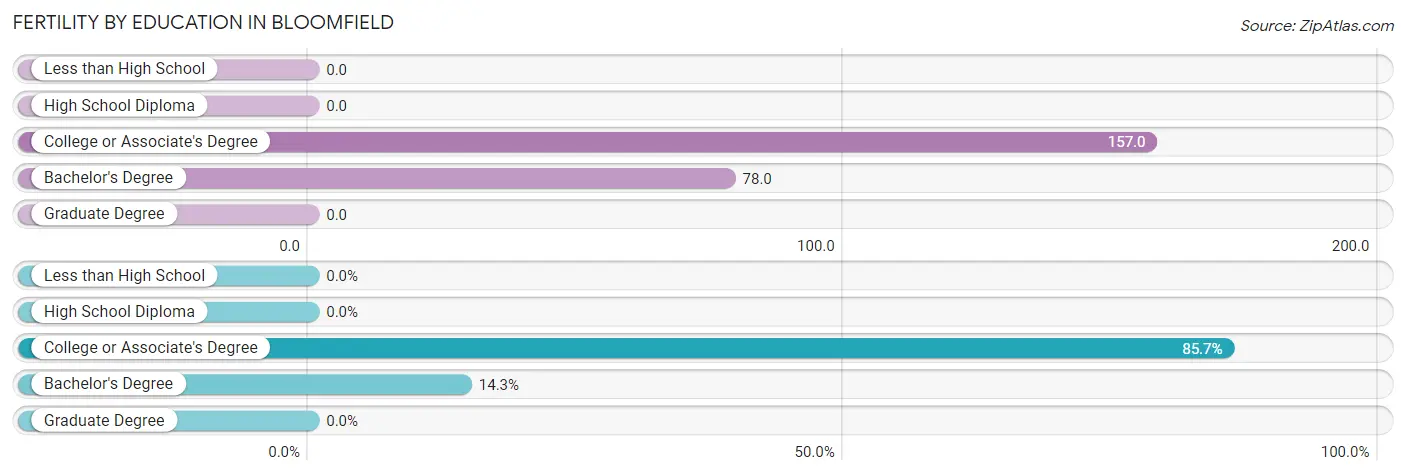
| Educational Attainment | Women with Births | Births / 1,000 Women |
| Less than High School | 0 (0.0%) | 0.0 |
| High School Diploma | 0 (0.0%) | 0.0 |
| College or Associate's Degree | 42 (85.7%) | 157.0 |
| Bachelor's Degree | 7 (14.3%) | 78.0 |
| Graduate Degree | 0 (0.0%) | 0.0 |
| Total | 49 (100.0%) | 86.0 |
Fertility by Education by Marriage Status in Bloomfield
28.6% of women with births in Bloomfield are unmarried. Women with the educational attainment of college or associate's degree are most likely to be married with 76.2% of them married at childbirth, while women with the educational attainment of bachelor's degree are least likely to be married with 57.1% of them unmarried at childbirth.
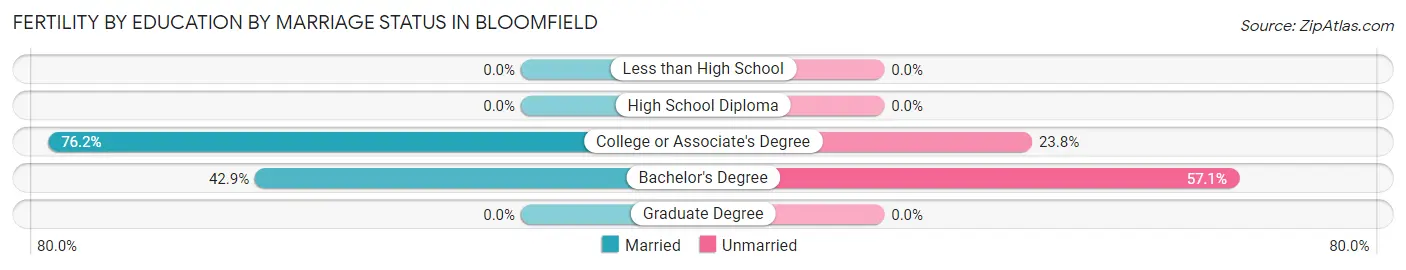
| Educational Attainment | Married | Unmarried |
| Less than High School | 0 (0.0%) | 0 (0.0%) |
| High School Diploma | 0 (0.0%) | 0 (0.0%) |
| College or Associate's Degree | 32 (76.2%) | 10 (23.8%) |
| Bachelor's Degree | 3 (42.9%) | 4 (57.1%) |
| Graduate Degree | 0 (0.0%) | 0 (0.0%) |
| Total | 35 (71.4%) | 14 (28.6%) |
Employment Characteristics in Bloomfield
Employment by Class of Employer in Bloomfield
Among the 1,193 employed individuals in Bloomfield, private company employees (819 | 68.6%), local government employees (153 | 12.8%), and not-for-profit organizations (97 | 8.1%) make up the most common classes of employment.
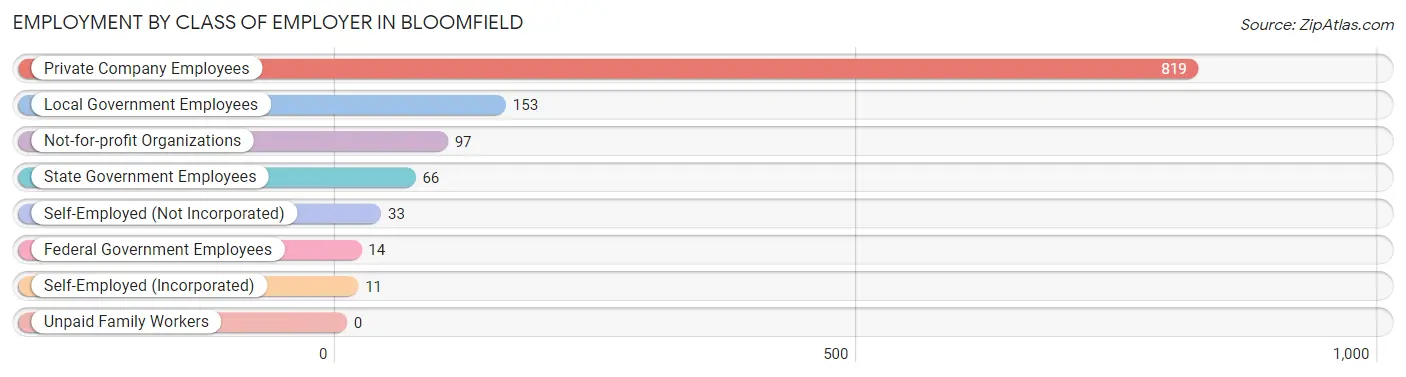
| Employer Class | # Employees | % Employees |
| Private Company Employees | 819 | 68.6% |
| Self-Employed (Incorporated) | 11 | 0.9% |
| Self-Employed (Not Incorporated) | 33 | 2.8% |
| Not-for-profit Organizations | 97 | 8.1% |
| Local Government Employees | 153 | 12.8% |
| State Government Employees | 66 | 5.5% |
| Federal Government Employees | 14 | 1.2% |
| Unpaid Family Workers | 0 | 0.0% |
| Total | 1,193 | 100.0% |
Employment Status by Age in Bloomfield
According to the labor force statistics for Bloomfield, out of the total population over 16 years of age (2,077), 59.0% or 1,225 individuals are in the labor force, with 1.8% or 22 of them unemployed. The age group with the highest labor force participation rate is 35 to 44 years, with 97.4% or 371 individuals in the labor force. Within the labor force, the 20 to 24 years age range has the highest percentage of unemployed individuals, with 27.6% or 16 of them being unemployed.
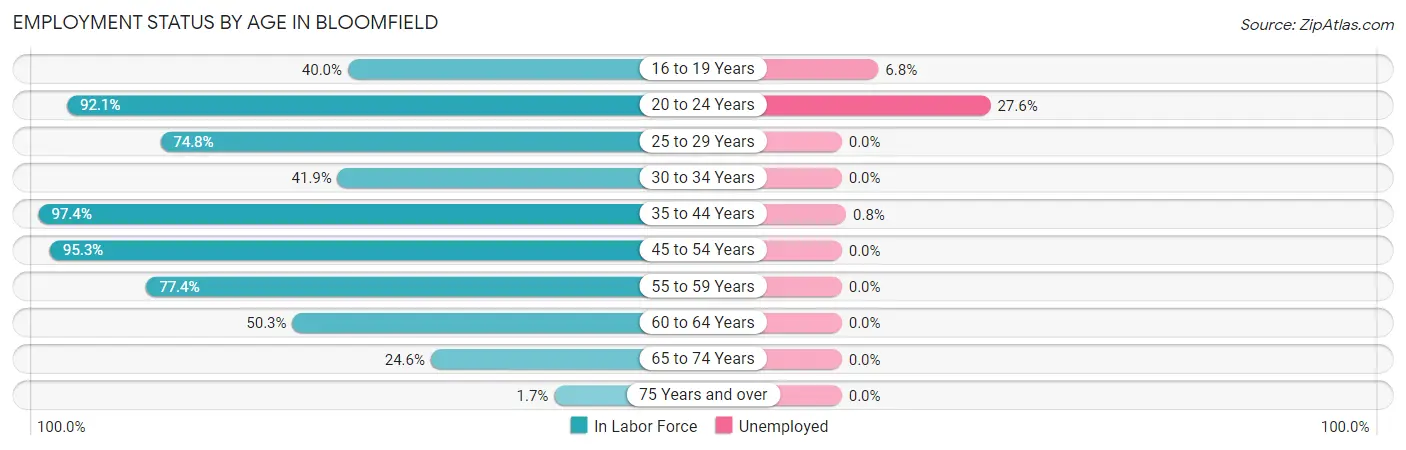
| Age Bracket | In Labor Force | Unemployed |
| 16 to 19 Years | 44 (40.0%) | 3 (6.8%) |
| 20 to 24 Years | 58 (92.1%) | 16 (27.6%) |
| 25 to 29 Years | 110 (74.8%) | 0 (0.0%) |
| 30 to 34 Years | 80 (41.9%) | 0 (0.0%) |
| 35 to 44 Years | 371 (97.4%) | 3 (0.8%) |
| 45 to 54 Years | 282 (95.3%) | 0 (0.0%) |
| 55 to 59 Years | 103 (77.4%) | 0 (0.0%) |
| 60 to 64 Years | 90 (50.3%) | 0 (0.0%) |
| 65 to 74 Years | 83 (24.6%) | 0 (0.0%) |
| 75 Years and over | 4 (1.7%) | 0 (0.0%) |
| Total | 1,225 (59.0%) | 22 (1.8%) |
Employment Status by Educational Attainment in Bloomfield
According to labor force statistics for Bloomfield, 78.1% of individuals (1,036) out of the total population between 25 and 64 years of age (1,327) are in the labor force, with 0.3% or 3 of them being unemployed. The group with the highest labor force participation rate are those with the educational attainment of bachelor's degree or higher, with 91.8% or 347 individuals in the labor force. Within the labor force, individuals with high school diploma education have the highest percentage of unemployment, with 1.5% or 3 of them being unemployed.
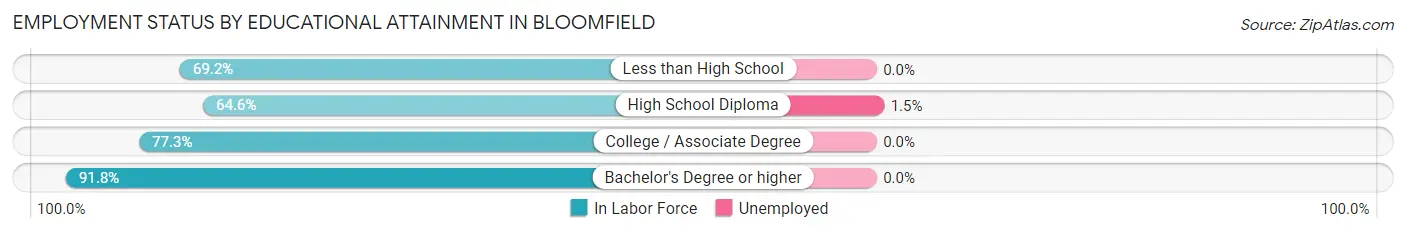
| Educational Attainment | In Labor Force | Unemployed |
| Less than High School | 45 (69.2%) | 0 (0.0%) |
| High School Diploma | 201 (64.6%) | 5 (1.5%) |
| College / Associate Degree | 443 (77.3%) | 0 (0.0%) |
| Bachelor's Degree or higher | 347 (91.8%) | 0 (0.0%) |
| Total | 1,036 (78.1%) | 4 (0.3%) |
Employment Occupations by Sex in Bloomfield
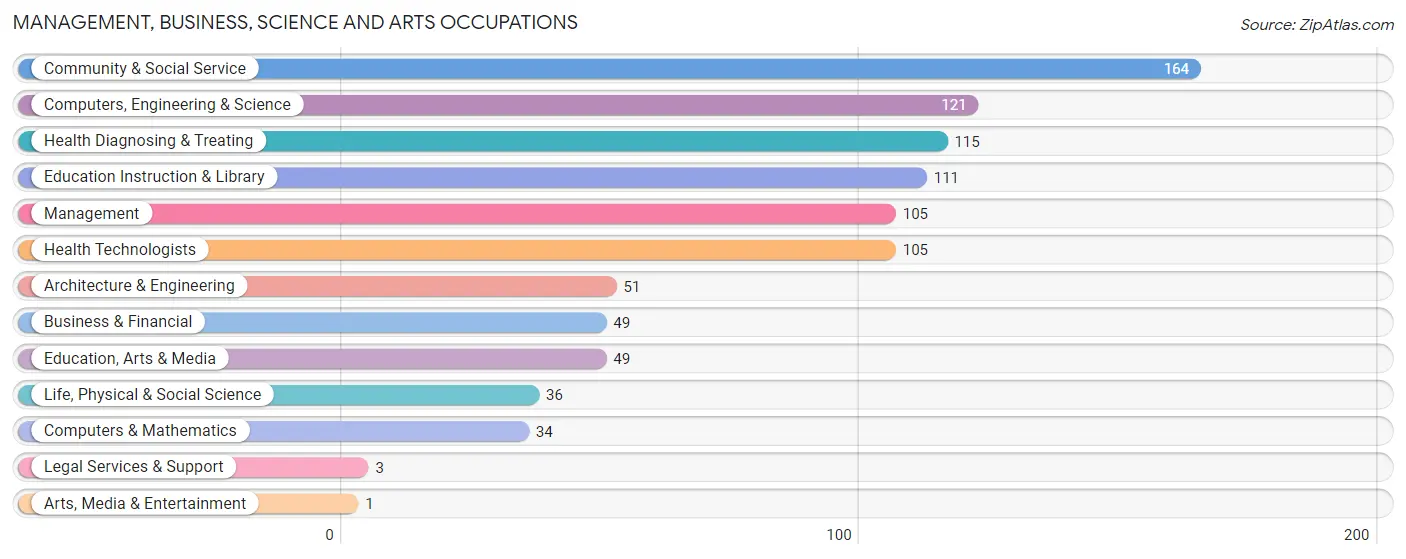
Management, Business, Science and Arts Occupations
The most common Management, Business, Science and Arts occupations in Bloomfield are Community & Social Service (164 | 13.6%), Computers, Engineering & Science (121 | 10.1%), Health Diagnosing & Treating (115 | 9.6%), Education Instruction & Library (111 | 9.2%), and Management (105 | 8.7%).
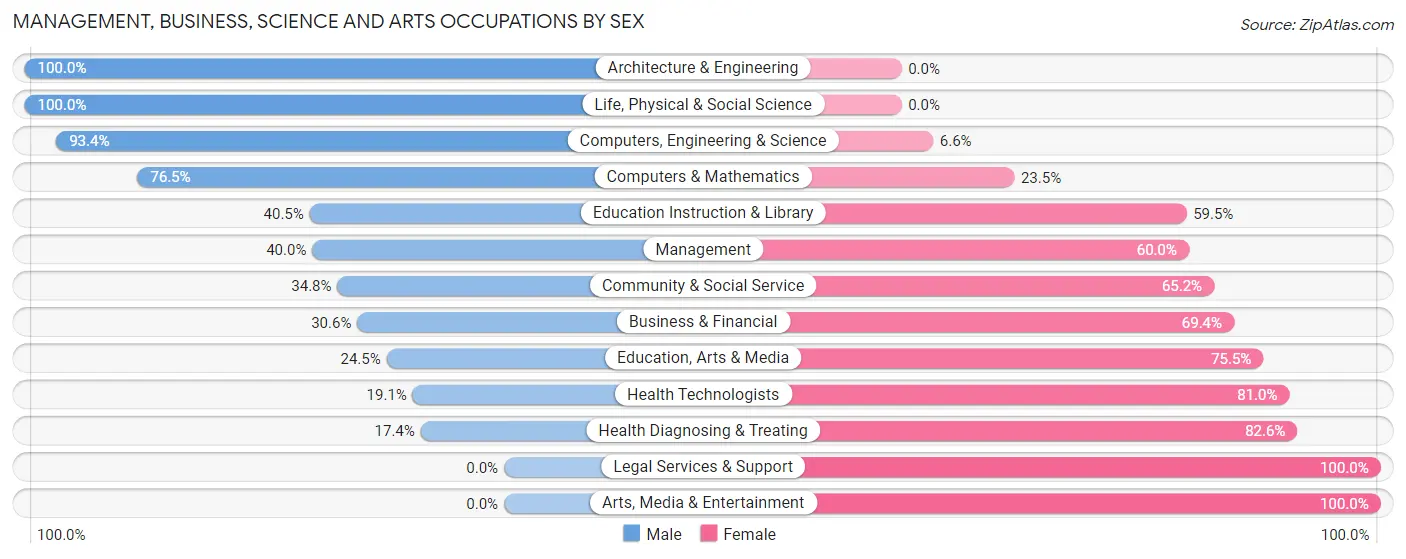
Management, Business, Science and Arts Occupations by Sex
Within the Management, Business, Science and Arts occupations in Bloomfield, the most male-oriented occupations are Architecture & Engineering (100.0%), Life, Physical & Social Science (100.0%), and Computers, Engineering & Science (93.4%), while the most female-oriented occupations are Legal Services & Support (100.0%), Arts, Media & Entertainment (100.0%), and Health Diagnosing & Treating (82.6%).
| Occupation | Male | Female |
| Management | 42 (40.0%) | 63 (60.0%) |
| Business & Financial | 15 (30.6%) | 34 (69.4%) |
| Computers, Engineering & Science | 113 (93.4%) | 8 (6.6%) |
| Computers & Mathematics | 26 (76.5%) | 8 (23.5%) |
| Architecture & Engineering | 51 (100.0%) | 0 (0.0%) |
| Life, Physical & Social Science | 36 (100.0%) | 0 (0.0%) |
| Community & Social Service | 57 (34.8%) | 107 (65.2%) |
| Education, Arts & Media | 12 (24.5%) | 37 (75.5%) |
| Legal Services & Support | 0 (0.0%) | 3 (100.0%) |
| Education Instruction & Library | 45 (40.5%) | 66 (59.5%) |
| Arts, Media & Entertainment | 0 (0.0%) | 1 (100.0%) |
| Health Diagnosing & Treating | 20 (17.4%) | 95 (82.6%) |
| Health Technologists | 20 (19.1%) | 85 (80.9%) |
| Total (Category) | 247 (44.6%) | 307 (55.4%) |
| Total (Overall) | 666 (55.4%) | 537 (44.6%) |
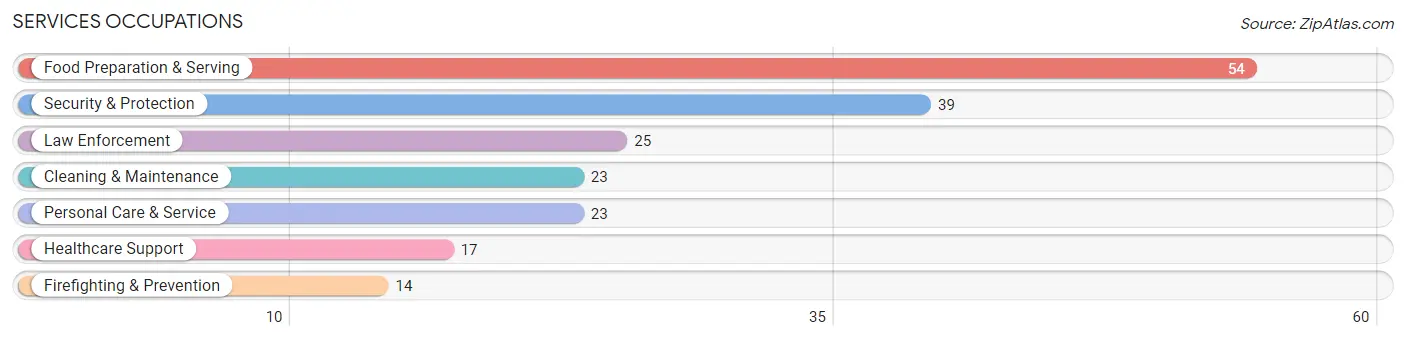
Services Occupations
The most common Services occupations in Bloomfield are Food Preparation & Serving (54 | 4.5%), Security & Protection (39 | 3.2%), Law Enforcement (25 | 2.1%), Cleaning & Maintenance (23 | 1.9%), and Personal Care & Service (23 | 1.9%).
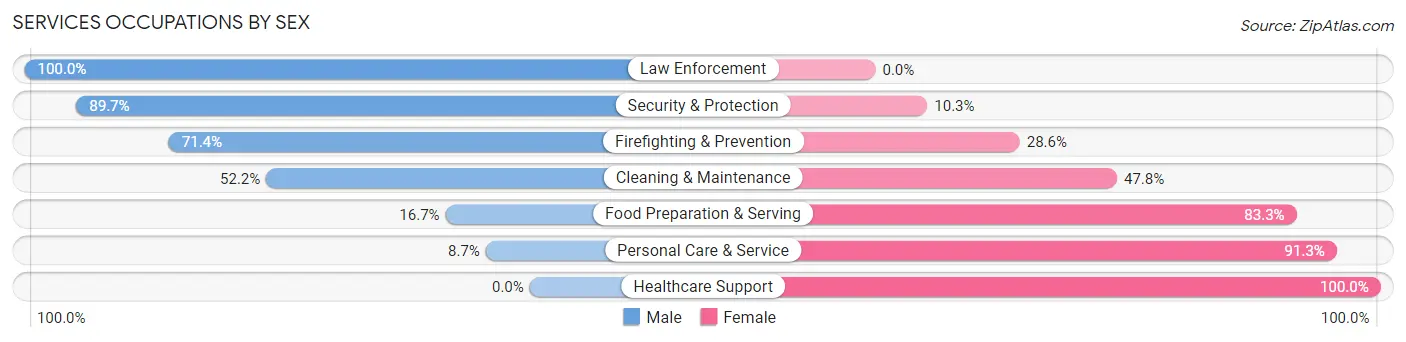
Services Occupations by Sex
Within the Services occupations in Bloomfield, the most male-oriented occupations are Law Enforcement (100.0%), Security & Protection (89.7%), and Firefighting & Prevention (71.4%), while the most female-oriented occupations are Healthcare Support (100.0%), Personal Care & Service (91.3%), and Food Preparation & Serving (83.3%).
| Occupation | Male | Female |
| Healthcare Support | 0 (0.0%) | 17 (100.0%) |
| Security & Protection | 35 (89.7%) | 4 (10.3%) |
| Firefighting & Prevention | 10 (71.4%) | 4 (28.6%) |
| Law Enforcement | 25 (100.0%) | 0 (0.0%) |
| Food Preparation & Serving | 9 (16.7%) | 45 (83.3%) |
| Cleaning & Maintenance | 12 (52.2%) | 11 (47.8%) |
| Personal Care & Service | 2 (8.7%) | 21 (91.3%) |
| Total (Category) | 58 (37.2%) | 98 (62.8%) |
| Total (Overall) | 666 (55.4%) | 537 (44.6%) |
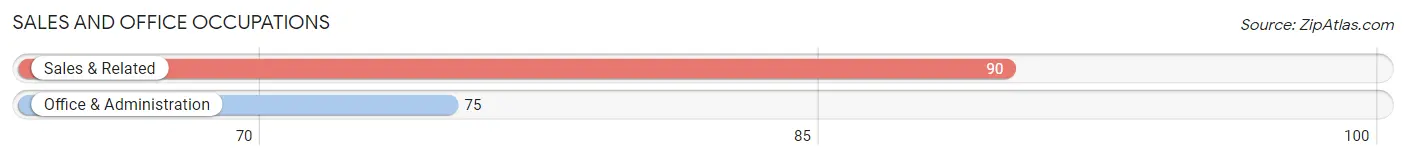
Sales and Office Occupations
The most common Sales and Office occupations in Bloomfield are Sales & Related (90 | 7.5%), and Office & Administration (75 | 6.2%).
Sales and Office Occupations by Sex
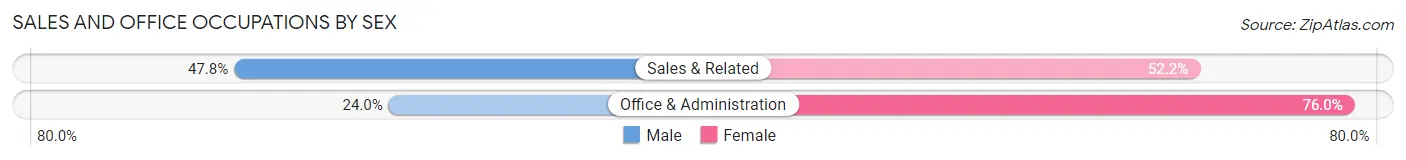
| Occupation | Male | Female |
| Sales & Related | 43 (47.8%) | 47 (52.2%) |
| Office & Administration | 18 (24.0%) | 57 (76.0%) |
| Total (Category) | 61 (37.0%) | 104 (63.0%) |
| Total (Overall) | 666 (55.4%) | 537 (44.6%) |
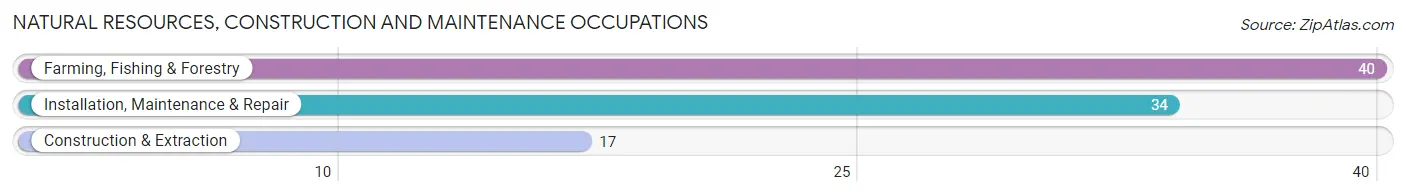
Natural Resources, Construction and Maintenance Occupations
The most common Natural Resources, Construction and Maintenance occupations in Bloomfield are Farming, Fishing & Forestry (40 | 3.3%), Installation, Maintenance & Repair (34 | 2.8%), and Construction & Extraction (17 | 1.4%).
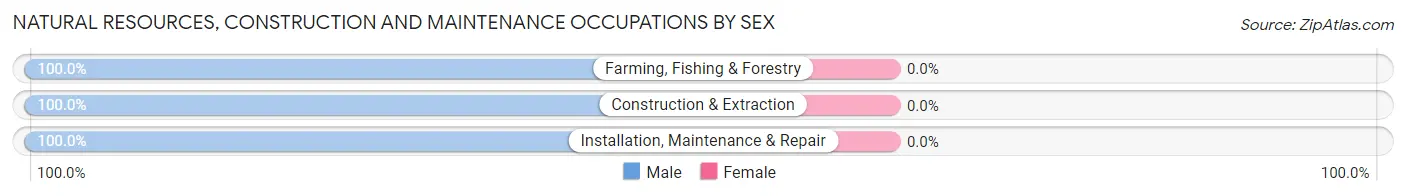
Natural Resources, Construction and Maintenance Occupations by Sex
| Occupation | Male | Female |
| Farming, Fishing & Forestry | 40 (100.0%) | 0 (0.0%) |
| Construction & Extraction | 17 (100.0%) | 0 (0.0%) |
| Installation, Maintenance & Repair | 34 (100.0%) | 0 (0.0%) |
| Total (Category) | 91 (100.0%) | 0 (0.0%) |
| Total (Overall) | 666 (55.4%) | 537 (44.6%) |
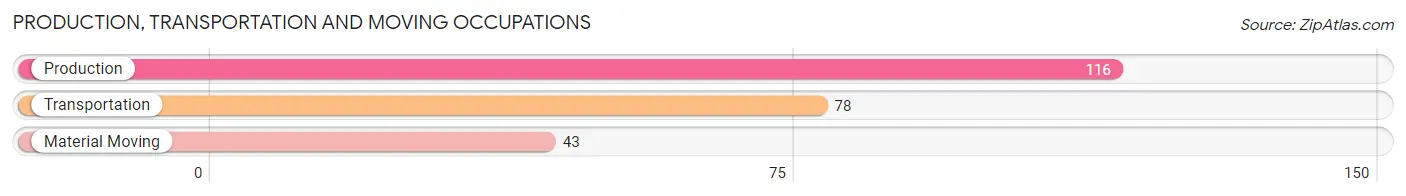
Production, Transportation and Moving Occupations
The most common Production, Transportation and Moving occupations in Bloomfield are Production (116 | 9.6%), Transportation (78 | 6.5%), and Material Moving (43 | 3.6%).
Production, Transportation and Moving Occupations by Sex
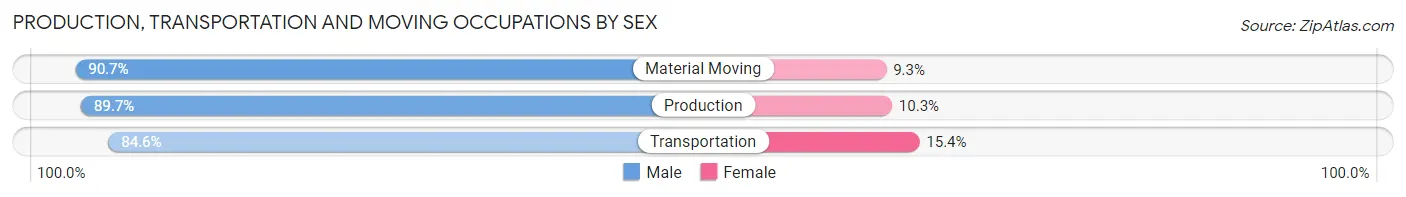
| Occupation | Male | Female |
| Production | 104 (89.7%) | 12 (10.3%) |
| Transportation | 66 (84.6%) | 12 (15.4%) |
| Material Moving | 39 (90.7%) | 4 (9.3%) |
| Total (Category) | 209 (88.2%) | 28 (11.8%) |
| Total (Overall) | 666 (55.4%) | 537 (44.6%) |
Employment Industries by Sex in Bloomfield
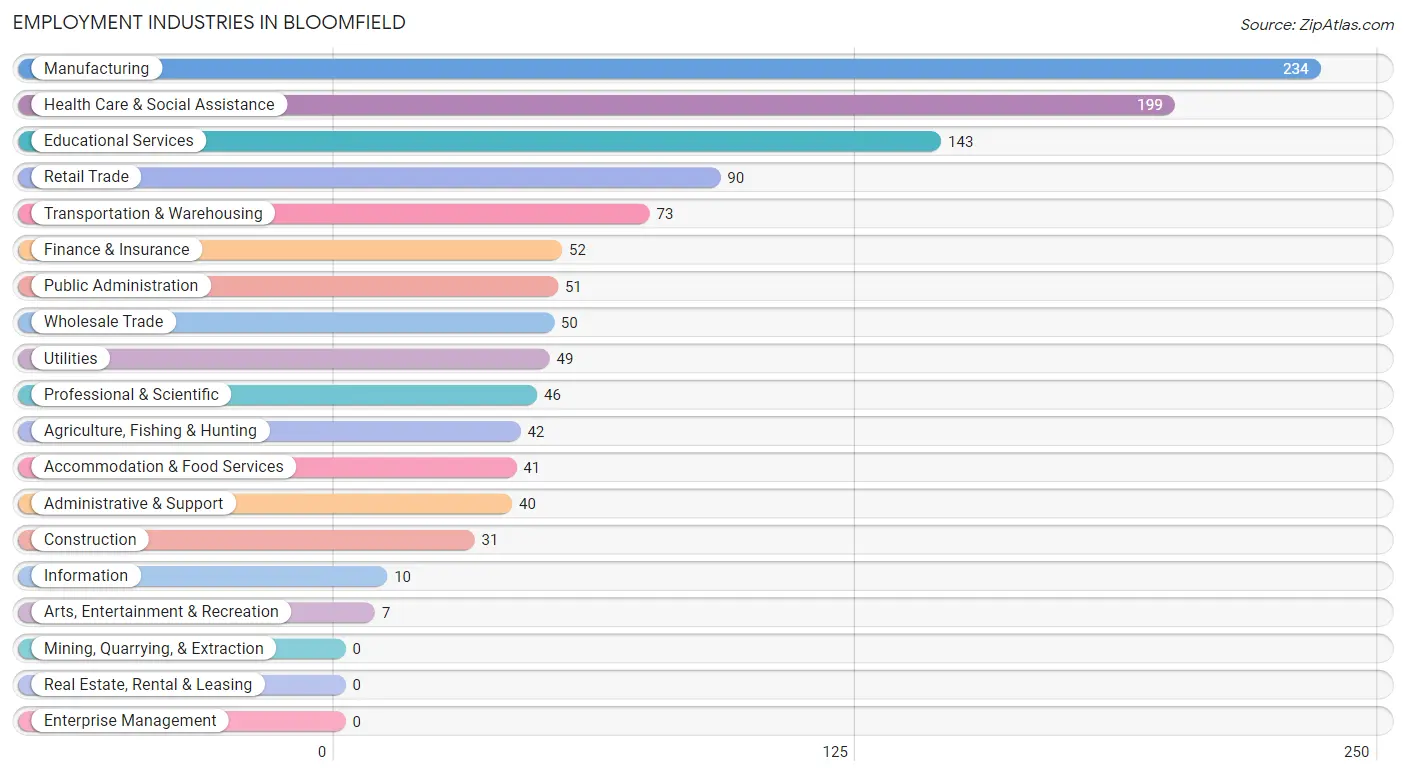
Employment Industries in Bloomfield
The major employment industries in Bloomfield include Manufacturing (234 | 19.5%), Health Care & Social Assistance (199 | 16.5%), Educational Services (143 | 11.9%), Retail Trade (90 | 7.5%), and Transportation & Warehousing (73 | 6.1%).
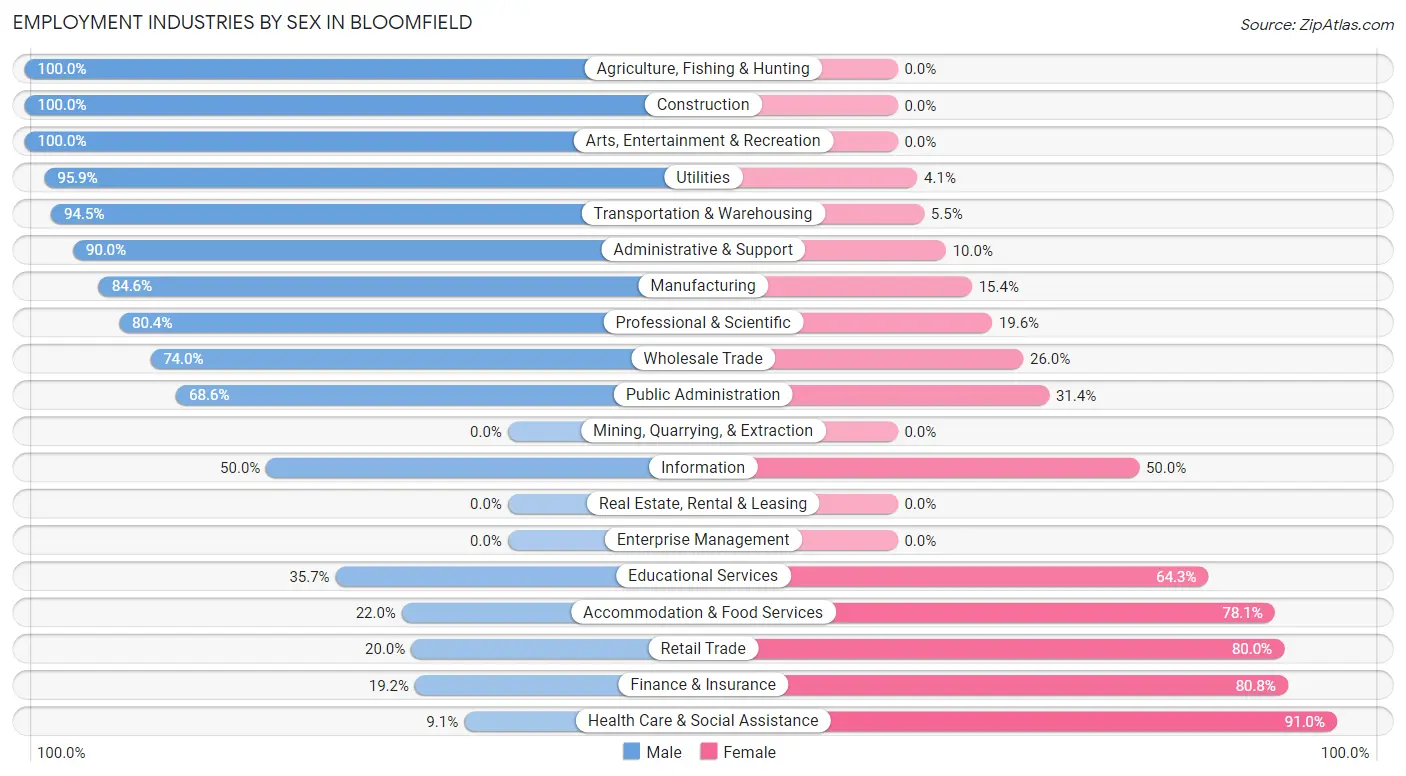
Employment Industries by Sex in Bloomfield
The Bloomfield industries that see more men than women are Agriculture, Fishing & Hunting (100.0%), Construction (100.0%), and Arts, Entertainment & Recreation (100.0%), whereas the industries that tend to have a higher number of women are Health Care & Social Assistance (90.9%), Finance & Insurance (80.8%), and Retail Trade (80.0%).
| Industry | Male | Female |
| Agriculture, Fishing & Hunting | 42 (100.0%) | 0 (0.0%) |
| Mining, Quarrying, & Extraction | 0 (0.0%) | 0 (0.0%) |
| Construction | 31 (100.0%) | 0 (0.0%) |
| Manufacturing | 198 (84.6%) | 36 (15.4%) |
| Wholesale Trade | 37 (74.0%) | 13 (26.0%) |
| Retail Trade | 18 (20.0%) | 72 (80.0%) |
| Transportation & Warehousing | 69 (94.5%) | 4 (5.5%) |
| Utilities | 47 (95.9%) | 2 (4.1%) |
| Information | 5 (50.0%) | 5 (50.0%) |
| Finance & Insurance | 10 (19.2%) | 42 (80.8%) |
| Real Estate, Rental & Leasing | 0 (0.0%) | 0 (0.0%) |
| Professional & Scientific | 37 (80.4%) | 9 (19.6%) |
| Enterprise Management | 0 (0.0%) | 0 (0.0%) |
| Administrative & Support | 36 (90.0%) | 4 (10.0%) |
| Educational Services | 51 (35.7%) | 92 (64.3%) |
| Health Care & Social Assistance | 18 (9.0%) | 181 (90.9%) |
| Arts, Entertainment & Recreation | 7 (100.0%) | 0 (0.0%) |
| Accommodation & Food Services | 9 (22.0%) | 32 (78.0%) |
| Public Administration | 35 (68.6%) | 16 (31.4%) |
| Total | 666 (55.4%) | 537 (44.6%) |
Education in Bloomfield
School Enrollment in Bloomfield
The most common levels of schooling among the 640 students in Bloomfield are middle school (163 | 25.5%), high school (151 | 23.6%), and elementary school (147 | 23.0%).
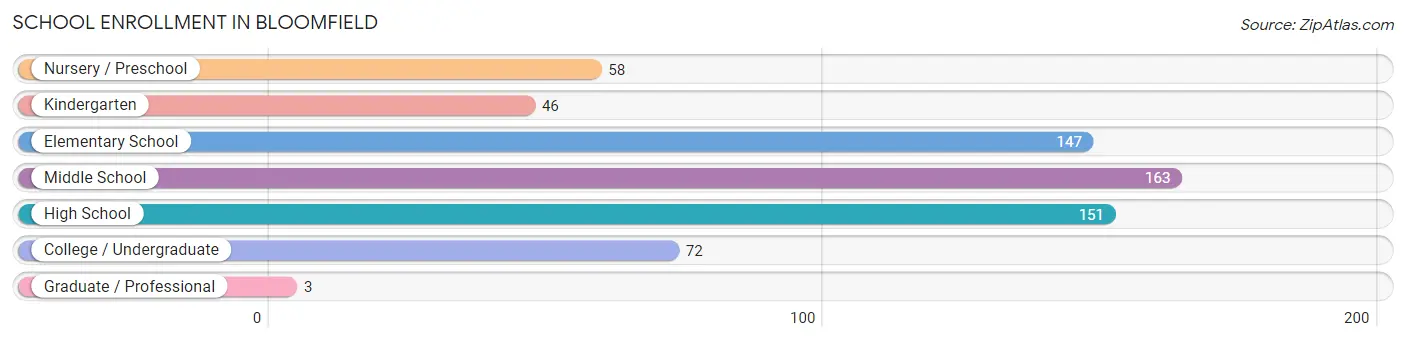
| School Level | # Students | % Students |
| Nursery / Preschool | 58 | 9.1% |
| Kindergarten | 46 | 7.2% |
| Elementary School | 147 | 23.0% |
| Middle School | 163 | 25.5% |
| High School | 151 | 23.6% |
| College / Undergraduate | 72 | 11.3% |
| Graduate / Professional | 3 | 0.5% |
| Total | 640 | 100.0% |
School Enrollment by Age by Funding Source in Bloomfield
Out of a total of 640 students who are enrolled in schools in Bloomfield, 43 (6.7%) attend a private institution, while the remaining 597 (93.3%) are enrolled in public schools. The age group of 18 to 19 year olds has the highest likelihood of being enrolled in private schools, with 8 (25.8% in the age bracket) enrolled. Conversely, the age group of 20 to 24 year olds has the lowest likelihood of being enrolled in a private school, with 27 (100.0% in the age bracket) attending a public institution.
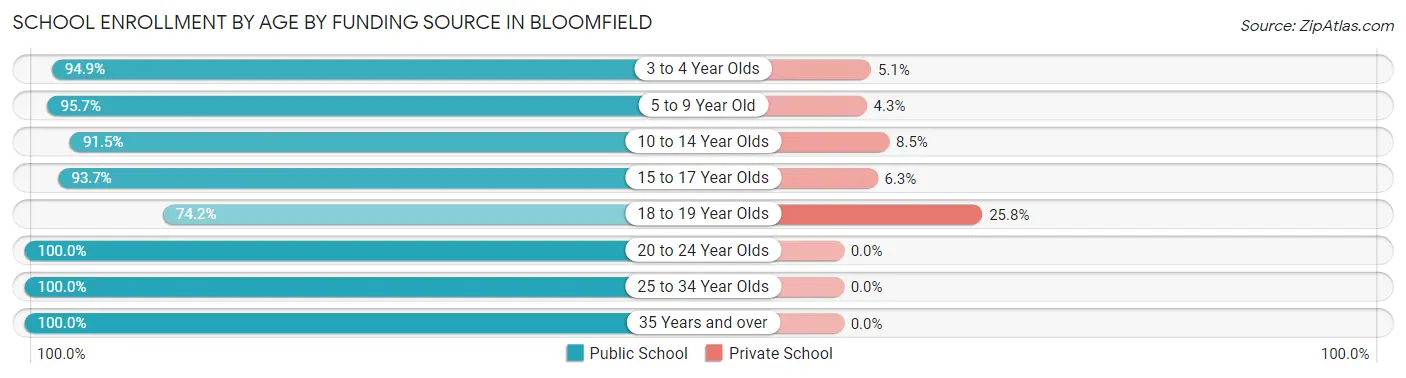
| Age Bracket | Public School | Private School |
| 3 to 4 Year Olds | 56 (94.9%) | 3 (5.1%) |
| 5 to 9 Year Old | 179 (95.7%) | 8 (4.3%) |
| 10 to 14 Year Olds | 184 (91.5%) | 17 (8.5%) |
| 15 to 17 Year Olds | 104 (93.7%) | 7 (6.3%) |
| 18 to 19 Year Olds | 23 (74.2%) | 8 (25.8%) |
| 20 to 24 Year Olds | 27 (100.0%) | 0 (0.0%) |
| 25 to 34 Year Olds | 3 (100.0%) | 0 (0.0%) |
| 35 Years and over | 21 (100.0%) | 0 (0.0%) |
| Total | 597 (93.3%) | 43 (6.7%) |
Educational Attainment by Field of Study in Bloomfield
Education (180 | 31.0%), bio, nature & agricultural (89 | 15.3%), business (84 | 14.5%), psychology (47 | 8.1%), and arts & humanities (44 | 7.6%) are the most common fields of study among 581 individuals in Bloomfield who have obtained a bachelor's degree or higher.
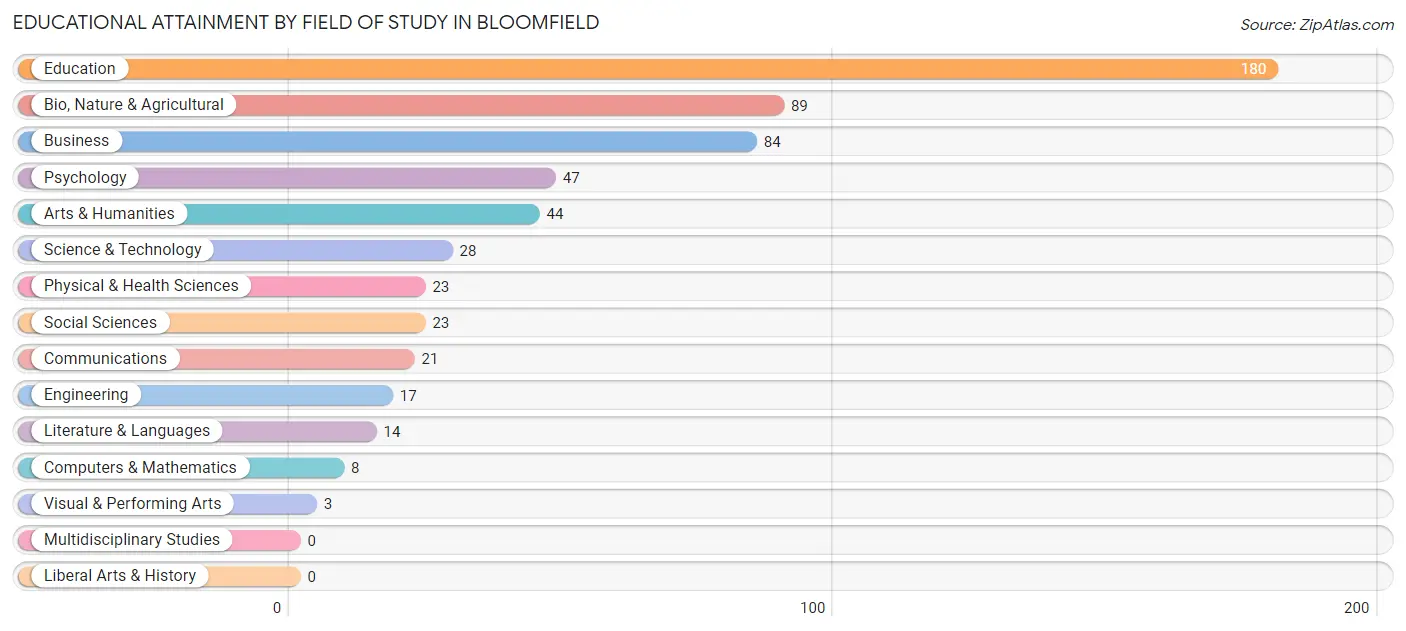
| Field of Study | # Graduates | % Graduates |
| Computers & Mathematics | 8 | 1.4% |
| Bio, Nature & Agricultural | 89 | 15.3% |
| Physical & Health Sciences | 23 | 4.0% |
| Psychology | 47 | 8.1% |
| Social Sciences | 23 | 4.0% |
| Engineering | 17 | 2.9% |
| Multidisciplinary Studies | 0 | 0.0% |
| Science & Technology | 28 | 4.8% |
| Business | 84 | 14.5% |
| Education | 180 | 31.0% |
| Literature & Languages | 14 | 2.4% |
| Liberal Arts & History | 0 | 0.0% |
| Visual & Performing Arts | 3 | 0.5% |
| Communications | 21 | 3.6% |
| Arts & Humanities | 44 | 7.6% |
| Total | 581 | 100.0% |
Transportation & Commute in Bloomfield
Vehicle Availability by Sex in Bloomfield
The most prevalent vehicle ownership categories in Bloomfield are males with 2 vehicles (283, accounting for 43.1%) and females with 2 vehicles (204, making up 52.7%).
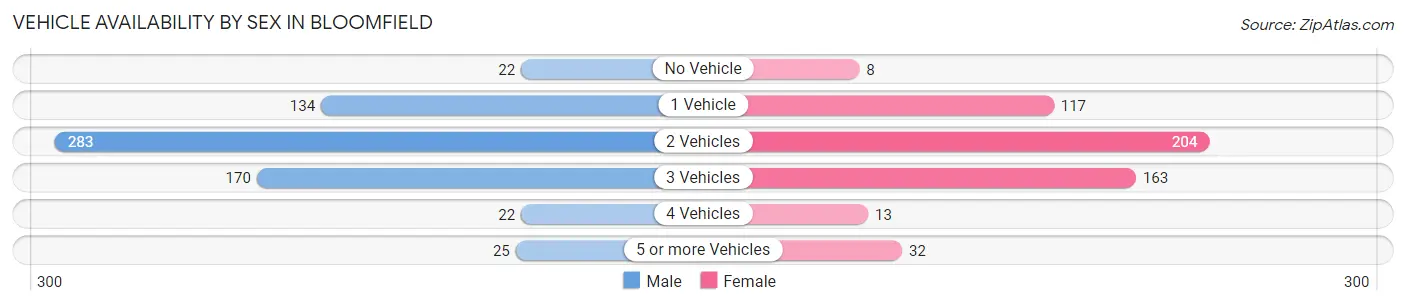
| Vehicles Available | Male | Female |
| No Vehicle | 22 (3.4%) | 8 (1.5%) |
| 1 Vehicle | 134 (20.4%) | 117 (21.8%) |
| 2 Vehicles | 283 (43.1%) | 204 (38.0%) |
| 3 Vehicles | 170 (25.9%) | 163 (30.3%) |
| 4 Vehicles | 22 (3.4%) | 13 (2.4%) |
| 5 or more Vehicles | 25 (3.8%) | 32 (6.0%) |
| Total | 656 (100.0%) | 537 (100.0%) |
Commute Time in Bloomfield
The most frequently occuring commute durations in Bloomfield are 5 to 9 minutes (284 commuters, 25.0%), less than 5 minutes (179 commuters, 15.7%), and 10 to 14 minutes (132 commuters, 11.6%).
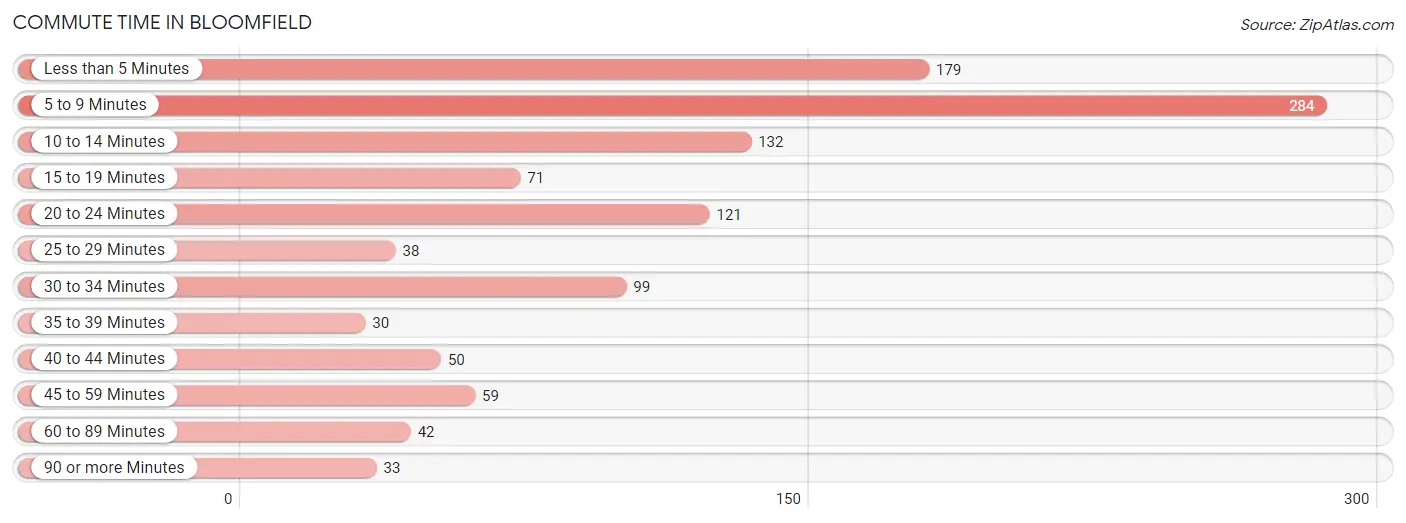
| Commute Time | # Commuters | % Commuters |
| Less than 5 Minutes | 179 | 15.7% |
| 5 to 9 Minutes | 284 | 25.0% |
| 10 to 14 Minutes | 132 | 11.6% |
| 15 to 19 Minutes | 71 | 6.2% |
| 20 to 24 Minutes | 121 | 10.6% |
| 25 to 29 Minutes | 38 | 3.3% |
| 30 to 34 Minutes | 99 | 8.7% |
| 35 to 39 Minutes | 30 | 2.6% |
| 40 to 44 Minutes | 50 | 4.4% |
| 45 to 59 Minutes | 59 | 5.2% |
| 60 to 89 Minutes | 42 | 3.7% |
| 90 or more Minutes | 33 | 2.9% |
Commute Time by Sex in Bloomfield
The most common commute times in Bloomfield are 20 to 24 minutes (110 commuters, 17.4%) for males and 5 to 9 minutes (185 commuters, 36.6%) for females.
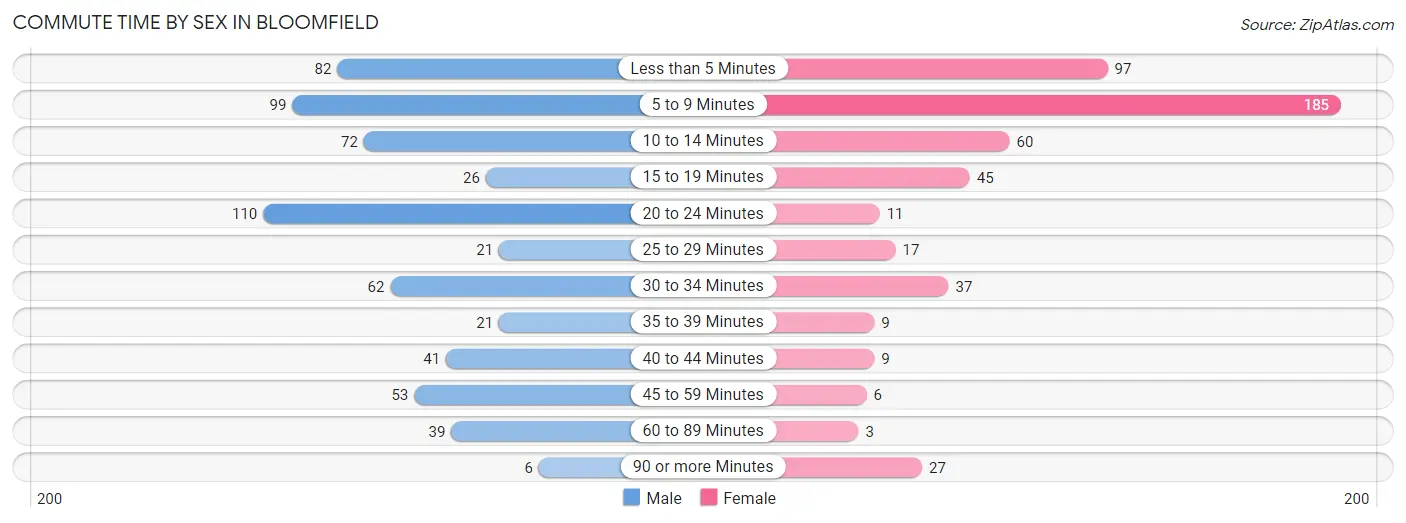
| Commute Time | Male | Female |
| Less than 5 Minutes | 82 (13.0%) | 97 (19.2%) |
| 5 to 9 Minutes | 99 (15.7%) | 185 (36.6%) |
| 10 to 14 Minutes | 72 (11.4%) | 60 (11.9%) |
| 15 to 19 Minutes | 26 (4.1%) | 45 (8.9%) |
| 20 to 24 Minutes | 110 (17.4%) | 11 (2.2%) |
| 25 to 29 Minutes | 21 (3.3%) | 17 (3.4%) |
| 30 to 34 Minutes | 62 (9.8%) | 37 (7.3%) |
| 35 to 39 Minutes | 21 (3.3%) | 9 (1.8%) |
| 40 to 44 Minutes | 41 (6.5%) | 9 (1.8%) |
| 45 to 59 Minutes | 53 (8.4%) | 6 (1.2%) |
| 60 to 89 Minutes | 39 (6.2%) | 3 (0.6%) |
| 90 or more Minutes | 6 (0.9%) | 27 (5.3%) |
Time of Departure to Work by Sex in Bloomfield
The most frequent times of departure to work in Bloomfield are 6:00 AM to 6:29 AM (122, 19.3%) for males and 7:30 AM to 7:59 AM (121, 23.9%) for females.
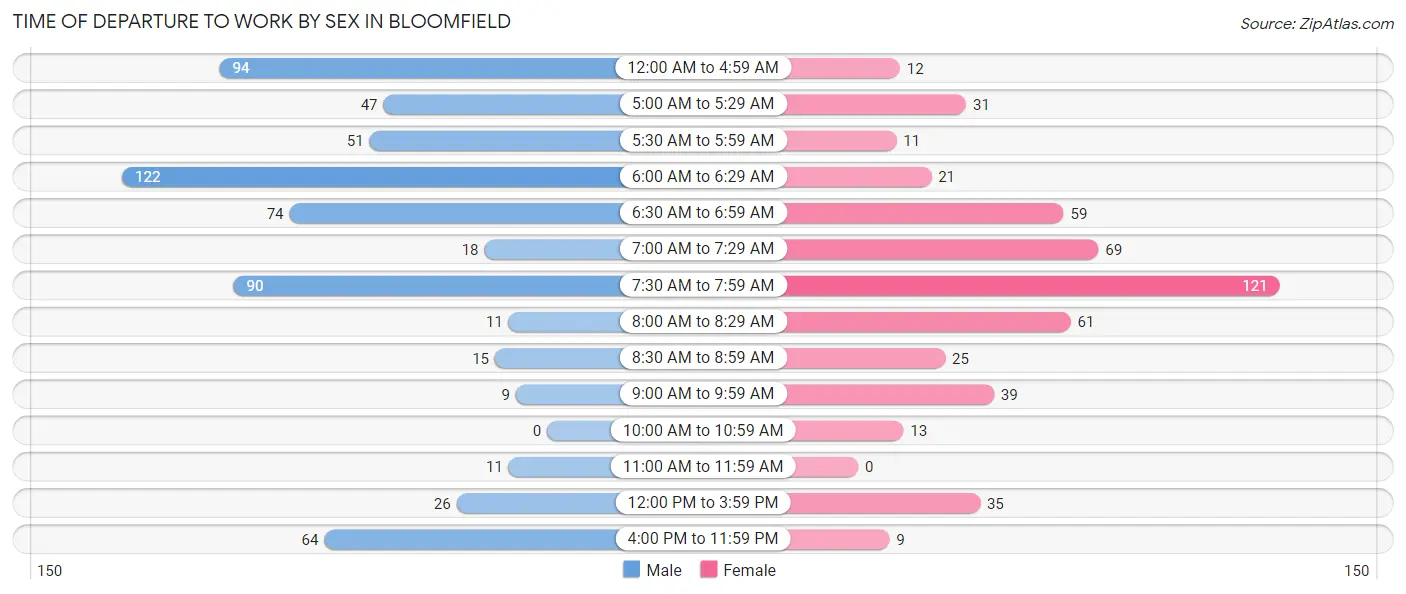
| Time of Departure | Male | Female |
| 12:00 AM to 4:59 AM | 94 (14.9%) | 12 (2.4%) |
| 5:00 AM to 5:29 AM | 47 (7.4%) | 31 (6.1%) |
| 5:30 AM to 5:59 AM | 51 (8.1%) | 11 (2.2%) |
| 6:00 AM to 6:29 AM | 122 (19.3%) | 21 (4.2%) |
| 6:30 AM to 6:59 AM | 74 (11.7%) | 59 (11.7%) |
| 7:00 AM to 7:29 AM | 18 (2.9%) | 69 (13.6%) |
| 7:30 AM to 7:59 AM | 90 (14.2%) | 121 (23.9%) |
| 8:00 AM to 8:29 AM | 11 (1.7%) | 61 (12.1%) |
| 8:30 AM to 8:59 AM | 15 (2.4%) | 25 (4.9%) |
| 9:00 AM to 9:59 AM | 9 (1.4%) | 39 (7.7%) |
| 10:00 AM to 10:59 AM | 0 (0.0%) | 13 (2.6%) |
| 11:00 AM to 11:59 AM | 11 (1.7%) | 0 (0.0%) |
| 12:00 PM to 3:59 PM | 26 (4.1%) | 35 (6.9%) |
| 4:00 PM to 11:59 PM | 64 (10.1%) | 9 (1.8%) |
| Total | 632 (100.0%) | 506 (100.0%) |
Housing Occupancy in Bloomfield
Occupancy by Ownership in Bloomfield
Of the total 1,105 dwellings in Bloomfield, owner-occupied units account for 779 (70.5%), while renter-occupied units make up 326 (29.5%).
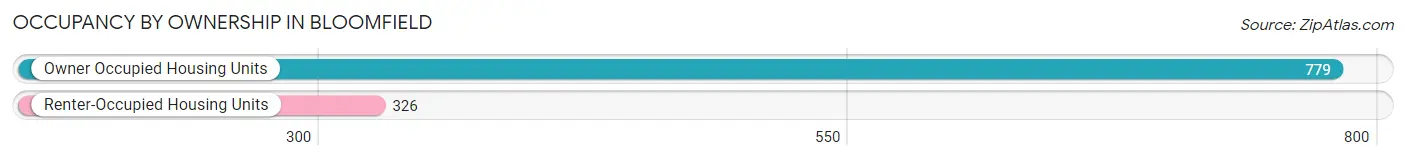
| Occupancy | # Housing Units | % Housing Units |
| Owner Occupied Housing Units | 779 | 70.5% |
| Renter-Occupied Housing Units | 326 | 29.5% |
| Total Occupied Housing Units | 1,105 | 100.0% |
Occupancy by Household Size in Bloomfield

| Household Size | # Housing Units | % Housing Units |
| 1-Person Household | 348 | 31.5% |
| 2-Person Household | 361 | 32.7% |
| 3-Person Household | 151 | 13.7% |
| 4+ Person Household | 245 | 22.2% |
| Total Housing Units | 1,105 | 100.0% |
Occupancy by Ownership by Household Size in Bloomfield
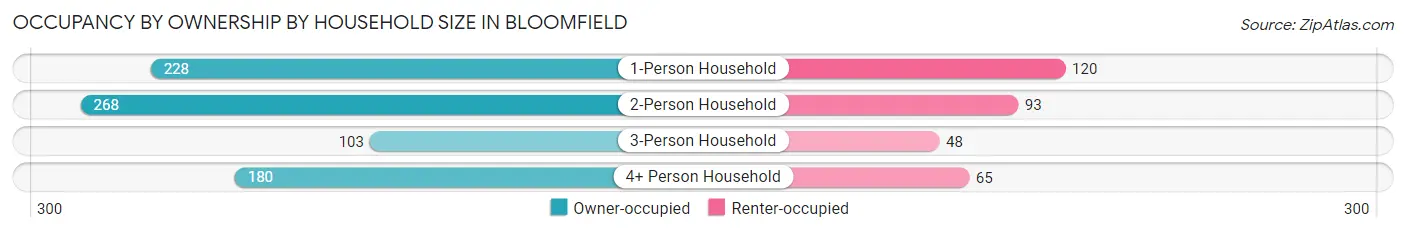
| Household Size | Owner-occupied | Renter-occupied |
| 1-Person Household | 228 (65.5%) | 120 (34.5%) |
| 2-Person Household | 268 (74.2%) | 93 (25.8%) |
| 3-Person Household | 103 (68.2%) | 48 (31.8%) |
| 4+ Person Household | 180 (73.5%) | 65 (26.5%) |
| Total Housing Units | 779 (70.5%) | 326 (29.5%) |
Occupancy by Educational Attainment in Bloomfield
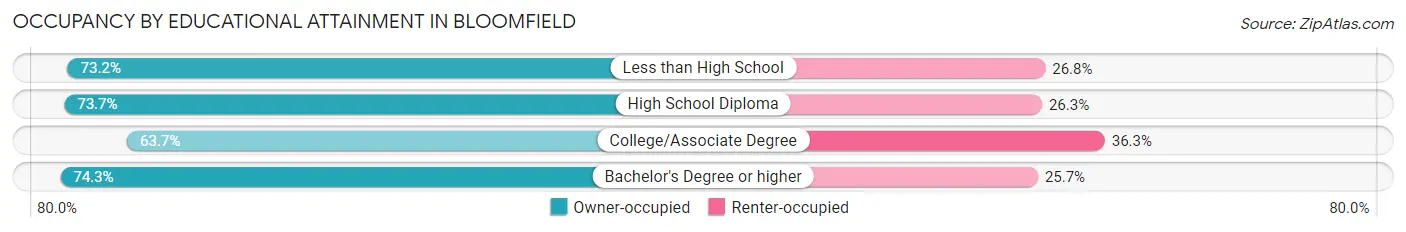
| Household Size | Owner-occupied | Renter-occupied |
| Less than High School | 30 (73.2%) | 11 (26.8%) |
| High School Diploma | 255 (73.7%) | 91 (26.3%) |
| College/Associate Degree | 239 (63.7%) | 136 (36.3%) |
| Bachelor's Degree or higher | 255 (74.3%) | 88 (25.7%) |
Occupancy by Age of Householder in Bloomfield
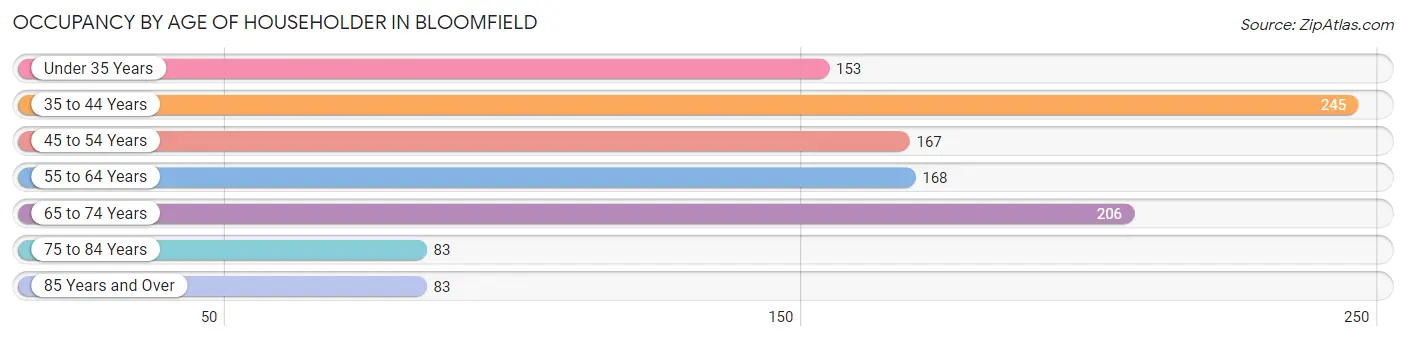
| Age Bracket | # Households | % Households |
| Under 35 Years | 153 | 13.9% |
| 35 to 44 Years | 245 | 22.2% |
| 45 to 54 Years | 167 | 15.1% |
| 55 to 64 Years | 168 | 15.2% |
| 65 to 74 Years | 206 | 18.6% |
| 75 to 84 Years | 83 | 7.5% |
| 85 Years and Over | 83 | 7.5% |
| Total | 1,105 | 100.0% |
Housing Finances in Bloomfield
Median Income by Occupancy in Bloomfield
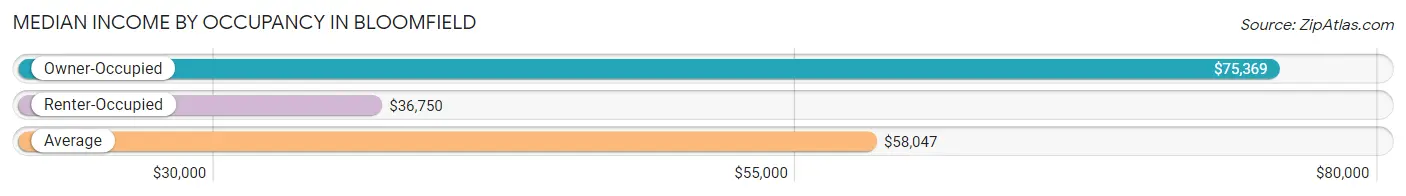
| Occupancy Type | # Households | Median Income |
| Owner-Occupied | 779 (70.5%) | $75,369 |
| Renter-Occupied | 326 (29.5%) | $36,750 |
| Average | 1,105 (100.0%) | $58,047 |
Occupancy by Householder Income Bracket in Bloomfield
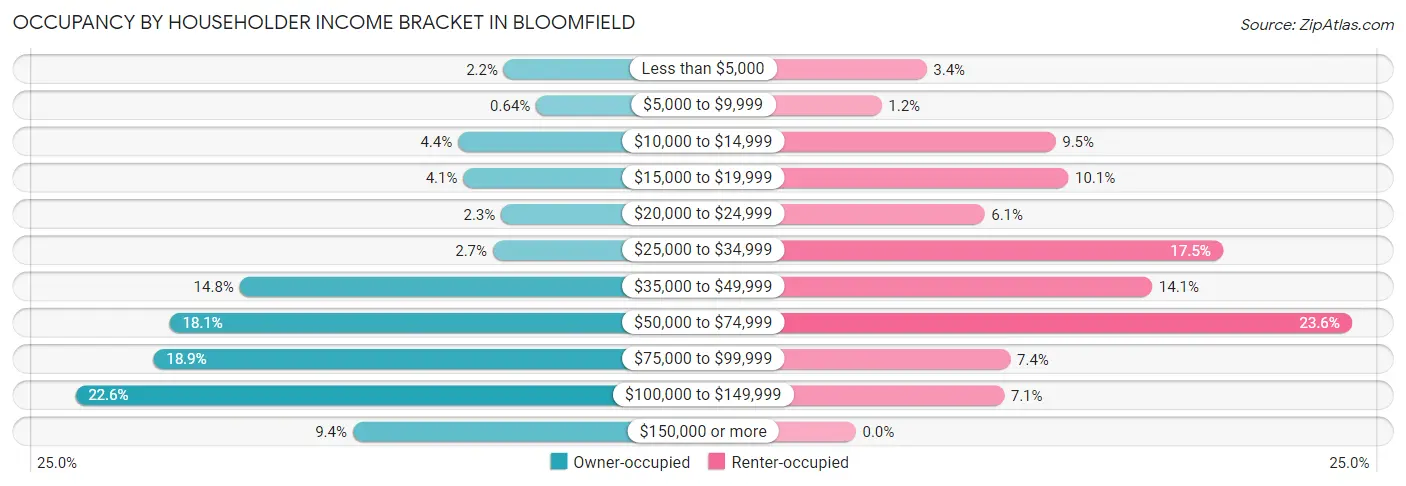
| Income Bracket | Owner-occupied | Renter-occupied |
| Less than $5,000 | 17 (2.2%) | 11 (3.4%) |
| $5,000 to $9,999 | 5 (0.6%) | 4 (1.2%) |
| $10,000 to $14,999 | 34 (4.4%) | 31 (9.5%) |
| $15,000 to $19,999 | 32 (4.1%) | 33 (10.1%) |
| $20,000 to $24,999 | 18 (2.3%) | 20 (6.1%) |
| $25,000 to $34,999 | 21 (2.7%) | 57 (17.5%) |
| $35,000 to $49,999 | 115 (14.8%) | 46 (14.1%) |
| $50,000 to $74,999 | 141 (18.1%) | 77 (23.6%) |
| $75,000 to $99,999 | 147 (18.9%) | 24 (7.4%) |
| $100,000 to $149,999 | 176 (22.6%) | 23 (7.1%) |
| $150,000 or more | 73 (9.4%) | 0 (0.0%) |
| Total | 779 (100.0%) | 326 (100.0%) |
Monthly Housing Cost Tiers in Bloomfield
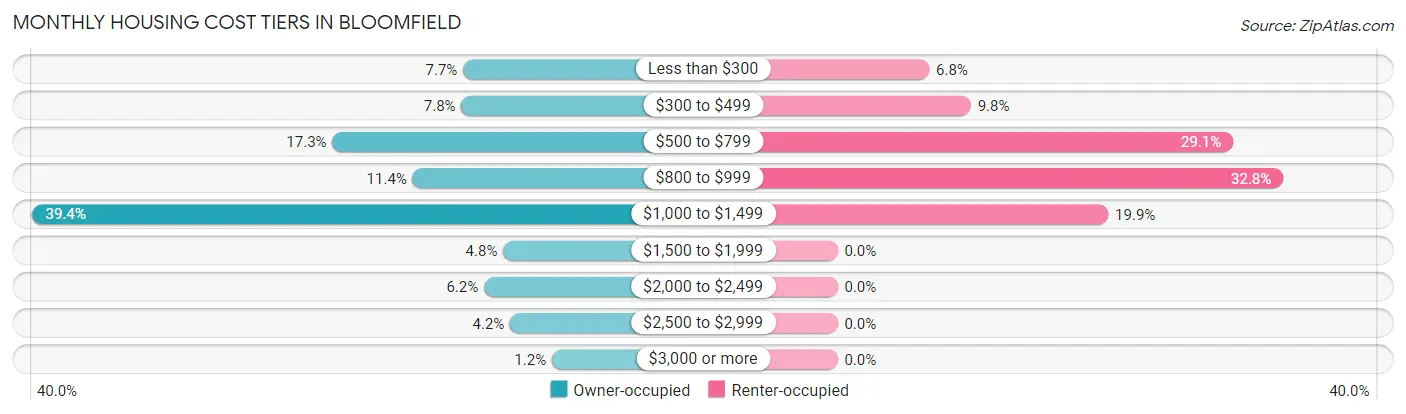
| Monthly Cost | Owner-occupied | Renter-occupied |
| Less than $300 | 60 (7.7%) | 22 (6.8%) |
| $300 to $499 | 61 (7.8%) | 32 (9.8%) |
| $500 to $799 | 135 (17.3%) | 95 (29.1%) |
| $800 to $999 | 89 (11.4%) | 107 (32.8%) |
| $1,000 to $1,499 | 307 (39.4%) | 65 (19.9%) |
| $1,500 to $1,999 | 37 (4.8%) | 0 (0.0%) |
| $2,000 to $2,499 | 48 (6.2%) | 0 (0.0%) |
| $2,500 to $2,999 | 33 (4.2%) | 0 (0.0%) |
| $3,000 or more | 9 (1.2%) | 0 (0.0%) |
| Total | 779 (100.0%) | 326 (100.0%) |
Physical Housing Characteristics in Bloomfield
Housing Structures in Bloomfield
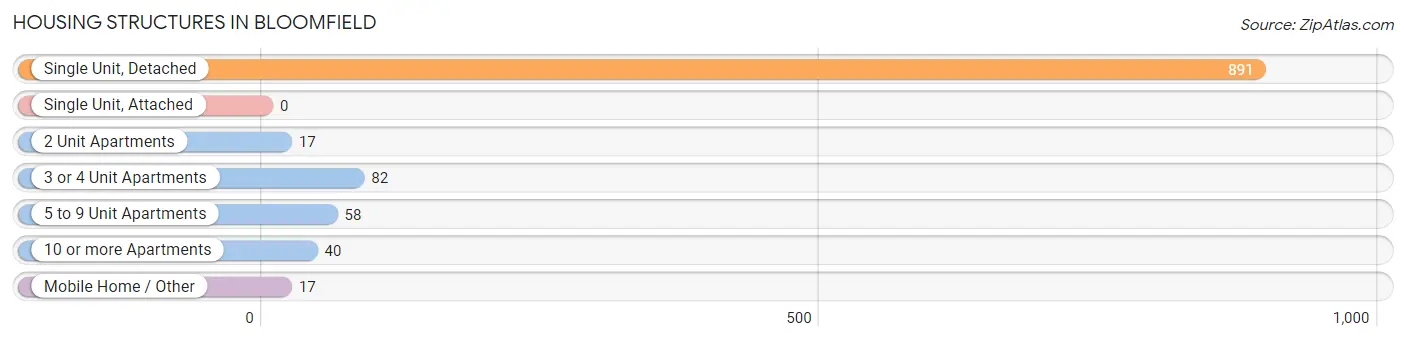
| Structure Type | # Housing Units | % Housing Units |
| Single Unit, Detached | 891 | 80.6% |
| Single Unit, Attached | 0 | 0.0% |
| 2 Unit Apartments | 17 | 1.5% |
| 3 or 4 Unit Apartments | 82 | 7.4% |
| 5 to 9 Unit Apartments | 58 | 5.2% |
| 10 or more Apartments | 40 | 3.6% |
| Mobile Home / Other | 17 | 1.5% |
| Total | 1,105 | 100.0% |
Housing Structures by Occupancy in Bloomfield
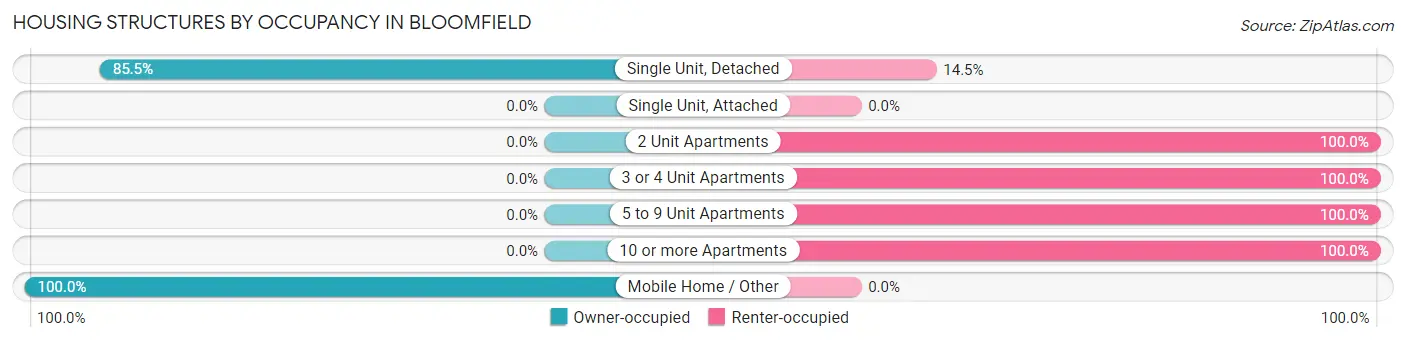
| Structure Type | Owner-occupied | Renter-occupied |
| Single Unit, Detached | 762 (85.5%) | 129 (14.5%) |
| Single Unit, Attached | 0 (0.0%) | 0 (0.0%) |
| 2 Unit Apartments | 0 (0.0%) | 17 (100.0%) |
| 3 or 4 Unit Apartments | 0 (0.0%) | 82 (100.0%) |
| 5 to 9 Unit Apartments | 0 (0.0%) | 58 (100.0%) |
| 10 or more Apartments | 0 (0.0%) | 40 (100.0%) |
| Mobile Home / Other | 17 (100.0%) | 0 (0.0%) |
| Total | 779 (70.5%) | 326 (29.5%) |
Housing Structures by Number of Rooms in Bloomfield
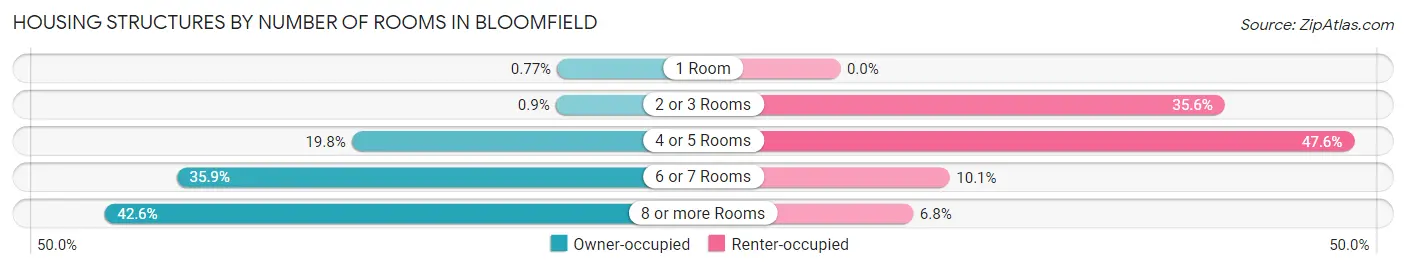
| Number of Rooms | Owner-occupied | Renter-occupied |
| 1 Room | 6 (0.8%) | 0 (0.0%) |
| 2 or 3 Rooms | 7 (0.9%) | 116 (35.6%) |
| 4 or 5 Rooms | 154 (19.8%) | 155 (47.5%) |
| 6 or 7 Rooms | 280 (35.9%) | 33 (10.1%) |
| 8 or more Rooms | 332 (42.6%) | 22 (6.8%) |
| Total | 779 (100.0%) | 326 (100.0%) |
Housing Structure by Heating Type in Bloomfield
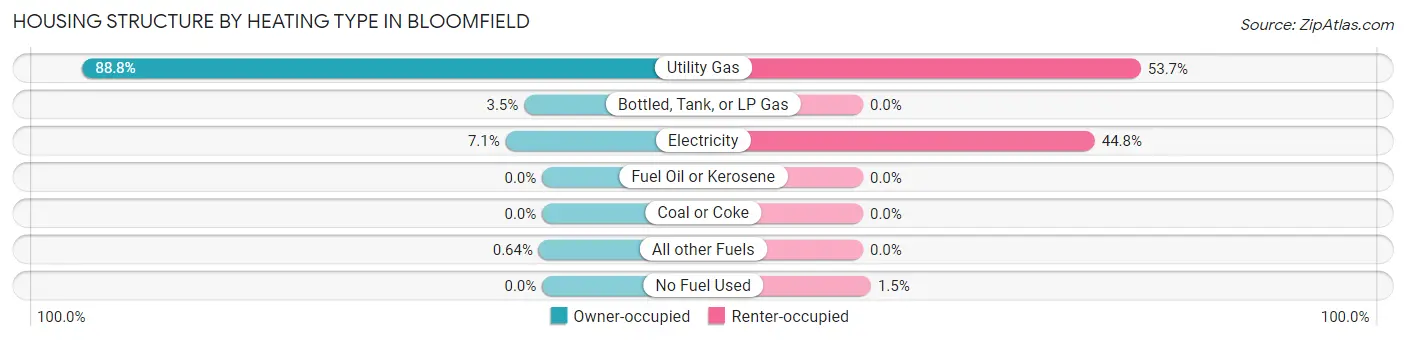
| Heating Type | Owner-occupied | Renter-occupied |
| Utility Gas | 692 (88.8%) | 175 (53.7%) |
| Bottled, Tank, or LP Gas | 27 (3.5%) | 0 (0.0%) |
| Electricity | 55 (7.1%) | 146 (44.8%) |
| Fuel Oil or Kerosene | 0 (0.0%) | 0 (0.0%) |
| Coal or Coke | 0 (0.0%) | 0 (0.0%) |
| All other Fuels | 5 (0.6%) | 0 (0.0%) |
| No Fuel Used | 0 (0.0%) | 5 (1.5%) |
| Total | 779 (100.0%) | 326 (100.0%) |
Household Vehicle Usage in Bloomfield
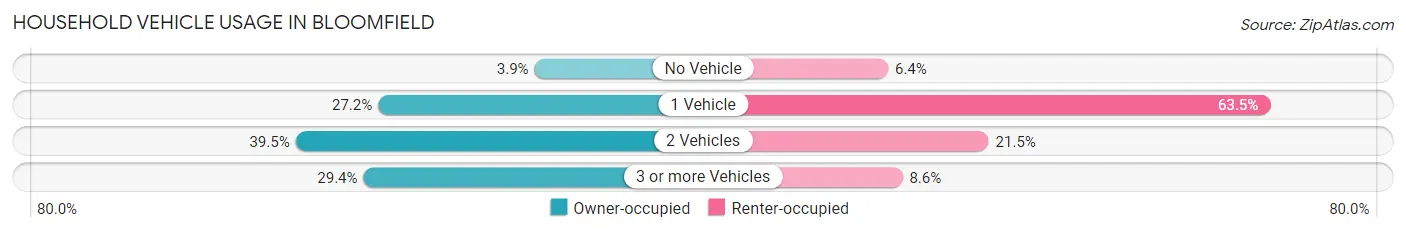
| Vehicles per Household | Owner-occupied | Renter-occupied |
| No Vehicle | 30 (3.8%) | 21 (6.4%) |
| 1 Vehicle | 212 (27.2%) | 207 (63.5%) |
| 2 Vehicles | 308 (39.5%) | 70 (21.5%) |
| 3 or more Vehicles | 229 (29.4%) | 28 (8.6%) |
| Total | 779 (100.0%) | 326 (100.0%) |
Real Estate & Mortgages in Bloomfield
Real Estate and Mortgage Overview in Bloomfield
| Characteristic | Without Mortgage | With Mortgage |
| Housing Units | 276 | 503 |
| Median Property Value | $83,300 | $133,600 |
| Median Household Income | $66,667 | $59 |
| Monthly Housing Costs | $549 | $9 |
| Real Estate Taxes | $1,877 | $3 |
Property Value by Mortgage Status in Bloomfield
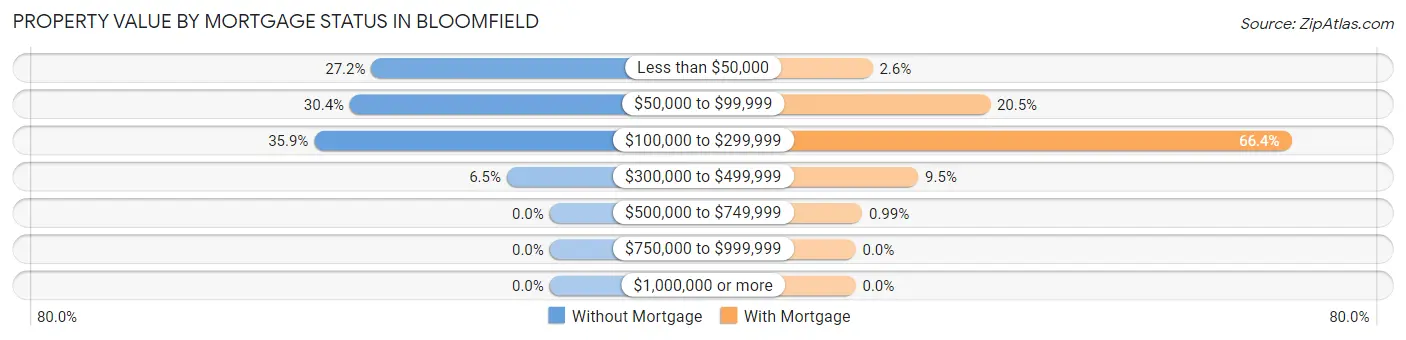
| Property Value | Without Mortgage | With Mortgage |
| Less than $50,000 | 75 (27.2%) | 13 (2.6%) |
| $50,000 to $99,999 | 84 (30.4%) | 103 (20.5%) |
| $100,000 to $299,999 | 99 (35.9%) | 334 (66.4%) |
| $300,000 to $499,999 | 18 (6.5%) | 48 (9.5%) |
| $500,000 to $749,999 | 0 (0.0%) | 5 (1.0%) |
| $750,000 to $999,999 | 0 (0.0%) | 0 (0.0%) |
| $1,000,000 or more | 0 (0.0%) | 0 (0.0%) |
| Total | 276 (100.0%) | 503 (100.0%) |
Household Income by Mortgage Status in Bloomfield
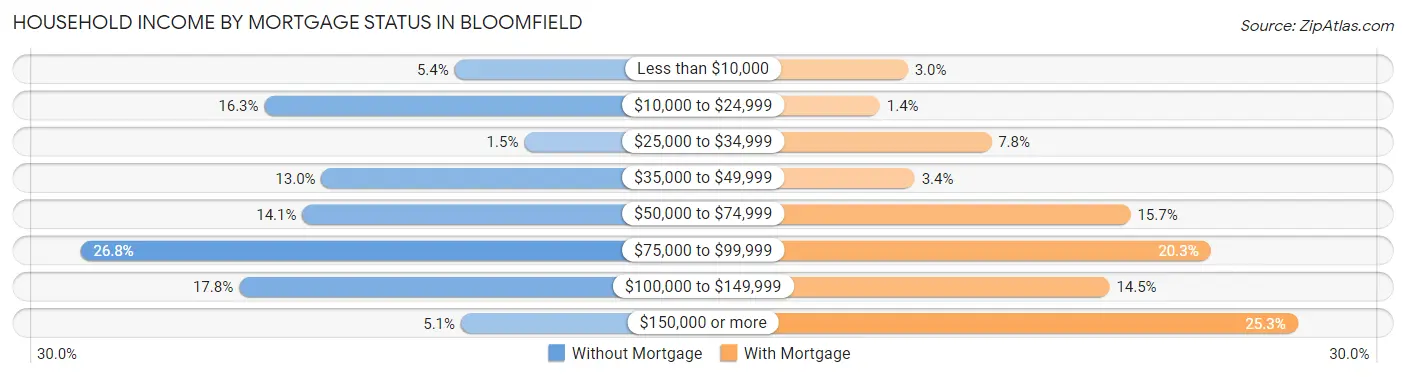
| Household Income | Without Mortgage | With Mortgage |
| Less than $10,000 | 15 (5.4%) | 15 (3.0%) |
| $10,000 to $24,999 | 45 (16.3%) | 7 (1.4%) |
| $25,000 to $34,999 | 4 (1.5%) | 39 (7.7%) |
| $35,000 to $49,999 | 36 (13.0%) | 17 (3.4%) |
| $50,000 to $74,999 | 39 (14.1%) | 79 (15.7%) |
| $75,000 to $99,999 | 74 (26.8%) | 102 (20.3%) |
| $100,000 to $149,999 | 49 (17.7%) | 73 (14.5%) |
| $150,000 or more | 14 (5.1%) | 127 (25.3%) |
| Total | 276 (100.0%) | 503 (100.0%) |
Property Value to Household Income Ratio in Bloomfield
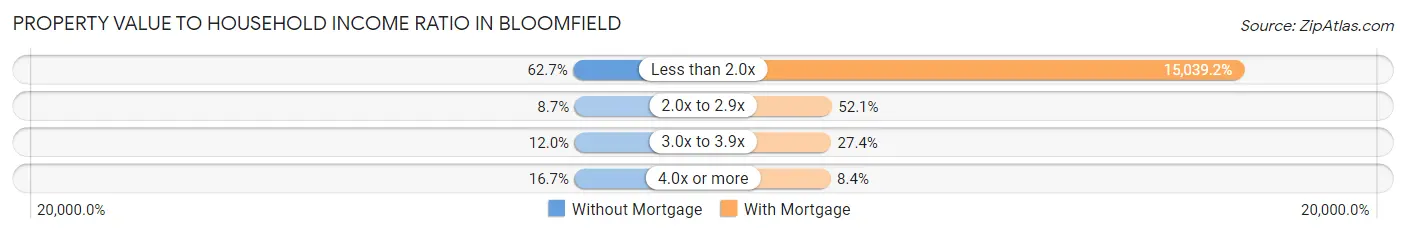
| Value-to-Income Ratio | Without Mortgage | With Mortgage |
| Less than 2.0x | 173 (62.7%) | 75,647 (15,039.2%) |
| 2.0x to 2.9x | 24 (8.7%) | 262 (52.1%) |
| 3.0x to 3.9x | 33 (12.0%) | 138 (27.4%) |
| 4.0x or more | 46 (16.7%) | 42 (8.4%) |
| Total | 276 (100.0%) | 503 (100.0%) |
Real Estate Taxes by Mortgage Status in Bloomfield
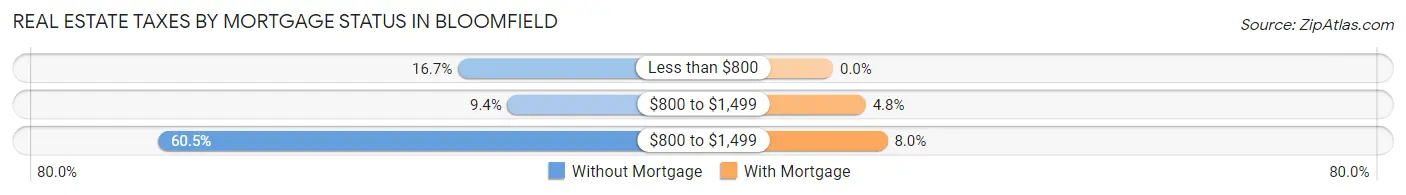
| Property Taxes | Without Mortgage | With Mortgage |
| Less than $800 | 46 (16.7%) | 0 (0.0%) |
| $800 to $1,499 | 26 (9.4%) | 24 (4.8%) |
| $800 to $1,499 | 167 (60.5%) | 40 (8.0%) |
| Total | 276 (100.0%) | 503 (100.0%) |
Health & Disability in Bloomfield
Health Insurance Coverage by Age in Bloomfield
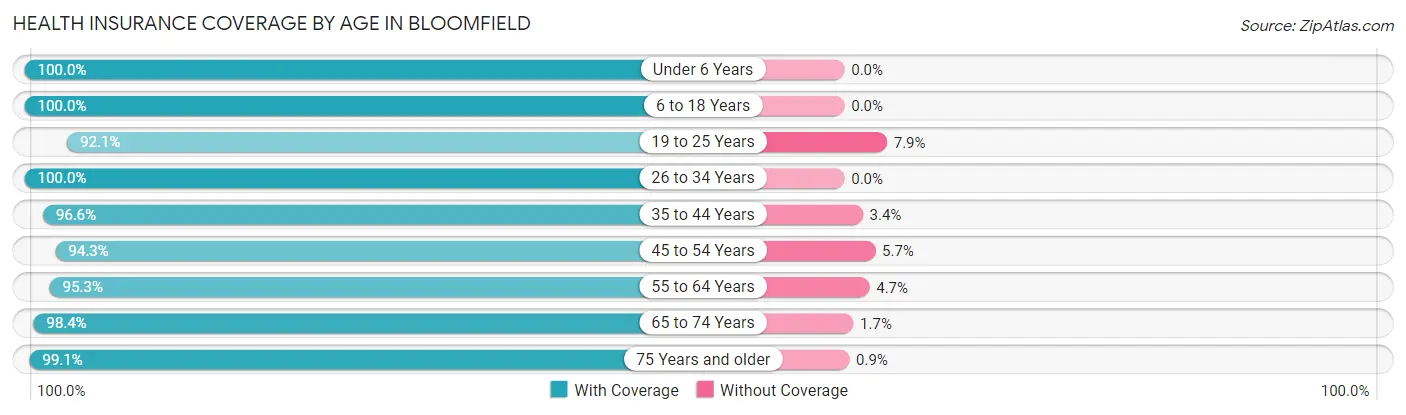
| Age Bracket | With Coverage | Without Coverage |
| Under 6 Years | 172 (100.0%) | 0 (0.0%) |
| 6 to 18 Years | 532 (100.0%) | 0 (0.0%) |
| 19 to 25 Years | 93 (92.1%) | 8 (7.9%) |
| 26 to 34 Years | 316 (100.0%) | 0 (0.0%) |
| 35 to 44 Years | 368 (96.6%) | 13 (3.4%) |
| 45 to 54 Years | 279 (94.3%) | 17 (5.7%) |
| 55 to 64 Years | 266 (95.3%) | 13 (4.7%) |
| 65 to 74 Years | 298 (98.4%) | 5 (1.7%) |
| 75 Years and older | 220 (99.1%) | 2 (0.9%) |
| Total | 2,544 (97.8%) | 58 (2.2%) |
Health Insurance Coverage by Citizenship Status in Bloomfield
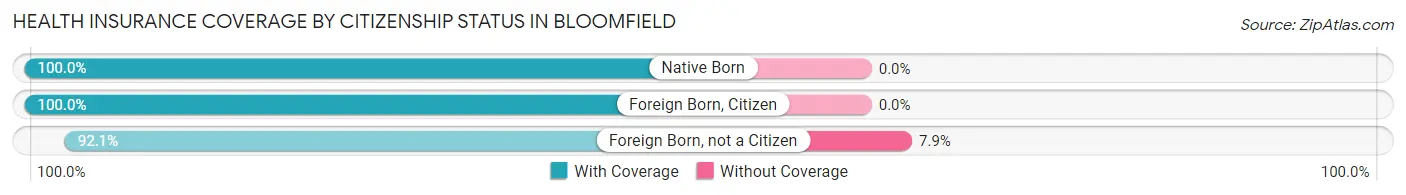
| Citizenship Status | With Coverage | Without Coverage |
| Native Born | 172 (100.0%) | 0 (0.0%) |
| Foreign Born, Citizen | 532 (100.0%) | 0 (0.0%) |
| Foreign Born, not a Citizen | 93 (92.1%) | 8 (7.9%) |
Health Insurance Coverage by Household Income in Bloomfield
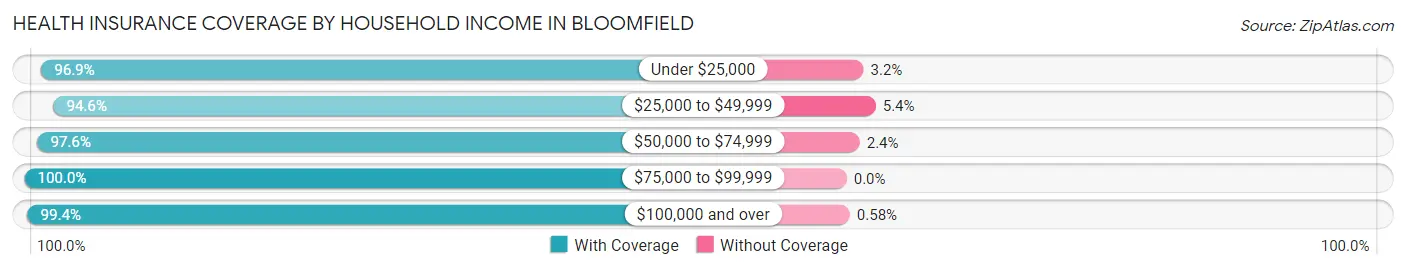
| Household Income | With Coverage | Without Coverage |
| Under $25,000 | 246 (96.9%) | 8 (3.2%) |
| $25,000 to $49,999 | 575 (94.6%) | 33 (5.4%) |
| $50,000 to $74,999 | 481 (97.6%) | 12 (2.4%) |
| $75,000 to $99,999 | 382 (100.0%) | 0 (0.0%) |
| $100,000 and over | 860 (99.4%) | 5 (0.6%) |
Public vs Private Health Insurance Coverage by Age in Bloomfield
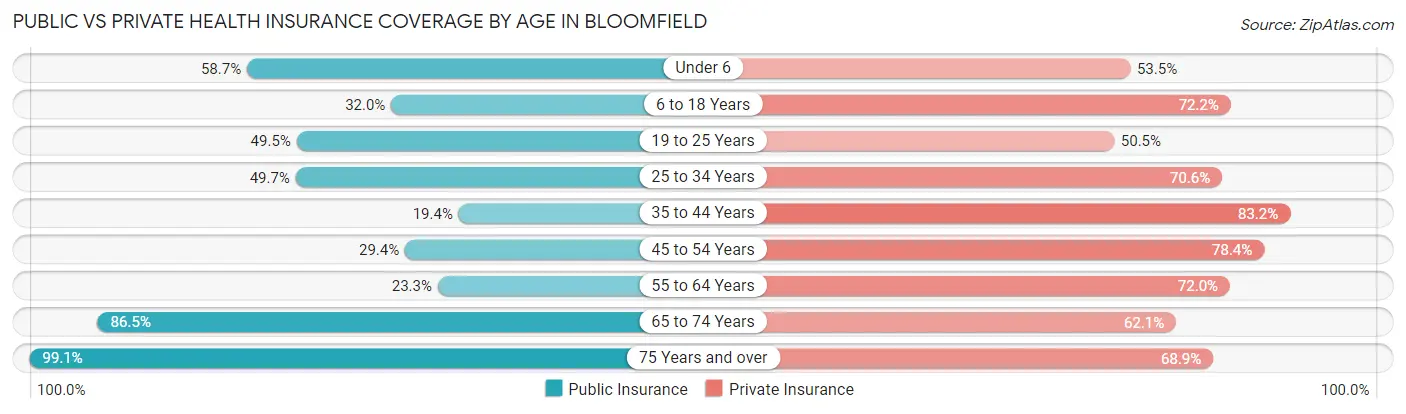
| Age Bracket | Public Insurance | Private Insurance |
| Under 6 | 101 (58.7%) | 92 (53.5%) |
| 6 to 18 Years | 170 (32.0%) | 384 (72.2%) |
| 19 to 25 Years | 50 (49.5%) | 51 (50.5%) |
| 25 to 34 Years | 157 (49.7%) | 223 (70.6%) |
| 35 to 44 Years | 74 (19.4%) | 317 (83.2%) |
| 45 to 54 Years | 87 (29.4%) | 232 (78.4%) |
| 55 to 64 Years | 65 (23.3%) | 201 (72.0%) |
| 65 to 74 Years | 262 (86.5%) | 188 (62.1%) |
| 75 Years and over | 220 (99.1%) | 153 (68.9%) |
| Total | 1,186 (45.6%) | 1,841 (70.8%) |
Disability Status by Sex by Age in Bloomfield
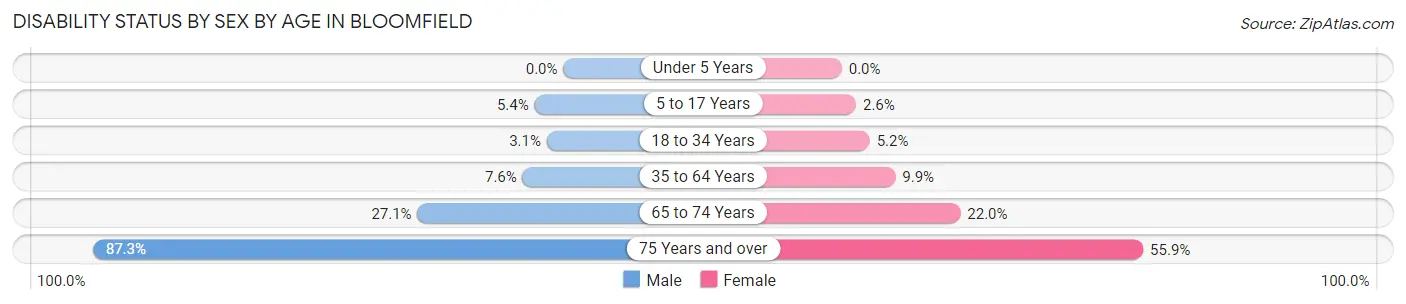
| Age Bracket | Male | Female |
| Under 5 Years | 0 (0.0%) | 0 (0.0%) |
| 5 to 17 Years | 13 (5.3%) | 8 (2.6%) |
| 18 to 34 Years | 7 (3.1%) | 11 (5.2%) |
| 35 to 64 Years | 35 (7.6%) | 49 (9.9%) |
| 65 to 74 Years | 39 (27.1%) | 35 (22.0%) |
| 75 Years and over | 69 (87.3%) | 80 (55.9%) |
Disability Class by Sex by Age in Bloomfield
Disability Class: Hearing Difficulty
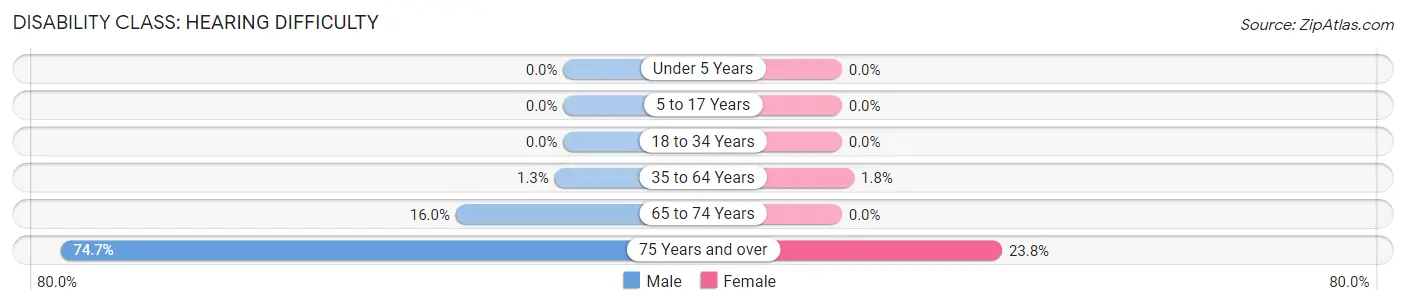
| Age Bracket | Male | Female |
| Under 5 Years | 0 (0.0%) | 0 (0.0%) |
| 5 to 17 Years | 0 (0.0%) | 0 (0.0%) |
| 18 to 34 Years | 0 (0.0%) | 0 (0.0%) |
| 35 to 64 Years | 6 (1.3%) | 9 (1.8%) |
| 65 to 74 Years | 23 (16.0%) | 0 (0.0%) |
| 75 Years and over | 59 (74.7%) | 34 (23.8%) |
Disability Class: Vision Difficulty
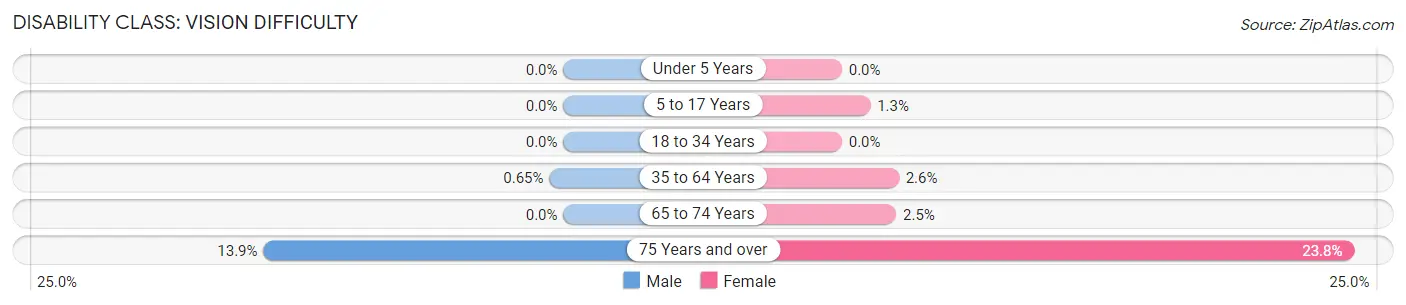
| Age Bracket | Male | Female |
| Under 5 Years | 0 (0.0%) | 0 (0.0%) |
| 5 to 17 Years | 0 (0.0%) | 4 (1.3%) |
| 18 to 34 Years | 0 (0.0%) | 0 (0.0%) |
| 35 to 64 Years | 3 (0.6%) | 13 (2.6%) |
| 65 to 74 Years | 0 (0.0%) | 4 (2.5%) |
| 75 Years and over | 11 (13.9%) | 34 (23.8%) |
Disability Class: Cognitive Difficulty
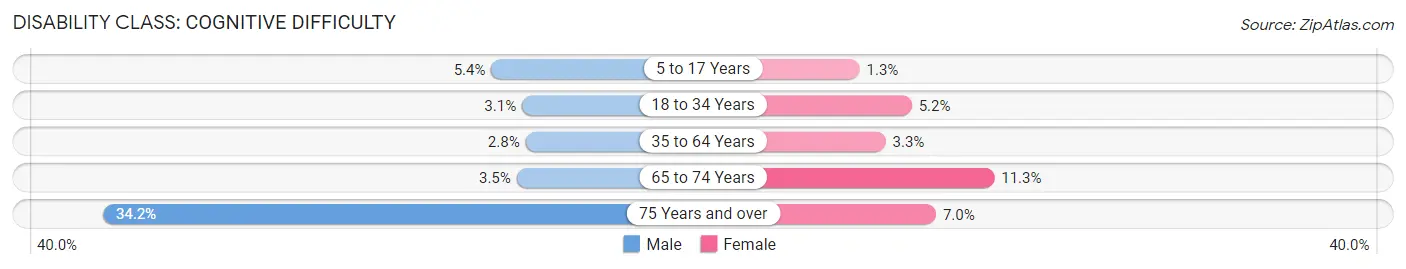
| Age Bracket | Male | Female |
| 5 to 17 Years | 13 (5.3%) | 4 (1.3%) |
| 18 to 34 Years | 7 (3.1%) | 11 (5.2%) |
| 35 to 64 Years | 13 (2.8%) | 16 (3.3%) |
| 65 to 74 Years | 5 (3.5%) | 18 (11.3%) |
| 75 Years and over | 27 (34.2%) | 10 (7.0%) |
Disability Class: Ambulatory Difficulty
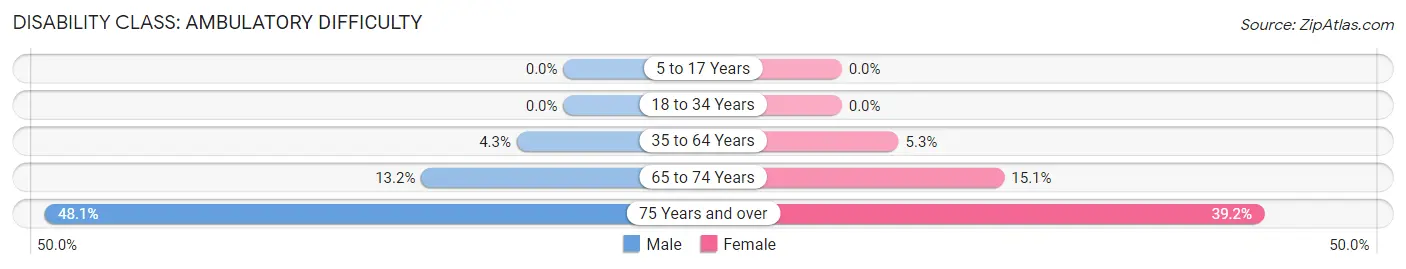
| Age Bracket | Male | Female |
| 5 to 17 Years | 0 (0.0%) | 0 (0.0%) |
| 18 to 34 Years | 0 (0.0%) | 0 (0.0%) |
| 35 to 64 Years | 20 (4.3%) | 26 (5.3%) |
| 65 to 74 Years | 19 (13.2%) | 24 (15.1%) |
| 75 Years and over | 38 (48.1%) | 56 (39.2%) |
Disability Class: Self-Care Difficulty
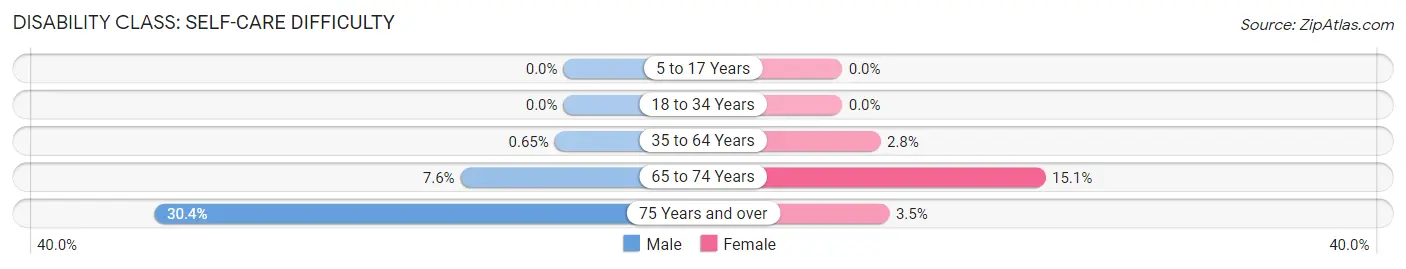
| Age Bracket | Male | Female |
| 5 to 17 Years | 0 (0.0%) | 0 (0.0%) |
| 18 to 34 Years | 0 (0.0%) | 0 (0.0%) |
| 35 to 64 Years | 3 (0.6%) | 14 (2.8%) |
| 65 to 74 Years | 11 (7.6%) | 24 (15.1%) |
| 75 Years and over | 24 (30.4%) | 5 (3.5%) |
Technology Access in Bloomfield
Computing Device Access in Bloomfield
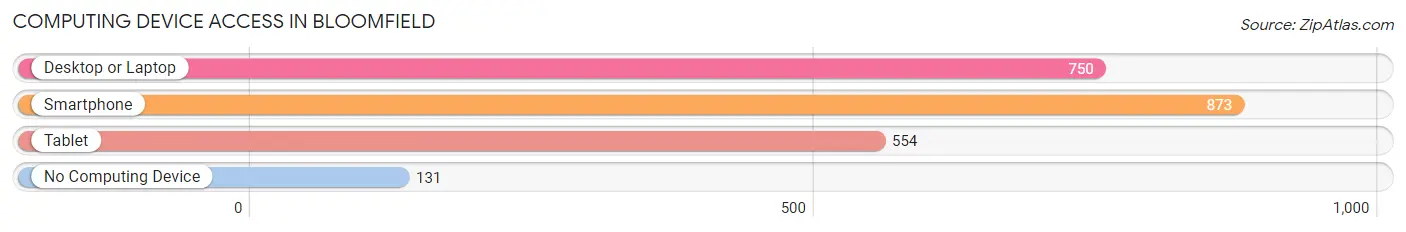
| Device Type | # Households | % Households |
| Desktop or Laptop | 750 | 67.9% |
| Smartphone | 873 | 79.0% |
| Tablet | 554 | 50.1% |
| No Computing Device | 131 | 11.9% |
| Total | 1,105 | 100.0% |
Internet Access in Bloomfield
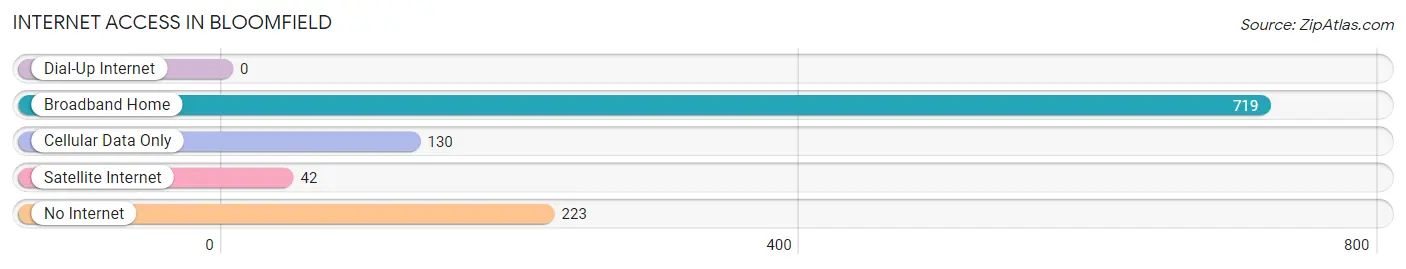
| Internet Type | # Households | % Households |
| Dial-Up Internet | 0 | 0.0% |
| Broadband Home | 719 | 65.1% |
| Cellular Data Only | 130 | 11.8% |
| Satellite Internet | 42 | 3.8% |
| No Internet | 223 | 20.2% |
| Total | 1,105 | 100.0% |
Bloomfield Summary
Bloomfield, Iowa is a small city located in Davis County, Iowa. It is situated in the southeastern corner of the state, about 40 miles south of Des Moines. The city has a population of approximately 3,000 people and is the county seat of Davis County.
History
The area that is now Bloomfield was first settled in 1837 by a group of settlers from Kentucky. The town was originally known as “Bloomfield Station” and was named after the nearby Bloomfield Creek. The town was officially incorporated in 1855 and was named after the creek.
In the late 19th century, Bloomfield was a thriving agricultural community. The town was home to several grain mills, a creamery, and a canning factory. The town also had a number of churches, schools, and other businesses.
In the early 20th century, Bloomfield experienced a period of growth and prosperity. The town was home to several banks, a movie theater, and a number of other businesses. The town also had a number of churches, schools, and other organizations.
Geography
Bloomfield is located in the southeastern corner of Iowa, about 40 miles south of Des Moines. The city is situated in the rolling hills of the Loess Hills region. The city is located on the banks of the Des Moines River and is surrounded by farmland.
The climate in Bloomfield is generally mild, with hot summers and cold winters. The average annual temperature is around 50 degrees Fahrenheit. The average annual precipitation is around 36 inches.
Economy
The economy of Bloomfield is largely based on agriculture. The city is home to several grain mills, a creamery, and a canning factory. The city also has a number of businesses, including a bank, a movie theater, and a number of other businesses.
The city is also home to a number of manufacturing companies, including a furniture factory, a plastics factory, and a printing company. The city also has a number of retail stores, including a grocery store, a hardware store, and a number of other stores.
Demographics
As of the 2010 census, the population of Bloomfield was 3,000. The racial makeup of the city was 97.3% White, 0.7% African American, 0.3% Native American, 0.3% Asian, and 1.4% from other races. The median household income was $41,250 and the median family income was $50,000.
The city is home to a number of churches, including the First United Methodist Church, the First Presbyterian Church, and the First Baptist Church. The city also has a number of schools, including the Bloomfield Elementary School, the Bloomfield Middle School, and the Bloomfield High School.
Conclusion
Bloomfield, Iowa is a small city located in Davis County, Iowa. It is situated in the southeastern corner of the state, about 40 miles south of Des Moines. The city has a population of approximately 3,000 people and is the county seat of Davis County. The economy of Bloomfield is largely based on agriculture, with a number of businesses, churches, and schools. The racial makeup of the city is 97.3% White, 0.7% African American, 0.3% Native American, 0.3% Asian, and 1.4% from other races. The median household income was $41,250 and the median family income was $50,000. Bloomfield is a small city with a rich history and a bright future.
Common Questions
What is Per Capita Income in Bloomfield?
Per Capita income in Bloomfield is $30,240.
What is the Median Family Income in Bloomfield?
Median Family Income in Bloomfield is $66,818.
What is the Median Household income in Bloomfield?
Median Household Income in Bloomfield is $58,047.
What is Income or Wage Gap in Bloomfield?
Income or Wage Gap in Bloomfield is 21.8%.
Women in Bloomfield earn 78.2 cents for every dollar earned by a man.
What is Family Income Deficit in Bloomfield?
Family Income Deficit in Bloomfield is $6,850.
Families that are below poverty line in Bloomfield earn $6,850 less on average than the poverty threshold level.
What is Inequality or Gini Index in Bloomfield?
Inequality or Gini Index in Bloomfield is 0.37.
What is the Total Population of Bloomfield?
Total Population of Bloomfield is 2,687.
What is the Total Male Population of Bloomfield?
Total Male Population of Bloomfield is 1,256.
What is the Total Female Population of Bloomfield?
Total Female Population of Bloomfield is 1,431.
What is the Ratio of Males per 100 Females in Bloomfield?
There are 87.77 Males per 100 Females in Bloomfield.
What is the Ratio of Females per 100 Males in Bloomfield?
There are 113.93 Females per 100 Males in Bloomfield.
What is the Median Population Age in Bloomfield?
Median Population Age in Bloomfield is 39.6 Years.
What is the Average Family Size in Bloomfield
Average Family Size in Bloomfield is 2.9 People.
What is the Average Household Size in Bloomfield
Average Household Size in Bloomfield is 2.4 People.
How Large is the Labor Force in Bloomfield?
There are 1,225 People in the Labor Forcein in Bloomfield.
What is the Percentage of People in the Labor Force in Bloomfield?
59.0% of People are in the Labor Force in Bloomfield.
What is the Unemployment Rate in Bloomfield?
Unemployment Rate in Bloomfield is 1.8%.