Belmond, IA Map & Demographics
Belmond Map
Belmond Overview
$28,988
PER CAPITA INCOME
$59,792
AVG FAMILY INCOME
$55,233
AVG HOUSEHOLD INCOME
30.0%
WAGE / INCOME GAP [ % ]
70.0¢/ $1
WAGE / INCOME GAP [ $ ]
0.43
INEQUALITY / GINI INDEX
2,512
TOTAL POPULATION
1,172
MALE POPULATION
1,340
FEMALE POPULATION
87.46
MALES / 100 FEMALES
114.33
FEMALES / 100 MALES
38.8
MEDIAN AGE
3.0
AVG FAMILY SIZE
2.5
AVG HOUSEHOLD SIZE
898
LABOR FORCE [ PEOPLE ]
48.8%
PERCENT IN LABOR FORCE
3.7%
UNEMPLOYMENT RATE
Belmond Zip Codes
Belmond Area Codes
Income in Belmond
Income Overview in Belmond
Per Capita Income in Belmond is $28,988, while median incomes of families and households are $59,792 and $55,233 respectively.
| Characteristic | Number | Measure |
| Per Capita Income | 2,512 | $28,988 |
| Median Family Income | 650 | $59,792 |
| Mean Family Income | 650 | $80,669 |
| Median Household Income | 984 | $55,233 |
| Mean Household Income | 984 | $72,752 |
| Income Deficit | 650 | $0 |
| Wage / Income Gap (%) | 2,512 | 29.98% |
| Wage / Income Gap ($) | 2,512 | 70.02¢ per $1 |
| Gini / Inequality Index | 2,512 | 0.43 |
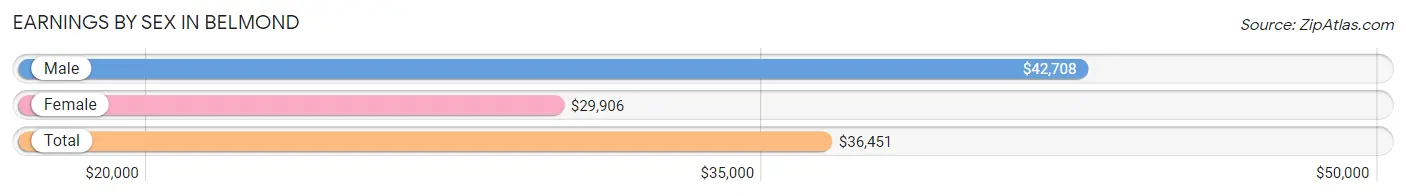
Earnings by Sex in Belmond
Average Earnings in Belmond are $36,451, $42,708 for men and $29,906 for women, a difference of 30.0%.
| Sex | Number | Average Earnings |
| Male | 472 (47.6%) | $42,708 |
| Female | 519 (52.4%) | $29,906 |
| Total | 991 (100.0%) | $36,451 |
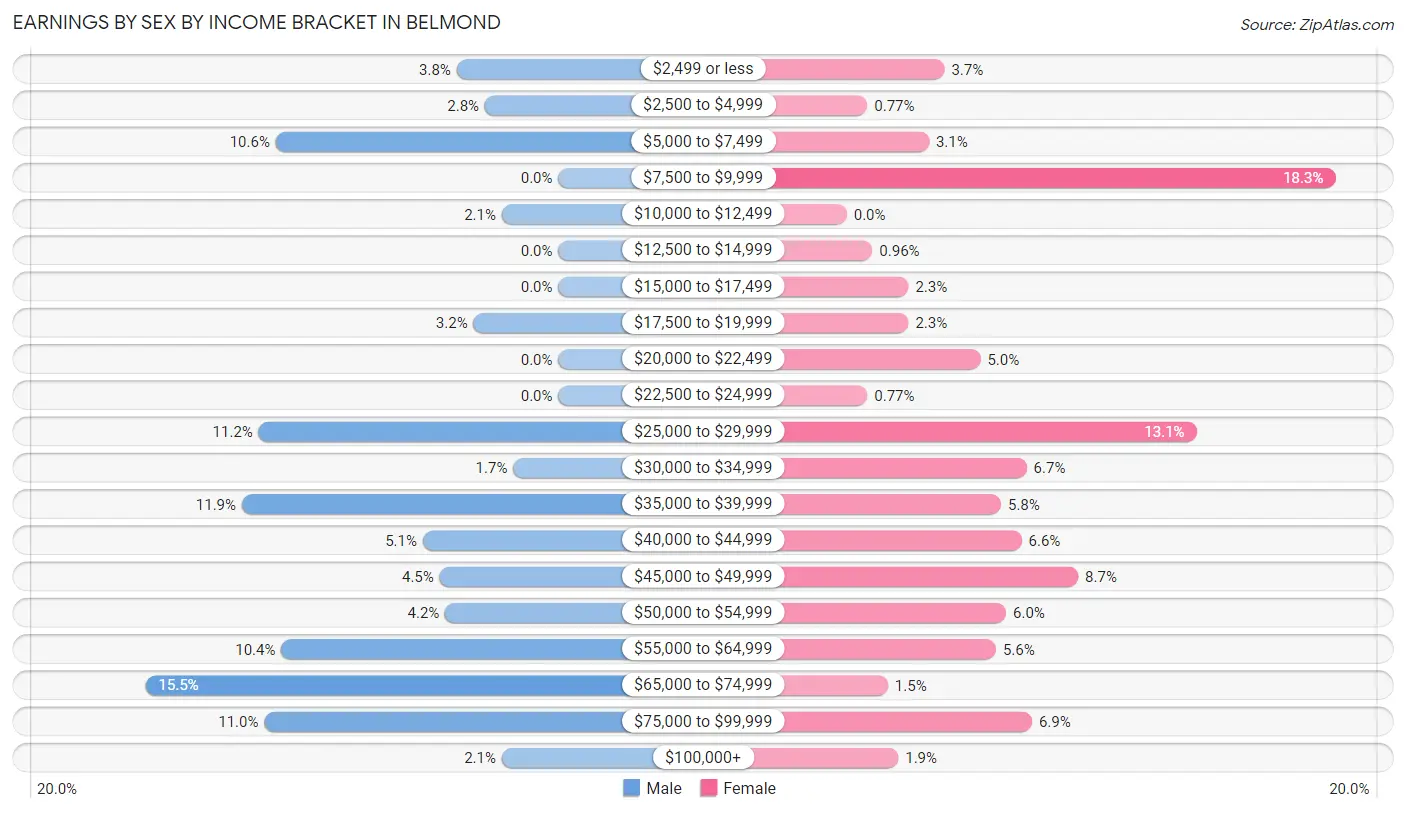
Earnings by Sex by Income Bracket in Belmond
The most common earnings brackets in Belmond are $65,000 to $74,999 for men (73 | 15.5%) and $7,500 to $9,999 for women (95 | 18.3%).
| Income | Male | Female |
| $2,499 or less | 18 (3.8%) | 19 (3.7%) |
| $2,500 to $4,999 | 13 (2.8%) | 4 (0.8%) |
| $5,000 to $7,499 | 50 (10.6%) | 16 (3.1%) |
| $7,500 to $9,999 | 0 (0.0%) | 95 (18.3%) |
| $10,000 to $12,499 | 10 (2.1%) | 0 (0.0%) |
| $12,500 to $14,999 | 0 (0.0%) | 5 (1.0%) |
| $15,000 to $17,499 | 0 (0.0%) | 12 (2.3%) |
| $17,500 to $19,999 | 15 (3.2%) | 12 (2.3%) |
| $20,000 to $22,499 | 0 (0.0%) | 26 (5.0%) |
| $22,500 to $24,999 | 0 (0.0%) | 4 (0.8%) |
| $25,000 to $29,999 | 53 (11.2%) | 68 (13.1%) |
| $30,000 to $34,999 | 8 (1.7%) | 35 (6.7%) |
| $35,000 to $39,999 | 56 (11.9%) | 30 (5.8%) |
| $40,000 to $44,999 | 24 (5.1%) | 34 (6.6%) |
| $45,000 to $49,999 | 21 (4.4%) | 45 (8.7%) |
| $50,000 to $54,999 | 20 (4.2%) | 31 (6.0%) |
| $55,000 to $64,999 | 49 (10.4%) | 29 (5.6%) |
| $65,000 to $74,999 | 73 (15.5%) | 8 (1.5%) |
| $75,000 to $99,999 | 52 (11.0%) | 36 (6.9%) |
| $100,000+ | 10 (2.1%) | 10 (1.9%) |
| Total | 472 (100.0%) | 519 (100.0%) |
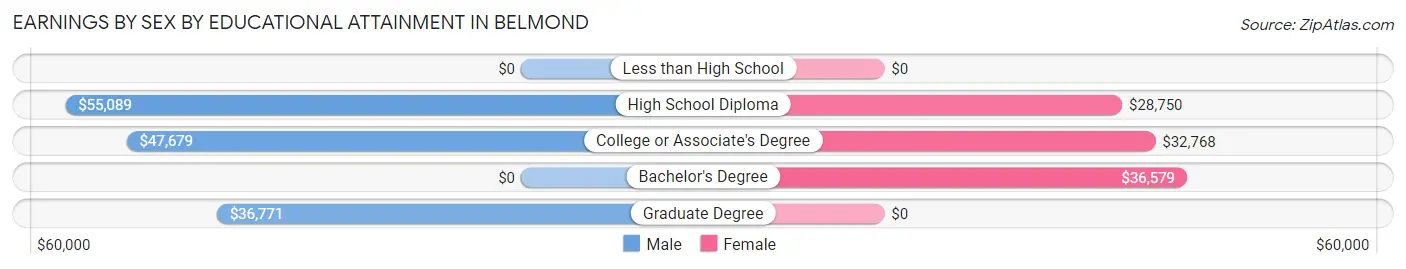
Earnings by Sex by Educational Attainment in Belmond
Average earnings in Belmond are $42,708 for men and $33,884 for women, a difference of 20.7%. Men with an educational attainment of high school diploma enjoy the highest average annual earnings of $55,089, while those with graduate degree education earn the least with $36,771. Women with an educational attainment of bachelor's degree earn the most with the average annual earnings of $36,579, while those with high school diploma education have the smallest earnings of $28,750.
| Educational Attainment | Male Income | Female Income |
| Less than High School | - | - |
| High School Diploma | $55,089 | $28,750 |
| College or Associate's Degree | $47,679 | $32,768 |
| Bachelor's Degree | - | - |
| Graduate Degree | $36,771 | $0 |
| Total | $42,708 | $33,884 |
Family Income in Belmond
Family Income Brackets in Belmond
According to the Belmond family income data, there are 139 families falling into the $50,000 to $74,999 income range, which is the most common income bracket and makes up 21.4% of all families. Conversely, the $10,000 to $14,999 income bracket is the least frequent group with only 9 families (1.4%) belonging to this category.
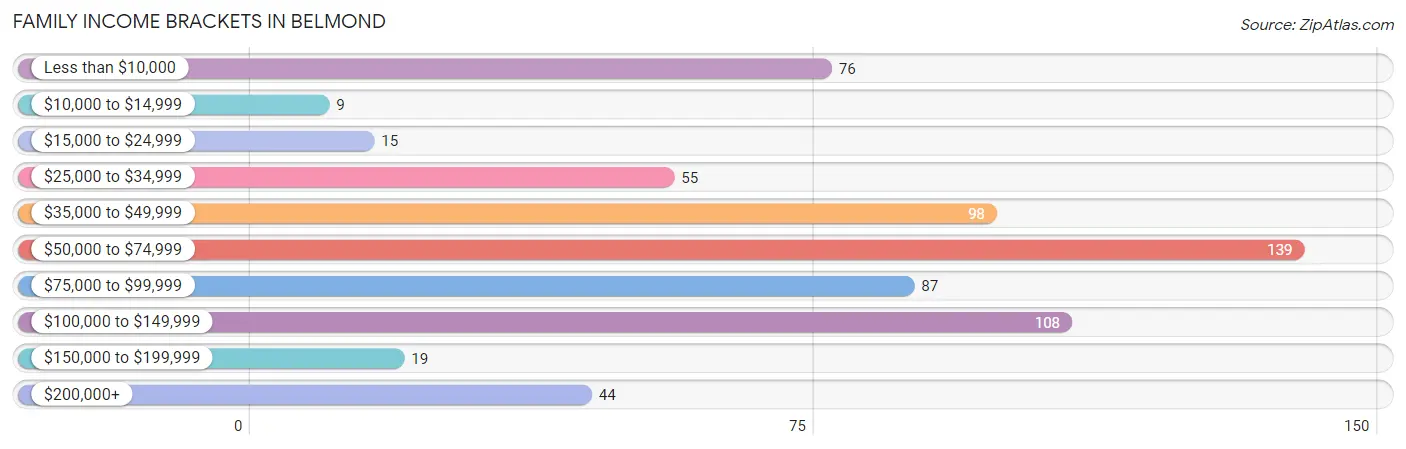
| Income Bracket | # Families | % Families |
| Less than $10,000 | 76 | 11.7% |
| $10,000 to $14,999 | 9 | 1.4% |
| $15,000 to $24,999 | 15 | 2.3% |
| $25,000 to $34,999 | 55 | 8.5% |
| $35,000 to $49,999 | 98 | 15.1% |
| $50,000 to $74,999 | 139 | 21.4% |
| $75,000 to $99,999 | 87 | 13.4% |
| $100,000 to $149,999 | 108 | 16.6% |
| $150,000 to $199,999 | 19 | 2.9% |
| $200,000+ | 44 | 6.8% |
Family Income by Famaliy Size in Belmond
3-person families (69 | 10.6%) account for the highest median family income in Belmond with $79,583 per family, while 2-person families (409 | 62.9%) have the highest median income of $29,219 per family member.
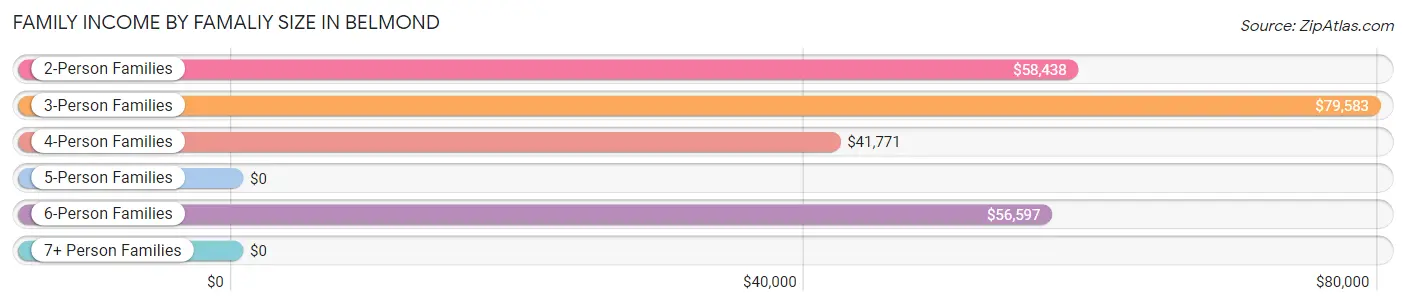
| Income Bracket | # Families | Median Income |
| 2-Person Families | 409 (62.9%) | $58,438 |
| 3-Person Families | 69 (10.6%) | $79,583 |
| 4-Person Families | 77 (11.8%) | $41,771 |
| 5-Person Families | 53 (8.2%) | $0 |
| 6-Person Families | 29 (4.5%) | $56,597 |
| 7+ Person Families | 13 (2.0%) | $0 |
| Total | 650 (100.0%) | $59,792 |
Family Income by Number of Earners in Belmond
The median family income in Belmond is $59,792, with families comprising 3+ earners (25) having the highest median family income of $136,750, while families with no earners (160) have the lowest median family income of $34,167, accounting for 3.8% and 24.6% of families, respectively.
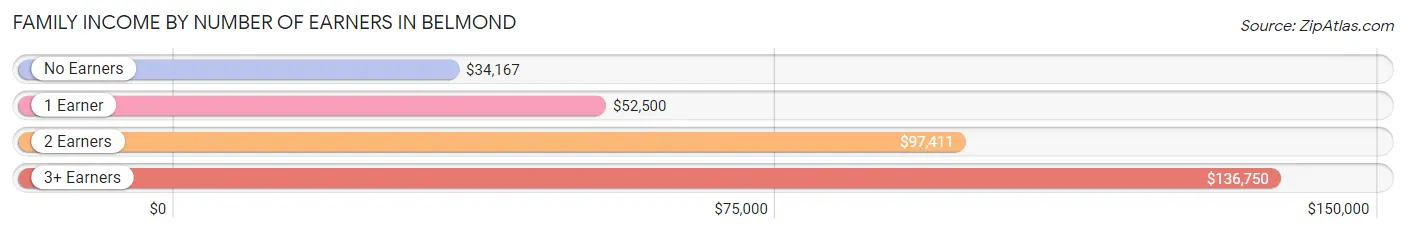
| Number of Earners | # Families | Median Income |
| No Earners | 160 (24.6%) | $34,167 |
| 1 Earner | 254 (39.1%) | $52,500 |
| 2 Earners | 211 (32.5%) | $97,411 |
| 3+ Earners | 25 (3.8%) | $136,750 |
| Total | 650 (100.0%) | $59,792 |
Household Income in Belmond
Household Income Brackets in Belmond
With 207 households falling in the category, the $50,000 to $74,999 income range is the most frequent in Belmond, accounting for 21.0% of all households. In contrast, only 23 households (2.3%) fall into the $150,000 to $199,999 income bracket, making it the least populous group.
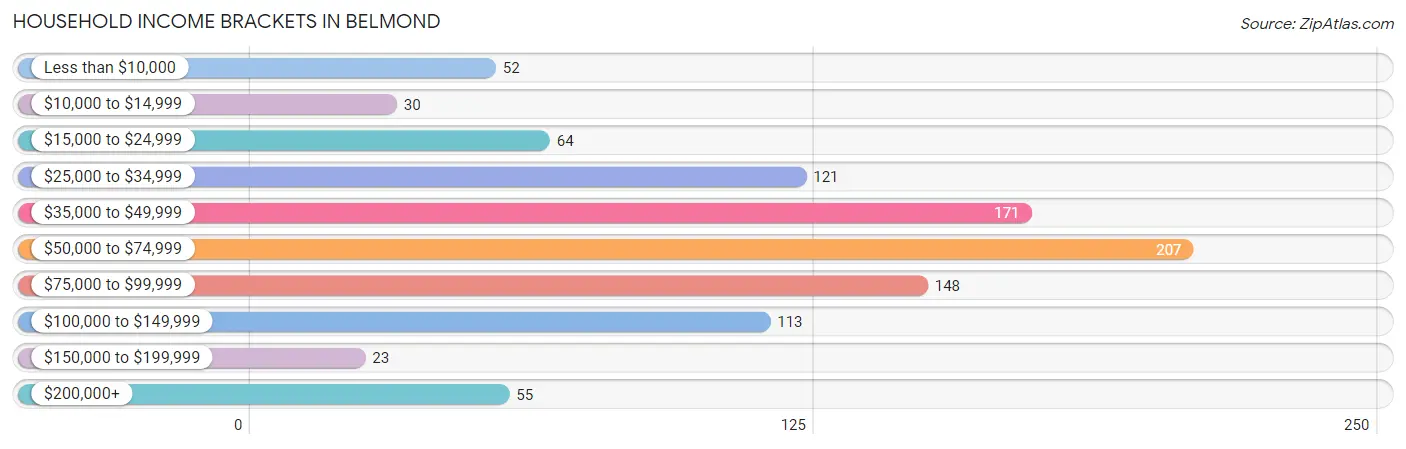
| Income Bracket | # Households | % Households |
| Less than $10,000 | 52 | 5.3% |
| $10,000 to $14,999 | 30 | 3.0% |
| $15,000 to $24,999 | 64 | 6.5% |
| $25,000 to $34,999 | 121 | 12.3% |
| $35,000 to $49,999 | 171 | 17.4% |
| $50,000 to $74,999 | 207 | 21.0% |
| $75,000 to $99,999 | 148 | 15.0% |
| $100,000 to $149,999 | 113 | 11.5% |
| $150,000 to $199,999 | 23 | 2.3% |
| $200,000+ | 55 | 5.6% |
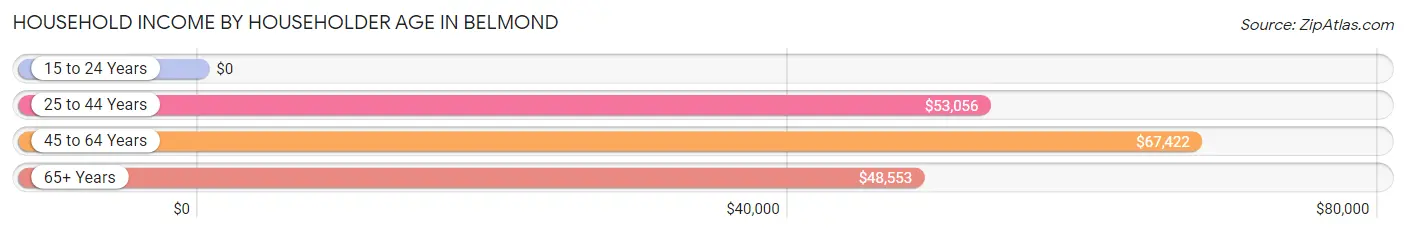
Household Income by Householder Age in Belmond
The median household income in Belmond is $55,233, with the highest median household income of $67,422 found in the 45 to 64 years age bracket for the primary householder. A total of 254 households (25.8%) fall into this category. Meanwhile, the 15 to 24 years age bracket for the primary householder has the lowest median household income of $0, with 42 households (4.3%) in this group.
| Income Bracket | # Households | Median Income |
| 15 to 24 Years | 42 (4.3%) | $0 |
| 25 to 44 Years | 264 (26.8%) | $53,056 |
| 45 to 64 Years | 254 (25.8%) | $67,422 |
| 65+ Years | 424 (43.1%) | $48,553 |
| Total | 984 (100.0%) | $55,233 |
Poverty in Belmond
Income Below Poverty by Sex and Age in Belmond
With 19.6% poverty level for males and 11.8% for females among the residents of Belmond, 18 to 24 year old males and 18 to 24 year old females are the most vulnerable to poverty, with 47 males (88.7%) and 48 females (63.2%) in their respective age groups living below the poverty level.
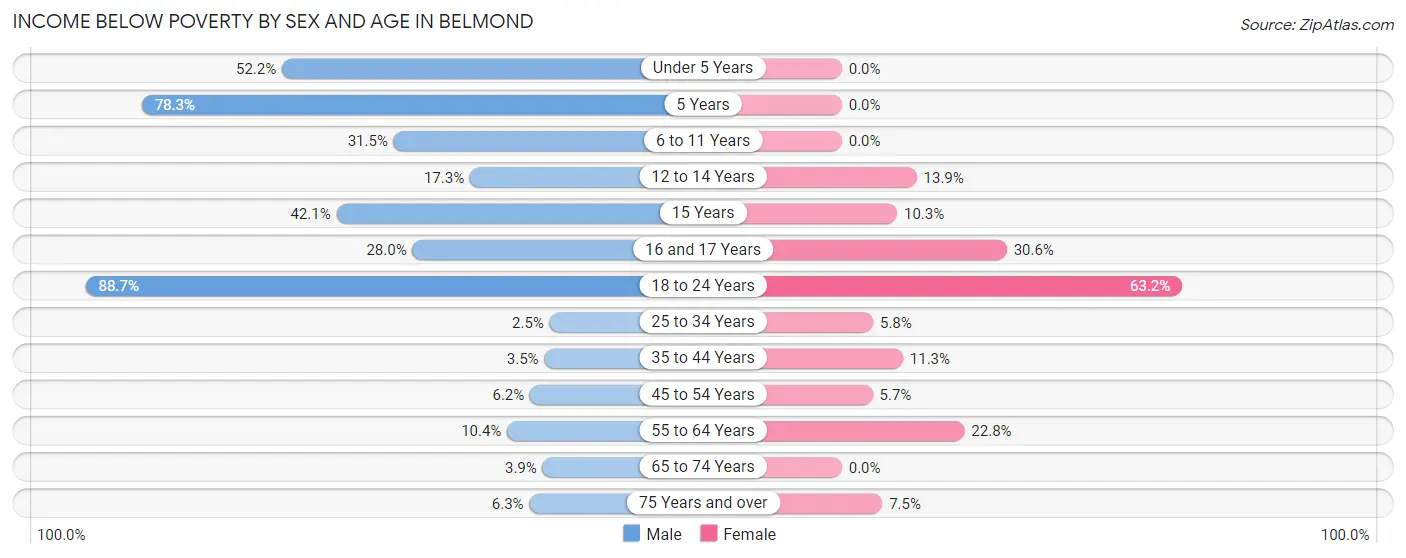
| Age Bracket | Male | Female |
| Under 5 Years | 47 (52.2%) | 0 (0.0%) |
| 5 Years | 18 (78.3%) | 0 (0.0%) |
| 6 to 11 Years | 34 (31.5%) | 0 (0.0%) |
| 12 to 14 Years | 13 (17.3%) | 10 (13.9%) |
| 15 Years | 16 (42.1%) | 4 (10.3%) |
| 16 and 17 Years | 7 (28.0%) | 15 (30.6%) |
| 18 to 24 Years | 47 (88.7%) | 48 (63.2%) |
| 25 to 34 Years | 3 (2.5%) | 8 (5.8%) |
| 35 to 44 Years | 4 (3.5%) | 17 (11.3%) |
| 45 to 54 Years | 5 (6.2%) | 4 (5.7%) |
| 55 to 64 Years | 10 (10.4%) | 33 (22.8%) |
| 65 to 74 Years | 6 (3.8%) | 0 (0.0%) |
| 75 Years and over | 9 (6.3%) | 13 (7.5%) |
| Total | 219 (19.6%) | 152 (11.8%) |
Income Above Poverty by Sex and Age in Belmond
According to the poverty statistics in Belmond, males aged 25 to 34 years and females aged under 5 years are the age groups that are most secure financially, with 97.5% of males and 100.0% of females in these age groups living above the poverty line.
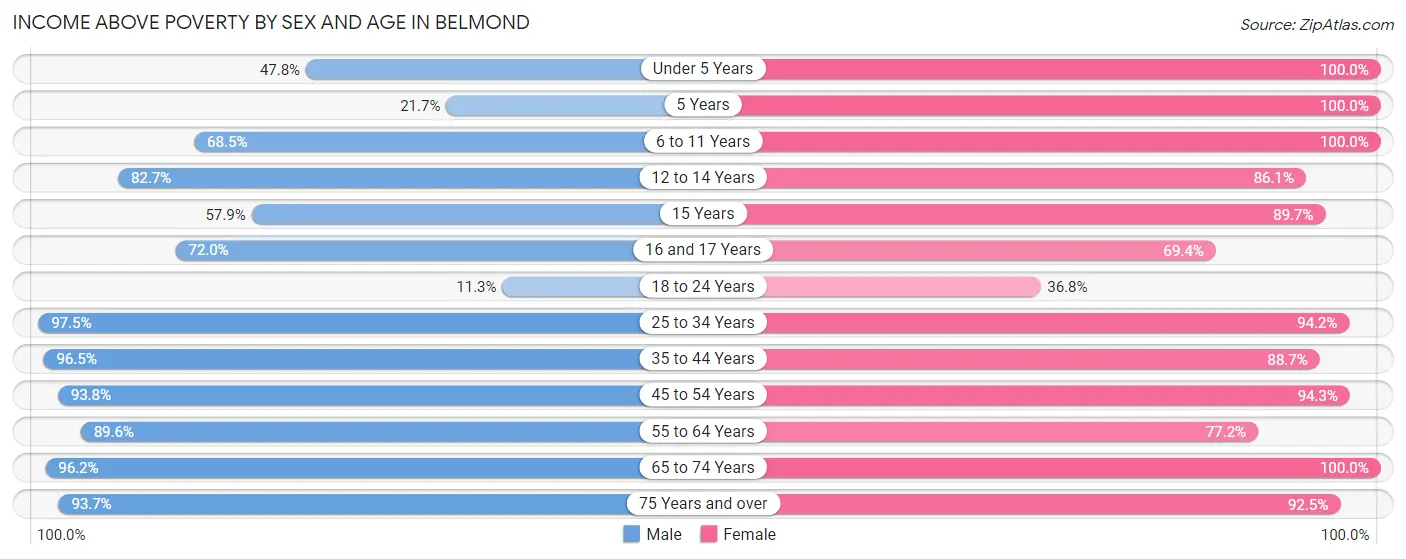
| Age Bracket | Male | Female |
| Under 5 Years | 43 (47.8%) | 46 (100.0%) |
| 5 Years | 5 (21.7%) | 18 (100.0%) |
| 6 to 11 Years | 74 (68.5%) | 112 (100.0%) |
| 12 to 14 Years | 62 (82.7%) | 62 (86.1%) |
| 15 Years | 22 (57.9%) | 35 (89.7%) |
| 16 and 17 Years | 18 (72.0%) | 34 (69.4%) |
| 18 to 24 Years | 6 (11.3%) | 28 (36.8%) |
| 25 to 34 Years | 115 (97.5%) | 130 (94.2%) |
| 35 to 44 Years | 110 (96.5%) | 133 (88.7%) |
| 45 to 54 Years | 76 (93.8%) | 66 (94.3%) |
| 55 to 64 Years | 86 (89.6%) | 112 (77.2%) |
| 65 to 74 Years | 150 (96.2%) | 201 (100.0%) |
| 75 Years and over | 134 (93.7%) | 160 (92.5%) |
| Total | 901 (80.4%) | 1,137 (88.2%) |
Income Below Poverty Among Married-Couple Families in Belmond
The poverty statistics for married-couple families in Belmond show that 1.6% or 8 of the total 493 families live below the poverty line. Families with no children have the highest poverty rate of 2.4%, comprising of 8 families. On the other hand, families with 1 or 2 children have the lowest poverty rate of 0.0%, which includes 0 families.
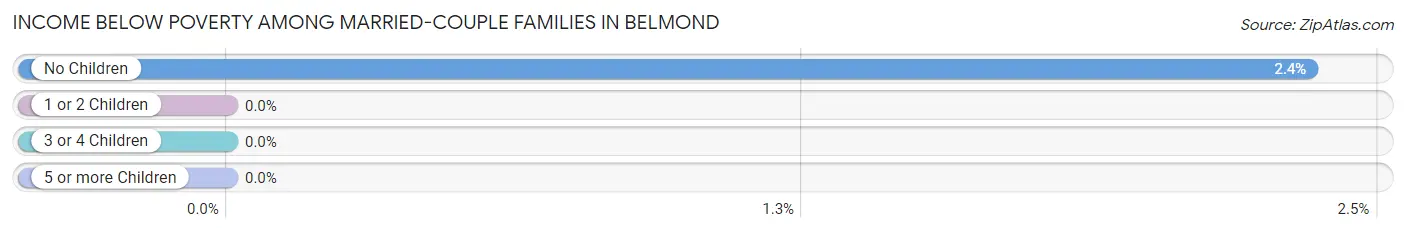
| Children | Above Poverty | Below Poverty |
| No Children | 333 (97.7%) | 8 (2.4%) |
| 1 or 2 Children | 90 (100.0%) | 0 (0.0%) |
| 3 or 4 Children | 62 (100.0%) | 0 (0.0%) |
| 5 or more Children | 0 (0.0%) | 0 (0.0%) |
| Total | 485 (98.4%) | 8 (1.6%) |
Income Below Poverty Among Single-Parent Households in Belmond
According to the poverty data in Belmond, 38.5% or 5 single-father households and 50.0% or 72 single-mother households are living below the poverty line. Among single-father households, those with no children have the highest poverty rate, with 5 households (55.6%) experiencing poverty. Likewise, among single-mother households, those with 5 or more children have the highest poverty rate, with 13 households (100.0%) falling below the poverty line.
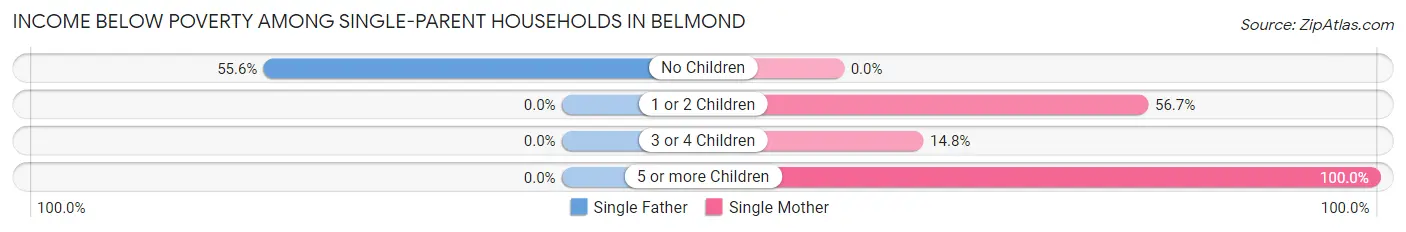
| Children | Single Father | Single Mother |
| No Children | 5 (55.6%) | 0 (0.0%) |
| 1 or 2 Children | 0 (0.0%) | 55 (56.7%) |
| 3 or 4 Children | 0 (0.0%) | 4 (14.8%) |
| 5 or more Children | 0 (0.0%) | 13 (100.0%) |
| Total | 5 (38.5%) | 72 (50.0%) |
Income Below Poverty Among Married-Couple vs Single-Parent Households in Belmond
The poverty data for Belmond shows that 8 of the married-couple family households (1.6%) and 77 of the single-parent households (49.0%) are living below the poverty level. Within the married-couple family households, those with no children have the highest poverty rate, with 8 households (2.4%) falling below the poverty line. Among the single-parent households, those with 5 or more children have the highest poverty rate, with 13 household (100.0%) living below poverty.
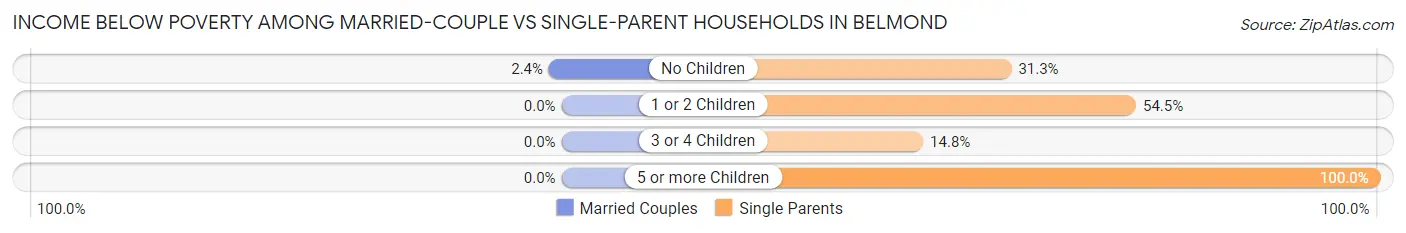
| Children | Married-Couple Families | Single-Parent Households |
| No Children | 8 (2.4%) | 5 (31.2%) |
| 1 or 2 Children | 0 (0.0%) | 55 (54.5%) |
| 3 or 4 Children | 0 (0.0%) | 4 (14.8%) |
| 5 or more Children | 0 (0.0%) | 13 (100.0%) |
| Total | 8 (1.6%) | 77 (49.0%) |
Race in Belmond
The most populous races in Belmond are White / Caucasian (2,221 | 88.4%), Hispanic or Latino (392 | 15.6%), and Two or more Races (231 | 9.2%).
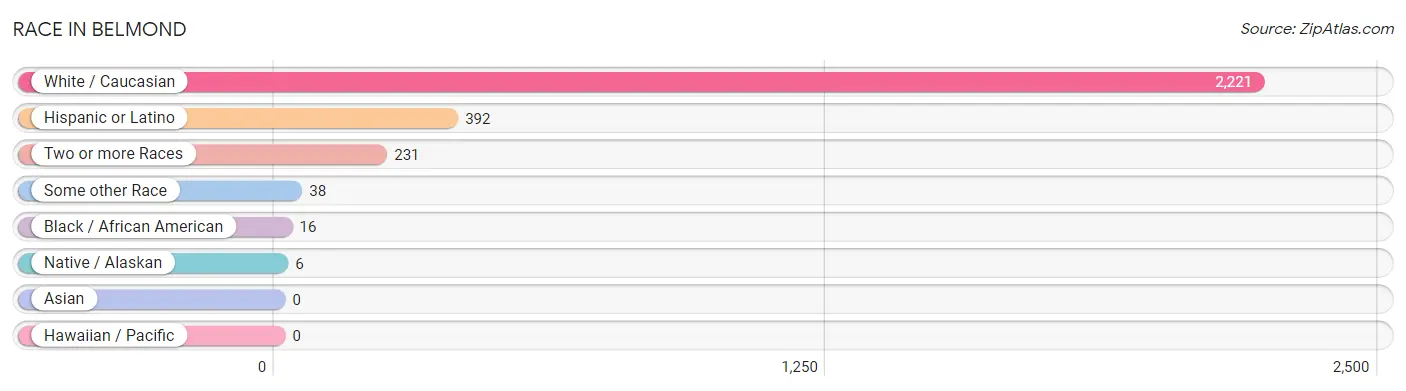
| Race | # Population | % Population |
| Asian | 0 | 0.0% |
| Black / African American | 16 | 0.6% |
| Hawaiian / Pacific | 0 | 0.0% |
| Hispanic or Latino | 392 | 15.6% |
| Native / Alaskan | 6 | 0.2% |
| White / Caucasian | 2,221 | 88.4% |
| Two or more Races | 231 | 9.2% |
| Some other Race | 38 | 1.5% |
| Total | 2,512 | 100.0% |
Ancestry in Belmond
The most populous ancestries reported in Belmond are German (1,124 | 44.8%), Norwegian (327 | 13.0%), Mexican (289 | 11.5%), English (197 | 7.8%), and Irish (179 | 7.1%), together accounting for 84.2% of all Belmond residents.
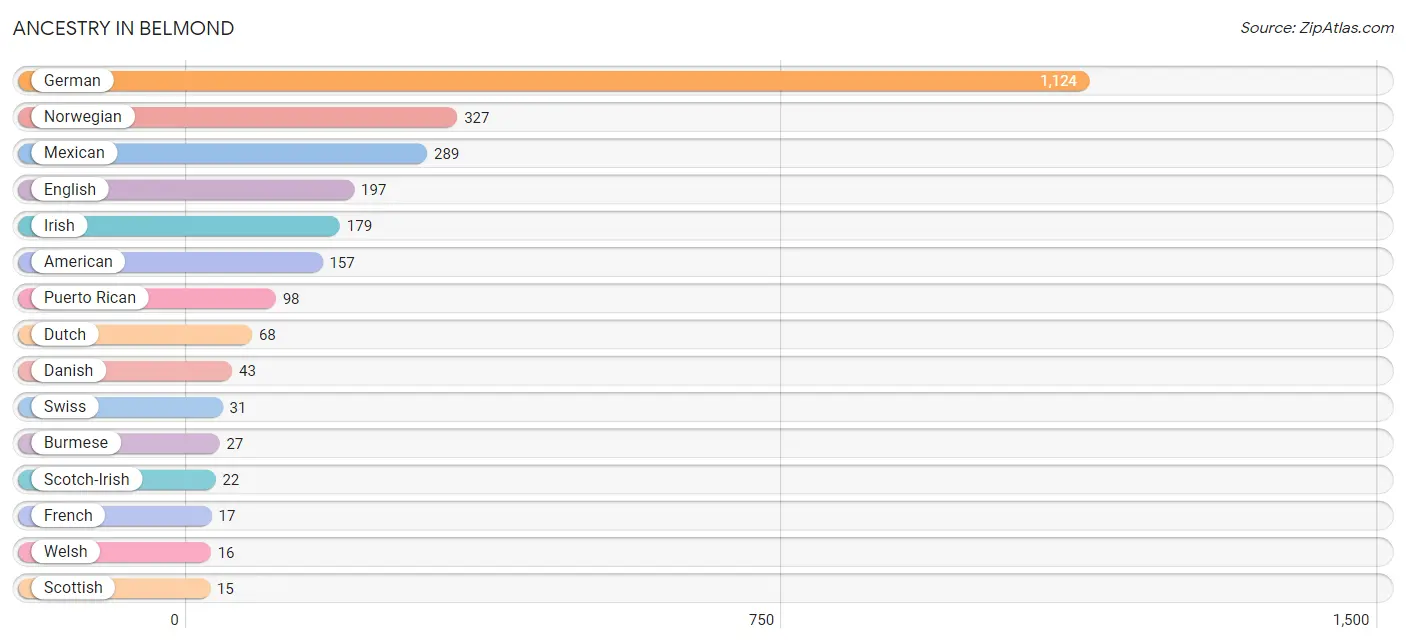
| Ancestry | # Population | % Population |
| American | 157 | 6.2% |
| Austrian | 9 | 0.4% |
| British | 10 | 0.4% |
| Burmese | 27 | 1.1% |
| Cherokee | 9 | 0.4% |
| Czech | 4 | 0.2% |
| Danish | 43 | 1.7% |
| Dutch | 68 | 2.7% |
| Eastern European | 5 | 0.2% |
| English | 197 | 7.8% |
| French | 17 | 0.7% |
| French Canadian | 13 | 0.5% |
| German | 1,124 | 44.8% |
| Irish | 179 | 7.1% |
| Italian | 6 | 0.2% |
| Mexican | 289 | 11.5% |
| Mexican American Indian | 6 | 0.2% |
| Norwegian | 327 | 13.0% |
| Peruvian | 5 | 0.2% |
| Polish | 9 | 0.4% |
| Puerto Rican | 98 | 3.9% |
| Scandinavian | 12 | 0.5% |
| Scotch-Irish | 22 | 0.9% |
| Scottish | 15 | 0.6% |
| South American | 5 | 0.2% |
| Swedish | 6 | 0.2% |
| Swiss | 31 | 1.2% |
| Welsh | 16 | 0.6% | View All 28 Rows |
Immigrants in Belmond
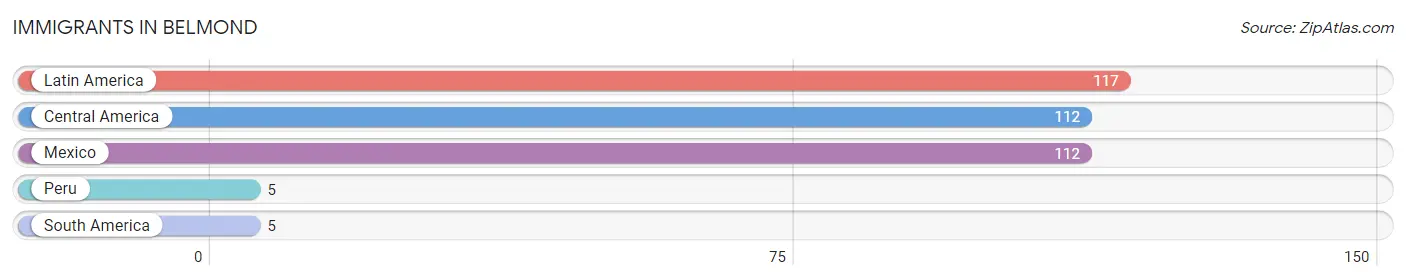
The most numerous immigrant groups reported in Belmond came from Latin America (117 | 4.7%), Central America (112 | 4.5%), Mexico (112 | 4.5%), Peru (5 | 0.2%), and South America (5 | 0.2%), together accounting for 14.0% of all Belmond residents.
| Immigration Origin | # Population | % Population |
| Central America | 112 | 4.5% |
| Latin America | 117 | 4.7% |
| Mexico | 112 | 4.5% |
| Peru | 5 | 0.2% |
| South America | 5 | 0.2% | View All 5 Rows |
Sex and Age in Belmond
Sex and Age in Belmond
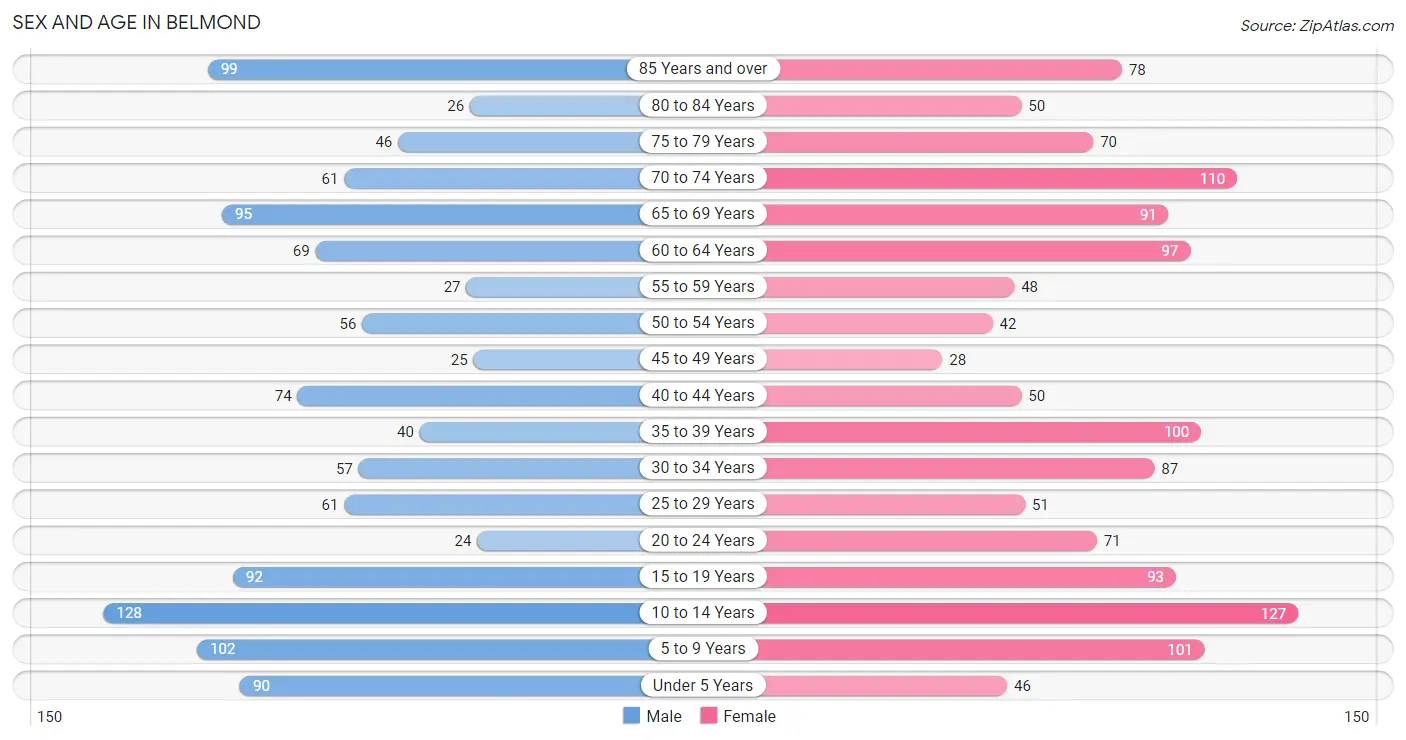
The most populous age groups in Belmond are 10 to 14 Years (128 | 10.9%) for men and 10 to 14 Years (127 | 9.5%) for women.
| Age Bracket | Male | Female |
| Under 5 Years | 90 (7.7%) | 46 (3.4%) |
| 5 to 9 Years | 102 (8.7%) | 101 (7.5%) |
| 10 to 14 Years | 128 (10.9%) | 127 (9.5%) |
| 15 to 19 Years | 92 (7.9%) | 93 (6.9%) |
| 20 to 24 Years | 24 (2.1%) | 71 (5.3%) |
| 25 to 29 Years | 61 (5.2%) | 51 (3.8%) |
| 30 to 34 Years | 57 (4.9%) | 87 (6.5%) |
| 35 to 39 Years | 40 (3.4%) | 100 (7.5%) |
| 40 to 44 Years | 74 (6.3%) | 50 (3.7%) |
| 45 to 49 Years | 25 (2.1%) | 28 (2.1%) |
| 50 to 54 Years | 56 (4.8%) | 42 (3.1%) |
| 55 to 59 Years | 27 (2.3%) | 48 (3.6%) |
| 60 to 64 Years | 69 (5.9%) | 97 (7.2%) |
| 65 to 69 Years | 95 (8.1%) | 91 (6.8%) |
| 70 to 74 Years | 61 (5.2%) | 110 (8.2%) |
| 75 to 79 Years | 46 (3.9%) | 70 (5.2%) |
| 80 to 84 Years | 26 (2.2%) | 50 (3.7%) |
| 85 Years and over | 99 (8.5%) | 78 (5.8%) |
| Total | 1,172 (100.0%) | 1,340 (100.0%) |
Families and Households in Belmond
Median Family Size in Belmond
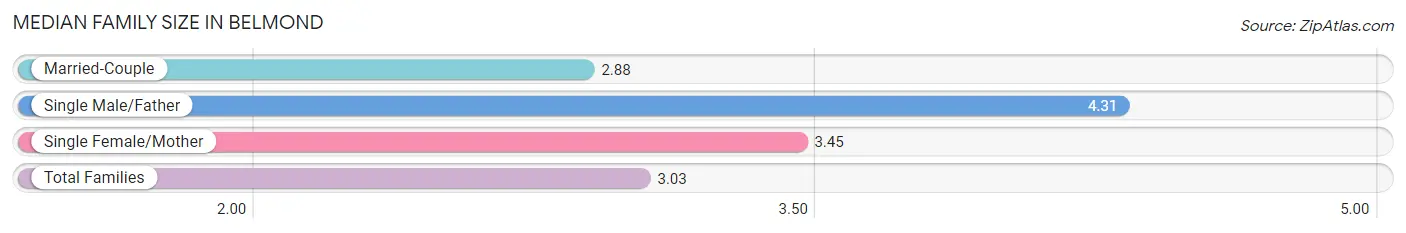
The median family size in Belmond is 3.03 persons per family, with single male/father families (13 | 2.0%) accounting for the largest median family size of 4.31 persons per family. On the other hand, married-couple families (493 | 75.8%) represent the smallest median family size with 2.88 persons per family.
| Family Type | # Families | Family Size |
| Married-Couple | 493 (75.8%) | 2.88 |
| Single Male/Father | 13 (2.0%) | 4.31 |
| Single Female/Mother | 144 (22.2%) | 3.45 |
| Total Families | 650 (100.0%) | 3.03 |
Median Household Size in Belmond
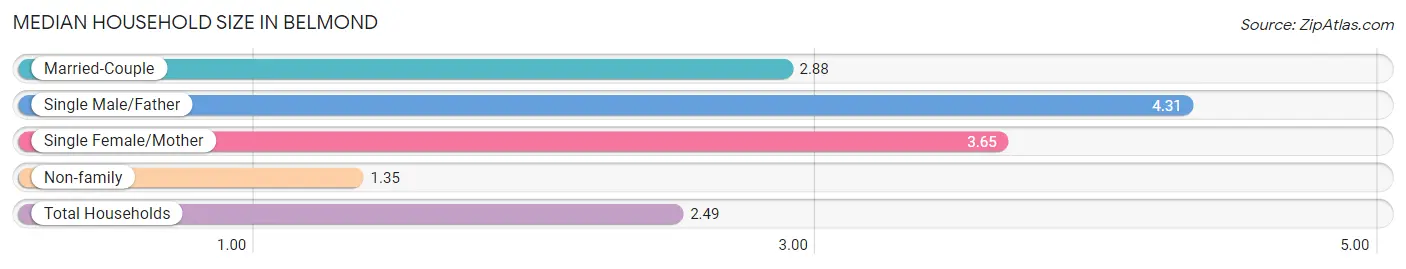
The median household size in Belmond is 2.49 persons per household, with single male/father households (13 | 1.3%) accounting for the largest median household size of 4.31 persons per household. non-family households (334 | 33.9%) represent the smallest median household size with 1.35 persons per household.
| Household Type | # Households | Household Size |
| Married-Couple | 493 (50.1%) | 2.88 |
| Single Male/Father | 13 (1.3%) | 4.31 |
| Single Female/Mother | 144 (14.6%) | 3.65 |
| Non-family | 334 (33.9%) | 1.35 |
| Total Households | 984 (100.0%) | 2.49 |
Household Size by Marriage Status in Belmond
Out of a total of 984 households in Belmond, 650 (66.1%) are family households, while 334 (33.9%) are nonfamily households. The most numerous type of family households are 2-person households, comprising 377, and the most common type of nonfamily households are 1-person households, comprising 283.
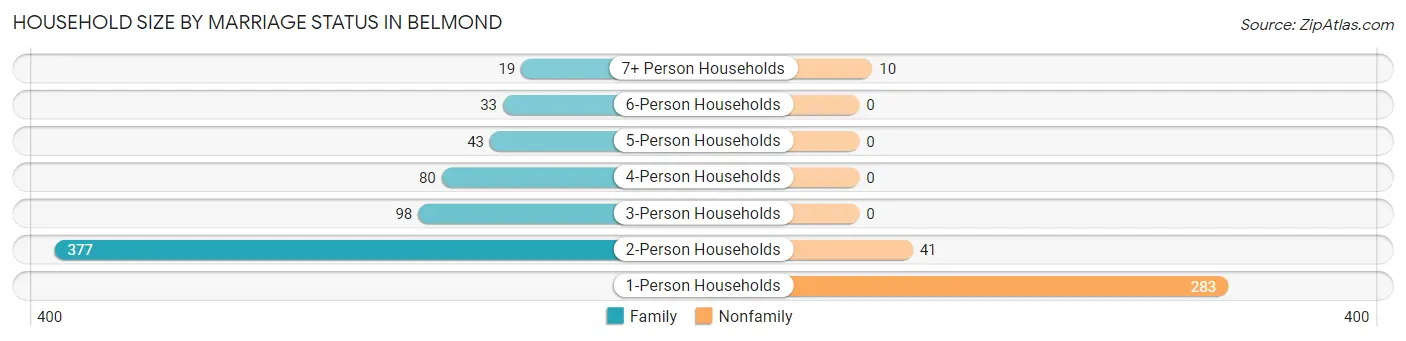
| Household Size | Family Households | Nonfamily Households |
| 1-Person Households | - | 283 (28.8%) |
| 2-Person Households | 377 (38.3%) | 41 (4.2%) |
| 3-Person Households | 98 (10.0%) | 0 (0.0%) |
| 4-Person Households | 80 (8.1%) | 0 (0.0%) |
| 5-Person Households | 43 (4.4%) | 0 (0.0%) |
| 6-Person Households | 33 (3.4%) | 0 (0.0%) |
| 7+ Person Households | 19 (1.9%) | 10 (1.0%) |
| Total | 650 (66.1%) | 334 (33.9%) |
Female Fertility in Belmond
Fertility by Age in Belmond
Average fertility rate in Belmond is 63.0 births per 1,000 women. Women in the age bracket of 35 to 50 years have the highest fertility rate with 108.0 births per 1,000 women. Women in the age bracket of 35 to 50 years acount for 67.7% of all women with births.
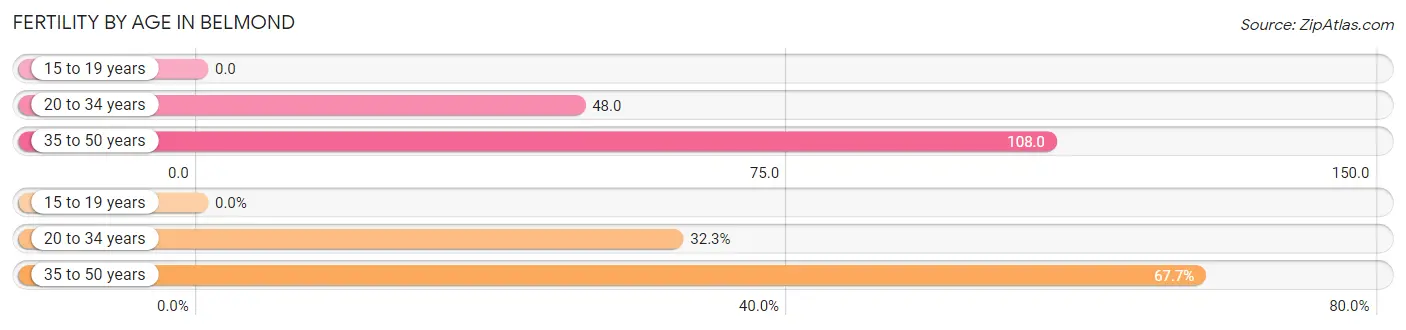
| Age Bracket | Women with Births | Births / 1,000 Women |
| 15 to 19 years | 0 (0.0%) | 0.0 |
| 20 to 34 years | 10 (32.3%) | 48.0 |
| 35 to 50 years | 21 (67.7%) | 108.0 |
| Total | 31 (100.0%) | 63.0 |
Fertility by Age by Marriage Status in Belmond
58.1% of women with births (31) in Belmond are married. The highest percentage of unmarried women with births falls into 35 to 50 years age bracket with 61.9% of them unmarried at the time of birth, while the lowest percentage of unmarried women with births belong to 20 to 34 years age bracket with 0.0% of them unmarried.
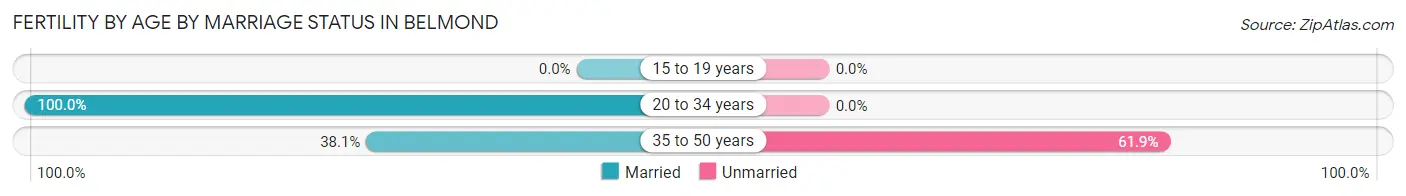
| Age Bracket | Married | Unmarried |
| 15 to 19 years | 0 (0.0%) | 0 (0.0%) |
| 20 to 34 years | 10 (100.0%) | 0 (0.0%) |
| 35 to 50 years | 8 (38.1%) | 13 (61.9%) |
| Total | 18 (58.1%) | 13 (41.9%) |
Fertility by Education in Belmond
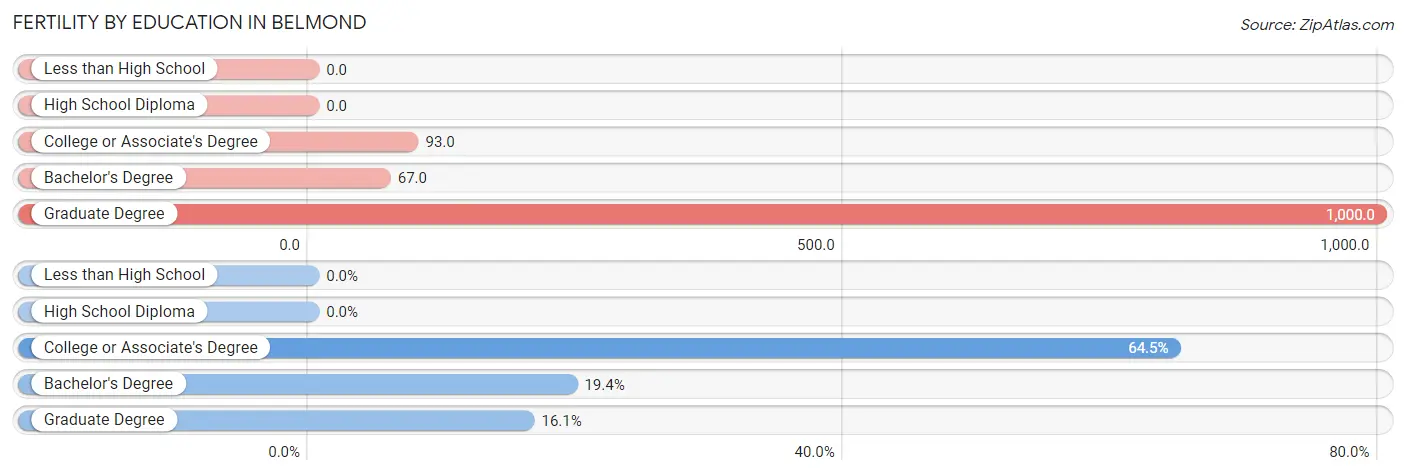
| Educational Attainment | Women with Births | Births / 1,000 Women |
| Less than High School | 0 (0.0%) | 0.0 |
| High School Diploma | 0 (0.0%) | 0.0 |
| College or Associate's Degree | 20 (64.5%) | 93.0 |
| Bachelor's Degree | 6 (19.4%) | 67.0 |
| Graduate Degree | 5 (16.1%) | 1,000.0 |
| Total | 31 (100.0%) | 63.0 |
Fertility by Education by Marriage Status in Belmond
41.9% of women with births in Belmond are unmarried. Women with the educational attainment of bachelor's degree are most likely to be married with 100.0% of them married at childbirth, while women with the educational attainment of college or associate's degree are least likely to be married with 65.0% of them unmarried at childbirth.
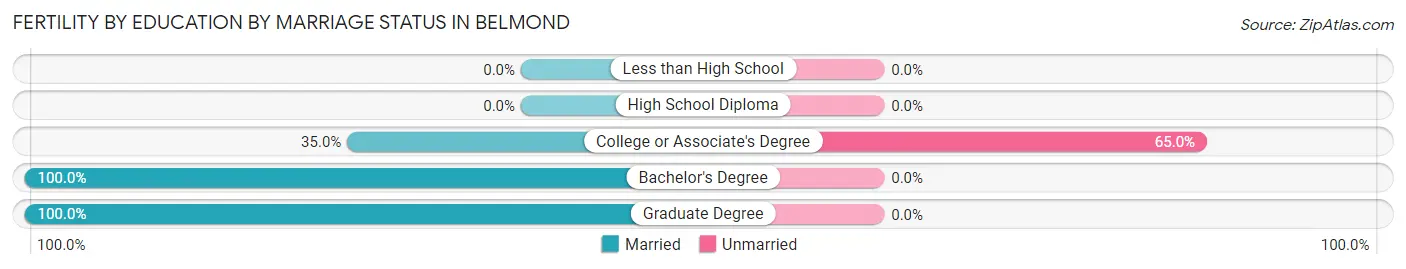
| Educational Attainment | Married | Unmarried |
| Less than High School | 0 (0.0%) | 0 (0.0%) |
| High School Diploma | 0 (0.0%) | 0 (0.0%) |
| College or Associate's Degree | 7 (35.0%) | 13 (65.0%) |
| Bachelor's Degree | 6 (100.0%) | 0 (0.0%) |
| Graduate Degree | 5 (100.0%) | 0 (0.0%) |
| Total | 18 (58.1%) | 13 (41.9%) |
Employment Characteristics in Belmond
Employment by Class of Employer in Belmond
Among the 843 employed individuals in Belmond, private company employees (575 | 68.2%), local government employees (94 | 11.2%), and not-for-profit organizations (78 | 9.2%) make up the most common classes of employment.
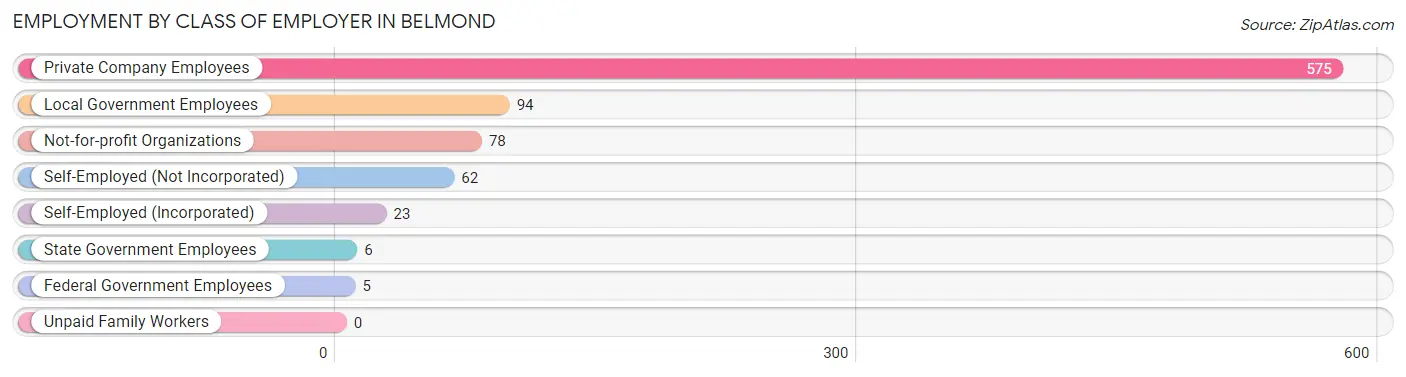
| Employer Class | # Employees | % Employees |
| Private Company Employees | 575 | 68.2% |
| Self-Employed (Incorporated) | 23 | 2.7% |
| Self-Employed (Not Incorporated) | 62 | 7.3% |
| Not-for-profit Organizations | 78 | 9.2% |
| Local Government Employees | 94 | 11.2% |
| State Government Employees | 6 | 0.7% |
| Federal Government Employees | 5 | 0.6% |
| Unpaid Family Workers | 0 | 0.0% |
| Total | 843 | 100.0% |
Employment Status by Age in Belmond
According to the labor force statistics for Belmond, out of the total population over 16 years of age (1,841), 48.8% or 898 individuals are in the labor force, with 3.7% or 33 of them unemployed. The age group with the highest labor force participation rate is 55 to 59 years, with 100.0% or 75 individuals in the labor force. Within the labor force, the 16 to 19 years age range has the highest percentage of unemployed individuals, with 50.0% or 5 of them being unemployed.
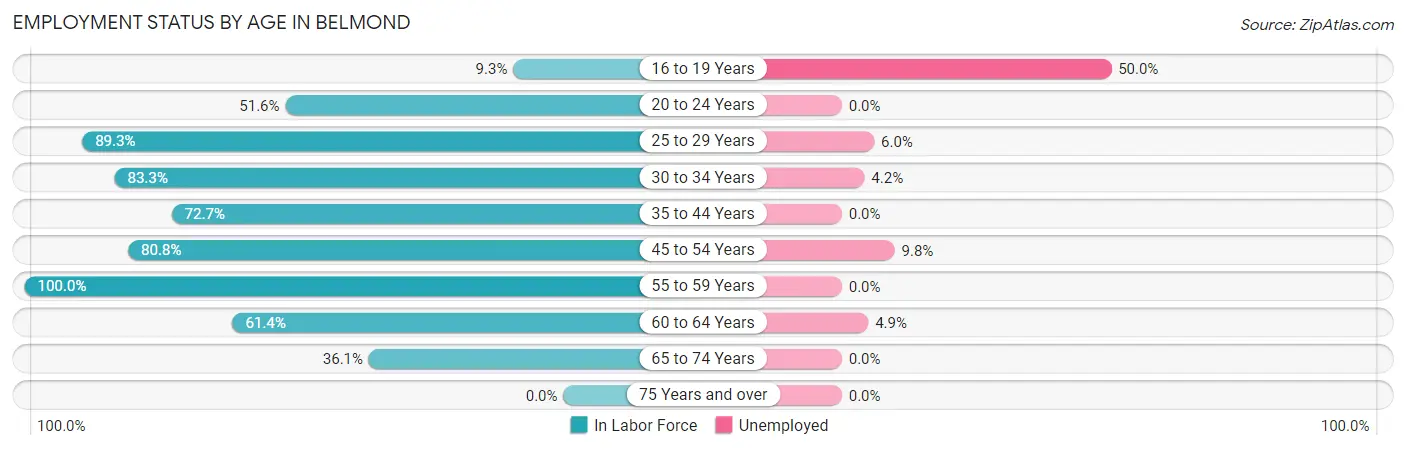
| Age Bracket | In Labor Force | Unemployed |
| 16 to 19 Years | 10 (9.3%) | 5 (50.0%) |
| 20 to 24 Years | 49 (51.6%) | 0 (0.0%) |
| 25 to 29 Years | 100 (89.3%) | 6 (6.0%) |
| 30 to 34 Years | 120 (83.3%) | 5 (4.2%) |
| 35 to 44 Years | 192 (72.7%) | 0 (0.0%) |
| 45 to 54 Years | 122 (80.8%) | 12 (9.8%) |
| 55 to 59 Years | 75 (100.0%) | 0 (0.0%) |
| 60 to 64 Years | 102 (61.4%) | 5 (4.9%) |
| 65 to 74 Years | 129 (36.1%) | 0 (0.0%) |
| 75 Years and over | 0 (0.0%) | 0 (0.0%) |
| Total | 898 (48.8%) | 33 (3.7%) |
Employment Status by Educational Attainment in Belmond
According to labor force statistics for Belmond, 78.0% of individuals (711) out of the total population between 25 and 64 years of age (912) are in the labor force, with 3.9% or 28 of them being unemployed. The group with the highest labor force participation rate are those with the educational attainment of bachelor's degree or higher, with 97.0% or 225 individuals in the labor force. Within the labor force, individuals with high school diploma education have the highest percentage of unemployment, with 10.6% or 19 of them being unemployed.
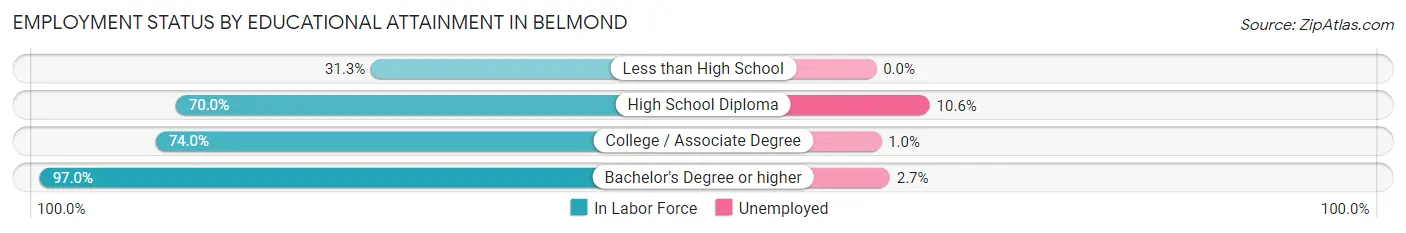
| Educational Attainment | In Labor Force | Unemployed |
| Less than High School | 5 (31.3%) | 0 (0.0%) |
| High School Diploma | 180 (70.0%) | 27 (10.6%) |
| College / Associate Degree | 301 (74.0%) | 4 (1.0%) |
| Bachelor's Degree or higher | 225 (97.0%) | 6 (2.7%) |
| Total | 711 (78.0%) | 36 (3.9%) |
Employment Occupations by Sex in Belmond
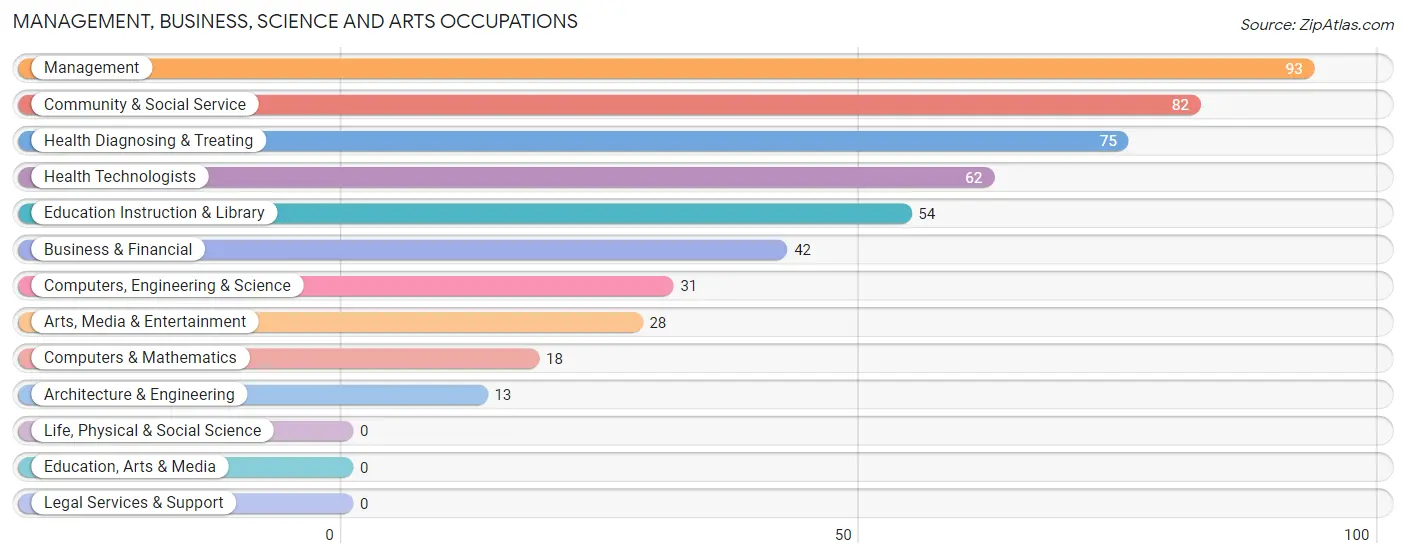
Management, Business, Science and Arts Occupations
The most common Management, Business, Science and Arts occupations in Belmond are Management (93 | 10.7%), Community & Social Service (82 | 9.5%), Health Diagnosing & Treating (75 | 8.7%), Health Technologists (62 | 7.2%), and Education Instruction & Library (54 | 6.2%).
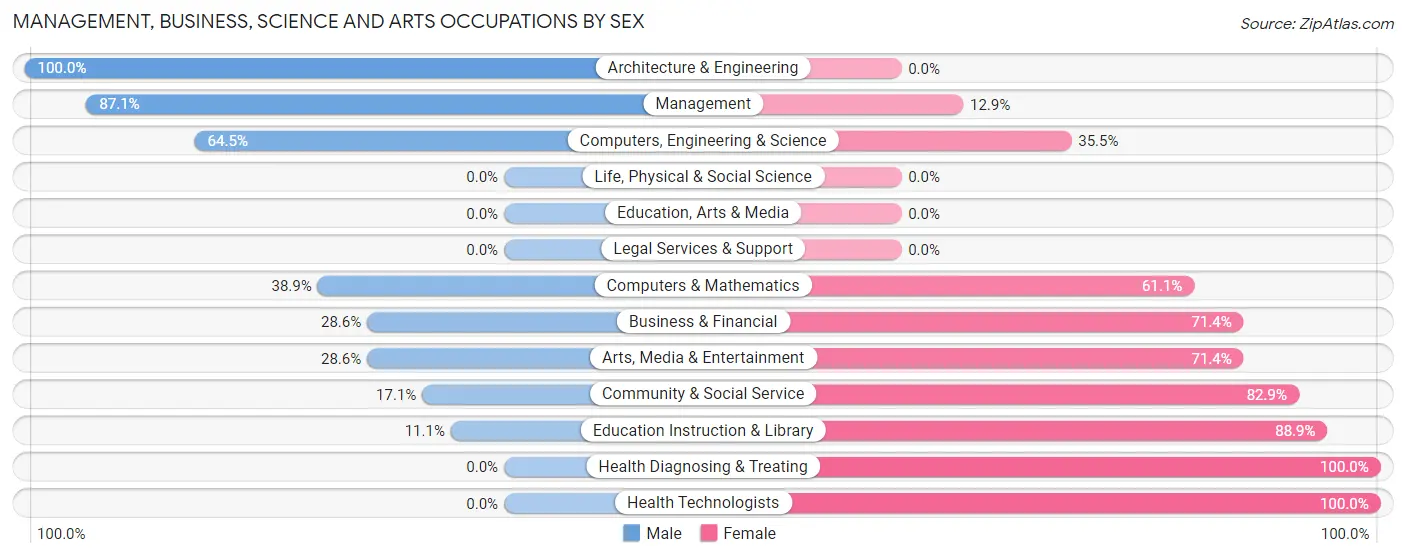
Management, Business, Science and Arts Occupations by Sex
Within the Management, Business, Science and Arts occupations in Belmond, the most male-oriented occupations are Architecture & Engineering (100.0%), Management (87.1%), and Computers, Engineering & Science (64.5%), while the most female-oriented occupations are Health Diagnosing & Treating (100.0%), Health Technologists (100.0%), and Education Instruction & Library (88.9%).
| Occupation | Male | Female |
| Management | 81 (87.1%) | 12 (12.9%) |
| Business & Financial | 12 (28.6%) | 30 (71.4%) |
| Computers, Engineering & Science | 20 (64.5%) | 11 (35.5%) |
| Computers & Mathematics | 7 (38.9%) | 11 (61.1%) |
| Architecture & Engineering | 13 (100.0%) | 0 (0.0%) |
| Life, Physical & Social Science | 0 (0.0%) | 0 (0.0%) |
| Community & Social Service | 14 (17.1%) | 68 (82.9%) |
| Education, Arts & Media | 0 (0.0%) | 0 (0.0%) |
| Legal Services & Support | 0 (0.0%) | 0 (0.0%) |
| Education Instruction & Library | 6 (11.1%) | 48 (88.9%) |
| Arts, Media & Entertainment | 8 (28.6%) | 20 (71.4%) |
| Health Diagnosing & Treating | 0 (0.0%) | 75 (100.0%) |
| Health Technologists | 0 (0.0%) | 62 (100.0%) |
| Total (Category) | 127 (39.3%) | 196 (60.7%) |
| Total (Overall) | 397 (45.8%) | 469 (54.2%) |
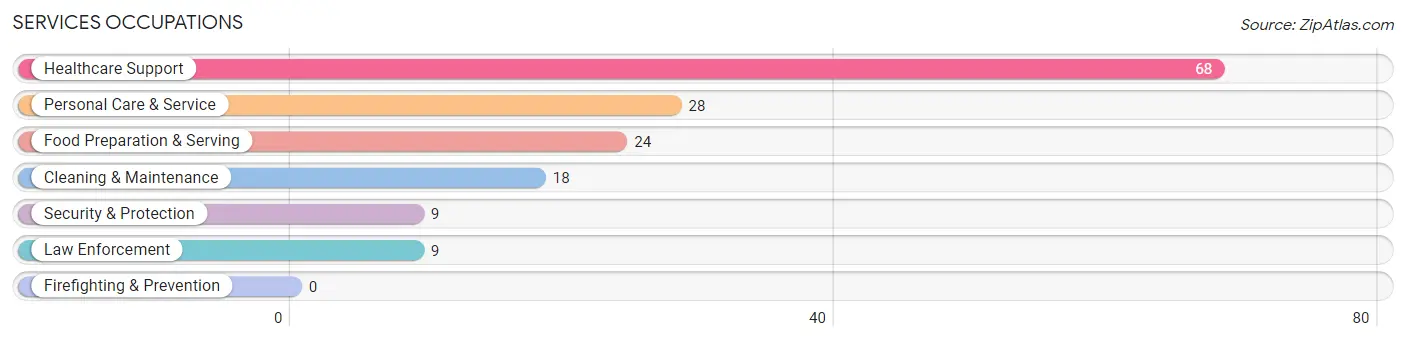
Services Occupations
The most common Services occupations in Belmond are Healthcare Support (68 | 7.9%), Personal Care & Service (28 | 3.2%), Food Preparation & Serving (24 | 2.8%), Cleaning & Maintenance (18 | 2.1%), and Security & Protection (9 | 1.0%).
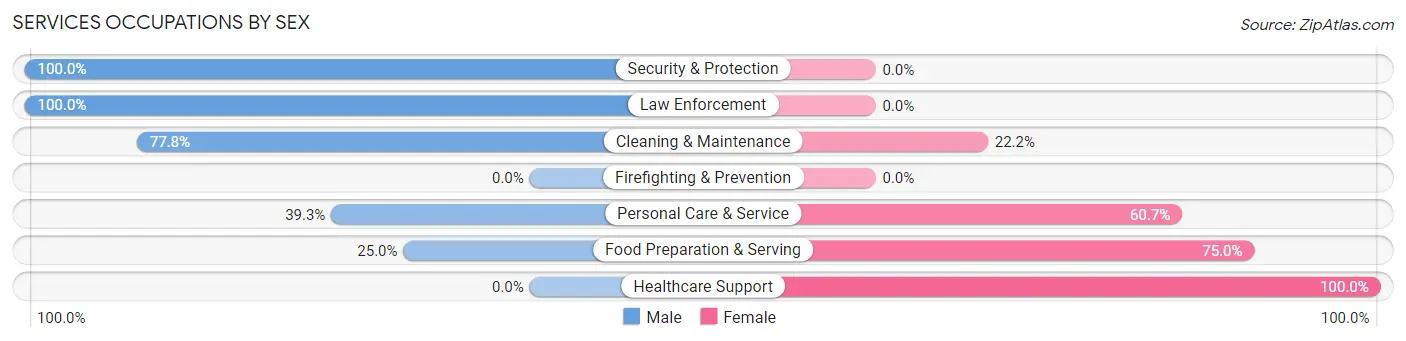
Services Occupations by Sex
Within the Services occupations in Belmond, the most male-oriented occupations are Security & Protection (100.0%), Law Enforcement (100.0%), and Cleaning & Maintenance (77.8%), while the most female-oriented occupations are Healthcare Support (100.0%), Food Preparation & Serving (75.0%), and Personal Care & Service (60.7%).
| Occupation | Male | Female |
| Healthcare Support | 0 (0.0%) | 68 (100.0%) |
| Security & Protection | 9 (100.0%) | 0 (0.0%) |
| Firefighting & Prevention | 0 (0.0%) | 0 (0.0%) |
| Law Enforcement | 9 (100.0%) | 0 (0.0%) |
| Food Preparation & Serving | 6 (25.0%) | 18 (75.0%) |
| Cleaning & Maintenance | 14 (77.8%) | 4 (22.2%) |
| Personal Care & Service | 11 (39.3%) | 17 (60.7%) |
| Total (Category) | 40 (27.2%) | 107 (72.8%) |
| Total (Overall) | 397 (45.8%) | 469 (54.2%) |
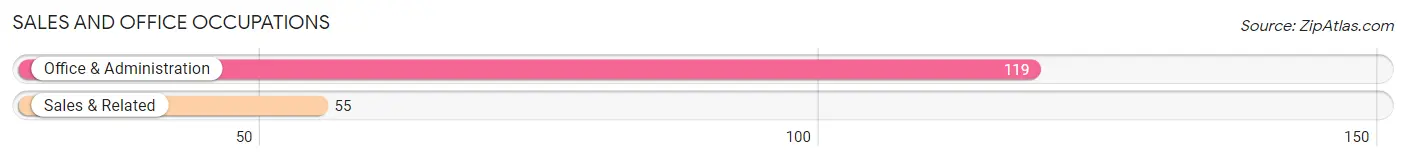
Sales and Office Occupations
The most common Sales and Office occupations in Belmond are Office & Administration (119 | 13.7%), and Sales & Related (55 | 6.4%).
Sales and Office Occupations by Sex
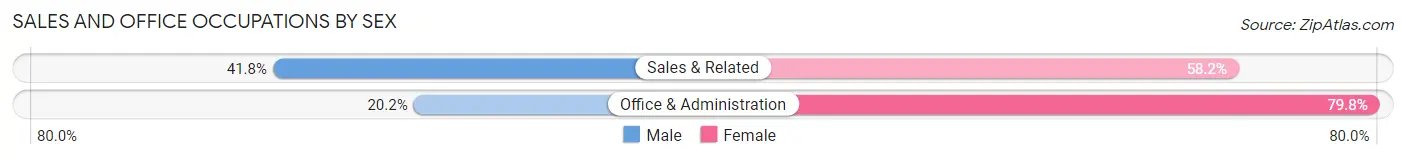
| Occupation | Male | Female |
| Sales & Related | 23 (41.8%) | 32 (58.2%) |
| Office & Administration | 24 (20.2%) | 95 (79.8%) |
| Total (Category) | 47 (27.0%) | 127 (73.0%) |
| Total (Overall) | 397 (45.8%) | 469 (54.2%) |
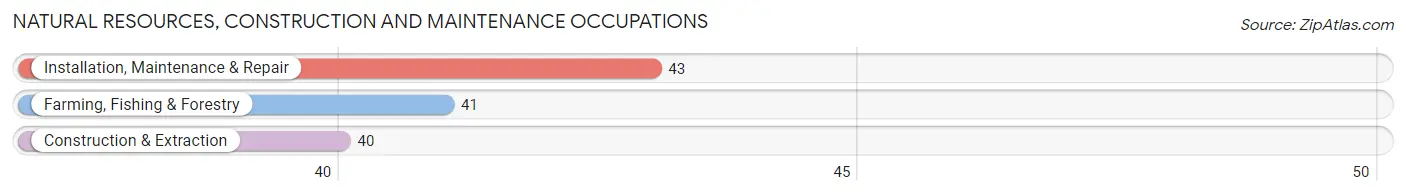
Natural Resources, Construction and Maintenance Occupations
The most common Natural Resources, Construction and Maintenance occupations in Belmond are Installation, Maintenance & Repair (43 | 5.0%), Farming, Fishing & Forestry (41 | 4.7%), and Construction & Extraction (40 | 4.6%).
Natural Resources, Construction and Maintenance Occupations by Sex
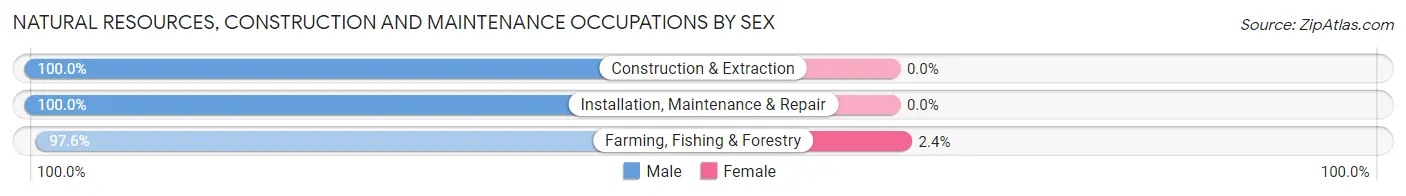
| Occupation | Male | Female |
| Farming, Fishing & Forestry | 40 (97.6%) | 1 (2.4%) |
| Construction & Extraction | 40 (100.0%) | 0 (0.0%) |
| Installation, Maintenance & Repair | 43 (100.0%) | 0 (0.0%) |
| Total (Category) | 123 (99.2%) | 1 (0.8%) |
| Total (Overall) | 397 (45.8%) | 469 (54.2%) |
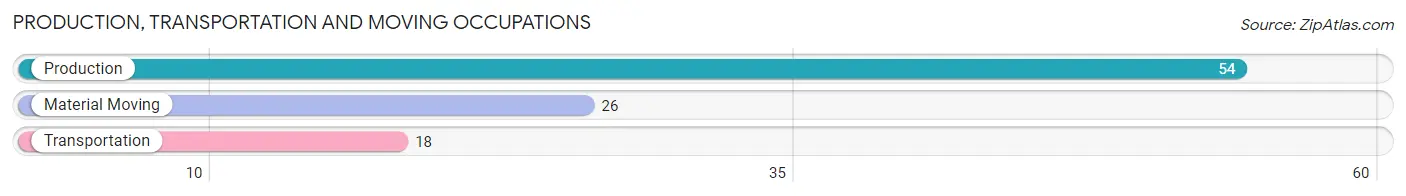
Production, Transportation and Moving Occupations
The most common Production, Transportation and Moving occupations in Belmond are Production (54 | 6.2%), Material Moving (26 | 3.0%), and Transportation (18 | 2.1%).
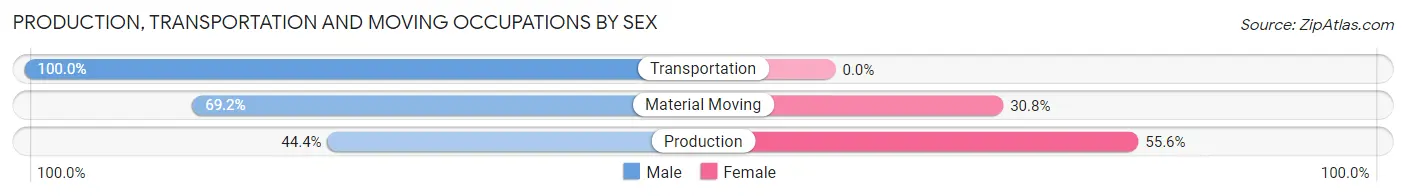
Production, Transportation and Moving Occupations by Sex
| Occupation | Male | Female |
| Production | 24 (44.4%) | 30 (55.6%) |
| Transportation | 18 (100.0%) | 0 (0.0%) |
| Material Moving | 18 (69.2%) | 8 (30.8%) |
| Total (Category) | 60 (61.2%) | 38 (38.8%) |
| Total (Overall) | 397 (45.8%) | 469 (54.2%) |
Employment Industries by Sex in Belmond
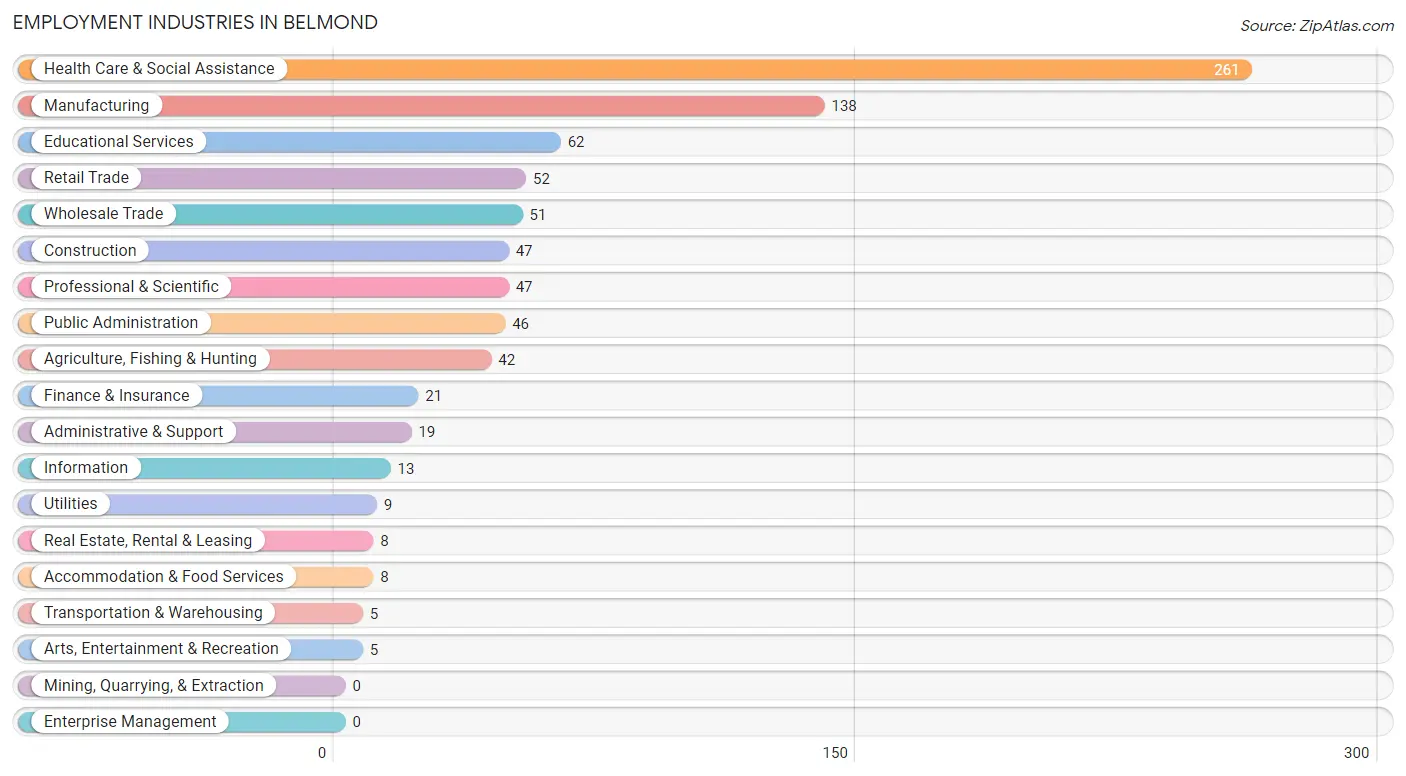
Employment Industries in Belmond
The major employment industries in Belmond include Health Care & Social Assistance (261 | 30.1%), Manufacturing (138 | 15.9%), Educational Services (62 | 7.2%), Retail Trade (52 | 6.0%), and Wholesale Trade (51 | 5.9%).
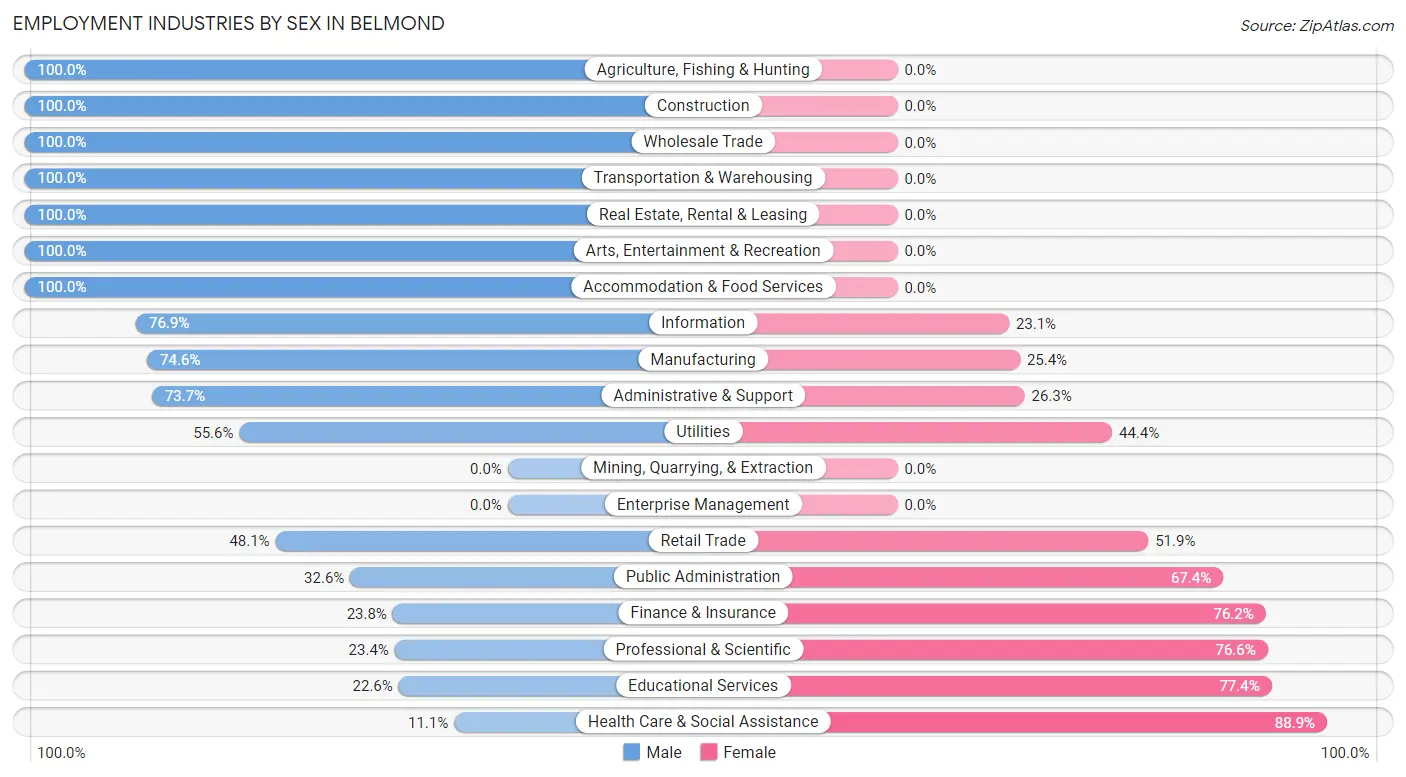
Employment Industries by Sex in Belmond
The Belmond industries that see more men than women are Agriculture, Fishing & Hunting (100.0%), Construction (100.0%), and Wholesale Trade (100.0%), whereas the industries that tend to have a higher number of women are Health Care & Social Assistance (88.9%), Educational Services (77.4%), and Professional & Scientific (76.6%).
| Industry | Male | Female |
| Agriculture, Fishing & Hunting | 42 (100.0%) | 0 (0.0%) |
| Mining, Quarrying, & Extraction | 0 (0.0%) | 0 (0.0%) |
| Construction | 47 (100.0%) | 0 (0.0%) |
| Manufacturing | 103 (74.6%) | 35 (25.4%) |
| Wholesale Trade | 51 (100.0%) | 0 (0.0%) |
| Retail Trade | 25 (48.1%) | 27 (51.9%) |
| Transportation & Warehousing | 5 (100.0%) | 0 (0.0%) |
| Utilities | 5 (55.6%) | 4 (44.4%) |
| Information | 10 (76.9%) | 3 (23.1%) |
| Finance & Insurance | 5 (23.8%) | 16 (76.2%) |
| Real Estate, Rental & Leasing | 8 (100.0%) | 0 (0.0%) |
| Professional & Scientific | 11 (23.4%) | 36 (76.6%) |
| Enterprise Management | 0 (0.0%) | 0 (0.0%) |
| Administrative & Support | 14 (73.7%) | 5 (26.3%) |
| Educational Services | 14 (22.6%) | 48 (77.4%) |
| Health Care & Social Assistance | 29 (11.1%) | 232 (88.9%) |
| Arts, Entertainment & Recreation | 5 (100.0%) | 0 (0.0%) |
| Accommodation & Food Services | 8 (100.0%) | 0 (0.0%) |
| Public Administration | 15 (32.6%) | 31 (67.4%) |
| Total | 397 (45.8%) | 469 (54.2%) |
Education in Belmond
School Enrollment in Belmond
The most common levels of schooling among the 704 students in Belmond are middle school (234 | 33.2%), high school (151 | 21.4%), and elementary school (147 | 20.9%).
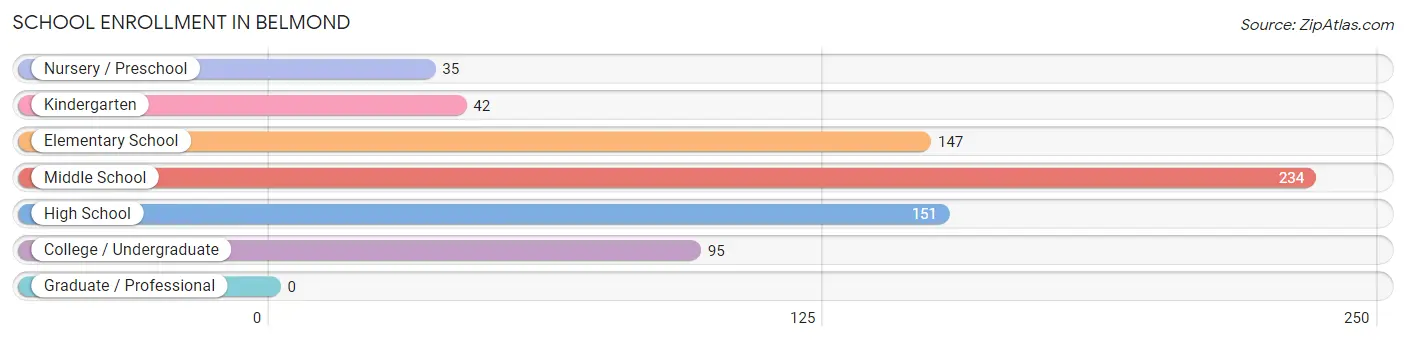
| School Level | # Students | % Students |
| Nursery / Preschool | 35 | 5.0% |
| Kindergarten | 42 | 6.0% |
| Elementary School | 147 | 20.9% |
| Middle School | 234 | 33.2% |
| High School | 151 | 21.4% |
| College / Undergraduate | 95 | 13.5% |
| Graduate / Professional | 0 | 0.0% |
| Total | 704 | 100.0% |
School Enrollment by Age by Funding Source in Belmond
Out of a total of 704 students who are enrolled in schools in Belmond, 29 (4.1%) attend a private institution, while the remaining 675 (95.9%) are enrolled in public schools. The age group of 18 to 19 year olds has the highest likelihood of being enrolled in private schools, with 19 (79.2% in the age bracket) enrolled. Conversely, the age group of 3 to 4 year olds has the lowest likelihood of being enrolled in a private school, with 17 (100.0% in the age bracket) attending a public institution.
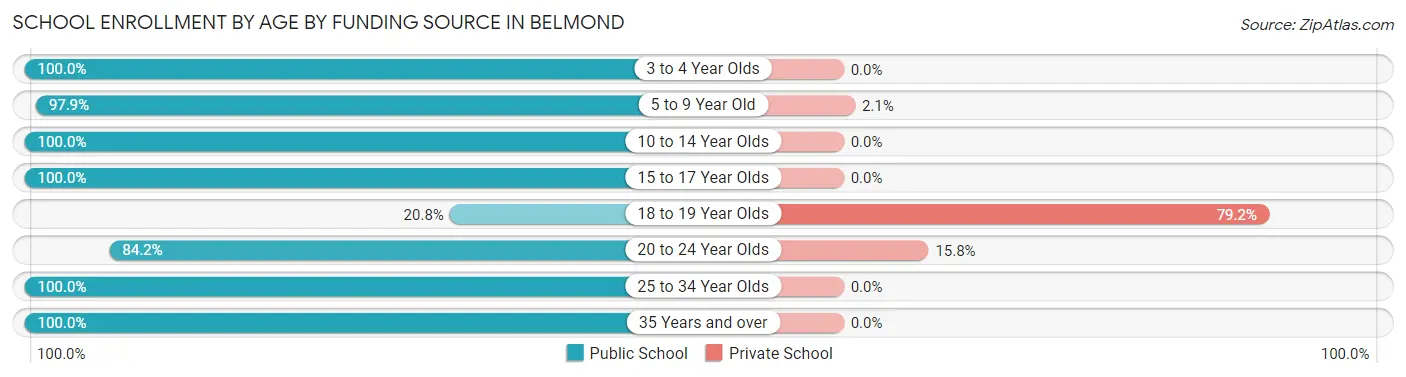
| Age Bracket | Public School | Private School |
| 3 to 4 Year Olds | 17 (100.0%) | 0 (0.0%) |
| 5 to 9 Year Old | 186 (97.9%) | 4 (2.1%) |
| 10 to 14 Year Olds | 251 (100.0%) | 0 (0.0%) |
| 15 to 17 Year Olds | 151 (100.0%) | 0 (0.0%) |
| 18 to 19 Year Olds | 5 (20.8%) | 19 (79.2%) |
| 20 to 24 Year Olds | 32 (84.2%) | 6 (15.8%) |
| 25 to 34 Year Olds | 11 (100.0%) | 0 (0.0%) |
| 35 Years and over | 22 (100.0%) | 0 (0.0%) |
| Total | 675 (95.9%) | 29 (4.1%) |
Educational Attainment by Field of Study in Belmond
Education (124 | 22.8%), business (103 | 19.0%), arts & humanities (54 | 9.9%), science & technology (48 | 8.8%), and liberal arts & history (40 | 7.4%) are the most common fields of study among 543 individuals in Belmond who have obtained a bachelor's degree or higher.
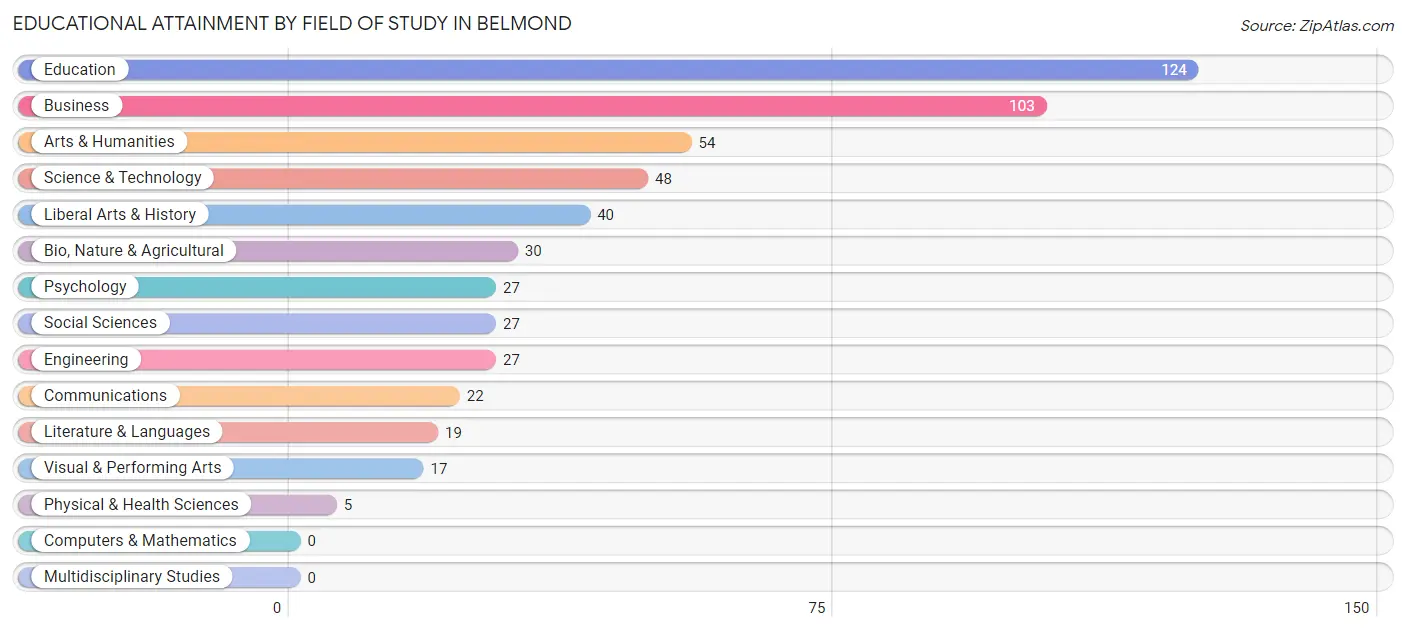
| Field of Study | # Graduates | % Graduates |
| Computers & Mathematics | 0 | 0.0% |
| Bio, Nature & Agricultural | 30 | 5.5% |
| Physical & Health Sciences | 5 | 0.9% |
| Psychology | 27 | 5.0% |
| Social Sciences | 27 | 5.0% |
| Engineering | 27 | 5.0% |
| Multidisciplinary Studies | 0 | 0.0% |
| Science & Technology | 48 | 8.8% |
| Business | 103 | 19.0% |
| Education | 124 | 22.8% |
| Literature & Languages | 19 | 3.5% |
| Liberal Arts & History | 40 | 7.4% |
| Visual & Performing Arts | 17 | 3.1% |
| Communications | 22 | 4.1% |
| Arts & Humanities | 54 | 9.9% |
| Total | 543 | 100.0% |
Transportation & Commute in Belmond
Vehicle Availability by Sex in Belmond
The most prevalent vehicle ownership categories in Belmond are males with 2 vehicles (232, accounting for 59.0%) and females with 2 vehicles (281, making up 51.6%).
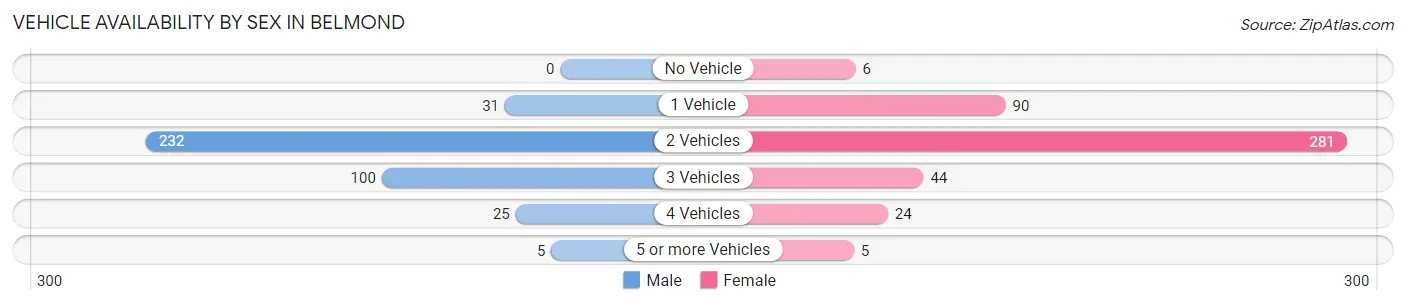
| Vehicles Available | Male | Female |
| No Vehicle | 0 (0.0%) | 6 (1.3%) |
| 1 Vehicle | 31 (7.9%) | 90 (20.0%) |
| 2 Vehicles | 232 (59.0%) | 281 (62.4%) |
| 3 Vehicles | 100 (25.5%) | 44 (9.8%) |
| 4 Vehicles | 25 (6.4%) | 24 (5.3%) |
| 5 or more Vehicles | 5 (1.3%) | 5 (1.1%) |
| Total | 393 (100.0%) | 450 (100.0%) |
Commute Time in Belmond
The most frequently occuring commute durations in Belmond are less than 5 minutes (160 commuters, 20.4%), 5 to 9 minutes (156 commuters, 19.9%), and 20 to 24 minutes (147 commuters, 18.8%).
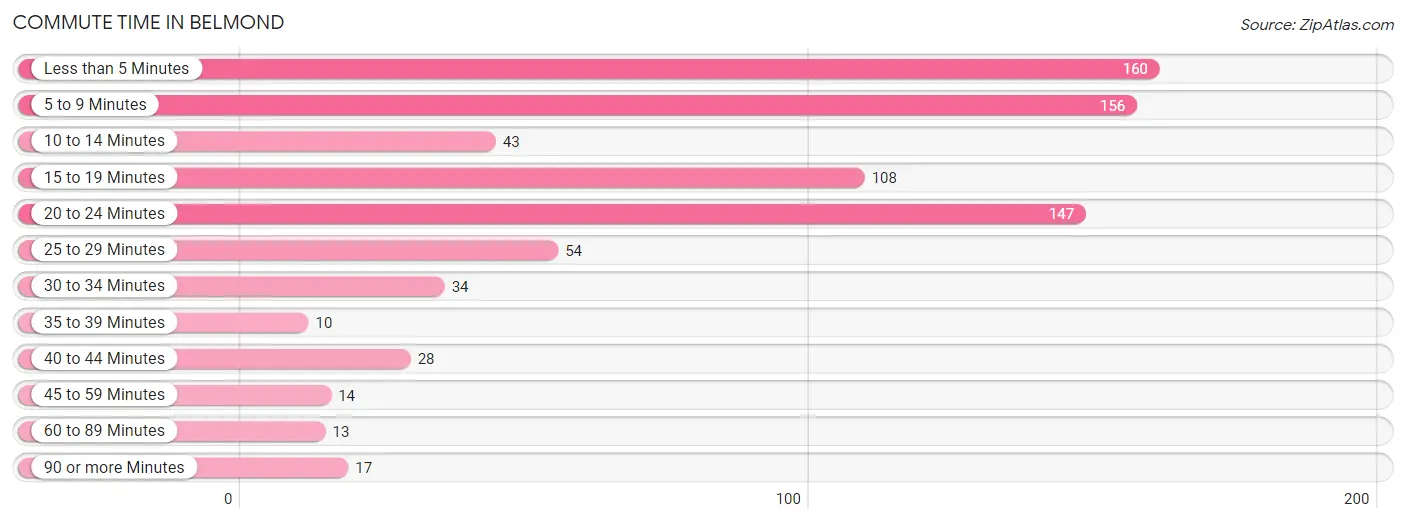
| Commute Time | # Commuters | % Commuters |
| Less than 5 Minutes | 160 | 20.4% |
| 5 to 9 Minutes | 156 | 19.9% |
| 10 to 14 Minutes | 43 | 5.5% |
| 15 to 19 Minutes | 108 | 13.8% |
| 20 to 24 Minutes | 147 | 18.8% |
| 25 to 29 Minutes | 54 | 6.9% |
| 30 to 34 Minutes | 34 | 4.3% |
| 35 to 39 Minutes | 10 | 1.3% |
| 40 to 44 Minutes | 28 | 3.6% |
| 45 to 59 Minutes | 14 | 1.8% |
| 60 to 89 Minutes | 13 | 1.7% |
| 90 or more Minutes | 17 | 2.2% |
Commute Time by Sex in Belmond
The most common commute times in Belmond are less than 5 minutes (91 commuters, 23.9%) for males and 5 to 9 minutes (106 commuters, 26.3%) for females.
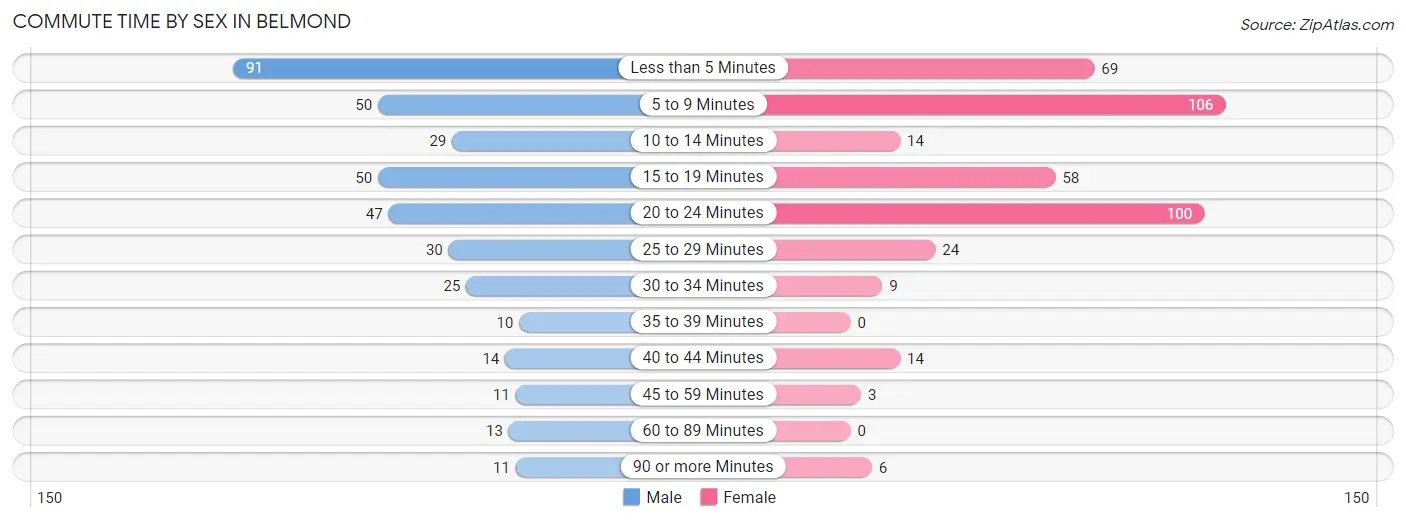
| Commute Time | Male | Female |
| Less than 5 Minutes | 91 (23.9%) | 69 (17.1%) |
| 5 to 9 Minutes | 50 (13.1%) | 106 (26.3%) |
| 10 to 14 Minutes | 29 (7.6%) | 14 (3.5%) |
| 15 to 19 Minutes | 50 (13.1%) | 58 (14.4%) |
| 20 to 24 Minutes | 47 (12.3%) | 100 (24.8%) |
| 25 to 29 Minutes | 30 (7.9%) | 24 (6.0%) |
| 30 to 34 Minutes | 25 (6.6%) | 9 (2.2%) |
| 35 to 39 Minutes | 10 (2.6%) | 0 (0.0%) |
| 40 to 44 Minutes | 14 (3.7%) | 14 (3.5%) |
| 45 to 59 Minutes | 11 (2.9%) | 3 (0.7%) |
| 60 to 89 Minutes | 13 (3.4%) | 0 (0.0%) |
| 90 or more Minutes | 11 (2.9%) | 6 (1.5%) |
Time of Departure to Work by Sex in Belmond
The most frequent times of departure to work in Belmond are 6:30 AM to 6:59 AM (78, 20.5%) for males and 7:30 AM to 7:59 AM (107, 26.6%) for females.
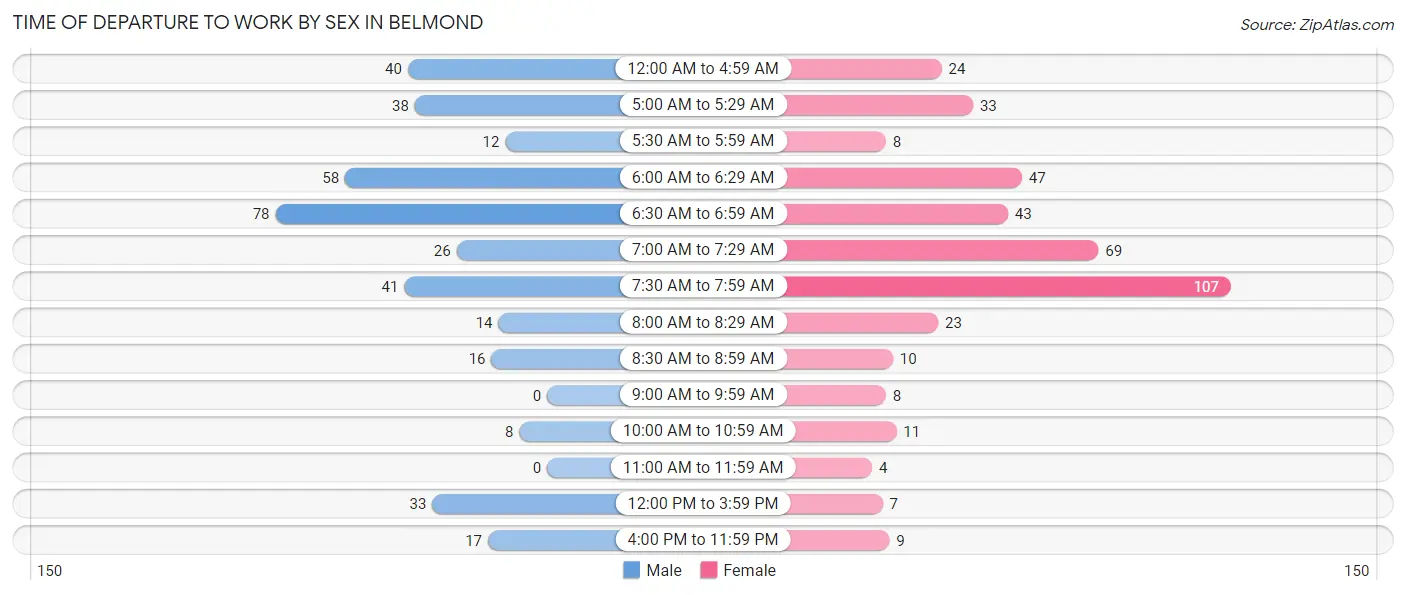
| Time of Departure | Male | Female |
| 12:00 AM to 4:59 AM | 40 (10.5%) | 24 (6.0%) |
| 5:00 AM to 5:29 AM | 38 (10.0%) | 33 (8.2%) |
| 5:30 AM to 5:59 AM | 12 (3.2%) | 8 (2.0%) |
| 6:00 AM to 6:29 AM | 58 (15.2%) | 47 (11.7%) |
| 6:30 AM to 6:59 AM | 78 (20.5%) | 43 (10.7%) |
| 7:00 AM to 7:29 AM | 26 (6.8%) | 69 (17.1%) |
| 7:30 AM to 7:59 AM | 41 (10.8%) | 107 (26.6%) |
| 8:00 AM to 8:29 AM | 14 (3.7%) | 23 (5.7%) |
| 8:30 AM to 8:59 AM | 16 (4.2%) | 10 (2.5%) |
| 9:00 AM to 9:59 AM | 0 (0.0%) | 8 (2.0%) |
| 10:00 AM to 10:59 AM | 8 (2.1%) | 11 (2.7%) |
| 11:00 AM to 11:59 AM | 0 (0.0%) | 4 (1.0%) |
| 12:00 PM to 3:59 PM | 33 (8.7%) | 7 (1.7%) |
| 4:00 PM to 11:59 PM | 17 (4.5%) | 9 (2.2%) |
| Total | 381 (100.0%) | 403 (100.0%) |
Housing Occupancy in Belmond
Occupancy by Ownership in Belmond
Of the total 984 dwellings in Belmond, owner-occupied units account for 753 (76.5%), while renter-occupied units make up 231 (23.5%).
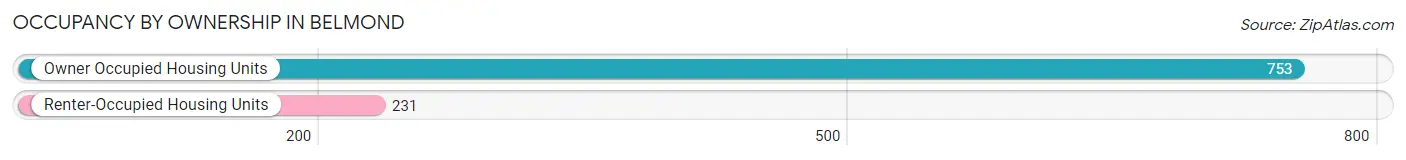
| Occupancy | # Housing Units | % Housing Units |
| Owner Occupied Housing Units | 753 | 76.5% |
| Renter-Occupied Housing Units | 231 | 23.5% |
| Total Occupied Housing Units | 984 | 100.0% |
Occupancy by Household Size in Belmond
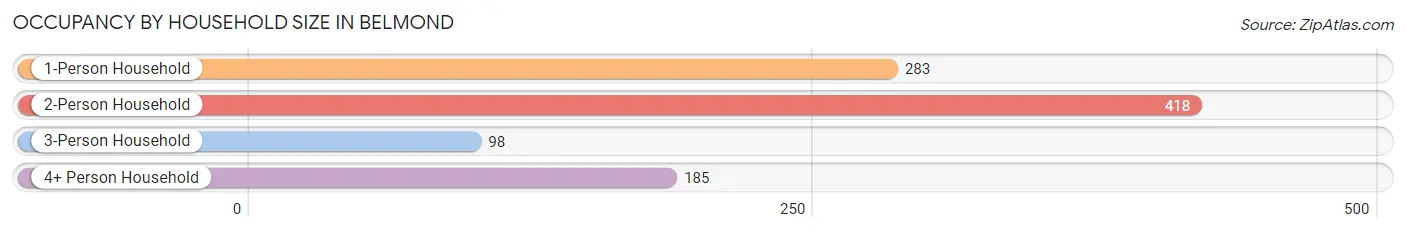
| Household Size | # Housing Units | % Housing Units |
| 1-Person Household | 283 | 28.8% |
| 2-Person Household | 418 | 42.5% |
| 3-Person Household | 98 | 10.0% |
| 4+ Person Household | 185 | 18.8% |
| Total Housing Units | 984 | 100.0% |
Occupancy by Ownership by Household Size in Belmond
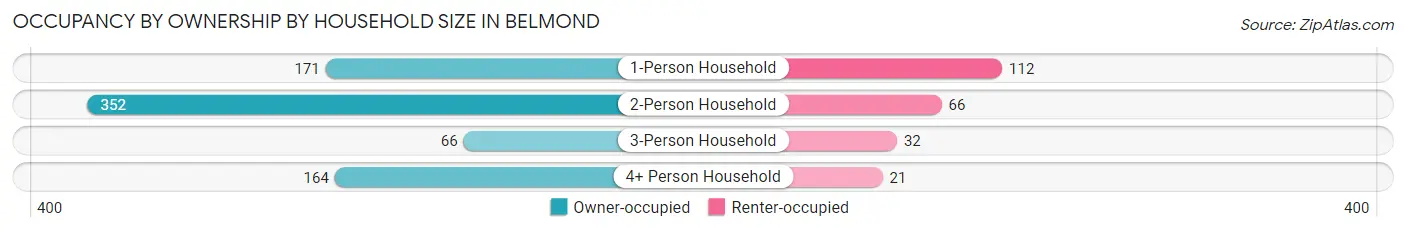
| Household Size | Owner-occupied | Renter-occupied |
| 1-Person Household | 171 (60.4%) | 112 (39.6%) |
| 2-Person Household | 352 (84.2%) | 66 (15.8%) |
| 3-Person Household | 66 (67.3%) | 32 (32.7%) |
| 4+ Person Household | 164 (88.6%) | 21 (11.4%) |
| Total Housing Units | 753 (76.5%) | 231 (23.5%) |
Occupancy by Educational Attainment in Belmond
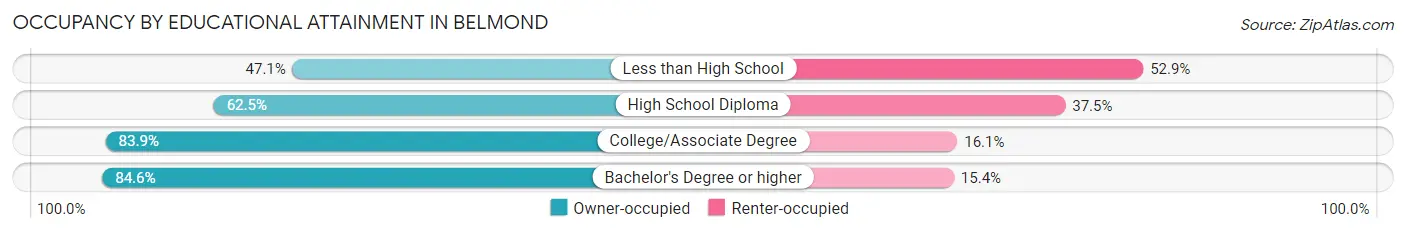
| Household Size | Owner-occupied | Renter-occupied |
| Less than High School | 8 (47.1%) | 9 (52.9%) |
| High School Diploma | 200 (62.5%) | 120 (37.5%) |
| College/Associate Degree | 287 (83.9%) | 55 (16.1%) |
| Bachelor's Degree or higher | 258 (84.6%) | 47 (15.4%) |
Occupancy by Age of Householder in Belmond
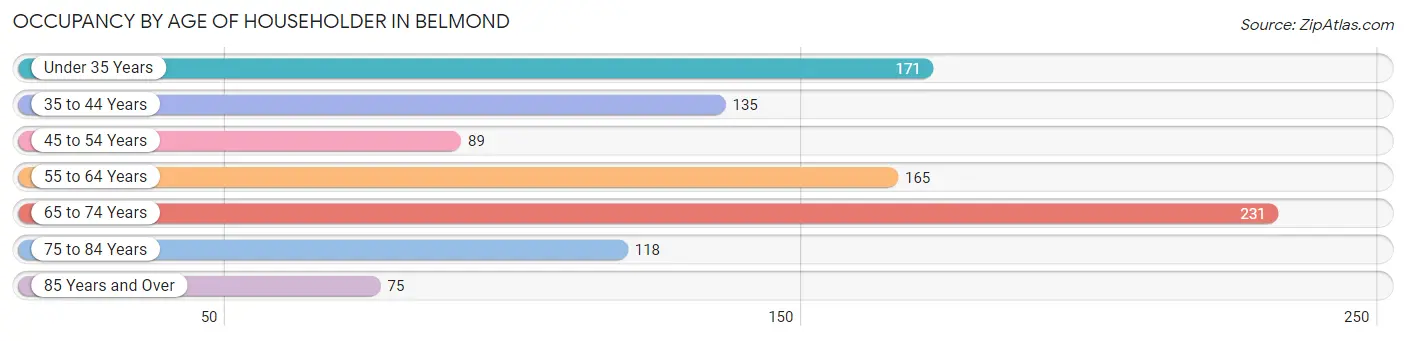
| Age Bracket | # Households | % Households |
| Under 35 Years | 171 | 17.4% |
| 35 to 44 Years | 135 | 13.7% |
| 45 to 54 Years | 89 | 9.0% |
| 55 to 64 Years | 165 | 16.8% |
| 65 to 74 Years | 231 | 23.5% |
| 75 to 84 Years | 118 | 12.0% |
| 85 Years and Over | 75 | 7.6% |
| Total | 984 | 100.0% |
Housing Finances in Belmond
Median Income by Occupancy in Belmond
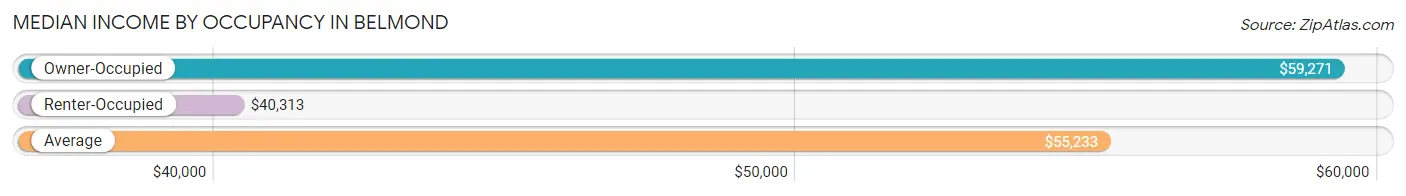
| Occupancy Type | # Households | Median Income |
| Owner-Occupied | 753 (76.5%) | $59,271 |
| Renter-Occupied | 231 (23.5%) | $40,313 |
| Average | 984 (100.0%) | $55,233 |
Occupancy by Householder Income Bracket in Belmond
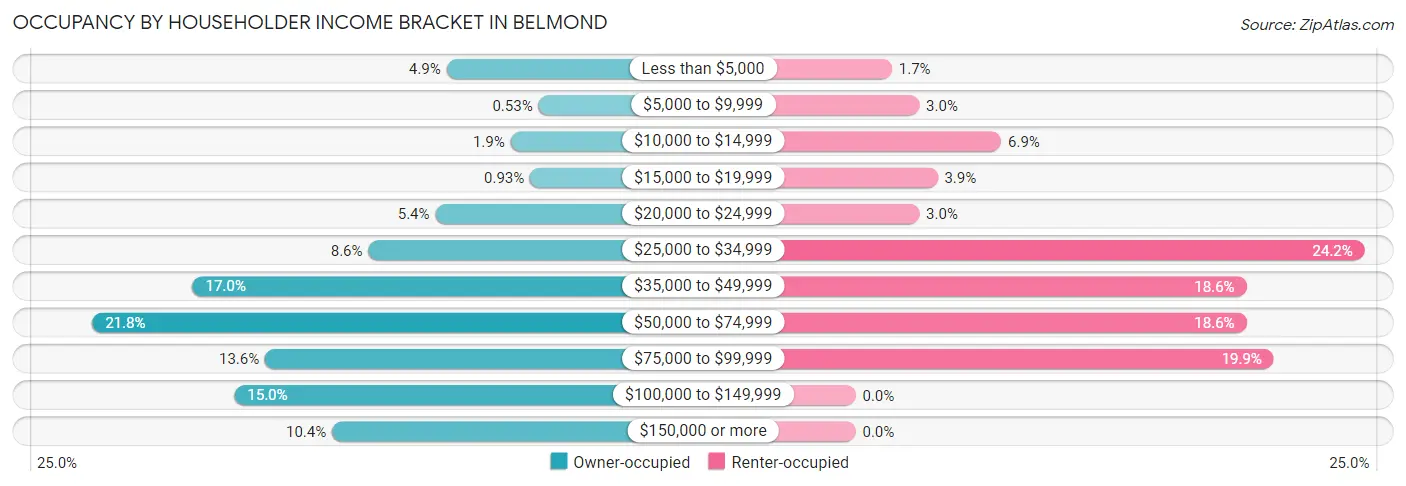
| Income Bracket | Owner-occupied | Renter-occupied |
| Less than $5,000 | 37 (4.9%) | 4 (1.7%) |
| $5,000 to $9,999 | 4 (0.5%) | 7 (3.0%) |
| $10,000 to $14,999 | 14 (1.9%) | 16 (6.9%) |
| $15,000 to $19,999 | 7 (0.9%) | 9 (3.9%) |
| $20,000 to $24,999 | 41 (5.4%) | 7 (3.0%) |
| $25,000 to $34,999 | 65 (8.6%) | 56 (24.2%) |
| $35,000 to $49,999 | 128 (17.0%) | 43 (18.6%) |
| $50,000 to $74,999 | 164 (21.8%) | 43 (18.6%) |
| $75,000 to $99,999 | 102 (13.6%) | 46 (19.9%) |
| $100,000 to $149,999 | 113 (15.0%) | 0 (0.0%) |
| $150,000 or more | 78 (10.4%) | 0 (0.0%) |
| Total | 753 (100.0%) | 231 (100.0%) |
Monthly Housing Cost Tiers in Belmond
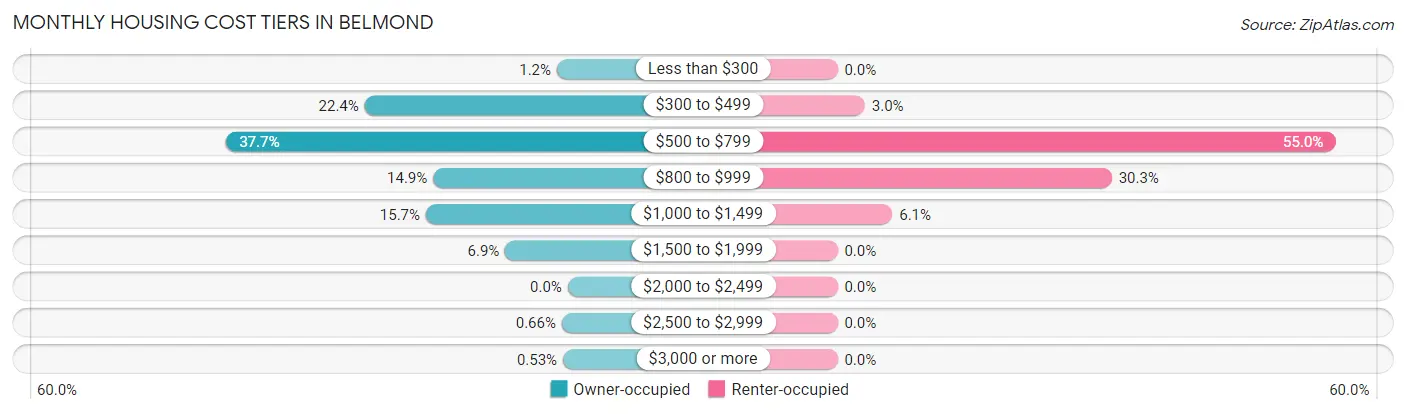
| Monthly Cost | Owner-occupied | Renter-occupied |
| Less than $300 | 9 (1.2%) | 0 (0.0%) |
| $300 to $499 | 169 (22.4%) | 7 (3.0%) |
| $500 to $799 | 284 (37.7%) | 127 (55.0%) |
| $800 to $999 | 112 (14.9%) | 70 (30.3%) |
| $1,000 to $1,499 | 118 (15.7%) | 14 (6.1%) |
| $1,500 to $1,999 | 52 (6.9%) | 0 (0.0%) |
| $2,000 to $2,499 | 0 (0.0%) | 0 (0.0%) |
| $2,500 to $2,999 | 5 (0.7%) | 0 (0.0%) |
| $3,000 or more | 4 (0.5%) | 0 (0.0%) |
| Total | 753 (100.0%) | 231 (100.0%) |
Physical Housing Characteristics in Belmond
Housing Structures in Belmond
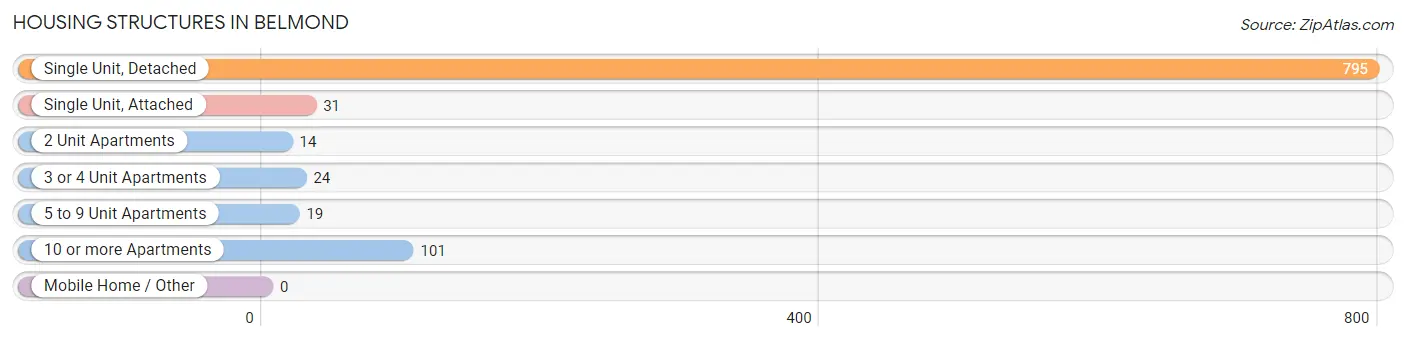
| Structure Type | # Housing Units | % Housing Units |
| Single Unit, Detached | 795 | 80.8% |
| Single Unit, Attached | 31 | 3.2% |
| 2 Unit Apartments | 14 | 1.4% |
| 3 or 4 Unit Apartments | 24 | 2.4% |
| 5 to 9 Unit Apartments | 19 | 1.9% |
| 10 or more Apartments | 101 | 10.3% |
| Mobile Home / Other | 0 | 0.0% |
| Total | 984 | 100.0% |
Housing Structures by Occupancy in Belmond
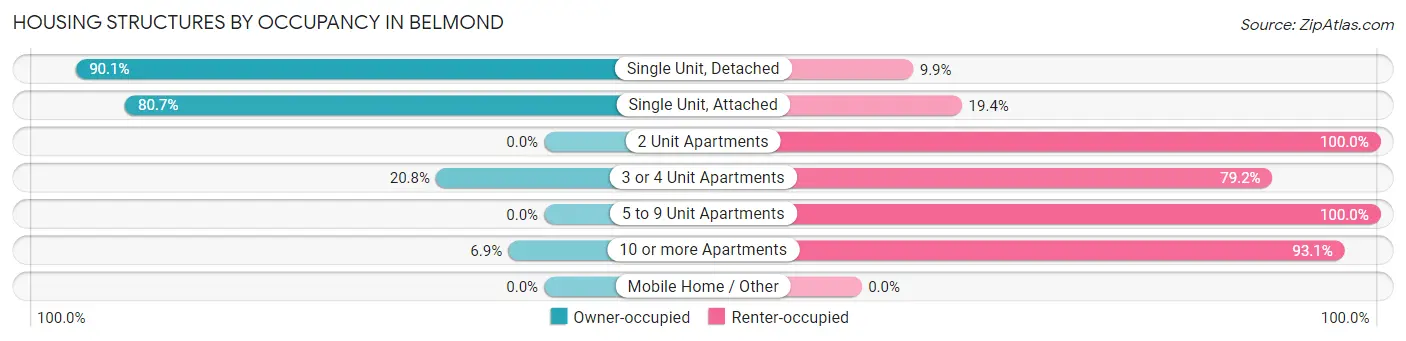
| Structure Type | Owner-occupied | Renter-occupied |
| Single Unit, Detached | 716 (90.1%) | 79 (9.9%) |
| Single Unit, Attached | 25 (80.6%) | 6 (19.4%) |
| 2 Unit Apartments | 0 (0.0%) | 14 (100.0%) |
| 3 or 4 Unit Apartments | 5 (20.8%) | 19 (79.2%) |
| 5 to 9 Unit Apartments | 0 (0.0%) | 19 (100.0%) |
| 10 or more Apartments | 7 (6.9%) | 94 (93.1%) |
| Mobile Home / Other | 0 (0.0%) | 0 (0.0%) |
| Total | 753 (76.5%) | 231 (23.5%) |
Housing Structures by Number of Rooms in Belmond
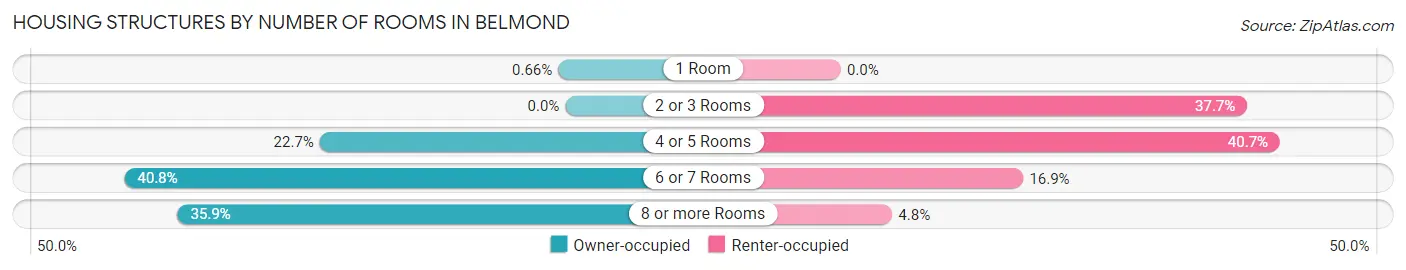
| Number of Rooms | Owner-occupied | Renter-occupied |
| 1 Room | 5 (0.7%) | 0 (0.0%) |
| 2 or 3 Rooms | 0 (0.0%) | 87 (37.7%) |
| 4 or 5 Rooms | 171 (22.7%) | 94 (40.7%) |
| 6 or 7 Rooms | 307 (40.8%) | 39 (16.9%) |
| 8 or more Rooms | 270 (35.9%) | 11 (4.8%) |
| Total | 753 (100.0%) | 231 (100.0%) |
Housing Structure by Heating Type in Belmond
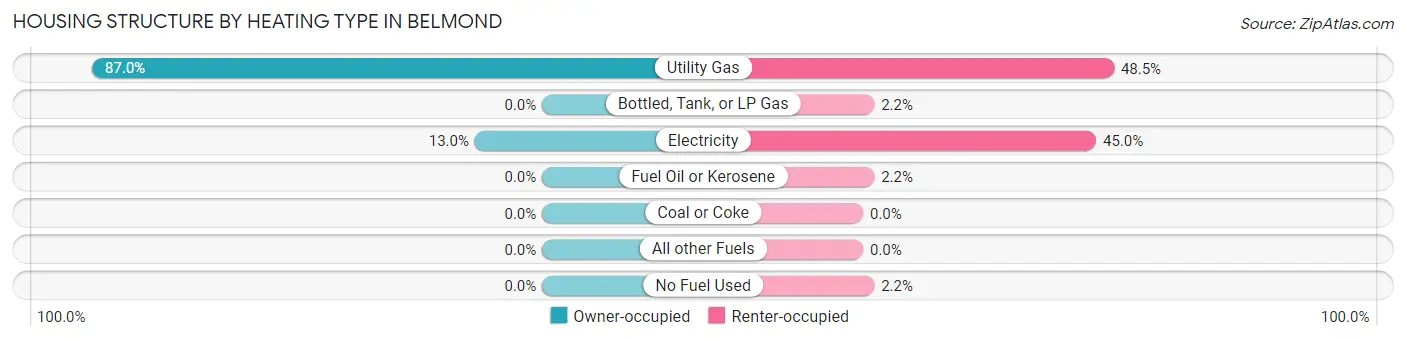
| Heating Type | Owner-occupied | Renter-occupied |
| Utility Gas | 655 (87.0%) | 112 (48.5%) |
| Bottled, Tank, or LP Gas | 0 (0.0%) | 5 (2.2%) |
| Electricity | 98 (13.0%) | 104 (45.0%) |
| Fuel Oil or Kerosene | 0 (0.0%) | 5 (2.2%) |
| Coal or Coke | 0 (0.0%) | 0 (0.0%) |
| All other Fuels | 0 (0.0%) | 0 (0.0%) |
| No Fuel Used | 0 (0.0%) | 5 (2.2%) |
| Total | 753 (100.0%) | 231 (100.0%) |
Household Vehicle Usage in Belmond
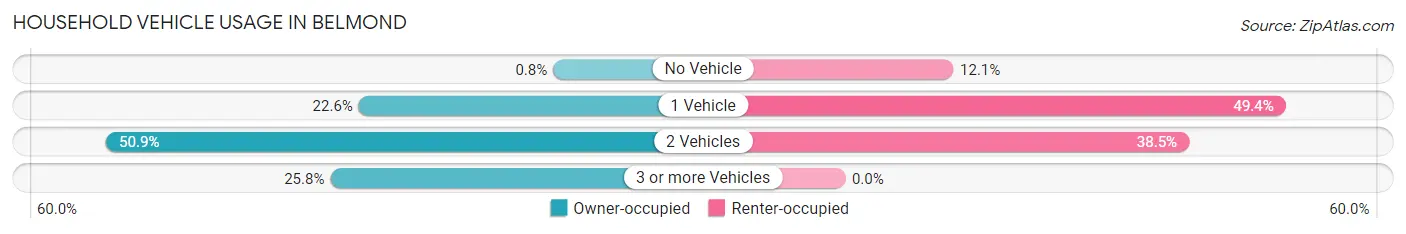
| Vehicles per Household | Owner-occupied | Renter-occupied |
| No Vehicle | 6 (0.8%) | 28 (12.1%) |
| 1 Vehicle | 170 (22.6%) | 114 (49.3%) |
| 2 Vehicles | 383 (50.9%) | 89 (38.5%) |
| 3 or more Vehicles | 194 (25.8%) | 0 (0.0%) |
| Total | 753 (100.0%) | 231 (100.0%) |
Real Estate & Mortgages in Belmond
Real Estate and Mortgage Overview in Belmond
| Characteristic | Without Mortgage | With Mortgage |
| Housing Units | 398 | 355 |
| Median Property Value | $110,700 | $96,700 |
| Median Household Income | $55,833 | $26 |
| Monthly Housing Costs | $521 | $0 |
| Real Estate Taxes | $1,750 | $12 |
Property Value by Mortgage Status in Belmond
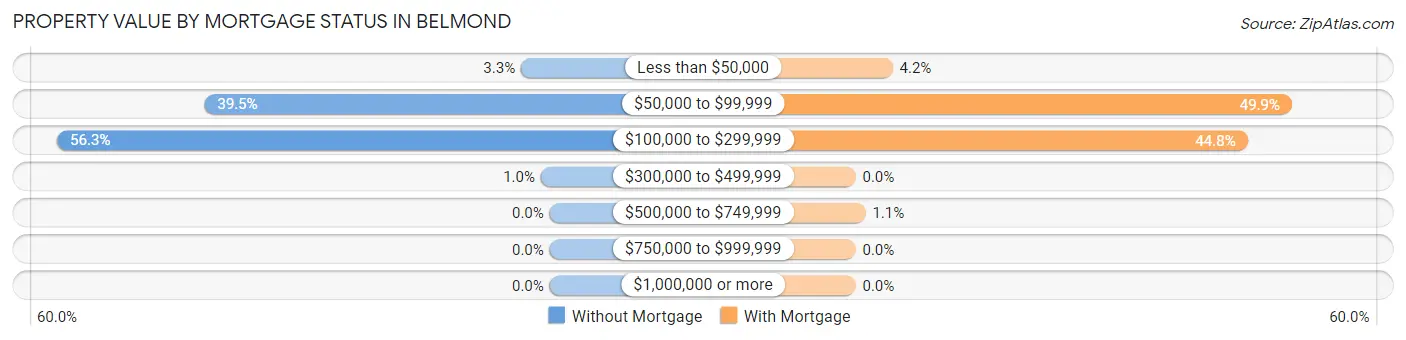
| Property Value | Without Mortgage | With Mortgage |
| Less than $50,000 | 13 (3.3%) | 15 (4.2%) |
| $50,000 to $99,999 | 157 (39.5%) | 177 (49.9%) |
| $100,000 to $299,999 | 224 (56.3%) | 159 (44.8%) |
| $300,000 to $499,999 | 4 (1.0%) | 0 (0.0%) |
| $500,000 to $749,999 | 0 (0.0%) | 4 (1.1%) |
| $750,000 to $999,999 | 0 (0.0%) | 0 (0.0%) |
| $1,000,000 or more | 0 (0.0%) | 0 (0.0%) |
| Total | 398 (100.0%) | 355 (100.0%) |
Household Income by Mortgage Status in Belmond
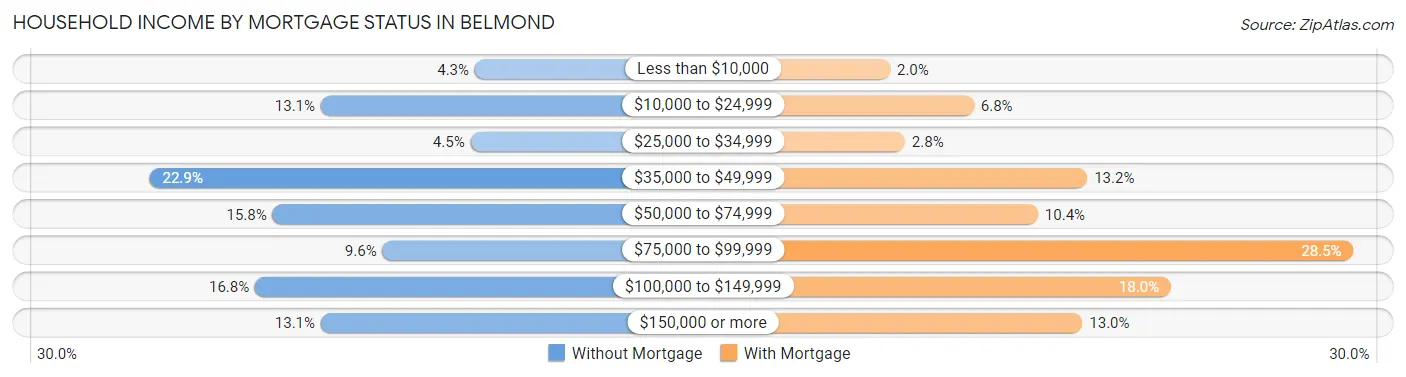
| Household Income | Without Mortgage | With Mortgage |
| Less than $10,000 | 17 (4.3%) | 7 (2.0%) |
| $10,000 to $24,999 | 52 (13.1%) | 24 (6.8%) |
| $25,000 to $34,999 | 18 (4.5%) | 10 (2.8%) |
| $35,000 to $49,999 | 91 (22.9%) | 47 (13.2%) |
| $50,000 to $74,999 | 63 (15.8%) | 37 (10.4%) |
| $75,000 to $99,999 | 38 (9.6%) | 101 (28.4%) |
| $100,000 to $149,999 | 67 (16.8%) | 64 (18.0%) |
| $150,000 or more | 52 (13.1%) | 46 (13.0%) |
| Total | 398 (100.0%) | 355 (100.0%) |
Property Value to Household Income Ratio in Belmond
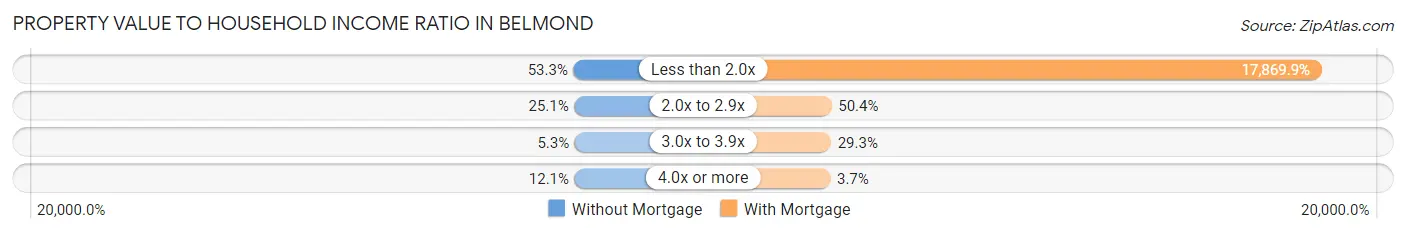
| Value-to-Income Ratio | Without Mortgage | With Mortgage |
| Less than 2.0x | 212 (53.3%) | 63,438 (17,869.9%) |
| 2.0x to 2.9x | 100 (25.1%) | 179 (50.4%) |
| 3.0x to 3.9x | 21 (5.3%) | 104 (29.3%) |
| 4.0x or more | 48 (12.1%) | 13 (3.7%) |
| Total | 398 (100.0%) | 355 (100.0%) |
Real Estate Taxes by Mortgage Status in Belmond
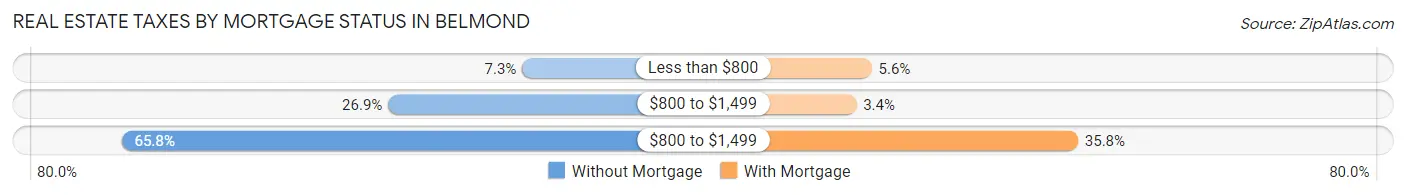
| Property Taxes | Without Mortgage | With Mortgage |
| Less than $800 | 29 (7.3%) | 20 (5.6%) |
| $800 to $1,499 | 107 (26.9%) | 12 (3.4%) |
| $800 to $1,499 | 262 (65.8%) | 127 (35.8%) |
| Total | 398 (100.0%) | 355 (100.0%) |
Health & Disability in Belmond
Health Insurance Coverage by Age in Belmond

| Age Bracket | With Coverage | Without Coverage |
| Under 6 Years | 201 (100.0%) | 0 (0.0%) |
| 6 to 18 Years | 553 (97.4%) | 15 (2.6%) |
| 19 to 25 Years | 122 (83.6%) | 24 (16.4%) |
| 26 to 34 Years | 168 (78.1%) | 47 (21.9%) |
| 35 to 44 Years | 246 (93.2%) | 18 (6.8%) |
| 45 to 54 Years | 126 (83.4%) | 25 (16.6%) |
| 55 to 64 Years | 237 (98.3%) | 4 (1.7%) |
| 65 to 74 Years | 351 (98.3%) | 6 (1.7%) |
| 75 Years and older | 316 (100.0%) | 0 (0.0%) |
| Total | 2,320 (94.4%) | 139 (5.7%) |
Health Insurance Coverage by Citizenship Status in Belmond
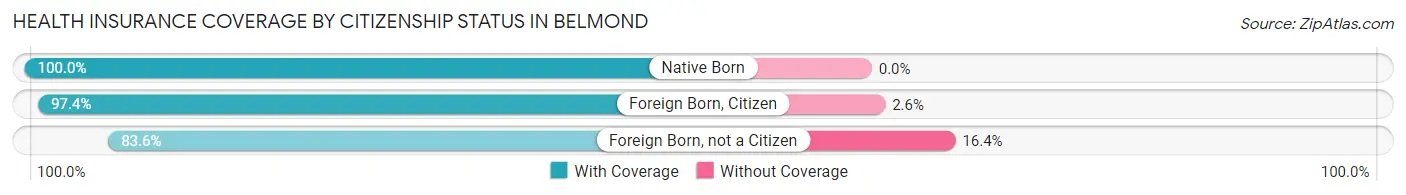
| Citizenship Status | With Coverage | Without Coverage |
| Native Born | 201 (100.0%) | 0 (0.0%) |
| Foreign Born, Citizen | 553 (97.4%) | 15 (2.6%) |
| Foreign Born, not a Citizen | 122 (83.6%) | 24 (16.4%) |
Health Insurance Coverage by Household Income in Belmond
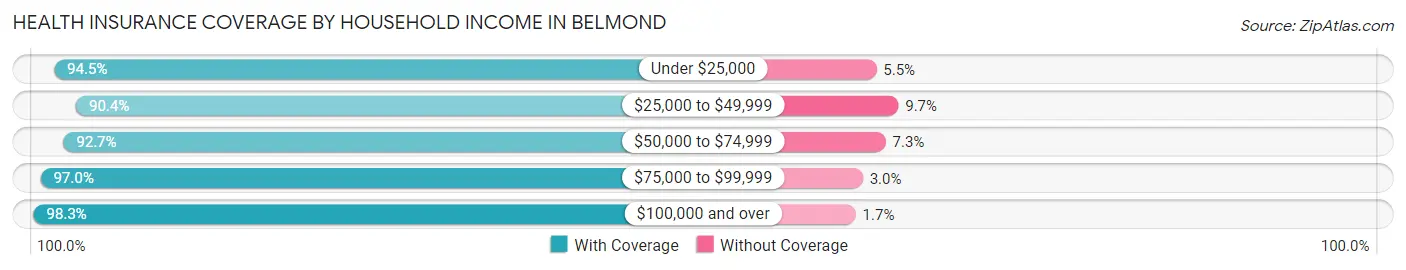
| Household Income | With Coverage | Without Coverage |
| Under $25,000 | 324 (94.5%) | 19 (5.5%) |
| $25,000 to $49,999 | 487 (90.3%) | 52 (9.7%) |
| $50,000 to $74,999 | 612 (92.7%) | 48 (7.3%) |
| $75,000 to $99,999 | 358 (97.0%) | 11 (3.0%) |
| $100,000 and over | 534 (98.3%) | 9 (1.7%) |
Public vs Private Health Insurance Coverage by Age in Belmond
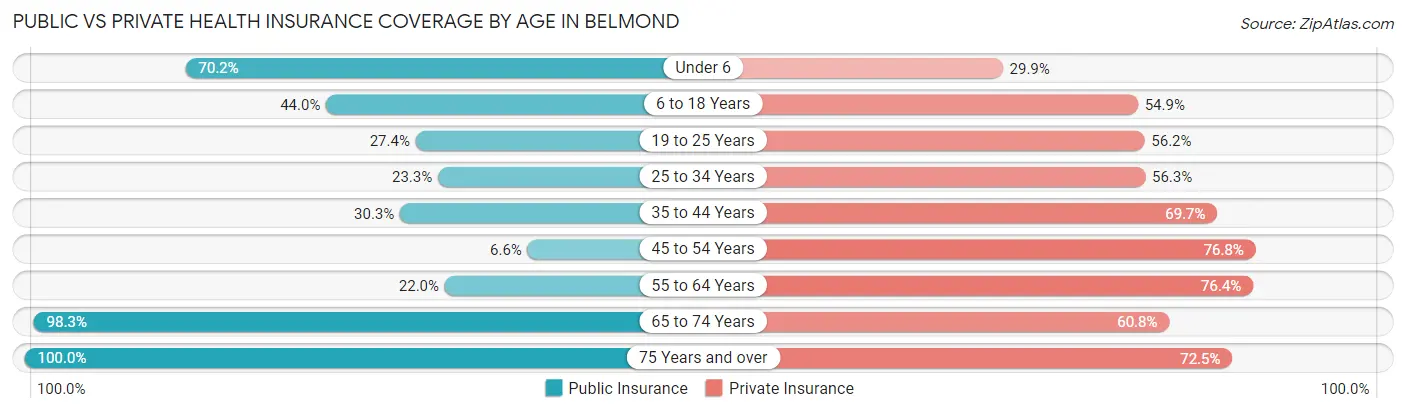
| Age Bracket | Public Insurance | Private Insurance |
| Under 6 | 141 (70.2%) | 60 (29.8%) |
| 6 to 18 Years | 250 (44.0%) | 312 (54.9%) |
| 19 to 25 Years | 40 (27.4%) | 82 (56.2%) |
| 25 to 34 Years | 50 (23.3%) | 121 (56.3%) |
| 35 to 44 Years | 80 (30.3%) | 184 (69.7%) |
| 45 to 54 Years | 10 (6.6%) | 116 (76.8%) |
| 55 to 64 Years | 53 (22.0%) | 184 (76.3%) |
| 65 to 74 Years | 351 (98.3%) | 217 (60.8%) |
| 75 Years and over | 316 (100.0%) | 229 (72.5%) |
| Total | 1,291 (52.5%) | 1,505 (61.2%) |
Disability Status by Sex by Age in Belmond
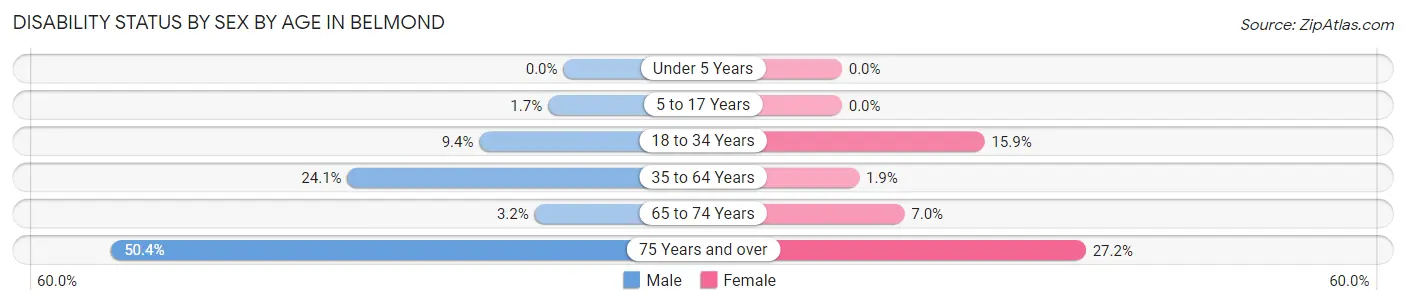
| Age Bracket | Male | Female |
| Under 5 Years | 0 (0.0%) | 0 (0.0%) |
| 5 to 17 Years | 5 (1.7%) | 0 (0.0%) |
| 18 to 34 Years | 16 (9.4%) | 34 (15.9%) |
| 35 to 64 Years | 70 (24.0%) | 7 (1.9%) |
| 65 to 74 Years | 5 (3.2%) | 14 (7.0%) |
| 75 Years and over | 72 (50.3%) | 47 (27.2%) |
Disability Class by Sex by Age in Belmond
Disability Class: Hearing Difficulty
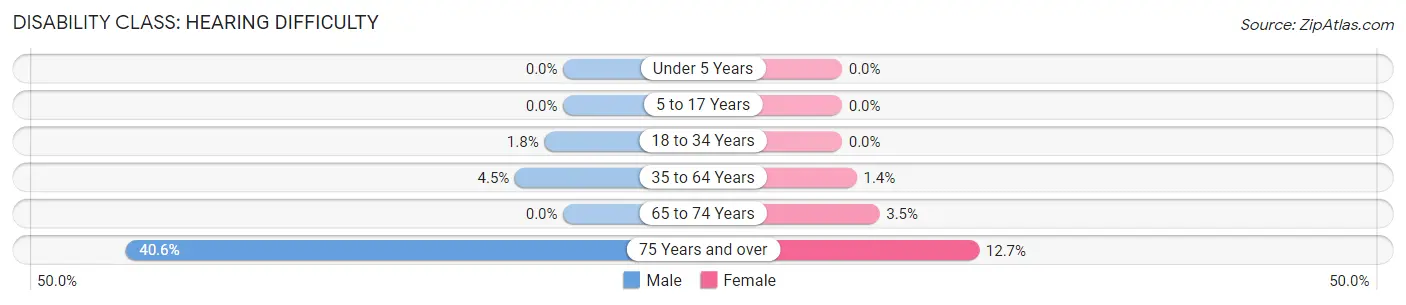
| Age Bracket | Male | Female |
| Under 5 Years | 0 (0.0%) | 0 (0.0%) |
| 5 to 17 Years | 0 (0.0%) | 0 (0.0%) |
| 18 to 34 Years | 3 (1.8%) | 0 (0.0%) |
| 35 to 64 Years | 13 (4.5%) | 5 (1.4%) |
| 65 to 74 Years | 0 (0.0%) | 7 (3.5%) |
| 75 Years and over | 58 (40.6%) | 22 (12.7%) |
Disability Class: Vision Difficulty
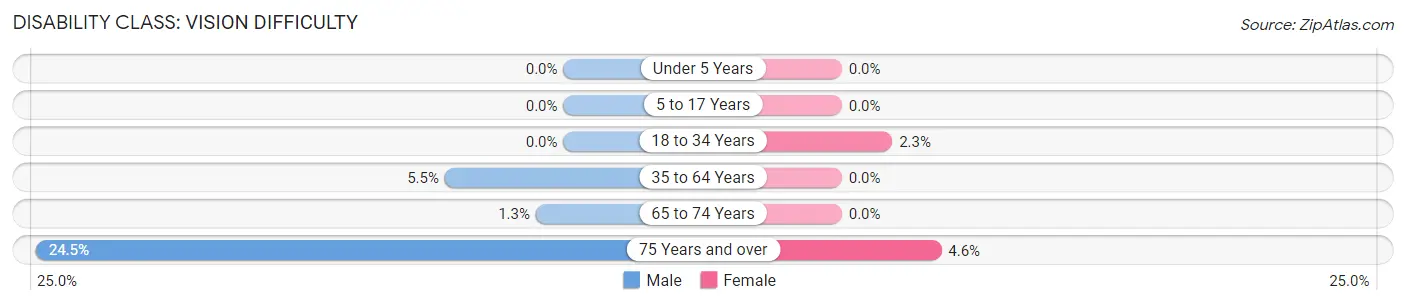
| Age Bracket | Male | Female |
| Under 5 Years | 0 (0.0%) | 0 (0.0%) |
| 5 to 17 Years | 0 (0.0%) | 0 (0.0%) |
| 18 to 34 Years | 0 (0.0%) | 5 (2.3%) |
| 35 to 64 Years | 16 (5.5%) | 0 (0.0%) |
| 65 to 74 Years | 2 (1.3%) | 0 (0.0%) |
| 75 Years and over | 35 (24.5%) | 8 (4.6%) |
Disability Class: Cognitive Difficulty
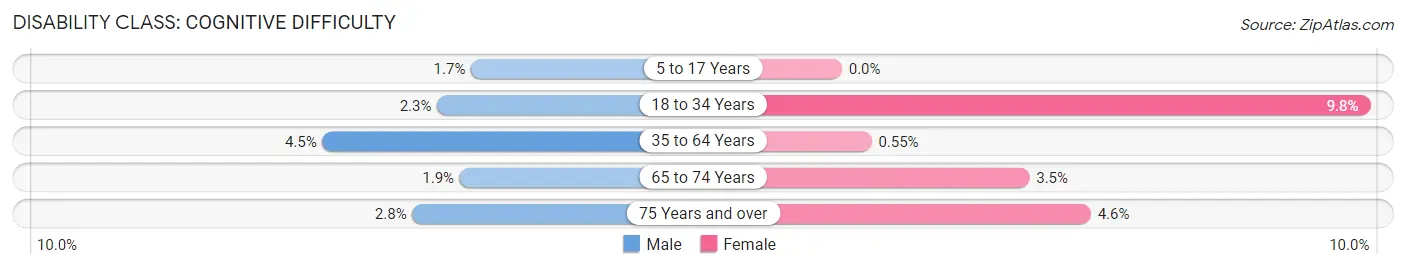
| Age Bracket | Male | Female |
| 5 to 17 Years | 5 (1.7%) | 0 (0.0%) |
| 18 to 34 Years | 4 (2.3%) | 21 (9.8%) |
| 35 to 64 Years | 13 (4.5%) | 2 (0.5%) |
| 65 to 74 Years | 3 (1.9%) | 7 (3.5%) |
| 75 Years and over | 4 (2.8%) | 8 (4.6%) |
Disability Class: Ambulatory Difficulty
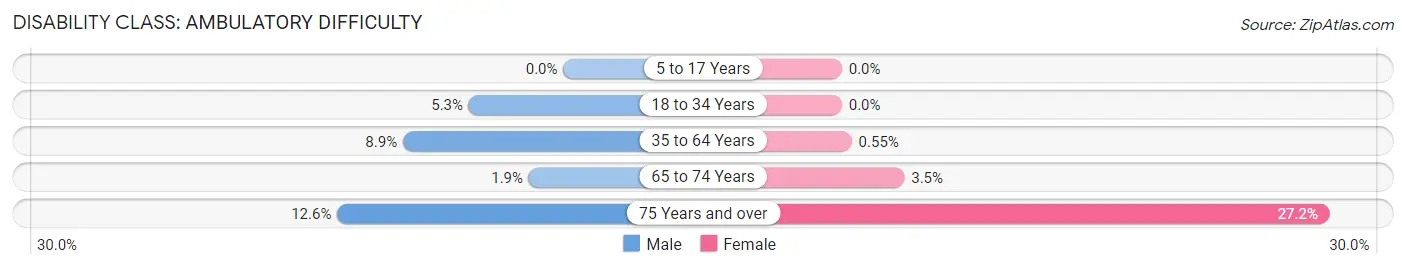
| Age Bracket | Male | Female |
| 5 to 17 Years | 0 (0.0%) | 0 (0.0%) |
| 18 to 34 Years | 9 (5.3%) | 0 (0.0%) |
| 35 to 64 Years | 26 (8.9%) | 2 (0.5%) |
| 65 to 74 Years | 3 (1.9%) | 7 (3.5%) |
| 75 Years and over | 18 (12.6%) | 47 (27.2%) |
Disability Class: Self-Care Difficulty
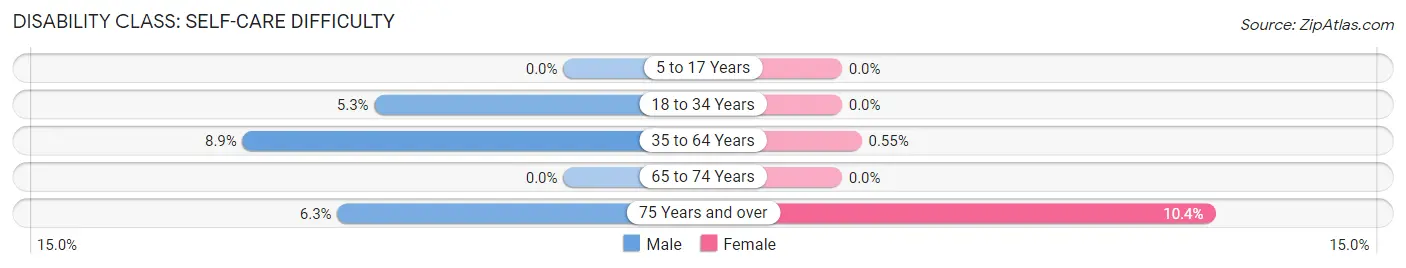
| Age Bracket | Male | Female |
| 5 to 17 Years | 0 (0.0%) | 0 (0.0%) |
| 18 to 34 Years | 9 (5.3%) | 0 (0.0%) |
| 35 to 64 Years | 26 (8.9%) | 2 (0.5%) |
| 65 to 74 Years | 0 (0.0%) | 0 (0.0%) |
| 75 Years and over | 9 (6.3%) | 18 (10.4%) |
Technology Access in Belmond
Computing Device Access in Belmond
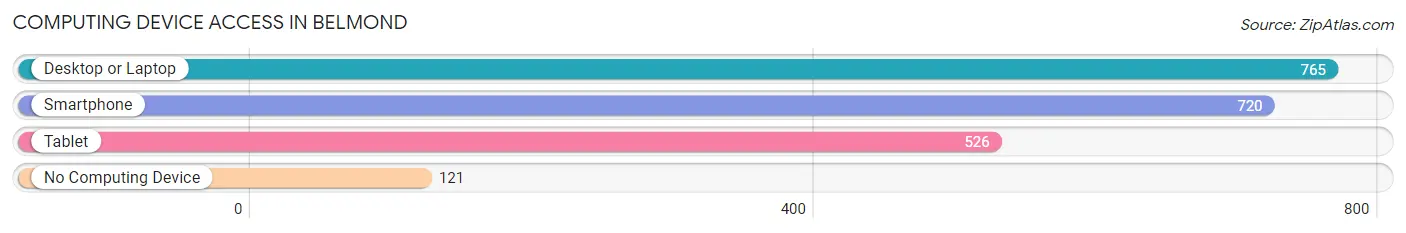
| Device Type | # Households | % Households |
| Desktop or Laptop | 765 | 77.7% |
| Smartphone | 720 | 73.2% |
| Tablet | 526 | 53.5% |
| No Computing Device | 121 | 12.3% |
| Total | 984 | 100.0% |
Internet Access in Belmond
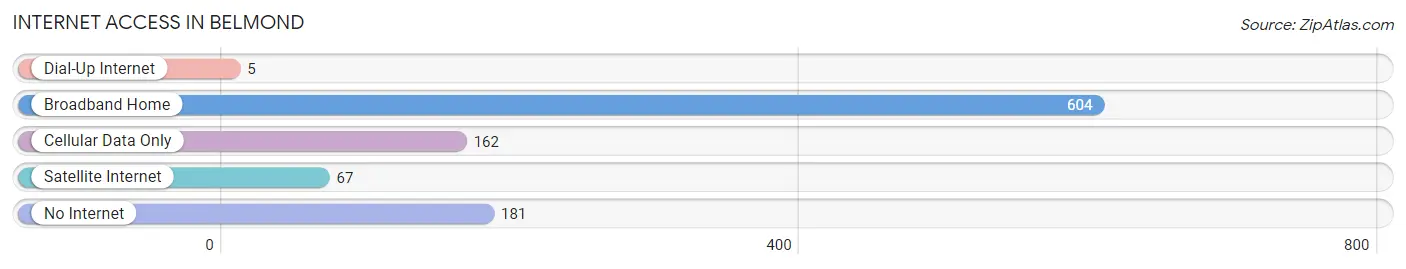
| Internet Type | # Households | % Households |
| Dial-Up Internet | 5 | 0.5% |
| Broadband Home | 604 | 61.4% |
| Cellular Data Only | 162 | 16.5% |
| Satellite Internet | 67 | 6.8% |
| No Internet | 181 | 18.4% |
| Total | 984 | 100.0% |
Belmond Summary
Belmond, Iowa is a small city located in Wright County, Iowa. It is situated in the north-central part of the state, about 40 miles north of Des Moines. The city has a population of 2,541 people, according to the 2010 census.
History
Belmond was founded in 1881 by the Chicago, Milwaukee & St. Paul Railroad. The city was named after Belmond, England, which was the hometown of one of the railroad's directors. The city was incorporated in 1882 and quickly became a thriving agricultural center.
In the early 1900s, Belmond was home to a number of businesses, including a flour mill, a creamery, a brickyard, a lumberyard, and a furniture factory. The city also had a number of churches, schools, and a library.
In the 1950s, Belmond began to experience a decline in population as people moved away from rural areas to larger cities. The city's population dropped from a peak of 3,000 in 1950 to 2,541 in 2010.
Geography
Belmond is located in north-central Iowa, about 40 miles north of Des Moines. The city is situated in Wright County, which is part of the Des Moines–West Des Moines Metropolitan Statistical Area.
The city is located on the Shell Rock River, which flows through the city and is a popular spot for fishing and boating. The city is also home to a number of parks, including the Belmond City Park, which features a playground, picnic areas, and a walking trail.
Economy
Belmond's economy is largely based on agriculture. The city is home to a number of farms, which produce corn, soybeans, and other crops. The city is also home to a number of businesses, including a grocery store, a hardware store, and a number of restaurants.
The city is also home to a number of manufacturing companies, including a plastics manufacturer, a metal fabrication company, and a printing company. The city is also home to a number of service-based businesses, including a bank, a law firm, and a number of medical offices.
Demographics
According to the 2010 census, Belmond has a population of 2,541 people. The city has a median age of 40.7 years, and the median household income is $45,945. The city is predominantly white, with 92.3% of the population identifying as white. The city also has a small Hispanic population, with 4.2% of the population identifying as Hispanic or Latino.
Belmond is a small city with a close-knit community. The city is home to a number of churches, schools, and businesses, and it is a popular spot for outdoor activities, such as fishing and boating. The city is also home to a number of manufacturing and service-based businesses, which provide employment opportunities for the city's residents.
Common Questions
What is Per Capita Income in Belmond?
Per Capita income in Belmond is $28,988.
What is the Median Family Income in Belmond?
Median Family Income in Belmond is $59,792.
What is the Median Household income in Belmond?
Median Household Income in Belmond is $55,233.
What is Income or Wage Gap in Belmond?
Income or Wage Gap in Belmond is 30.0%.
Women in Belmond earn 70.0 cents for every dollar earned by a man.
What is Inequality or Gini Index in Belmond?
Inequality or Gini Index in Belmond is 0.43.
What is the Total Population of Belmond?
Total Population of Belmond is 2,512.
What is the Total Male Population of Belmond?
Total Male Population of Belmond is 1,172.
What is the Total Female Population of Belmond?
Total Female Population of Belmond is 1,340.
What is the Ratio of Males per 100 Females in Belmond?
There are 87.46 Males per 100 Females in Belmond.
What is the Ratio of Females per 100 Males in Belmond?
There are 114.33 Females per 100 Males in Belmond.
What is the Median Population Age in Belmond?
Median Population Age in Belmond is 38.8 Years.
What is the Average Family Size in Belmond
Average Family Size in Belmond is 3.0 People.
What is the Average Household Size in Belmond
Average Household Size in Belmond is 2.5 People.
How Large is the Labor Force in Belmond?
There are 898 People in the Labor Forcein in Belmond.
What is the Percentage of People in the Labor Force in Belmond?
48.8% of People are in the Labor Force in Belmond.
What is the Unemployment Rate in Belmond?
Unemployment Rate in Belmond is 3.7%.