Ackley, IA Map & Demographics
Ackley Map
Ackley Overview
$33,793
PER CAPITA INCOME
$85,625
AVG FAMILY INCOME
$60,577
AVG HOUSEHOLD INCOME
31.3%
WAGE / INCOME GAP [ % ]
68.7¢/ $1
WAGE / INCOME GAP [ $ ]
0.47
INEQUALITY / GINI INDEX
1,699
TOTAL POPULATION
771
MALE POPULATION
928
FEMALE POPULATION
83.08
MALES / 100 FEMALES
120.36
FEMALES / 100 MALES
42.6
MEDIAN AGE
3.1
AVG FAMILY SIZE
2.4
AVG HOUSEHOLD SIZE
804
LABOR FORCE [ PEOPLE ]
57.5%
PERCENT IN LABOR FORCE
2.9%
UNEMPLOYMENT RATE
Ackley Zip Codes
Ackley Area Codes
Income in Ackley
Income Overview in Ackley
Per Capita Income in Ackley is $33,793, while median incomes of families and households are $85,625 and $60,577 respectively.
| Characteristic | Number | Measure |
| Per Capita Income | 1,699 | $33,793 |
| Median Family Income | 413 | $85,625 |
| Mean Family Income | 413 | $108,182 |
| Median Household Income | 696 | $60,577 |
| Mean Household Income | 696 | $80,611 |
| Income Deficit | 413 | $0 |
| Wage / Income Gap (%) | 1,699 | 31.31% |
| Wage / Income Gap ($) | 1,699 | 68.69¢ per $1 |
| Gini / Inequality Index | 1,699 | 0.47 |
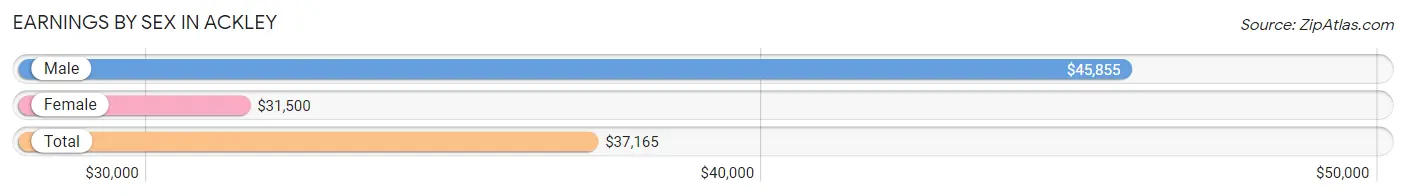
Earnings by Sex in Ackley
Average Earnings in Ackley are $37,165, $45,855 for men and $31,500 for women, a difference of 31.3%.
| Sex | Number | Average Earnings |
| Male | 429 (49.1%) | $45,855 |
| Female | 444 (50.9%) | $31,500 |
| Total | 873 (100.0%) | $37,165 |
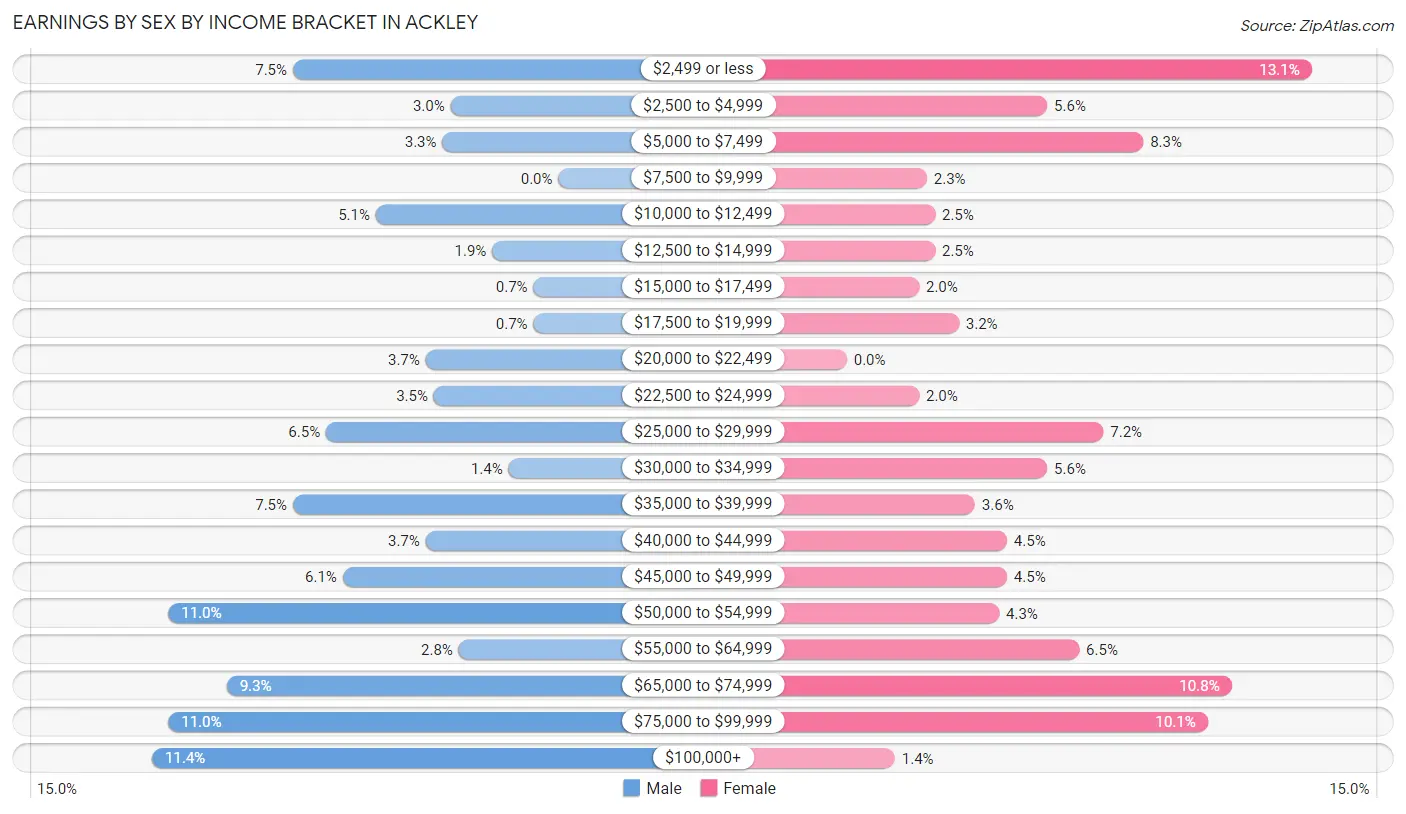
Earnings by Sex by Income Bracket in Ackley
The most common earnings brackets in Ackley are $100,000+ for men (49 | 11.4%) and $2,499 or less for women (58 | 13.1%).
| Income | Male | Female |
| $2,499 or less | 32 (7.5%) | 58 (13.1%) |
| $2,500 to $4,999 | 13 (3.0%) | 25 (5.6%) |
| $5,000 to $7,499 | 14 (3.3%) | 37 (8.3%) |
| $7,500 to $9,999 | 0 (0.0%) | 10 (2.2%) |
| $10,000 to $12,499 | 22 (5.1%) | 11 (2.5%) |
| $12,500 to $14,999 | 8 (1.9%) | 11 (2.5%) |
| $15,000 to $17,499 | 3 (0.7%) | 9 (2.0%) |
| $17,500 to $19,999 | 3 (0.7%) | 14 (3.2%) |
| $20,000 to $22,499 | 16 (3.7%) | 0 (0.0%) |
| $22,500 to $24,999 | 15 (3.5%) | 9 (2.0%) |
| $25,000 to $29,999 | 28 (6.5%) | 32 (7.2%) |
| $30,000 to $34,999 | 6 (1.4%) | 25 (5.6%) |
| $35,000 to $39,999 | 32 (7.5%) | 16 (3.6%) |
| $40,000 to $44,999 | 16 (3.7%) | 20 (4.5%) |
| $45,000 to $49,999 | 26 (6.1%) | 20 (4.5%) |
| $50,000 to $54,999 | 47 (11.0%) | 19 (4.3%) |
| $55,000 to $64,999 | 12 (2.8%) | 29 (6.5%) |
| $65,000 to $74,999 | 40 (9.3%) | 48 (10.8%) |
| $75,000 to $99,999 | 47 (11.0%) | 45 (10.1%) |
| $100,000+ | 49 (11.4%) | 6 (1.3%) |
| Total | 429 (100.0%) | 444 (100.0%) |
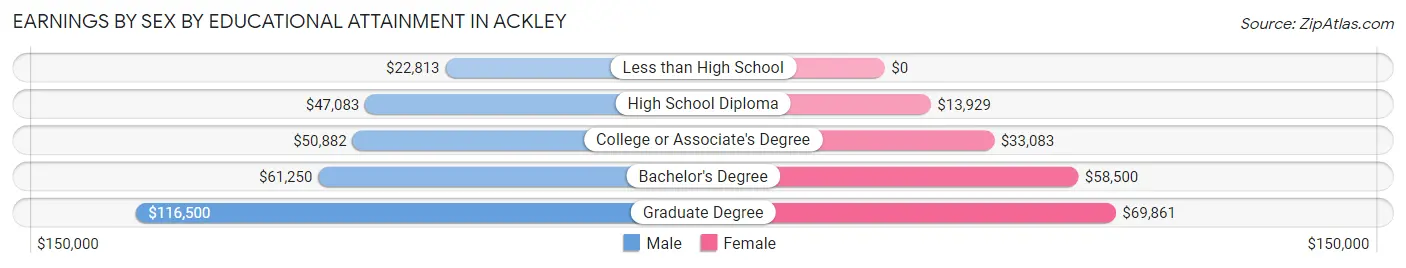
Earnings by Sex by Educational Attainment in Ackley
Average earnings in Ackley are $51,750 for men and $39,286 for women, a difference of 24.1%. Men with an educational attainment of graduate degree enjoy the highest average annual earnings of $116,500, while those with less than high school education earn the least with $22,813. Women with an educational attainment of graduate degree earn the most with the average annual earnings of $69,861, while those with high school diploma education have the smallest earnings of $13,929.
| Educational Attainment | Male Income | Female Income |
| Less than High School | $22,813 | $0 |
| High School Diploma | $47,083 | $13,929 |
| College or Associate's Degree | $50,882 | $33,083 |
| Bachelor's Degree | $61,250 | $58,500 |
| Graduate Degree | $116,500 | $69,861 |
| Total | $51,750 | $39,286 |
Family Income in Ackley
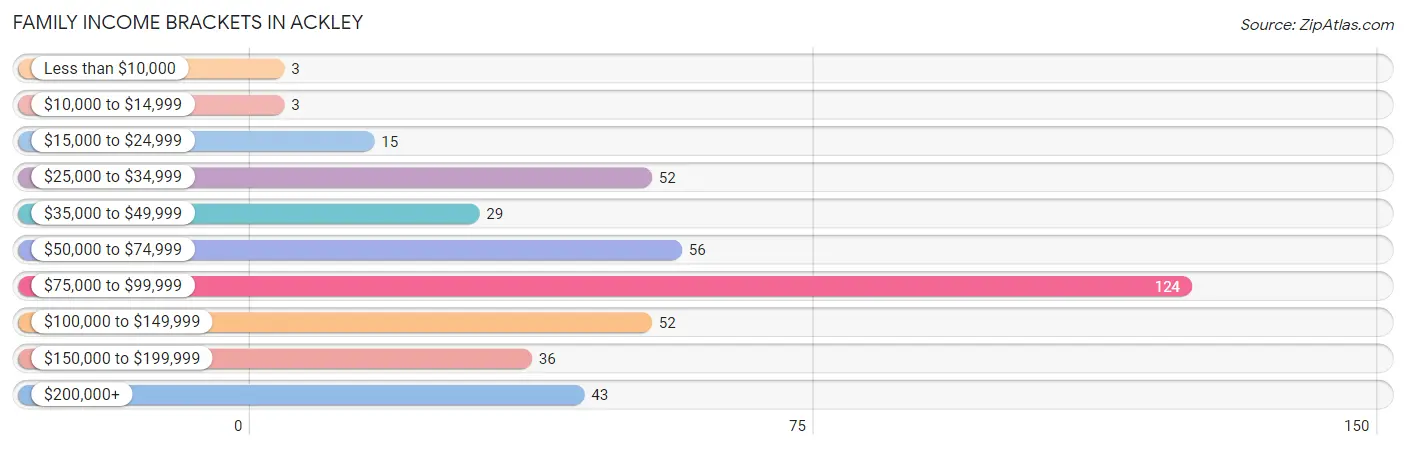
Family Income Brackets in Ackley
According to the Ackley family income data, there are 124 families falling into the $75,000 to $99,999 income range, which is the most common income bracket and makes up 30.0% of all families. Conversely, the less than $10,000 income bracket is the least frequent group with only 3 families (0.7%) belonging to this category.
| Income Bracket | # Families | % Families |
| Less than $10,000 | 3 | 0.7% |
| $10,000 to $14,999 | 3 | 0.7% |
| $15,000 to $24,999 | 15 | 3.6% |
| $25,000 to $34,999 | 52 | 12.6% |
| $35,000 to $49,999 | 29 | 7.0% |
| $50,000 to $74,999 | 56 | 13.6% |
| $75,000 to $99,999 | 124 | 30.0% |
| $100,000 to $149,999 | 52 | 12.6% |
| $150,000 to $199,999 | 36 | 8.7% |
| $200,000+ | 43 | 10.4% |
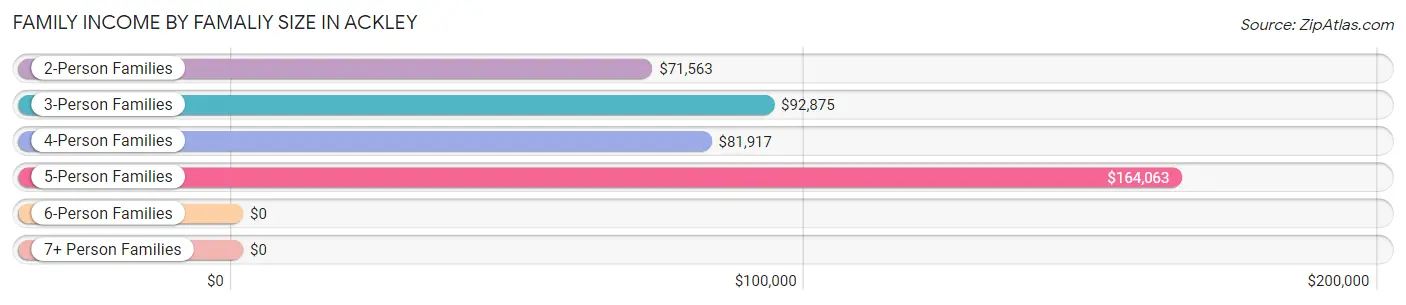
Family Income by Famaliy Size in Ackley
5-person families (43 | 10.4%) account for the highest median family income in Ackley with $164,063 per family, while 2-person families (207 | 50.1%) have the highest median income of $35,782 per family member.
| Income Bracket | # Families | Median Income |
| 2-Person Families | 207 (50.1%) | $71,563 |
| 3-Person Families | 59 (14.3%) | $92,875 |
| 4-Person Families | 85 (20.6%) | $81,917 |
| 5-Person Families | 43 (10.4%) | $164,063 |
| 6-Person Families | 10 (2.4%) | $0 |
| 7+ Person Families | 9 (2.2%) | $0 |
| Total | 413 (100.0%) | $85,625 |
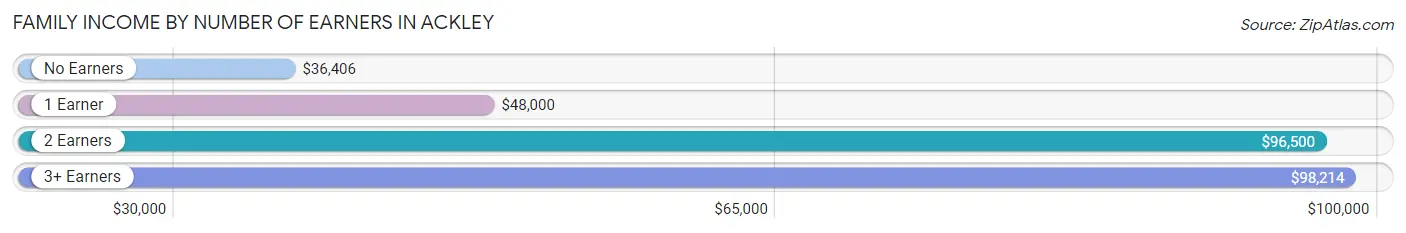
Family Income by Number of Earners in Ackley
The median family income in Ackley is $85,625, with families comprising 3+ earners (72) having the highest median family income of $98,214, while families with no earners (71) have the lowest median family income of $36,406, accounting for 17.4% and 17.2% of families, respectively.
| Number of Earners | # Families | Median Income |
| No Earners | 71 (17.2%) | $36,406 |
| 1 Earner | 82 (19.9%) | $48,000 |
| 2 Earners | 188 (45.5%) | $96,500 |
| 3+ Earners | 72 (17.4%) | $98,214 |
| Total | 413 (100.0%) | $85,625 |
Household Income in Ackley
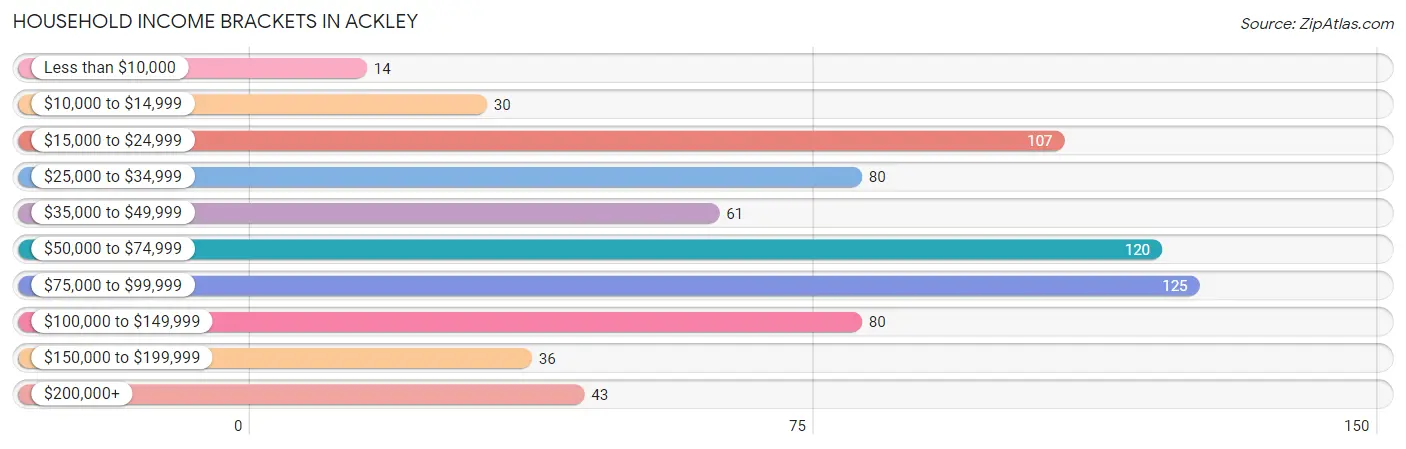
Household Income Brackets in Ackley
With 125 households falling in the category, the $75,000 to $99,999 income range is the most frequent in Ackley, accounting for 18.0% of all households. In contrast, only 14 households (2.0%) fall into the less than $10,000 income bracket, making it the least populous group.
| Income Bracket | # Households | % Households |
| Less than $10,000 | 14 | 2.0% |
| $10,000 to $14,999 | 30 | 4.3% |
| $15,000 to $24,999 | 107 | 15.4% |
| $25,000 to $34,999 | 80 | 11.5% |
| $35,000 to $49,999 | 61 | 8.8% |
| $50,000 to $74,999 | 120 | 17.2% |
| $75,000 to $99,999 | 125 | 18.0% |
| $100,000 to $149,999 | 80 | 11.5% |
| $150,000 to $199,999 | 36 | 5.2% |
| $200,000+ | 43 | 6.2% |
Household Income by Householder Age in Ackley
The median household income in Ackley is $60,577, with the highest median household income of $78,375 found in the 45 to 64 years age bracket for the primary householder. A total of 249 households (35.8%) fall into this category. Meanwhile, the 15 to 24 years age bracket for the primary householder has the lowest median household income of $0, with 21 households (3.0%) in this group.
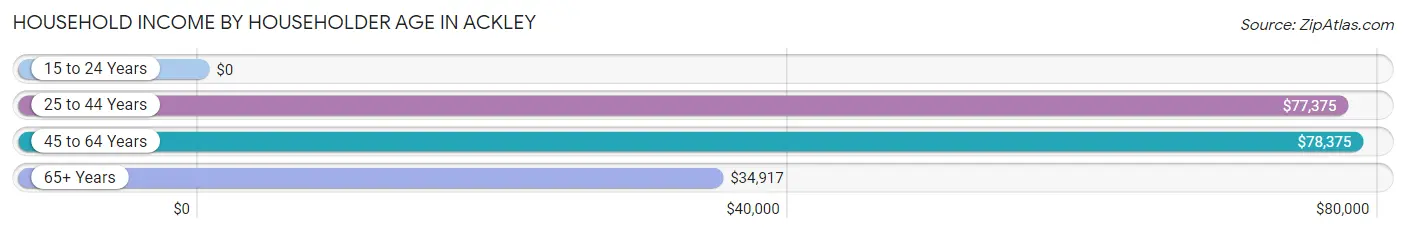
| Income Bracket | # Households | Median Income |
| 15 to 24 Years | 21 (3.0%) | $0 |
| 25 to 44 Years | 213 (30.6%) | $77,375 |
| 45 to 64 Years | 249 (35.8%) | $78,375 |
| 65+ Years | 213 (30.6%) | $34,917 |
| Total | 696 (100.0%) | $60,577 |
Poverty in Ackley
Income Below Poverty by Sex and Age in Ackley
With 11.7% poverty level for males and 12.2% for females among the residents of Ackley, 16 and 17 year old males and 18 to 24 year old females are the most vulnerable to poverty, with 18 males (40.9%) and 24 females (43.6%) in their respective age groups living below the poverty level.
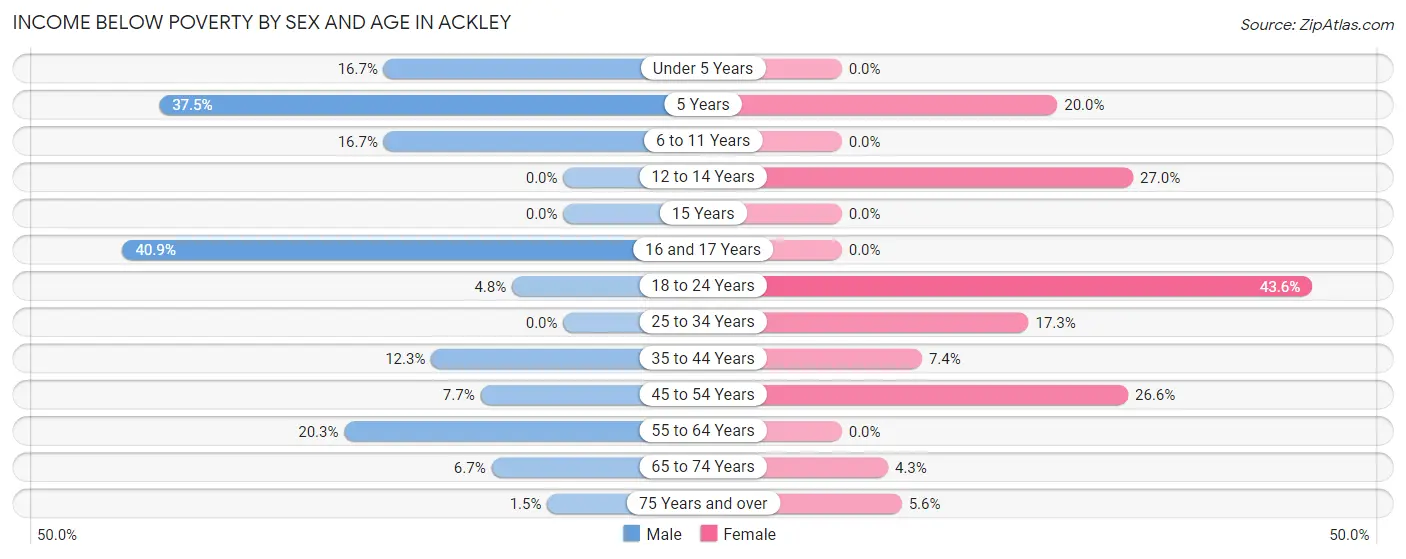
| Age Bracket | Male | Female |
| Under 5 Years | 6 (16.7%) | 0 (0.0%) |
| 5 Years | 6 (37.5%) | 3 (20.0%) |
| 6 to 11 Years | 6 (16.7%) | 0 (0.0%) |
| 12 to 14 Years | 0 (0.0%) | 10 (27.0%) |
| 15 Years | 0 (0.0%) | 0 (0.0%) |
| 16 and 17 Years | 18 (40.9%) | 0 (0.0%) |
| 18 to 24 Years | 3 (4.8%) | 24 (43.6%) |
| 25 to 34 Years | 0 (0.0%) | 13 (17.3%) |
| 35 to 44 Years | 13 (12.3%) | 9 (7.4%) |
| 45 to 54 Years | 7 (7.7%) | 38 (26.6%) |
| 55 to 64 Years | 25 (20.3%) | 0 (0.0%) |
| 65 to 74 Years | 3 (6.7%) | 3 (4.3%) |
| 75 Years and over | 1 (1.5%) | 7 (5.6%) |
| Total | 88 (11.7%) | 107 (12.2%) |
Income Above Poverty by Sex and Age in Ackley
According to the poverty statistics in Ackley, males aged 12 to 14 years and females aged under 5 years are the age groups that are most secure financially, with 100.0% of males and 100.0% of females in these age groups living above the poverty line.
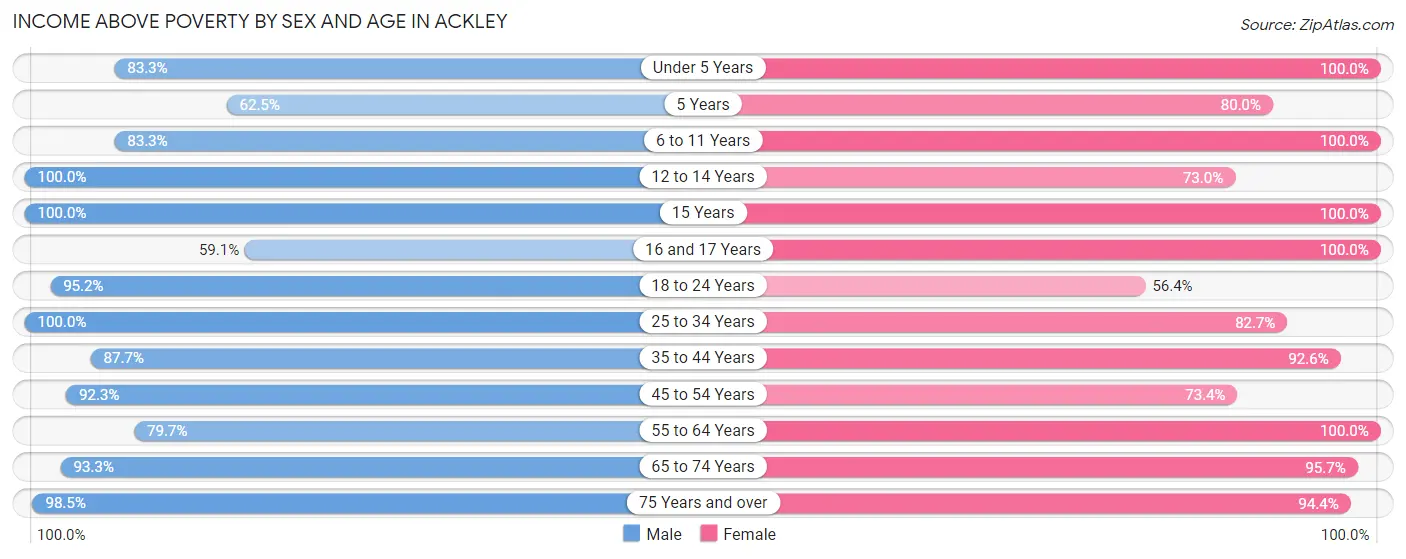
| Age Bracket | Male | Female |
| Under 5 Years | 30 (83.3%) | 41 (100.0%) |
| 5 Years | 10 (62.5%) | 12 (80.0%) |
| 6 to 11 Years | 30 (83.3%) | 45 (100.0%) |
| 12 to 14 Years | 37 (100.0%) | 27 (73.0%) |
| 15 Years | 7 (100.0%) | 14 (100.0%) |
| 16 and 17 Years | 26 (59.1%) | 32 (100.0%) |
| 18 to 24 Years | 60 (95.2%) | 31 (56.4%) |
| 25 to 34 Years | 79 (100.0%) | 62 (82.7%) |
| 35 to 44 Years | 93 (87.7%) | 112 (92.6%) |
| 45 to 54 Years | 84 (92.3%) | 105 (73.4%) |
| 55 to 64 Years | 98 (79.7%) | 104 (100.0%) |
| 65 to 74 Years | 42 (93.3%) | 67 (95.7%) |
| 75 Years and over | 66 (98.5%) | 119 (94.4%) |
| Total | 662 (88.3%) | 771 (87.8%) |
Income Below Poverty Among Married-Couple Families in Ackley
The poverty statistics for married-couple families in Ackley show that 5.1% or 17 of the total 332 families live below the poverty line. Families with 5 or more children have the highest poverty rate of 100.0%, comprising of 3 families. On the other hand, families with no children have the lowest poverty rate of 2.1%, which includes 4 families.
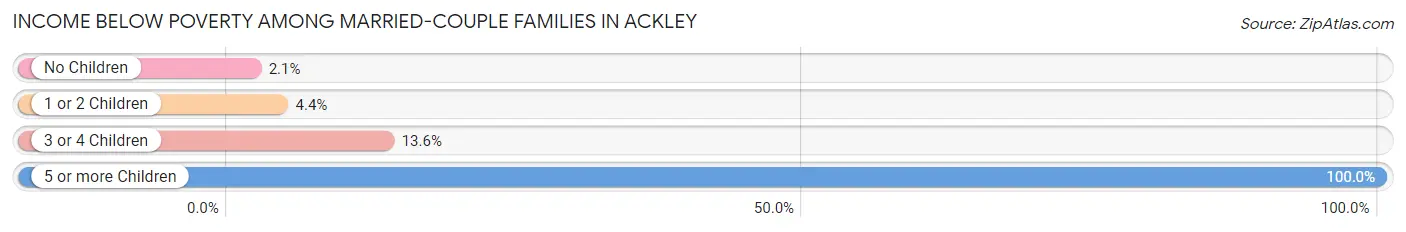
| Children | Above Poverty | Below Poverty |
| No Children | 190 (97.9%) | 4 (2.1%) |
| 1 or 2 Children | 87 (95.6%) | 4 (4.4%) |
| 3 or 4 Children | 38 (86.4%) | 6 (13.6%) |
| 5 or more Children | 0 (0.0%) | 3 (100.0%) |
| Total | 315 (94.9%) | 17 (5.1%) |
Income Below Poverty Among Single-Parent Households in Ackley
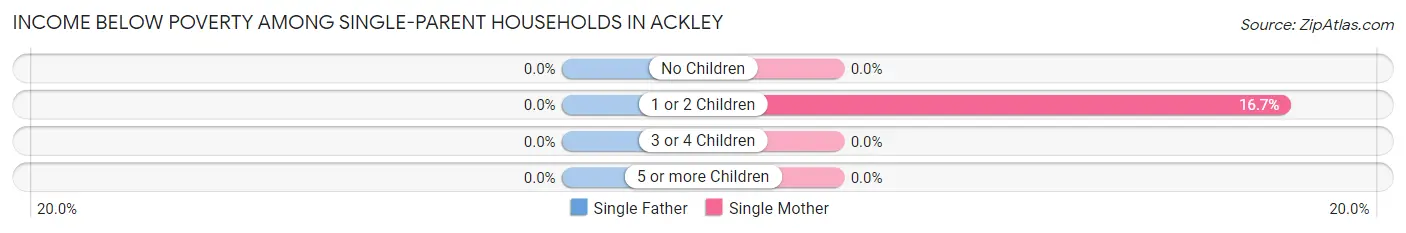
| Children | Single Father | Single Mother |
| No Children | 0 (0.0%) | 0 (0.0%) |
| 1 or 2 Children | 0 (0.0%) | 4 (16.7%) |
| 3 or 4 Children | 0 (0.0%) | 0 (0.0%) |
| 5 or more Children | 0 (0.0%) | 0 (0.0%) |
| Total | 0 (0.0%) | 4 (7.7%) |
Income Below Poverty Among Married-Couple vs Single-Parent Households in Ackley
The poverty data for Ackley shows that 17 of the married-couple family households (5.1%) and 4 of the single-parent households (4.9%) are living below the poverty level. Within the married-couple family households, those with 5 or more children have the highest poverty rate, with 3 households (100.0%) falling below the poverty line. Among the single-parent households, those with 1 or 2 children have the highest poverty rate, with 4 household (13.8%) living below poverty.
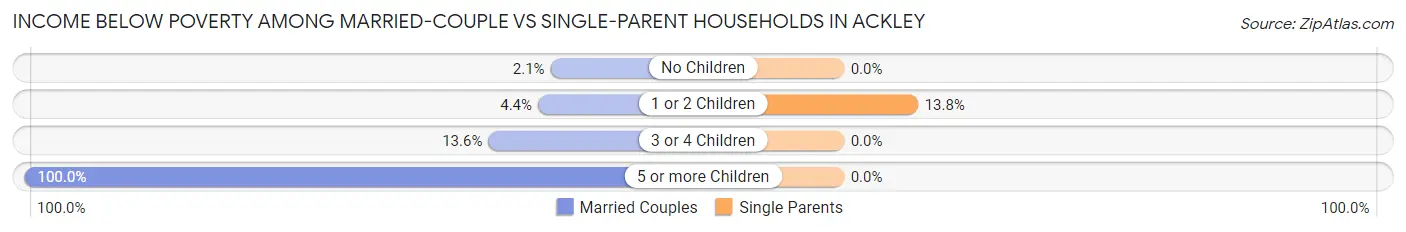
| Children | Married-Couple Families | Single-Parent Households |
| No Children | 4 (2.1%) | 0 (0.0%) |
| 1 or 2 Children | 4 (4.4%) | 4 (13.8%) |
| 3 or 4 Children | 6 (13.6%) | 0 (0.0%) |
| 5 or more Children | 3 (100.0%) | 0 (0.0%) |
| Total | 17 (5.1%) | 4 (4.9%) |
Race in Ackley
The most populous races in Ackley are White / Caucasian (1,541 | 90.7%), Hispanic or Latino (178 | 10.5%), and Some other Race (65 | 3.8%).
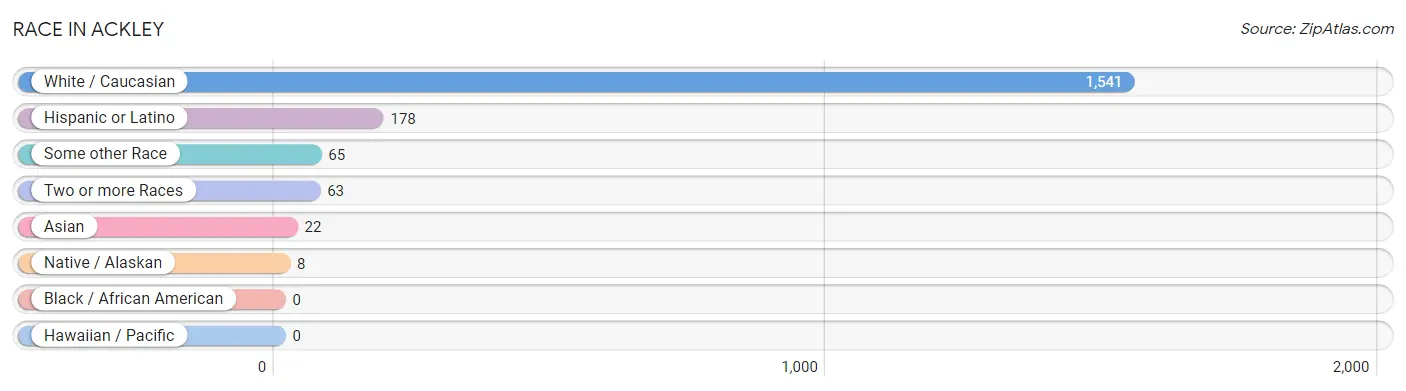
| Race | # Population | % Population |
| Asian | 22 | 1.3% |
| Black / African American | 0 | 0.0% |
| Hawaiian / Pacific | 0 | 0.0% |
| Hispanic or Latino | 178 | 10.5% |
| Native / Alaskan | 8 | 0.5% |
| White / Caucasian | 1,541 | 90.7% |
| Two or more Races | 63 | 3.7% |
| Some other Race | 65 | 3.8% |
| Total | 1,699 | 100.0% |
Ancestry in Ackley
The most populous ancestries reported in Ackley are German (642 | 37.8%), Mexican (178 | 10.5%), Irish (157 | 9.2%), English (92 | 5.4%), and Norwegian (83 | 4.9%), together accounting for 67.8% of all Ackley residents.
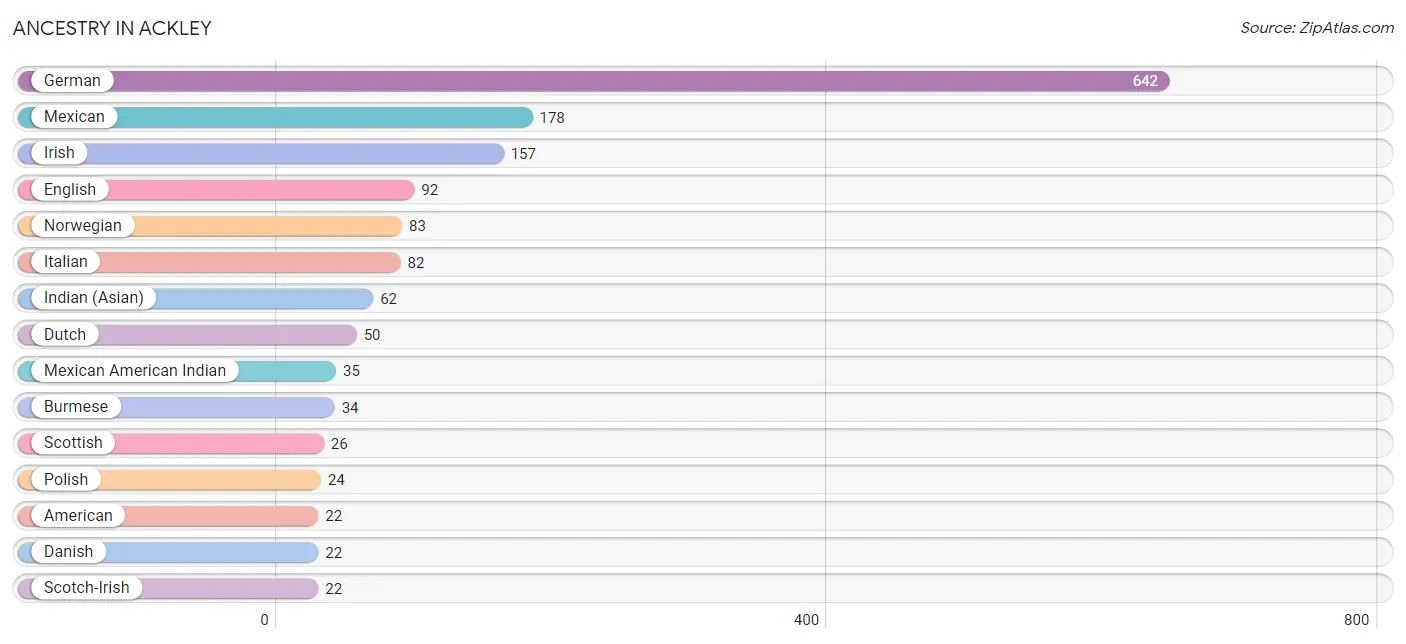
| Ancestry | # Population | % Population |
| American | 22 | 1.3% |
| Arab | 3 | 0.2% |
| Belgian | 11 | 0.6% |
| British | 3 | 0.2% |
| Burmese | 34 | 2.0% |
| Czech | 3 | 0.2% |
| Danish | 22 | 1.3% |
| Dutch | 50 | 2.9% |
| English | 92 | 5.4% |
| European | 5 | 0.3% |
| French | 4 | 0.2% |
| French Canadian | 17 | 1.0% |
| German | 642 | 37.8% |
| Indian (Asian) | 62 | 3.6% |
| Irish | 157 | 9.2% |
| Italian | 82 | 4.8% |
| Lebanese | 3 | 0.2% |
| Mexican | 178 | 10.5% |
| Mexican American Indian | 35 | 2.1% |
| Northern European | 3 | 0.2% |
| Norwegian | 83 | 4.9% |
| Polish | 24 | 1.4% |
| Scandinavian | 3 | 0.2% |
| Scotch-Irish | 22 | 1.3% |
| Scottish | 26 | 1.5% |
| Swedish | 16 | 0.9% |
| Welsh | 11 | 0.6% | View All 27 Rows |
Immigrants in Ackley
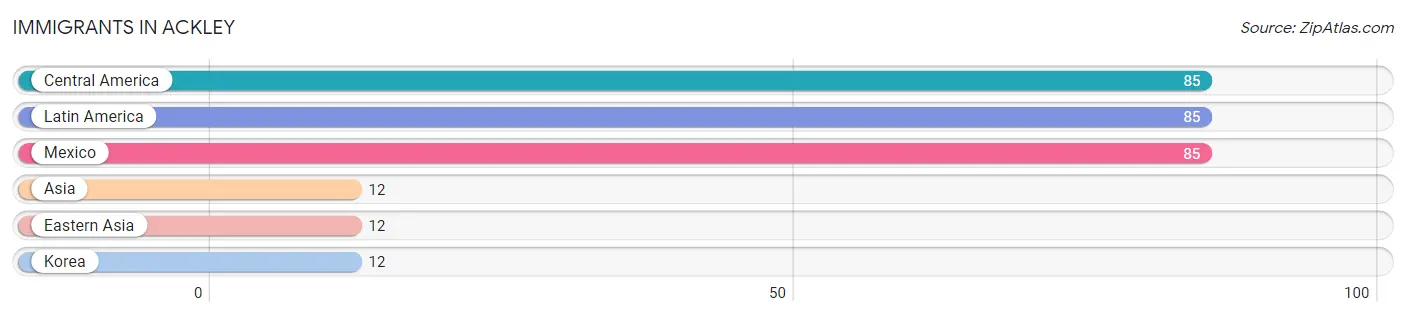
The most numerous immigrant groups reported in Ackley came from Central America (85 | 5.0%), Latin America (85 | 5.0%), Mexico (85 | 5.0%), Asia (12 | 0.7%), and Eastern Asia (12 | 0.7%), together accounting for 16.4% of all Ackley residents.
| Immigration Origin | # Population | % Population |
| Asia | 12 | 0.7% |
| Central America | 85 | 5.0% |
| Eastern Asia | 12 | 0.7% |
| Korea | 12 | 0.7% |
| Latin America | 85 | 5.0% |
| Mexico | 85 | 5.0% | View All 6 Rows |
Sex and Age in Ackley
Sex and Age in Ackley
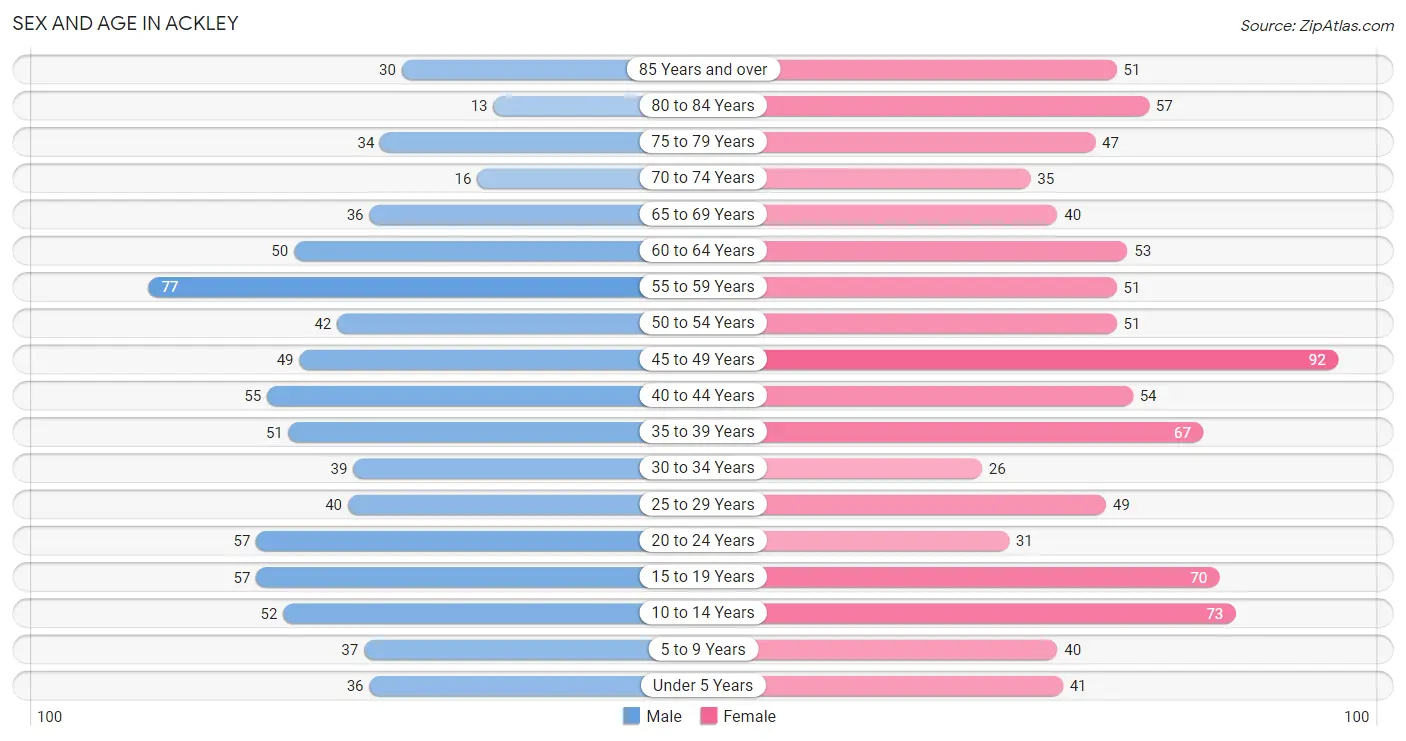
The most populous age groups in Ackley are 55 to 59 Years (77 | 10.0%) for men and 45 to 49 Years (92 | 9.9%) for women.
| Age Bracket | Male | Female |
| Under 5 Years | 36 (4.7%) | 41 (4.4%) |
| 5 to 9 Years | 37 (4.8%) | 40 (4.3%) |
| 10 to 14 Years | 52 (6.7%) | 73 (7.9%) |
| 15 to 19 Years | 57 (7.4%) | 70 (7.5%) |
| 20 to 24 Years | 57 (7.4%) | 31 (3.3%) |
| 25 to 29 Years | 40 (5.2%) | 49 (5.3%) |
| 30 to 34 Years | 39 (5.1%) | 26 (2.8%) |
| 35 to 39 Years | 51 (6.6%) | 67 (7.2%) |
| 40 to 44 Years | 55 (7.1%) | 54 (5.8%) |
| 45 to 49 Years | 49 (6.4%) | 92 (9.9%) |
| 50 to 54 Years | 42 (5.4%) | 51 (5.5%) |
| 55 to 59 Years | 77 (10.0%) | 51 (5.5%) |
| 60 to 64 Years | 50 (6.5%) | 53 (5.7%) |
| 65 to 69 Years | 36 (4.7%) | 40 (4.3%) |
| 70 to 74 Years | 16 (2.1%) | 35 (3.8%) |
| 75 to 79 Years | 34 (4.4%) | 47 (5.1%) |
| 80 to 84 Years | 13 (1.7%) | 57 (6.1%) |
| 85 Years and over | 30 (3.9%) | 51 (5.5%) |
| Total | 771 (100.0%) | 928 (100.0%) |
Families and Households in Ackley
Median Family Size in Ackley
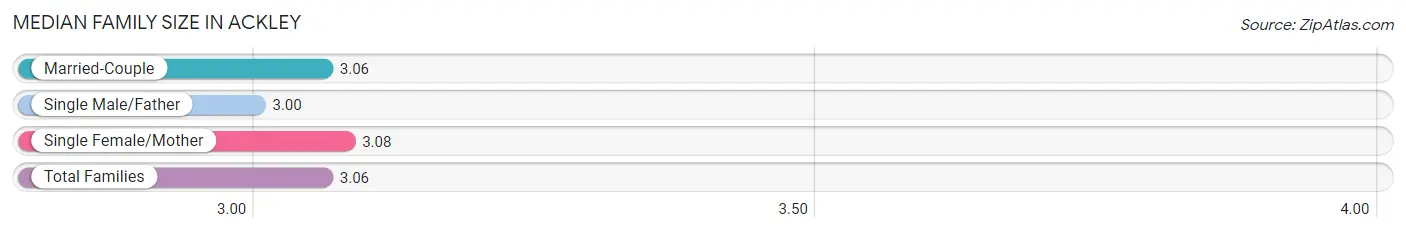
The median family size in Ackley is 3.06 persons per family, with single female/mother families (52 | 12.6%) accounting for the largest median family size of 3.08 persons per family. On the other hand, single male/father families (29 | 7.0%) represent the smallest median family size with 3.00 persons per family.
| Family Type | # Families | Family Size |
| Married-Couple | 332 (80.4%) | 3.06 |
| Single Male/Father | 29 (7.0%) | 3.00 |
| Single Female/Mother | 52 (12.6%) | 3.08 |
| Total Families | 413 (100.0%) | 3.06 |
Median Household Size in Ackley
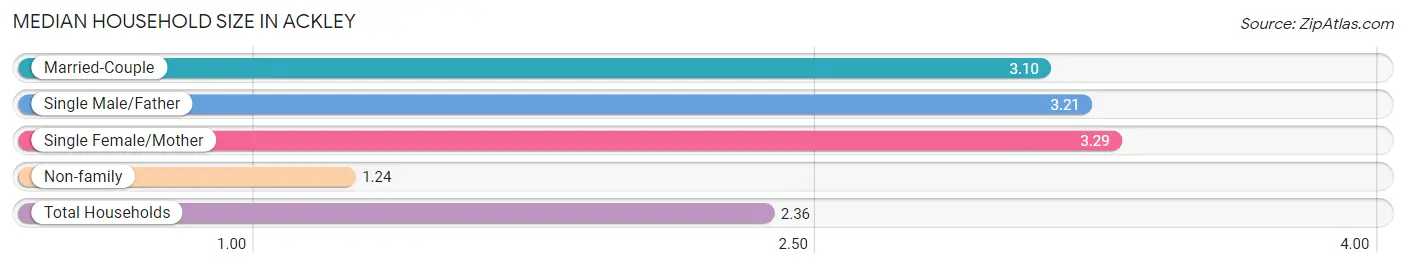
The median household size in Ackley is 2.36 persons per household, with single female/mother households (52 | 7.5%) accounting for the largest median household size of 3.29 persons per household. non-family households (283 | 40.7%) represent the smallest median household size with 1.24 persons per household.
| Household Type | # Households | Household Size |
| Married-Couple | 332 (47.7%) | 3.10 |
| Single Male/Father | 29 (4.2%) | 3.21 |
| Single Female/Mother | 52 (7.5%) | 3.29 |
| Non-family | 283 (40.7%) | 1.24 |
| Total Households | 696 (100.0%) | 2.36 |
Household Size by Marriage Status in Ackley
Out of a total of 696 households in Ackley, 413 (59.3%) are family households, while 283 (40.7%) are nonfamily households. The most numerous type of family households are 2-person households, comprising 203, and the most common type of nonfamily households are 1-person households, comprising 255.
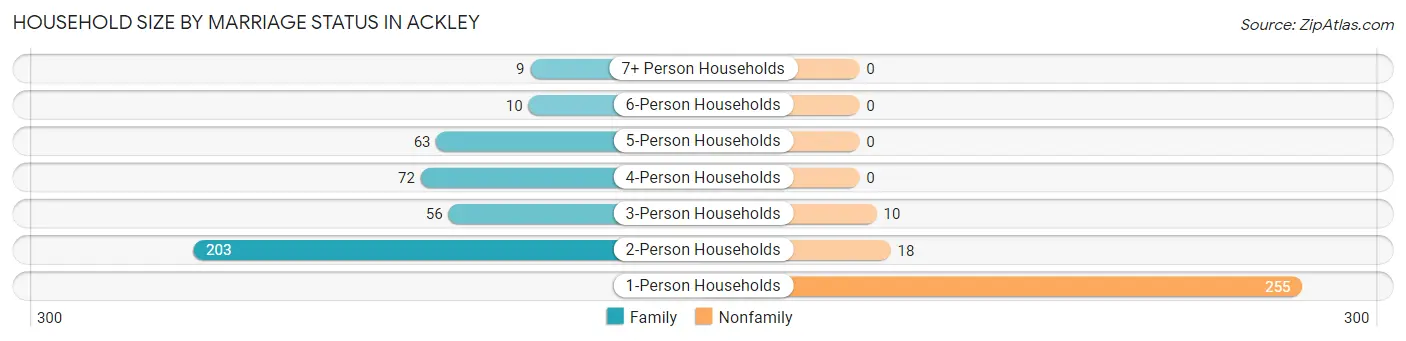
| Household Size | Family Households | Nonfamily Households |
| 1-Person Households | - | 255 (36.6%) |
| 2-Person Households | 203 (29.2%) | 18 (2.6%) |
| 3-Person Households | 56 (8.1%) | 10 (1.4%) |
| 4-Person Households | 72 (10.3%) | 0 (0.0%) |
| 5-Person Households | 63 (9.0%) | 0 (0.0%) |
| 6-Person Households | 10 (1.4%) | 0 (0.0%) |
| 7+ Person Households | 9 (1.3%) | 0 (0.0%) |
| Total | 413 (59.3%) | 283 (40.7%) |
Female Fertility in Ackley
Fertility by Age in Ackley
Average fertility rate in Ackley is 36.0 births per 1,000 women. Women in the age bracket of 20 to 34 years have the highest fertility rate with 142.0 births per 1,000 women. Women in the age bracket of 20 to 34 years acount for 100.0% of all women with births.
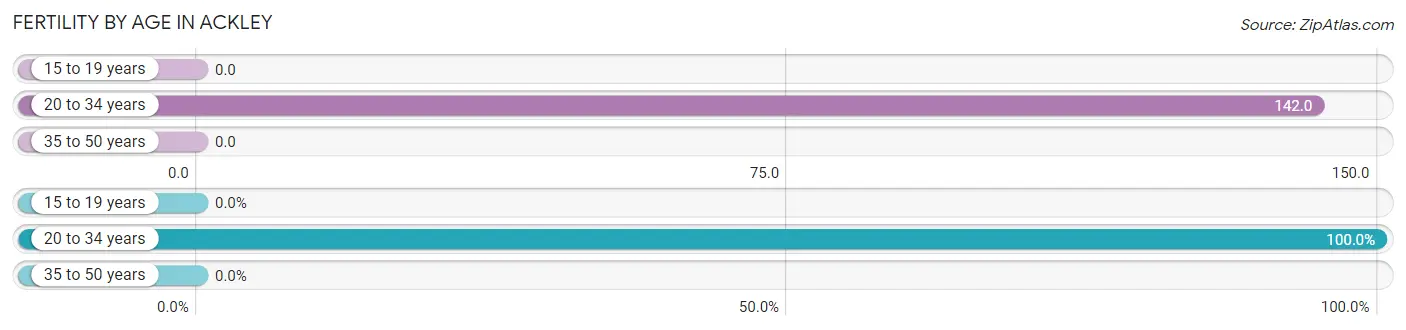
| Age Bracket | Women with Births | Births / 1,000 Women |
| 15 to 19 years | 0 (0.0%) | 0.0 |
| 20 to 34 years | 15 (100.0%) | 142.0 |
| 35 to 50 years | 0 (0.0%) | 0.0 |
| Total | 15 (100.0%) | 36.0 |
Fertility by Age by Marriage Status in Ackley
73.3% of women with births (15) in Ackley are married. The highest percentage of unmarried women with births falls into 20 to 34 years age bracket with 26.7% of them unmarried at the time of birth, while the lowest percentage of unmarried women with births belong to 20 to 34 years age bracket with 26.7% of them unmarried.
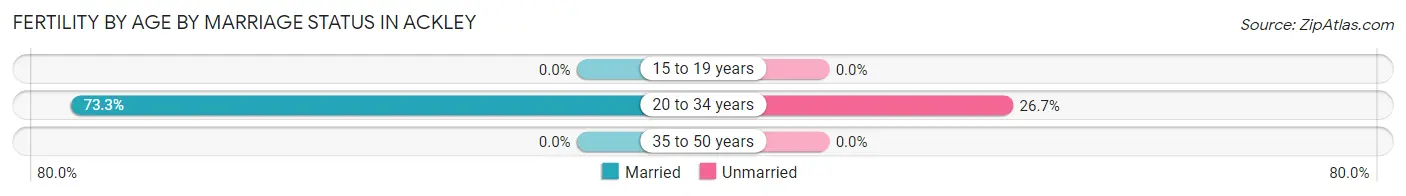
| Age Bracket | Married | Unmarried |
| 15 to 19 years | 0 (0.0%) | 0 (0.0%) |
| 20 to 34 years | 11 (73.3%) | 4 (26.7%) |
| 35 to 50 years | 0 (0.0%) | 0 (0.0%) |
| Total | 11 (73.3%) | 4 (26.7%) |
Fertility by Education in Ackley
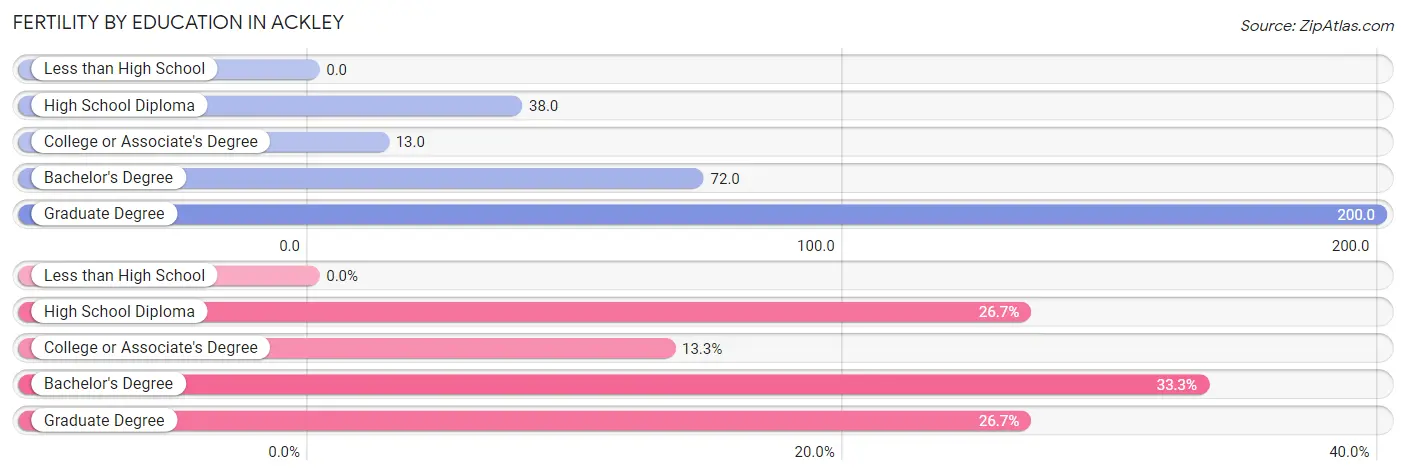
| Educational Attainment | Women with Births | Births / 1,000 Women |
| Less than High School | 0 (0.0%) | 0.0 |
| High School Diploma | 4 (26.7%) | 38.0 |
| College or Associate's Degree | 2 (13.3%) | 13.0 |
| Bachelor's Degree | 5 (33.3%) | 72.0 |
| Graduate Degree | 4 (26.7%) | 200.0 |
| Total | 15 (100.0%) | 36.0 |
Fertility by Education by Marriage Status in Ackley
26.7% of women with births in Ackley are unmarried. Women with the educational attainment of college or associate's degree are most likely to be married with 100.0% of them married at childbirth, while women with the educational attainment of high school diploma are least likely to be married with 100.0% of them unmarried at childbirth.
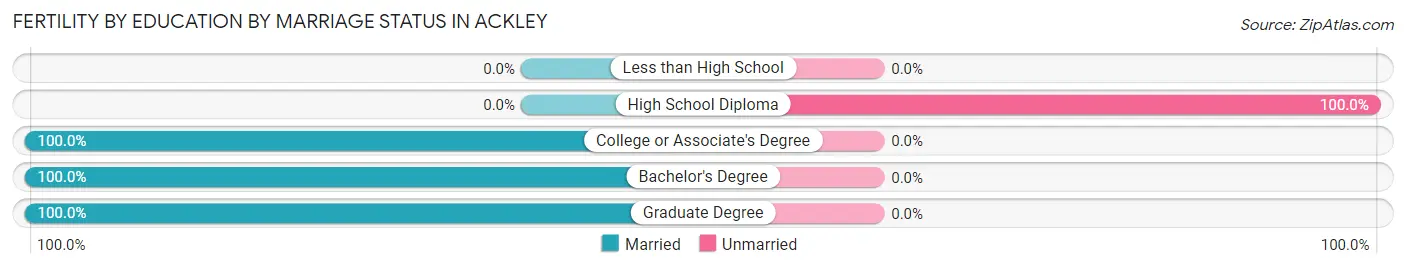
| Educational Attainment | Married | Unmarried |
| Less than High School | 0 (0.0%) | 0 (0.0%) |
| High School Diploma | 0 (0.0%) | 4 (100.0%) |
| College or Associate's Degree | 2 (100.0%) | 0 (0.0%) |
| Bachelor's Degree | 5 (100.0%) | 0 (0.0%) |
| Graduate Degree | 4 (100.0%) | 0 (0.0%) |
| Total | 11 (73.3%) | 4 (26.7%) |
Employment Characteristics in Ackley
Employment by Class of Employer in Ackley
Among the 777 employed individuals in Ackley, private company employees (554 | 71.3%), self-employed (not incorporated) (65 | 8.4%), and local government employees (60 | 7.7%) make up the most common classes of employment.
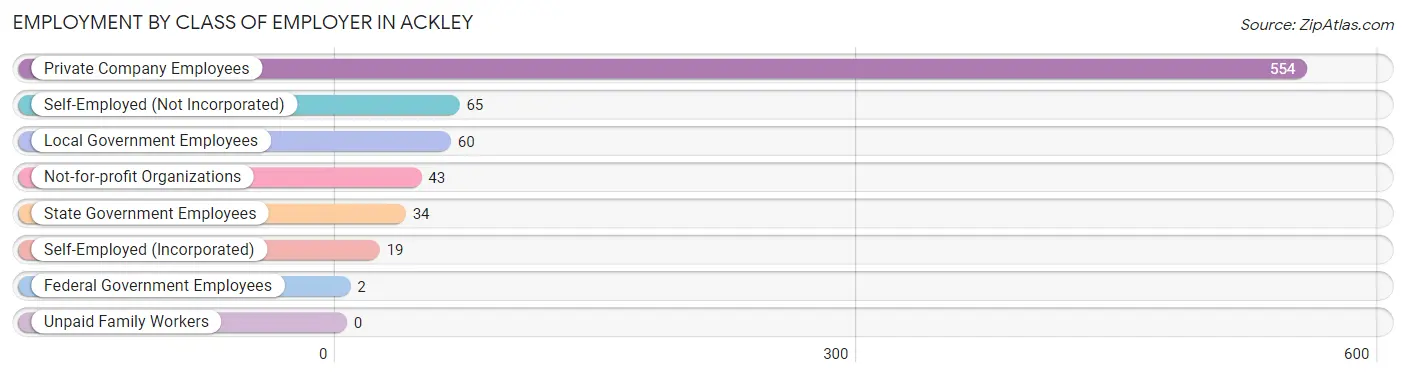
| Employer Class | # Employees | % Employees |
| Private Company Employees | 554 | 71.3% |
| Self-Employed (Incorporated) | 19 | 2.5% |
| Self-Employed (Not Incorporated) | 65 | 8.4% |
| Not-for-profit Organizations | 43 | 5.5% |
| Local Government Employees | 60 | 7.7% |
| State Government Employees | 34 | 4.4% |
| Federal Government Employees | 2 | 0.3% |
| Unpaid Family Workers | 0 | 0.0% |
| Total | 777 | 100.0% |
Employment Status by Age in Ackley
According to the labor force statistics for Ackley, out of the total population over 16 years of age (1,399), 57.5% or 804 individuals are in the labor force, with 2.9% or 23 of them unemployed. The age group with the highest labor force participation rate is 35 to 44 years, with 94.3% or 214 individuals in the labor force. Within the labor force, the 30 to 34 years age range has the highest percentage of unemployed individuals, with 8.9% or 5 of them being unemployed.
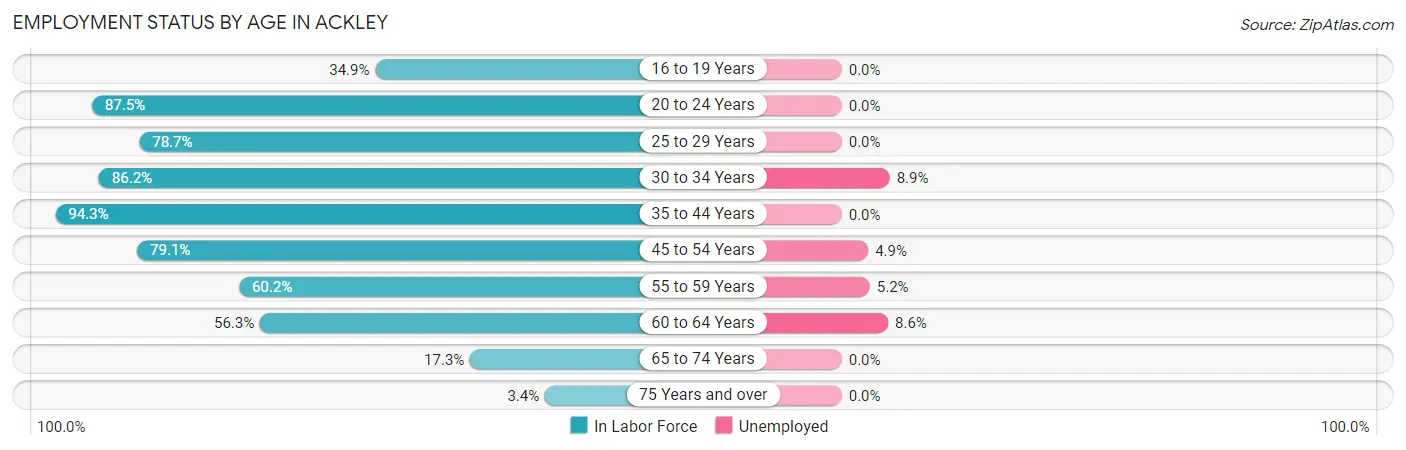
| Age Bracket | In Labor Force | Unemployed |
| 16 to 19 Years | 37 (34.9%) | 0 (0.0%) |
| 20 to 24 Years | 77 (87.5%) | 0 (0.0%) |
| 25 to 29 Years | 70 (78.7%) | 0 (0.0%) |
| 30 to 34 Years | 56 (86.2%) | 5 (8.9%) |
| 35 to 44 Years | 214 (94.3%) | 0 (0.0%) |
| 45 to 54 Years | 185 (79.1%) | 9 (4.9%) |
| 55 to 59 Years | 77 (60.2%) | 4 (5.2%) |
| 60 to 64 Years | 58 (56.3%) | 5 (8.6%) |
| 65 to 74 Years | 22 (17.3%) | 0 (0.0%) |
| 75 Years and over | 8 (3.4%) | 0 (0.0%) |
| Total | 804 (57.5%) | 23 (2.9%) |
Employment Status by Educational Attainment in Ackley
According to labor force statistics for Ackley, 78.0% of individuals (660) out of the total population between 25 and 64 years of age (846) are in the labor force, with 3.5% or 23 of them being unemployed. The group with the highest labor force participation rate are those with the educational attainment of bachelor's degree or higher, with 93.8% or 182 individuals in the labor force. Within the labor force, individuals with less than high school education have the highest percentage of unemployment, with 10.9% or 5 of them being unemployed.
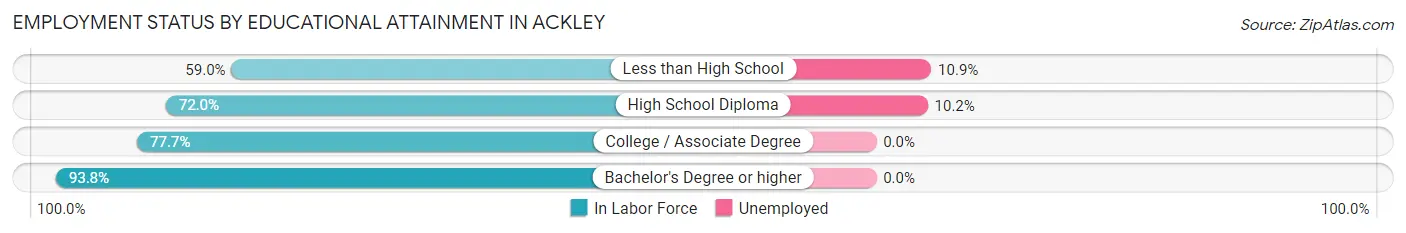
| Educational Attainment | In Labor Force | Unemployed |
| Less than High School | 46 (59.0%) | 9 (10.9%) |
| High School Diploma | 177 (72.0%) | 25 (10.2%) |
| College / Associate Degree | 255 (77.7%) | 0 (0.0%) |
| Bachelor's Degree or higher | 182 (93.8%) | 0 (0.0%) |
| Total | 660 (78.0%) | 30 (3.5%) |
Employment Occupations by Sex in Ackley
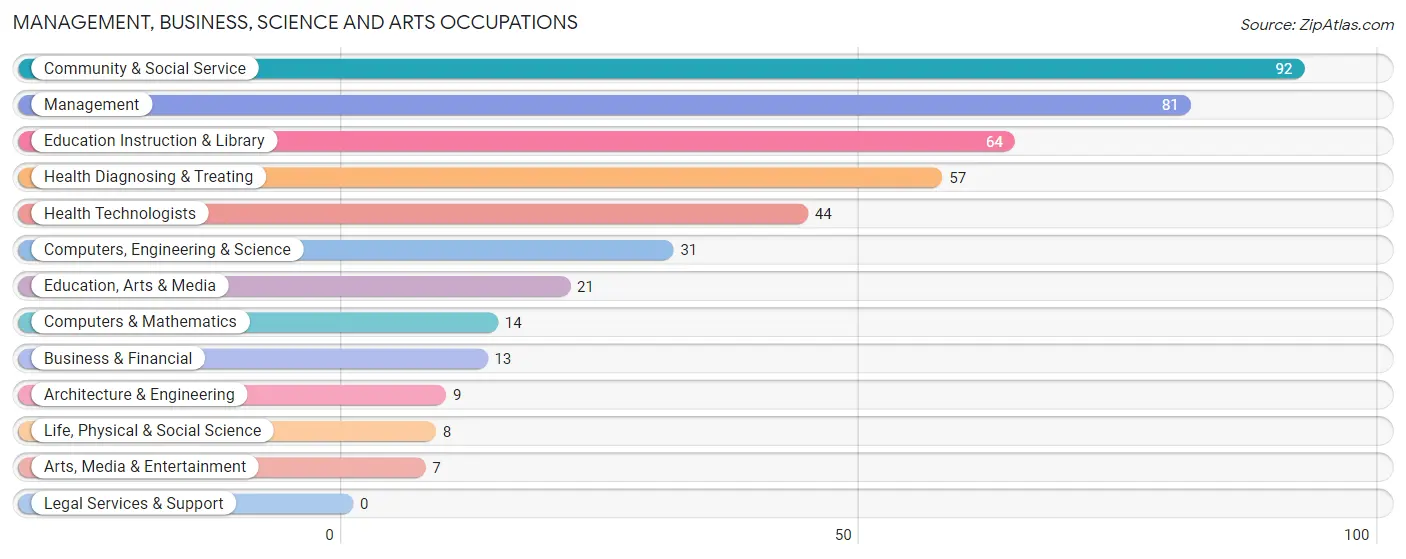
Management, Business, Science and Arts Occupations
The most common Management, Business, Science and Arts occupations in Ackley are Community & Social Service (92 | 11.8%), Management (81 | 10.4%), Education Instruction & Library (64 | 8.2%), Health Diagnosing & Treating (57 | 7.3%), and Health Technologists (44 | 5.6%).
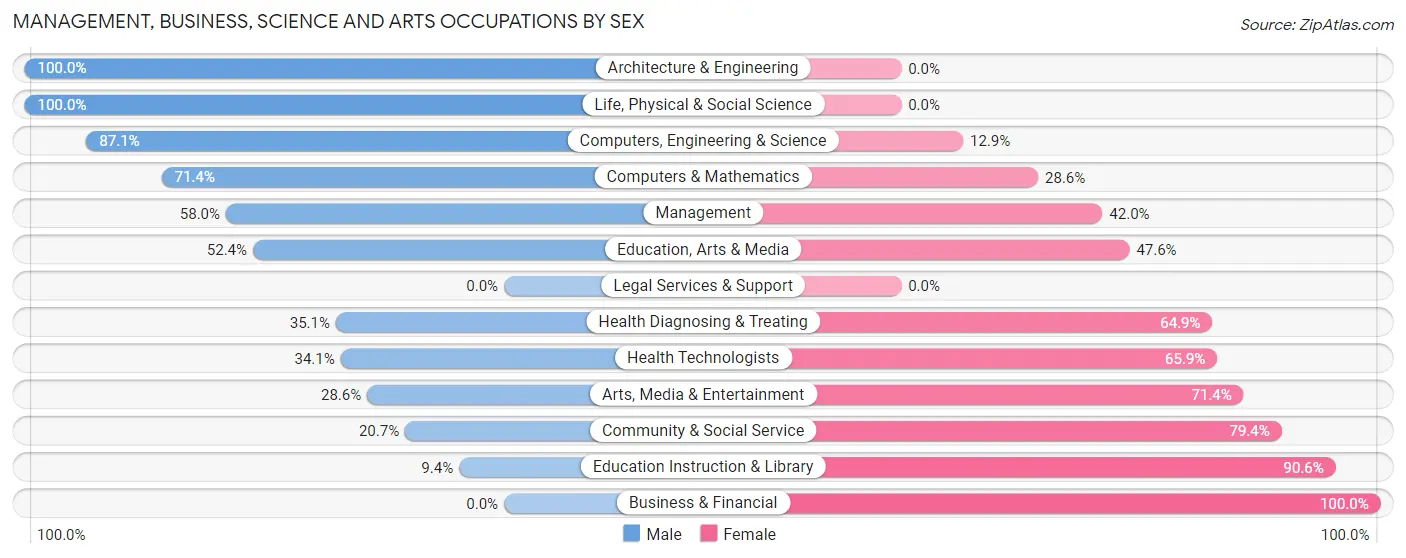
Management, Business, Science and Arts Occupations by Sex
Within the Management, Business, Science and Arts occupations in Ackley, the most male-oriented occupations are Architecture & Engineering (100.0%), Life, Physical & Social Science (100.0%), and Computers, Engineering & Science (87.1%), while the most female-oriented occupations are Business & Financial (100.0%), Education Instruction & Library (90.6%), and Community & Social Service (79.3%).
| Occupation | Male | Female |
| Management | 47 (58.0%) | 34 (42.0%) |
| Business & Financial | 0 (0.0%) | 13 (100.0%) |
| Computers, Engineering & Science | 27 (87.1%) | 4 (12.9%) |
| Computers & Mathematics | 10 (71.4%) | 4 (28.6%) |
| Architecture & Engineering | 9 (100.0%) | 0 (0.0%) |
| Life, Physical & Social Science | 8 (100.0%) | 0 (0.0%) |
| Community & Social Service | 19 (20.6%) | 73 (79.3%) |
| Education, Arts & Media | 11 (52.4%) | 10 (47.6%) |
| Legal Services & Support | 0 (0.0%) | 0 (0.0%) |
| Education Instruction & Library | 6 (9.4%) | 58 (90.6%) |
| Arts, Media & Entertainment | 2 (28.6%) | 5 (71.4%) |
| Health Diagnosing & Treating | 20 (35.1%) | 37 (64.9%) |
| Health Technologists | 15 (34.1%) | 29 (65.9%) |
| Total (Category) | 113 (41.2%) | 161 (58.8%) |
| Total (Overall) | 401 (51.3%) | 380 (48.7%) |
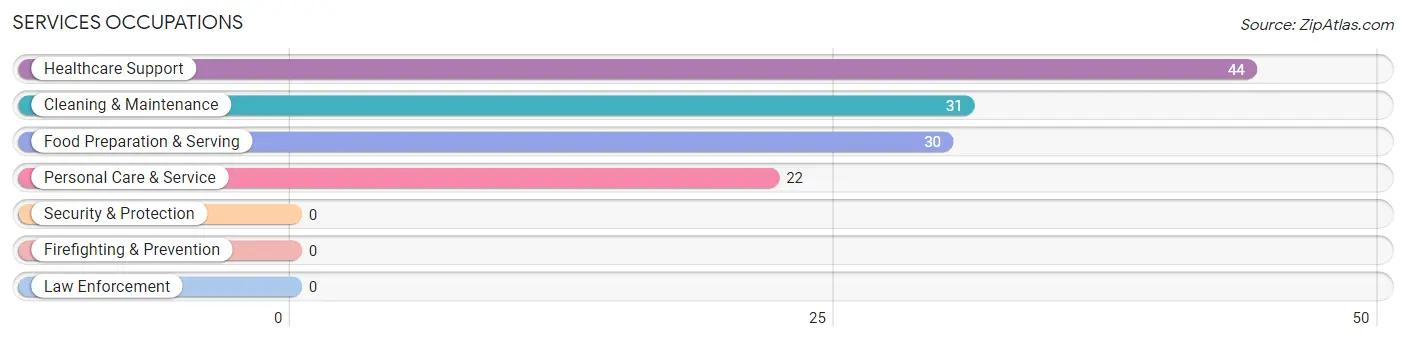
Services Occupations
The most common Services occupations in Ackley are Healthcare Support (44 | 5.6%), Cleaning & Maintenance (31 | 4.0%), Food Preparation & Serving (30 | 3.8%), and Personal Care & Service (22 | 2.8%).
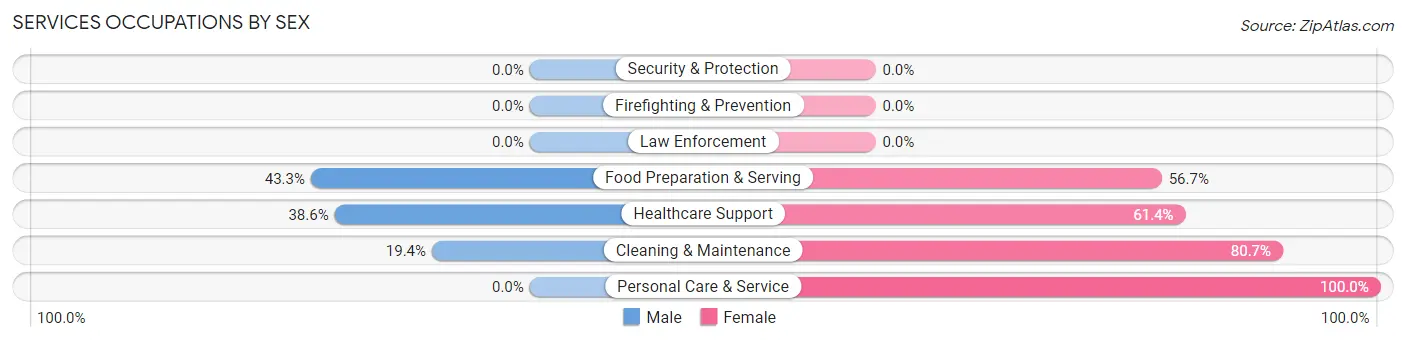
Services Occupations by Sex
Within the Services occupations in Ackley, the most male-oriented occupations are Food Preparation & Serving (43.3%), Healthcare Support (38.6%), and Cleaning & Maintenance (19.4%), while the most female-oriented occupations are Personal Care & Service (100.0%), Cleaning & Maintenance (80.6%), and Healthcare Support (61.4%).
| Occupation | Male | Female |
| Healthcare Support | 17 (38.6%) | 27 (61.4%) |
| Security & Protection | 0 (0.0%) | 0 (0.0%) |
| Firefighting & Prevention | 0 (0.0%) | 0 (0.0%) |
| Law Enforcement | 0 (0.0%) | 0 (0.0%) |
| Food Preparation & Serving | 13 (43.3%) | 17 (56.7%) |
| Cleaning & Maintenance | 6 (19.4%) | 25 (80.6%) |
| Personal Care & Service | 0 (0.0%) | 22 (100.0%) |
| Total (Category) | 36 (28.3%) | 91 (71.7%) |
| Total (Overall) | 401 (51.3%) | 380 (48.7%) |
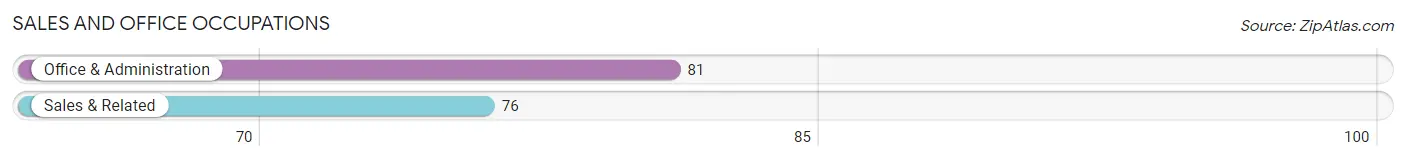
Sales and Office Occupations
The most common Sales and Office occupations in Ackley are Office & Administration (81 | 10.4%), and Sales & Related (76 | 9.7%).
Sales and Office Occupations by Sex
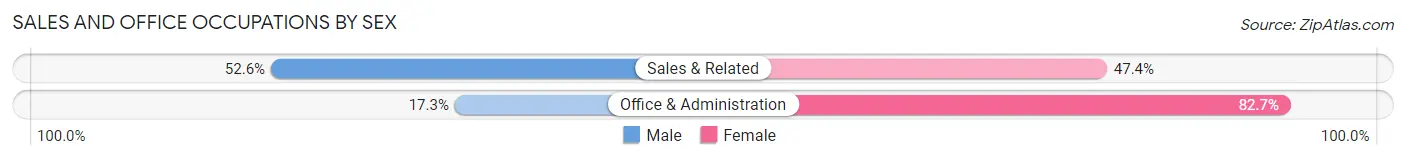
| Occupation | Male | Female |
| Sales & Related | 40 (52.6%) | 36 (47.4%) |
| Office & Administration | 14 (17.3%) | 67 (82.7%) |
| Total (Category) | 54 (34.4%) | 103 (65.6%) |
| Total (Overall) | 401 (51.3%) | 380 (48.7%) |
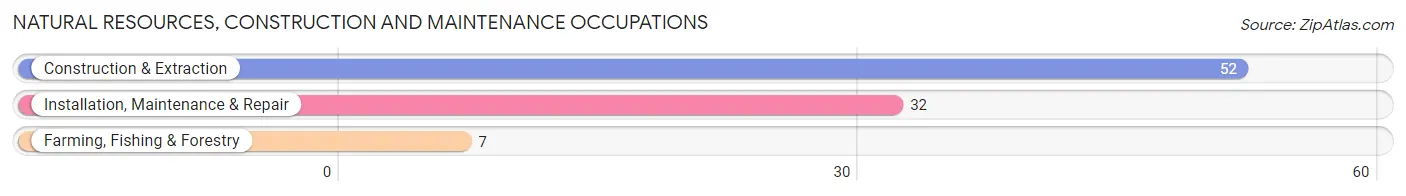
Natural Resources, Construction and Maintenance Occupations
The most common Natural Resources, Construction and Maintenance occupations in Ackley are Construction & Extraction (52 | 6.7%), Installation, Maintenance & Repair (32 | 4.1%), and Farming, Fishing & Forestry (7 | 0.9%).
Natural Resources, Construction and Maintenance Occupations by Sex
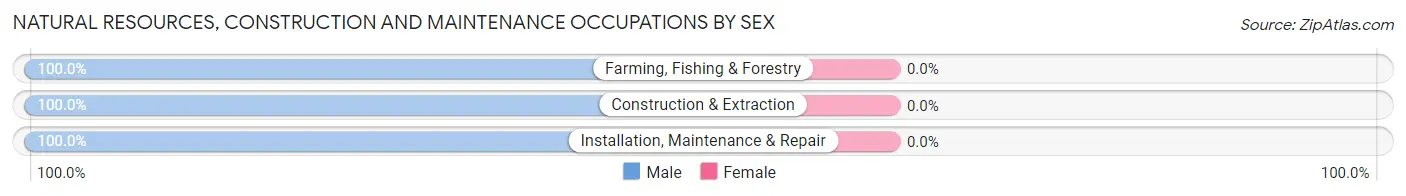
| Occupation | Male | Female |
| Farming, Fishing & Forestry | 7 (100.0%) | 0 (0.0%) |
| Construction & Extraction | 52 (100.0%) | 0 (0.0%) |
| Installation, Maintenance & Repair | 32 (100.0%) | 0 (0.0%) |
| Total (Category) | 91 (100.0%) | 0 (0.0%) |
| Total (Overall) | 401 (51.3%) | 380 (48.7%) |
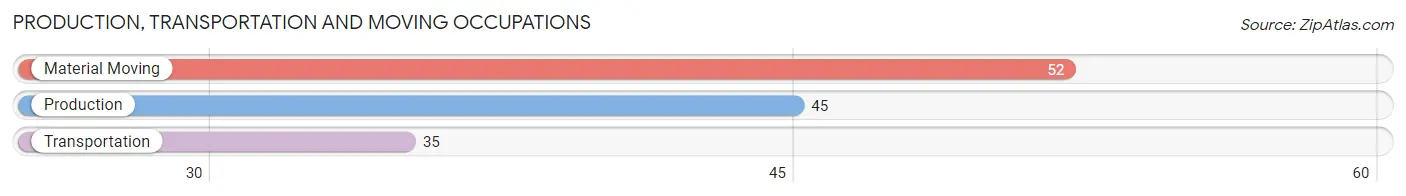
Production, Transportation and Moving Occupations
The most common Production, Transportation and Moving occupations in Ackley are Material Moving (52 | 6.7%), Production (45 | 5.8%), and Transportation (35 | 4.5%).
Production, Transportation and Moving Occupations by Sex
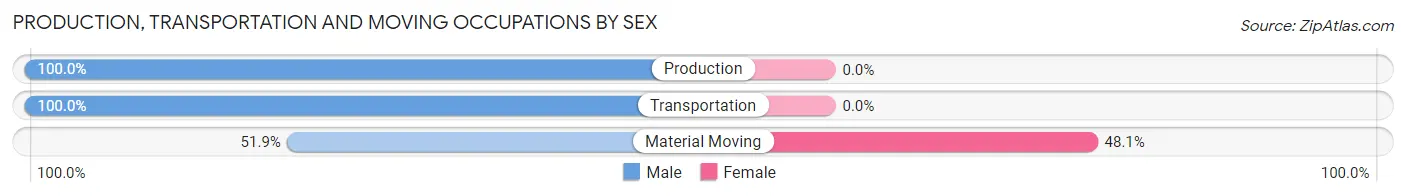
| Occupation | Male | Female |
| Production | 45 (100.0%) | 0 (0.0%) |
| Transportation | 35 (100.0%) | 0 (0.0%) |
| Material Moving | 27 (51.9%) | 25 (48.1%) |
| Total (Category) | 107 (81.1%) | 25 (18.9%) |
| Total (Overall) | 401 (51.3%) | 380 (48.7%) |
Employment Industries by Sex in Ackley
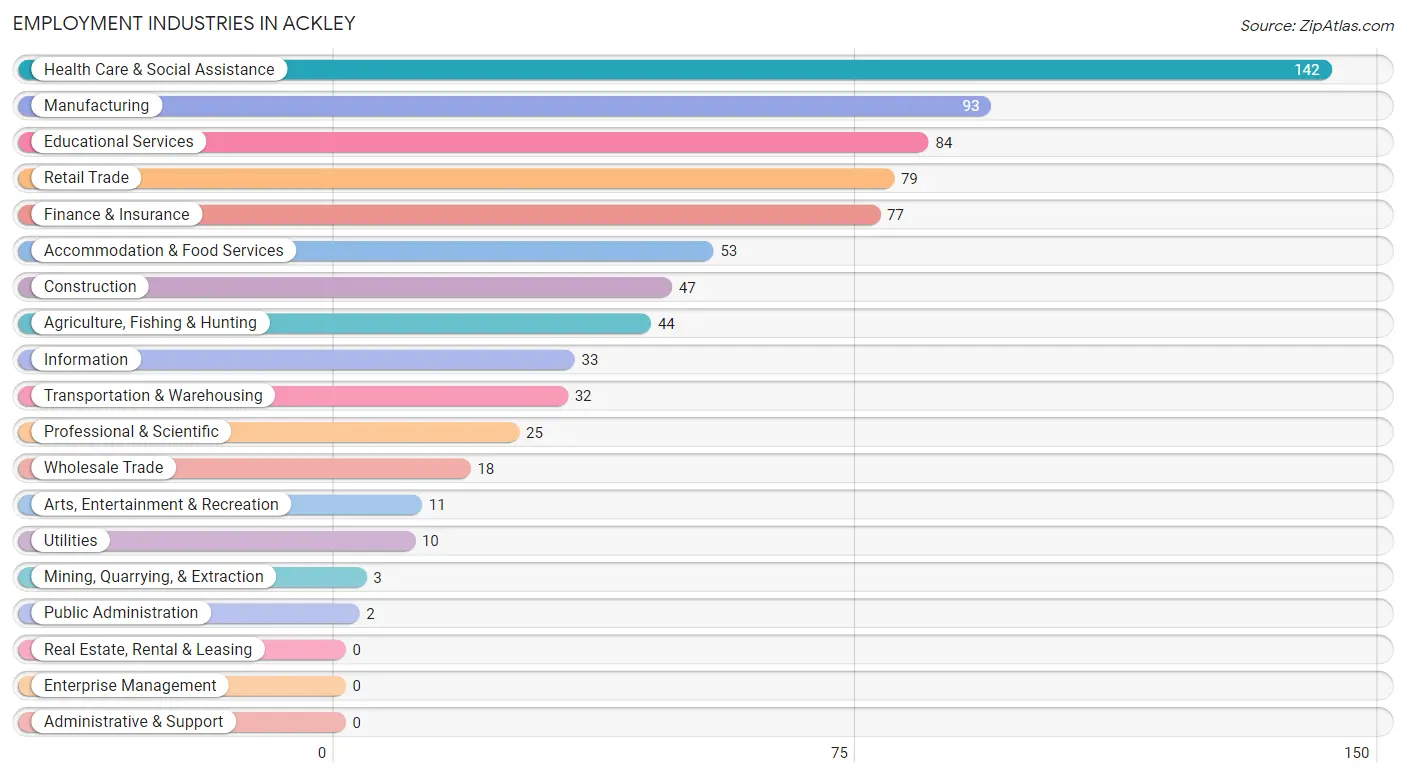
Employment Industries in Ackley
The major employment industries in Ackley include Health Care & Social Assistance (142 | 18.2%), Manufacturing (93 | 11.9%), Educational Services (84 | 10.8%), Retail Trade (79 | 10.1%), and Finance & Insurance (77 | 9.9%).
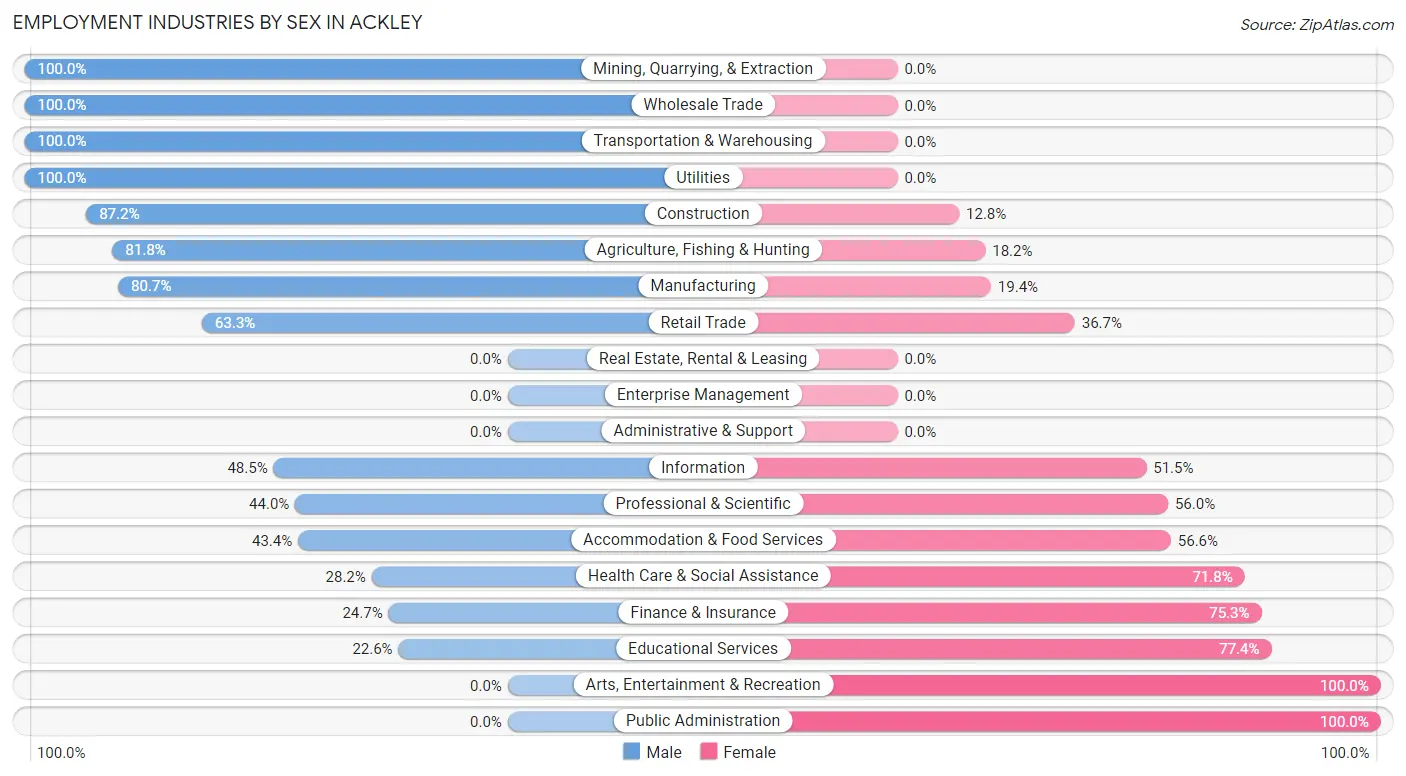
Employment Industries by Sex in Ackley
The Ackley industries that see more men than women are Mining, Quarrying, & Extraction (100.0%), Wholesale Trade (100.0%), and Transportation & Warehousing (100.0%), whereas the industries that tend to have a higher number of women are Arts, Entertainment & Recreation (100.0%), Public Administration (100.0%), and Educational Services (77.4%).
| Industry | Male | Female |
| Agriculture, Fishing & Hunting | 36 (81.8%) | 8 (18.2%) |
| Mining, Quarrying, & Extraction | 3 (100.0%) | 0 (0.0%) |
| Construction | 41 (87.2%) | 6 (12.8%) |
| Manufacturing | 75 (80.6%) | 18 (19.4%) |
| Wholesale Trade | 18 (100.0%) | 0 (0.0%) |
| Retail Trade | 50 (63.3%) | 29 (36.7%) |
| Transportation & Warehousing | 32 (100.0%) | 0 (0.0%) |
| Utilities | 10 (100.0%) | 0 (0.0%) |
| Information | 16 (48.5%) | 17 (51.5%) |
| Finance & Insurance | 19 (24.7%) | 58 (75.3%) |
| Real Estate, Rental & Leasing | 0 (0.0%) | 0 (0.0%) |
| Professional & Scientific | 11 (44.0%) | 14 (56.0%) |
| Enterprise Management | 0 (0.0%) | 0 (0.0%) |
| Administrative & Support | 0 (0.0%) | 0 (0.0%) |
| Educational Services | 19 (22.6%) | 65 (77.4%) |
| Health Care & Social Assistance | 40 (28.2%) | 102 (71.8%) |
| Arts, Entertainment & Recreation | 0 (0.0%) | 11 (100.0%) |
| Accommodation & Food Services | 23 (43.4%) | 30 (56.6%) |
| Public Administration | 0 (0.0%) | 2 (100.0%) |
| Total | 401 (51.3%) | 380 (48.7%) |
Education in Ackley
School Enrollment in Ackley
The most common levels of schooling among the 356 students in Ackley are high school (125 | 35.1%), middle school (109 | 30.6%), and nursery / preschool (53 | 14.9%).
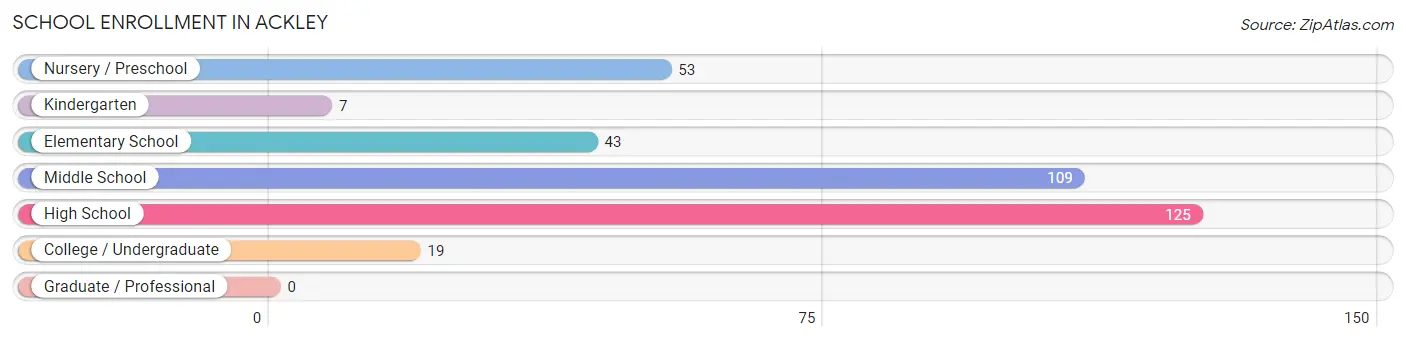
| School Level | # Students | % Students |
| Nursery / Preschool | 53 | 14.9% |
| Kindergarten | 7 | 2.0% |
| Elementary School | 43 | 12.1% |
| Middle School | 109 | 30.6% |
| High School | 125 | 35.1% |
| College / Undergraduate | 19 | 5.3% |
| Graduate / Professional | 0 | 0.0% |
| Total | 356 | 100.0% |
School Enrollment by Age by Funding Source in Ackley
Out of a total of 356 students who are enrolled in schools in Ackley, 7 (2.0%) attend a private institution, while the remaining 349 (98.0%) are enrolled in public schools. The age group of 15 to 17 year olds has the highest likelihood of being enrolled in private schools, with 4 (4.1% in the age bracket) enrolled. Conversely, the age group of 3 to 4 year olds has the lowest likelihood of being enrolled in a private school, with 29 (100.0% in the age bracket) attending a public institution.
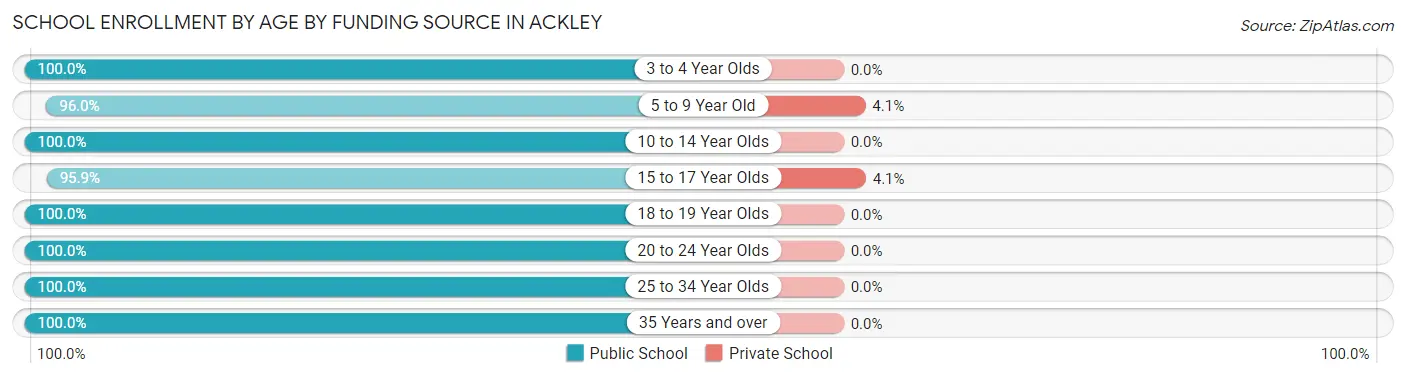
| Age Bracket | Public School | Private School |
| 3 to 4 Year Olds | 29 (100.0%) | 0 (0.0%) |
| 5 to 9 Year Old | 71 (96.0%) | 3 (4.1%) |
| 10 to 14 Year Olds | 125 (100.0%) | 0 (0.0%) |
| 15 to 17 Year Olds | 93 (95.9%) | 4 (4.1%) |
| 18 to 19 Year Olds | 16 (100.0%) | 0 (0.0%) |
| 20 to 24 Year Olds | 6 (100.0%) | 0 (0.0%) |
| 25 to 34 Year Olds | 7 (100.0%) | 0 (0.0%) |
| 35 Years and over | 2 (100.0%) | 0 (0.0%) |
| Total | 349 (98.0%) | 7 (2.0%) |
Educational Attainment by Field of Study in Ackley
Education (92 | 34.7%), bio, nature & agricultural (43 | 16.2%), business (36 | 13.6%), arts & humanities (31 | 11.7%), and communications (18 | 6.8%) are the most common fields of study among 265 individuals in Ackley who have obtained a bachelor's degree or higher.
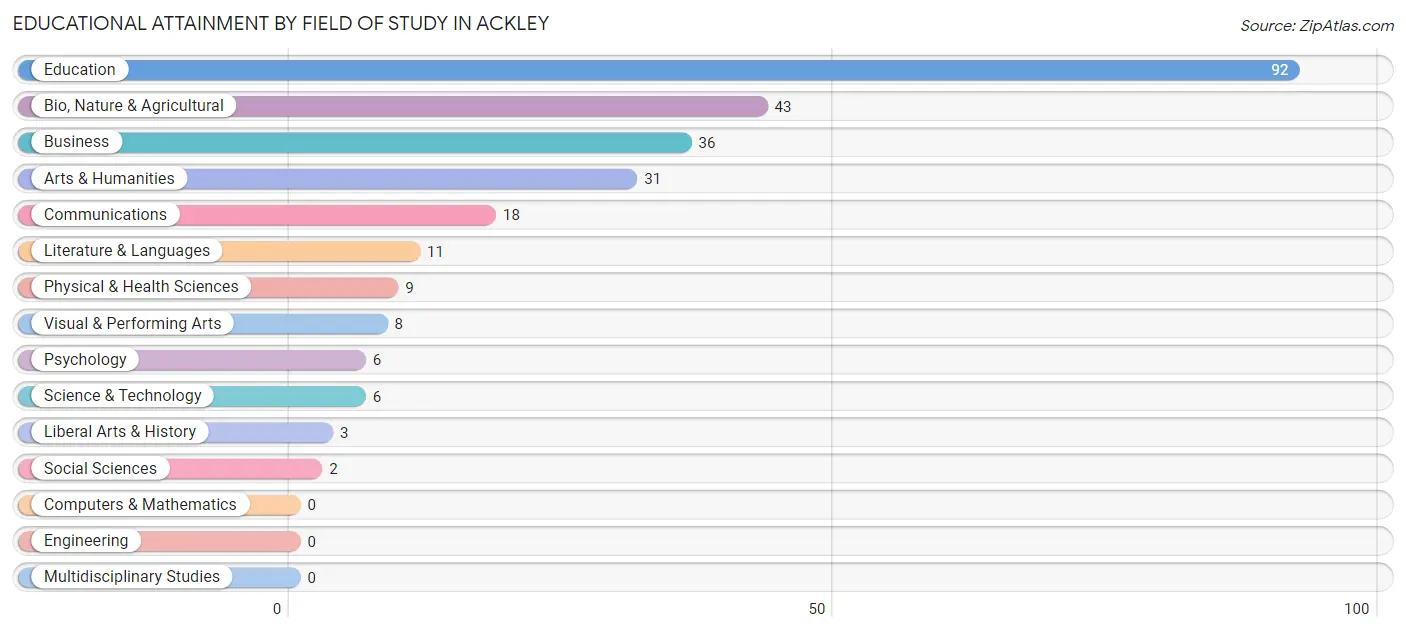
| Field of Study | # Graduates | % Graduates |
| Computers & Mathematics | 0 | 0.0% |
| Bio, Nature & Agricultural | 43 | 16.2% |
| Physical & Health Sciences | 9 | 3.4% |
| Psychology | 6 | 2.3% |
| Social Sciences | 2 | 0.7% |
| Engineering | 0 | 0.0% |
| Multidisciplinary Studies | 0 | 0.0% |
| Science & Technology | 6 | 2.3% |
| Business | 36 | 13.6% |
| Education | 92 | 34.7% |
| Literature & Languages | 11 | 4.2% |
| Liberal Arts & History | 3 | 1.1% |
| Visual & Performing Arts | 8 | 3.0% |
| Communications | 18 | 6.8% |
| Arts & Humanities | 31 | 11.7% |
| Total | 265 | 100.0% |
Transportation & Commute in Ackley
Vehicle Availability by Sex in Ackley
The most prevalent vehicle ownership categories in Ackley are males with 2 vehicles (167, accounting for 41.8%) and females with 2 vehicles (111, making up 44.2%).
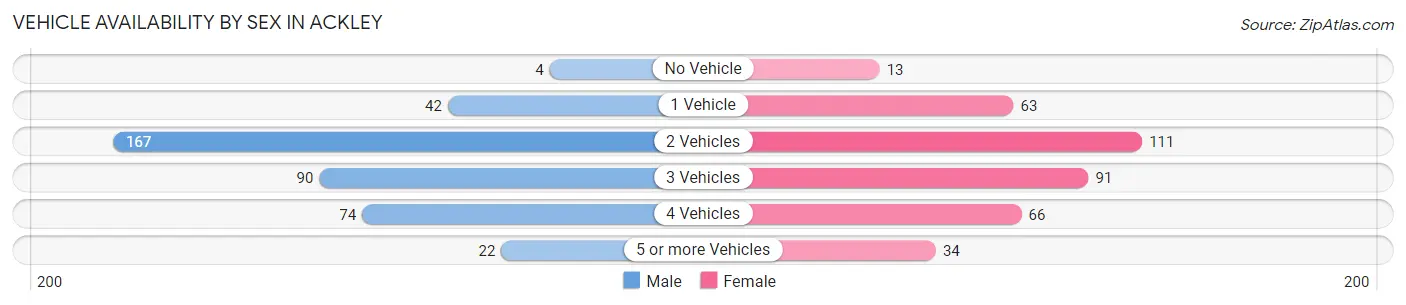
| Vehicles Available | Male | Female |
| No Vehicle | 4 (1.0%) | 13 (3.4%) |
| 1 Vehicle | 42 (10.5%) | 63 (16.7%) |
| 2 Vehicles | 167 (41.8%) | 111 (29.4%) |
| 3 Vehicles | 90 (22.6%) | 91 (24.1%) |
| 4 Vehicles | 74 (18.5%) | 66 (17.5%) |
| 5 or more Vehicles | 22 (5.5%) | 34 (9.0%) |
| Total | 399 (100.0%) | 378 (100.0%) |
Commute Time in Ackley
The most frequently occuring commute durations in Ackley are less than 5 minutes (144 commuters, 19.2%), 5 to 9 minutes (128 commuters, 17.0%), and 20 to 24 minutes (83 commuters, 11.0%).
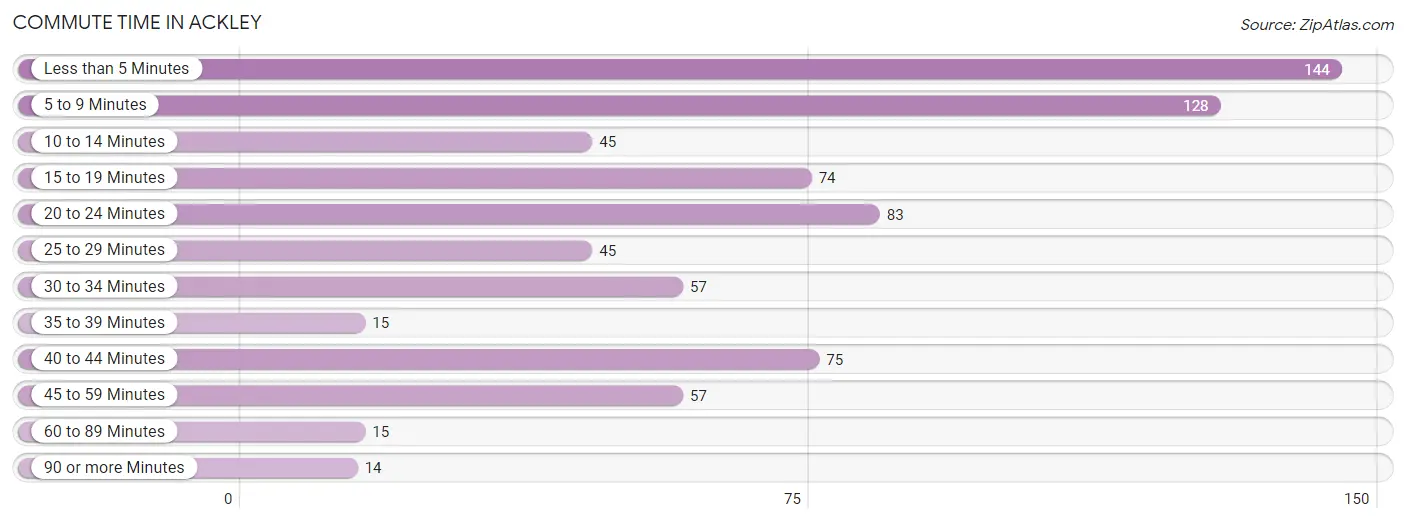
| Commute Time | # Commuters | % Commuters |
| Less than 5 Minutes | 144 | 19.2% |
| 5 to 9 Minutes | 128 | 17.0% |
| 10 to 14 Minutes | 45 | 6.0% |
| 15 to 19 Minutes | 74 | 9.8% |
| 20 to 24 Minutes | 83 | 11.0% |
| 25 to 29 Minutes | 45 | 6.0% |
| 30 to 34 Minutes | 57 | 7.6% |
| 35 to 39 Minutes | 15 | 2.0% |
| 40 to 44 Minutes | 75 | 10.0% |
| 45 to 59 Minutes | 57 | 7.6% |
| 60 to 89 Minutes | 15 | 2.0% |
| 90 or more Minutes | 14 | 1.9% |
Commute Time by Sex in Ackley
The most common commute times in Ackley are less than 5 minutes (66 commuters, 16.8%) for males and less than 5 minutes (78 commuters, 21.8%) for females.
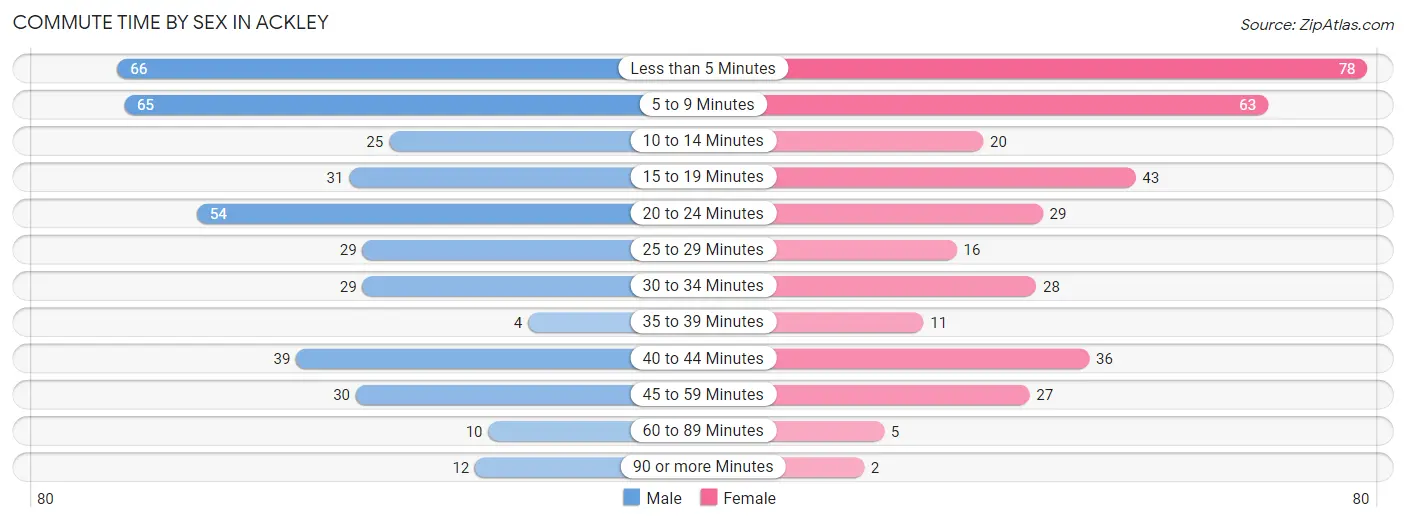
| Commute Time | Male | Female |
| Less than 5 Minutes | 66 (16.8%) | 78 (21.8%) |
| 5 to 9 Minutes | 65 (16.5%) | 63 (17.6%) |
| 10 to 14 Minutes | 25 (6.4%) | 20 (5.6%) |
| 15 to 19 Minutes | 31 (7.9%) | 43 (12.0%) |
| 20 to 24 Minutes | 54 (13.7%) | 29 (8.1%) |
| 25 to 29 Minutes | 29 (7.4%) | 16 (4.5%) |
| 30 to 34 Minutes | 29 (7.4%) | 28 (7.8%) |
| 35 to 39 Minutes | 4 (1.0%) | 11 (3.1%) |
| 40 to 44 Minutes | 39 (9.9%) | 36 (10.1%) |
| 45 to 59 Minutes | 30 (7.6%) | 27 (7.5%) |
| 60 to 89 Minutes | 10 (2.5%) | 5 (1.4%) |
| 90 or more Minutes | 12 (3.0%) | 2 (0.6%) |
Time of Departure to Work by Sex in Ackley
The most frequent times of departure to work in Ackley are 7:30 AM to 7:59 AM (90, 22.8%) for males and 7:30 AM to 7:59 AM (98, 27.4%) for females.
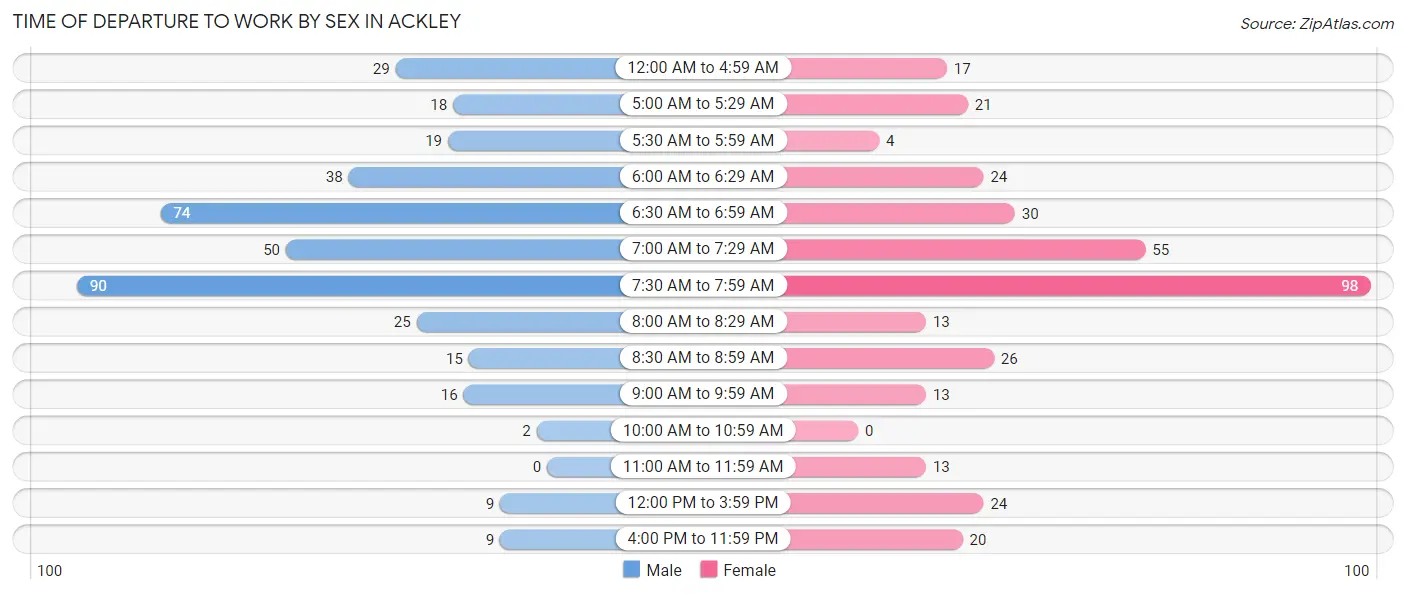
| Time of Departure | Male | Female |
| 12:00 AM to 4:59 AM | 29 (7.4%) | 17 (4.8%) |
| 5:00 AM to 5:29 AM | 18 (4.6%) | 21 (5.9%) |
| 5:30 AM to 5:59 AM | 19 (4.8%) | 4 (1.1%) |
| 6:00 AM to 6:29 AM | 38 (9.6%) | 24 (6.7%) |
| 6:30 AM to 6:59 AM | 74 (18.8%) | 30 (8.4%) |
| 7:00 AM to 7:29 AM | 50 (12.7%) | 55 (15.4%) |
| 7:30 AM to 7:59 AM | 90 (22.8%) | 98 (27.4%) |
| 8:00 AM to 8:29 AM | 25 (6.4%) | 13 (3.6%) |
| 8:30 AM to 8:59 AM | 15 (3.8%) | 26 (7.3%) |
| 9:00 AM to 9:59 AM | 16 (4.1%) | 13 (3.6%) |
| 10:00 AM to 10:59 AM | 2 (0.5%) | 0 (0.0%) |
| 11:00 AM to 11:59 AM | 0 (0.0%) | 13 (3.6%) |
| 12:00 PM to 3:59 PM | 9 (2.3%) | 24 (6.7%) |
| 4:00 PM to 11:59 PM | 9 (2.3%) | 20 (5.6%) |
| Total | 394 (100.0%) | 358 (100.0%) |
Housing Occupancy in Ackley
Occupancy by Ownership in Ackley
Of the total 696 dwellings in Ackley, owner-occupied units account for 575 (82.6%), while renter-occupied units make up 121 (17.4%).
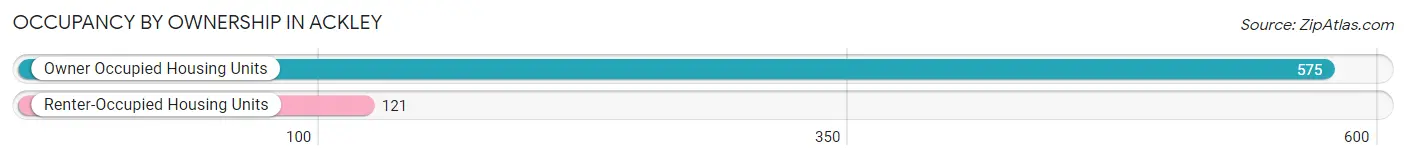
| Occupancy | # Housing Units | % Housing Units |
| Owner Occupied Housing Units | 575 | 82.6% |
| Renter-Occupied Housing Units | 121 | 17.4% |
| Total Occupied Housing Units | 696 | 100.0% |
Occupancy by Household Size in Ackley
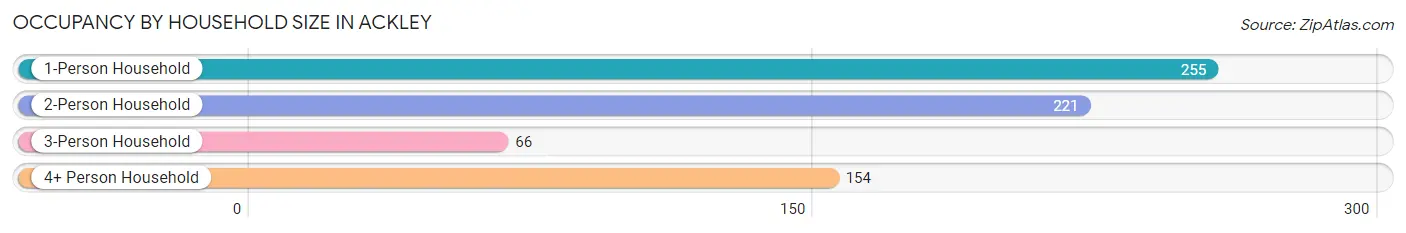
| Household Size | # Housing Units | % Housing Units |
| 1-Person Household | 255 | 36.6% |
| 2-Person Household | 221 | 31.8% |
| 3-Person Household | 66 | 9.5% |
| 4+ Person Household | 154 | 22.1% |
| Total Housing Units | 696 | 100.0% |
Occupancy by Ownership by Household Size in Ackley
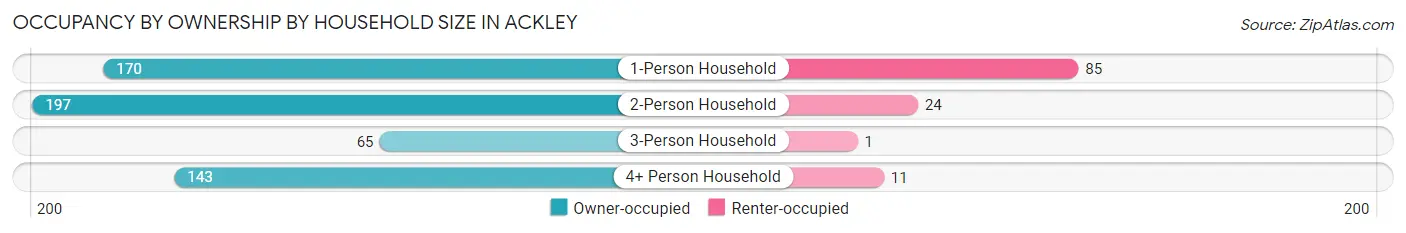
| Household Size | Owner-occupied | Renter-occupied |
| 1-Person Household | 170 (66.7%) | 85 (33.3%) |
| 2-Person Household | 197 (89.1%) | 24 (10.9%) |
| 3-Person Household | 65 (98.5%) | 1 (1.5%) |
| 4+ Person Household | 143 (92.9%) | 11 (7.1%) |
| Total Housing Units | 575 (82.6%) | 121 (17.4%) |
Occupancy by Educational Attainment in Ackley
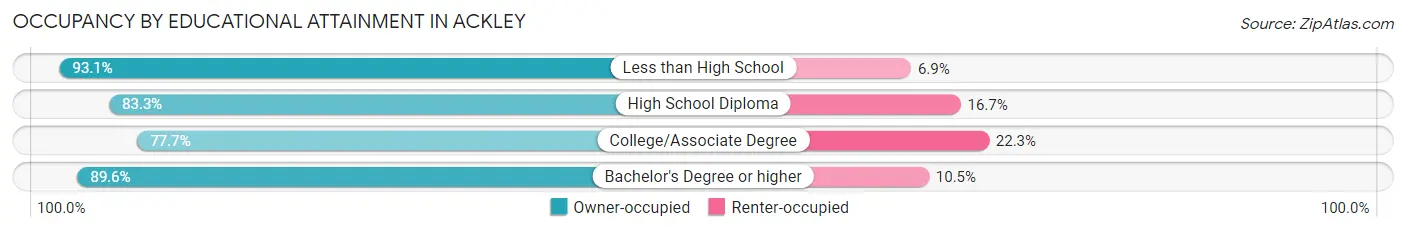
| Household Size | Owner-occupied | Renter-occupied |
| Less than High School | 27 (93.1%) | 2 (6.9%) |
| High School Diploma | 209 (83.3%) | 42 (16.7%) |
| College/Associate Degree | 219 (77.7%) | 63 (22.3%) |
| Bachelor's Degree or higher | 120 (89.5%) | 14 (10.4%) |
Occupancy by Age of Householder in Ackley
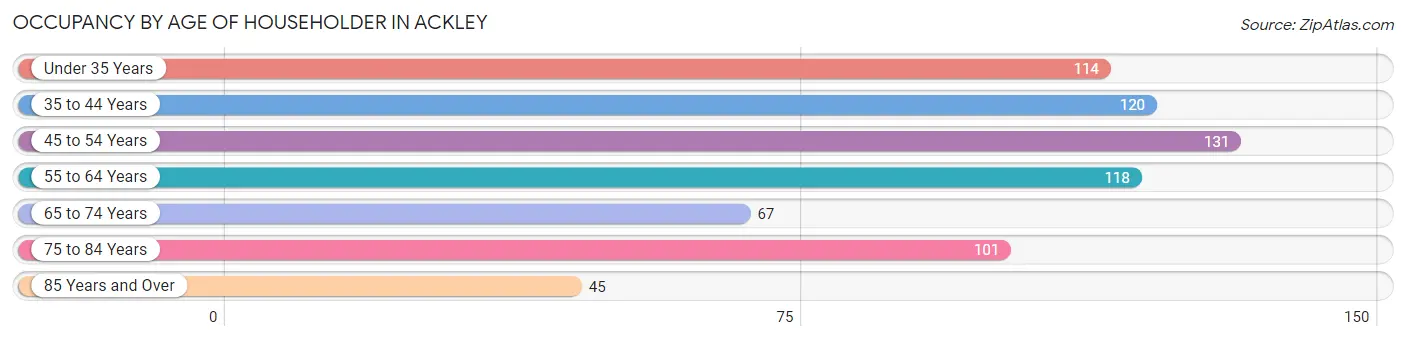
| Age Bracket | # Households | % Households |
| Under 35 Years | 114 | 16.4% |
| 35 to 44 Years | 120 | 17.2% |
| 45 to 54 Years | 131 | 18.8% |
| 55 to 64 Years | 118 | 17.0% |
| 65 to 74 Years | 67 | 9.6% |
| 75 to 84 Years | 101 | 14.5% |
| 85 Years and Over | 45 | 6.5% |
| Total | 696 | 100.0% |
Housing Finances in Ackley
Median Income by Occupancy in Ackley
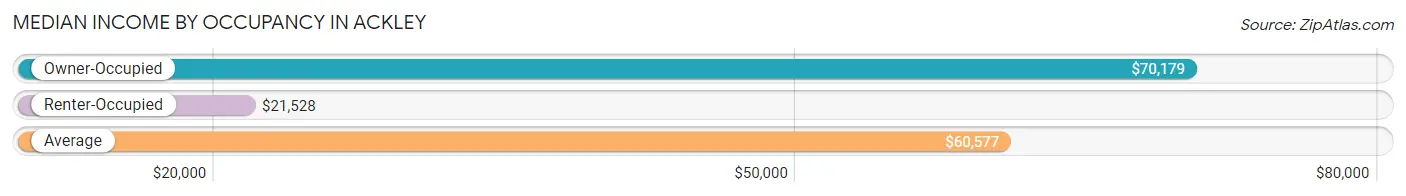
| Occupancy Type | # Households | Median Income |
| Owner-Occupied | 575 (82.6%) | $70,179 |
| Renter-Occupied | 121 (17.4%) | $21,528 |
| Average | 696 (100.0%) | $60,577 |
Occupancy by Householder Income Bracket in Ackley
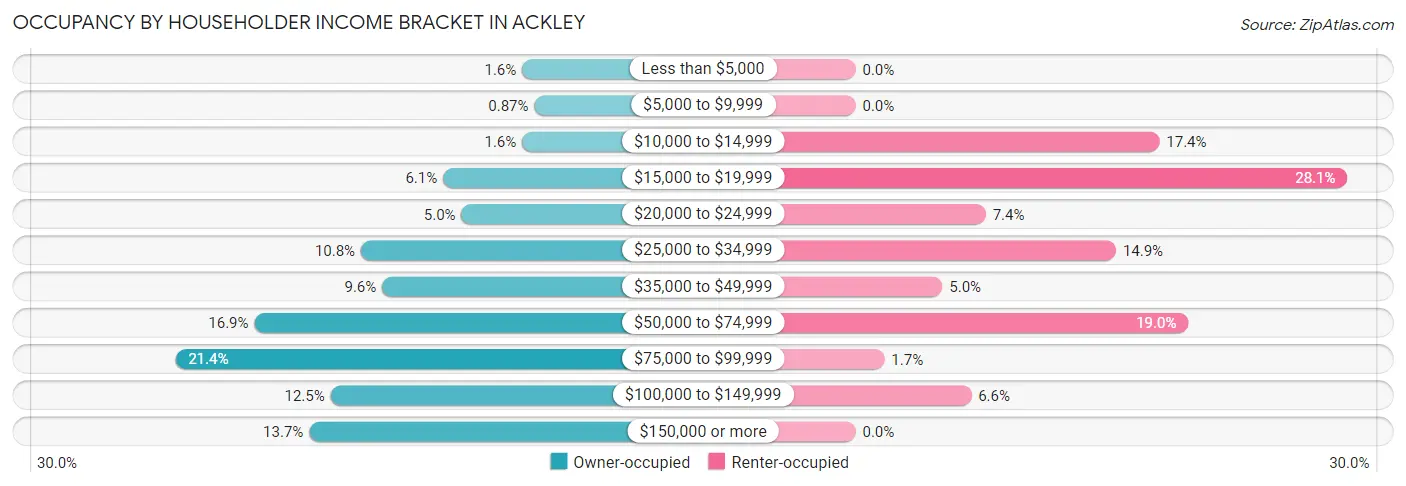
| Income Bracket | Owner-occupied | Renter-occupied |
| Less than $5,000 | 9 (1.6%) | 0 (0.0%) |
| $5,000 to $9,999 | 5 (0.9%) | 0 (0.0%) |
| $10,000 to $14,999 | 9 (1.6%) | 21 (17.4%) |
| $15,000 to $19,999 | 35 (6.1%) | 34 (28.1%) |
| $20,000 to $24,999 | 29 (5.0%) | 9 (7.4%) |
| $25,000 to $34,999 | 62 (10.8%) | 18 (14.9%) |
| $35,000 to $49,999 | 55 (9.6%) | 6 (5.0%) |
| $50,000 to $74,999 | 97 (16.9%) | 23 (19.0%) |
| $75,000 to $99,999 | 123 (21.4%) | 2 (1.7%) |
| $100,000 to $149,999 | 72 (12.5%) | 8 (6.6%) |
| $150,000 or more | 79 (13.7%) | 0 (0.0%) |
| Total | 575 (100.0%) | 121 (100.0%) |
Monthly Housing Cost Tiers in Ackley
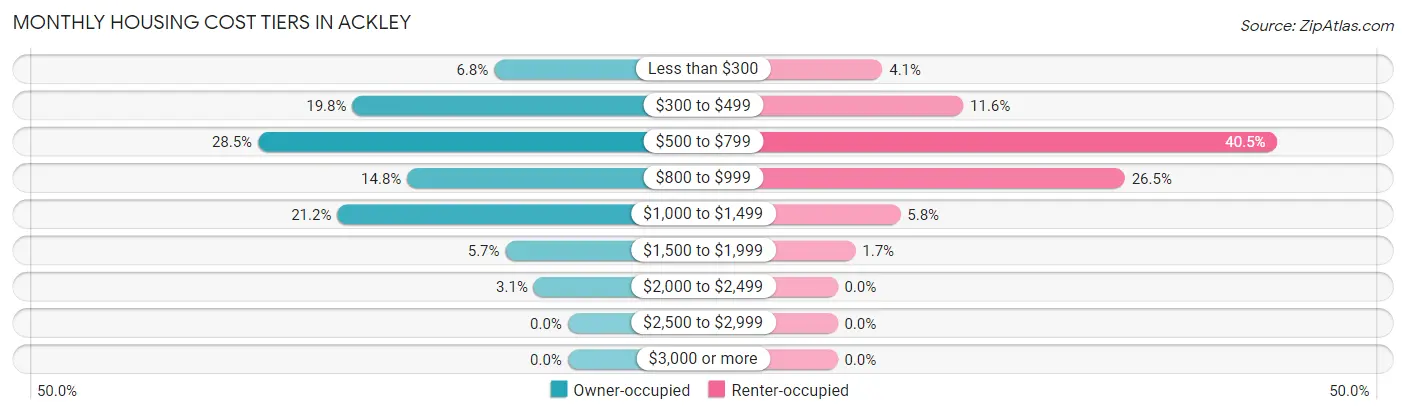
| Monthly Cost | Owner-occupied | Renter-occupied |
| Less than $300 | 39 (6.8%) | 5 (4.1%) |
| $300 to $499 | 114 (19.8%) | 14 (11.6%) |
| $500 to $799 | 164 (28.5%) | 49 (40.5%) |
| $800 to $999 | 85 (14.8%) | 32 (26.5%) |
| $1,000 to $1,499 | 122 (21.2%) | 7 (5.8%) |
| $1,500 to $1,999 | 33 (5.7%) | 2 (1.7%) |
| $2,000 to $2,499 | 18 (3.1%) | 0 (0.0%) |
| $2,500 to $2,999 | 0 (0.0%) | 0 (0.0%) |
| $3,000 or more | 0 (0.0%) | 0 (0.0%) |
| Total | 575 (100.0%) | 121 (100.0%) |
Physical Housing Characteristics in Ackley
Housing Structures in Ackley
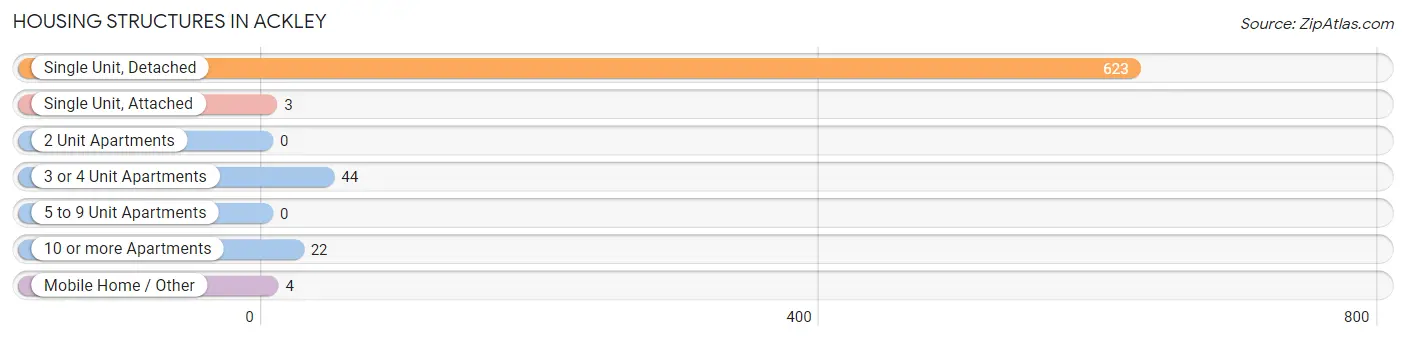
| Structure Type | # Housing Units | % Housing Units |
| Single Unit, Detached | 623 | 89.5% |
| Single Unit, Attached | 3 | 0.4% |
| 2 Unit Apartments | 0 | 0.0% |
| 3 or 4 Unit Apartments | 44 | 6.3% |
| 5 to 9 Unit Apartments | 0 | 0.0% |
| 10 or more Apartments | 22 | 3.2% |
| Mobile Home / Other | 4 | 0.6% |
| Total | 696 | 100.0% |
Housing Structures by Occupancy in Ackley
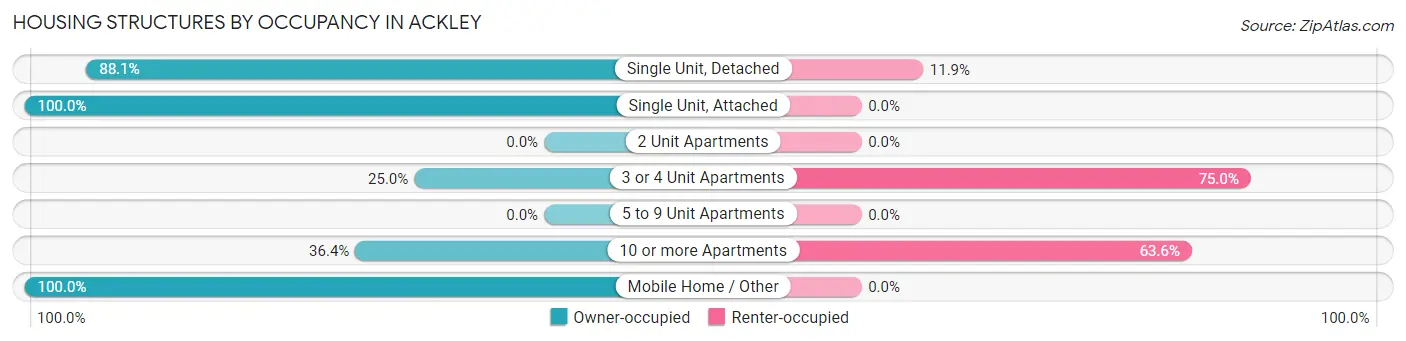
| Structure Type | Owner-occupied | Renter-occupied |
| Single Unit, Detached | 549 (88.1%) | 74 (11.9%) |
| Single Unit, Attached | 3 (100.0%) | 0 (0.0%) |
| 2 Unit Apartments | 0 (0.0%) | 0 (0.0%) |
| 3 or 4 Unit Apartments | 11 (25.0%) | 33 (75.0%) |
| 5 to 9 Unit Apartments | 0 (0.0%) | 0 (0.0%) |
| 10 or more Apartments | 8 (36.4%) | 14 (63.6%) |
| Mobile Home / Other | 4 (100.0%) | 0 (0.0%) |
| Total | 575 (82.6%) | 121 (17.4%) |
Housing Structures by Number of Rooms in Ackley
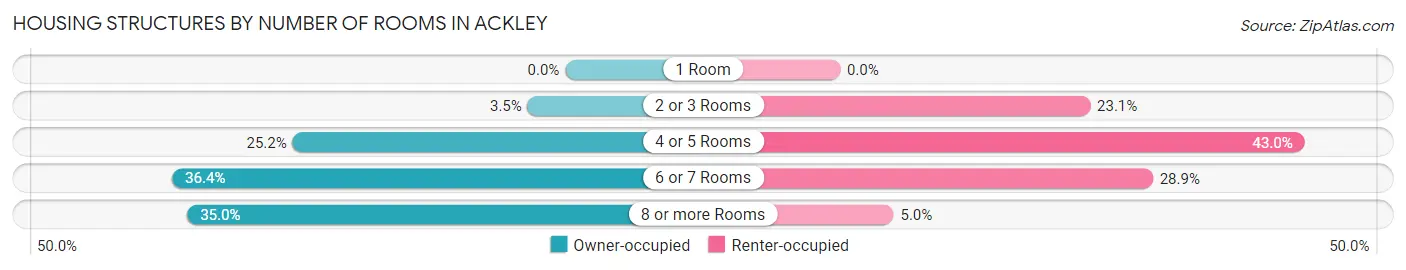
| Number of Rooms | Owner-occupied | Renter-occupied |
| 1 Room | 0 (0.0%) | 0 (0.0%) |
| 2 or 3 Rooms | 20 (3.5%) | 28 (23.1%) |
| 4 or 5 Rooms | 145 (25.2%) | 52 (43.0%) |
| 6 or 7 Rooms | 209 (36.3%) | 35 (28.9%) |
| 8 or more Rooms | 201 (35.0%) | 6 (5.0%) |
| Total | 575 (100.0%) | 121 (100.0%) |
Housing Structure by Heating Type in Ackley
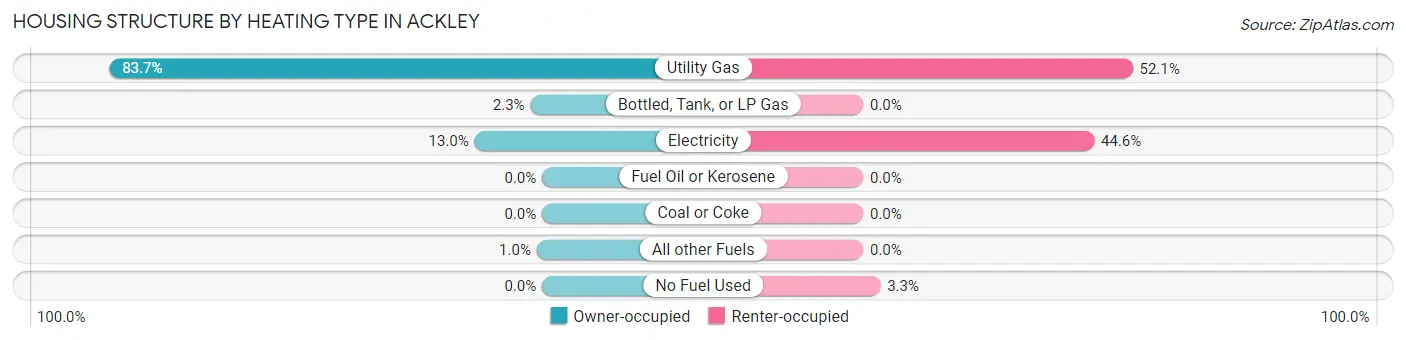
| Heating Type | Owner-occupied | Renter-occupied |
| Utility Gas | 481 (83.7%) | 63 (52.1%) |
| Bottled, Tank, or LP Gas | 13 (2.3%) | 0 (0.0%) |
| Electricity | 75 (13.0%) | 54 (44.6%) |
| Fuel Oil or Kerosene | 0 (0.0%) | 0 (0.0%) |
| Coal or Coke | 0 (0.0%) | 0 (0.0%) |
| All other Fuels | 6 (1.0%) | 0 (0.0%) |
| No Fuel Used | 0 (0.0%) | 4 (3.3%) |
| Total | 575 (100.0%) | 121 (100.0%) |
Household Vehicle Usage in Ackley
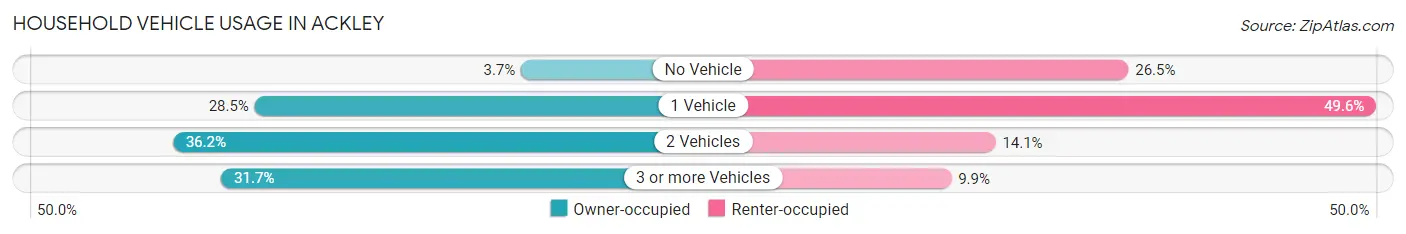
| Vehicles per Household | Owner-occupied | Renter-occupied |
| No Vehicle | 21 (3.6%) | 32 (26.5%) |
| 1 Vehicle | 164 (28.5%) | 60 (49.6%) |
| 2 Vehicles | 208 (36.2%) | 17 (14.1%) |
| 3 or more Vehicles | 182 (31.7%) | 12 (9.9%) |
| Total | 575 (100.0%) | 121 (100.0%) |
Real Estate & Mortgages in Ackley
Real Estate and Mortgage Overview in Ackley
| Characteristic | Without Mortgage | With Mortgage |
| Housing Units | 287 | 288 |
| Median Property Value | $85,500 | $106,700 |
| Median Household Income | $38,750 | $57 |
| Monthly Housing Costs | $496 | $0 |
| Real Estate Taxes | $1,561 | $0 |
Property Value by Mortgage Status in Ackley
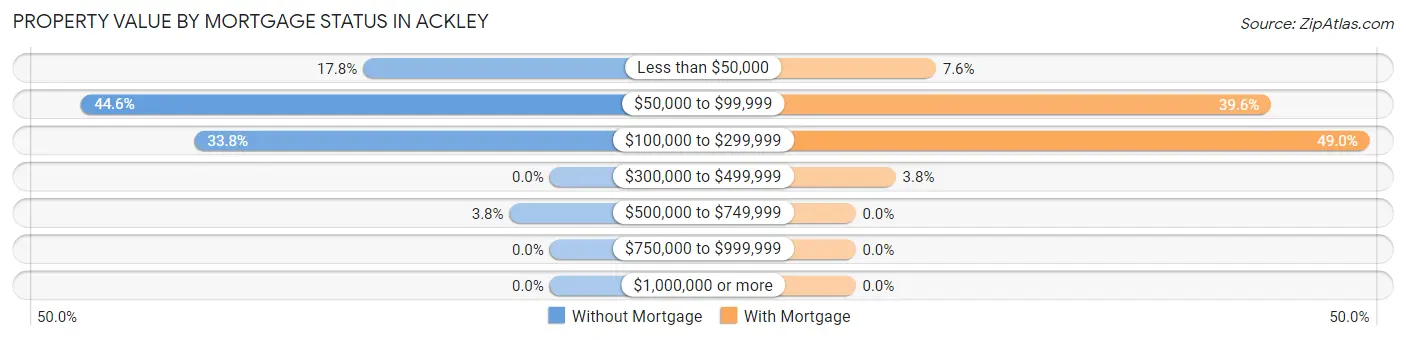
| Property Value | Without Mortgage | With Mortgage |
| Less than $50,000 | 51 (17.8%) | 22 (7.6%) |
| $50,000 to $99,999 | 128 (44.6%) | 114 (39.6%) |
| $100,000 to $299,999 | 97 (33.8%) | 141 (49.0%) |
| $300,000 to $499,999 | 0 (0.0%) | 11 (3.8%) |
| $500,000 to $749,999 | 11 (3.8%) | 0 (0.0%) |
| $750,000 to $999,999 | 0 (0.0%) | 0 (0.0%) |
| $1,000,000 or more | 0 (0.0%) | 0 (0.0%) |
| Total | 287 (100.0%) | 288 (100.0%) |
Household Income by Mortgage Status in Ackley
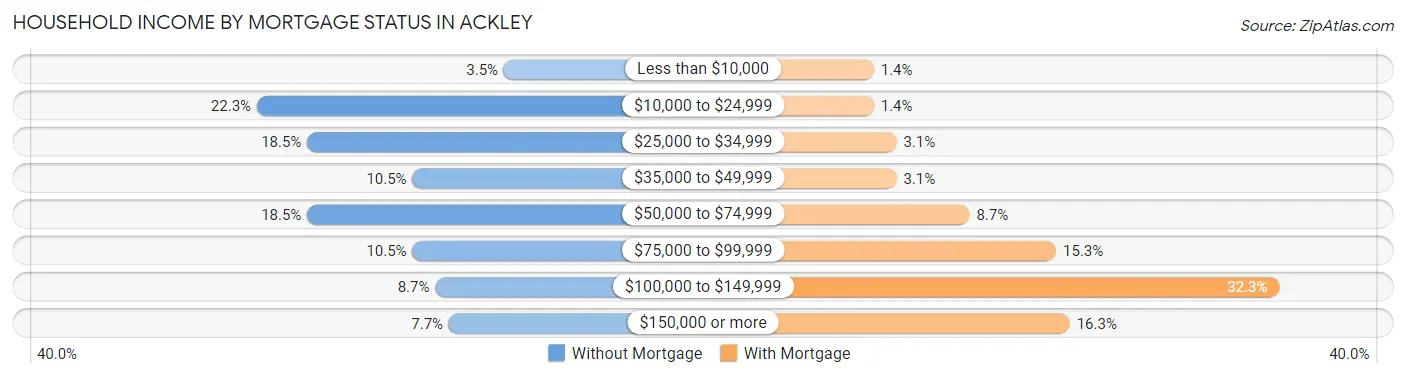
| Household Income | Without Mortgage | With Mortgage |
| Less than $10,000 | 10 (3.5%) | 4 (1.4%) |
| $10,000 to $24,999 | 64 (22.3%) | 4 (1.4%) |
| $25,000 to $34,999 | 53 (18.5%) | 9 (3.1%) |
| $35,000 to $49,999 | 30 (10.4%) | 9 (3.1%) |
| $50,000 to $74,999 | 53 (18.5%) | 25 (8.7%) |
| $75,000 to $99,999 | 30 (10.4%) | 44 (15.3%) |
| $100,000 to $149,999 | 25 (8.7%) | 93 (32.3%) |
| $150,000 or more | 22 (7.7%) | 47 (16.3%) |
| Total | 287 (100.0%) | 288 (100.0%) |
Property Value to Household Income Ratio in Ackley
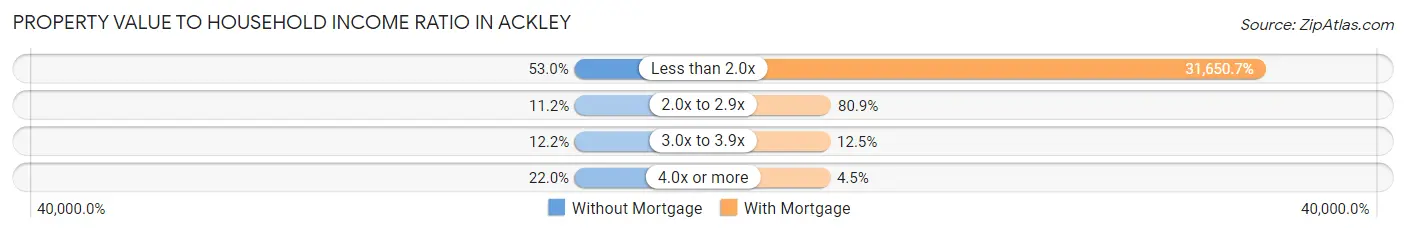
| Value-to-Income Ratio | Without Mortgage | With Mortgage |
| Less than 2.0x | 152 (53.0%) | 91,154 (31,650.7%) |
| 2.0x to 2.9x | 32 (11.2%) | 233 (80.9%) |
| 3.0x to 3.9x | 35 (12.2%) | 36 (12.5%) |
| 4.0x or more | 63 (22.0%) | 13 (4.5%) |
| Total | 287 (100.0%) | 288 (100.0%) |
Real Estate Taxes by Mortgage Status in Ackley
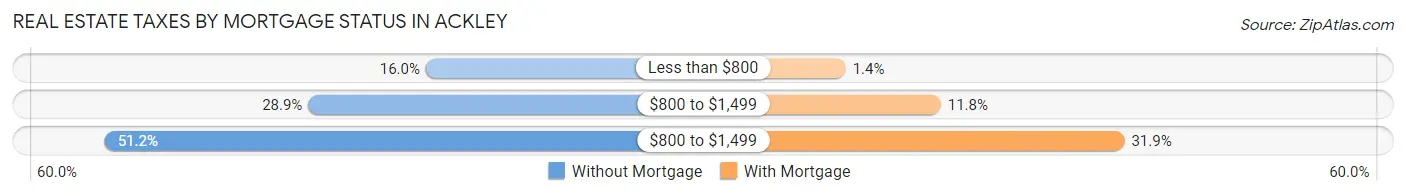
| Property Taxes | Without Mortgage | With Mortgage |
| Less than $800 | 46 (16.0%) | 4 (1.4%) |
| $800 to $1,499 | 83 (28.9%) | 34 (11.8%) |
| $800 to $1,499 | 147 (51.2%) | 92 (31.9%) |
| Total | 287 (100.0%) | 288 (100.0%) |
Health & Disability in Ackley
Health Insurance Coverage by Age in Ackley
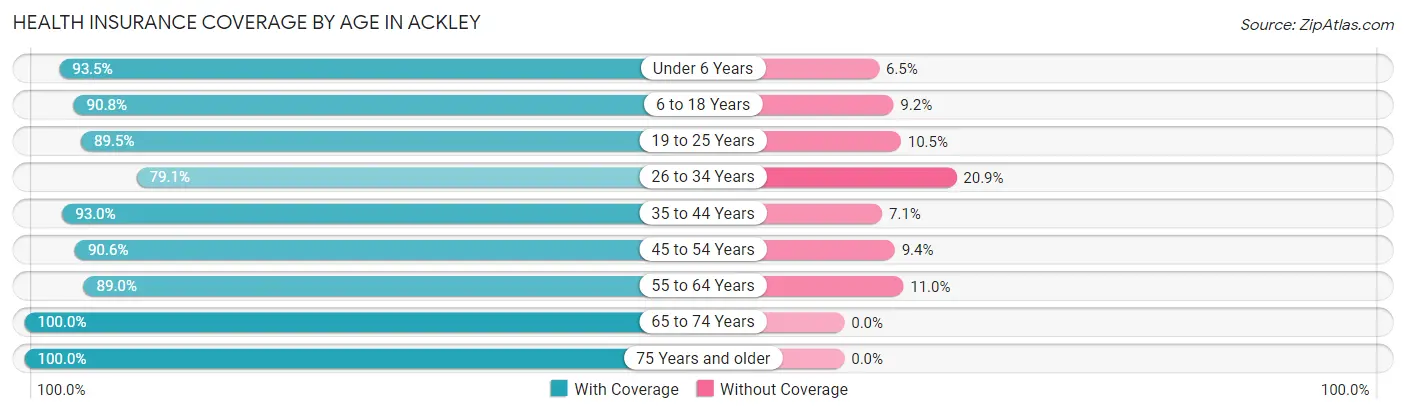
| Age Bracket | With Coverage | Without Coverage |
| Under 6 Years | 101 (93.5%) | 7 (6.5%) |
| 6 to 18 Years | 248 (90.8%) | 25 (9.2%) |
| 19 to 25 Years | 119 (89.5%) | 14 (10.5%) |
| 26 to 34 Years | 106 (79.1%) | 28 (20.9%) |
| 35 to 44 Years | 211 (92.9%) | 16 (7.0%) |
| 45 to 54 Years | 212 (90.6%) | 22 (9.4%) |
| 55 to 64 Years | 202 (89.0%) | 25 (11.0%) |
| 65 to 74 Years | 115 (100.0%) | 0 (0.0%) |
| 75 Years and older | 193 (100.0%) | 0 (0.0%) |
| Total | 1,507 (91.7%) | 137 (8.3%) |
Health Insurance Coverage by Citizenship Status in Ackley
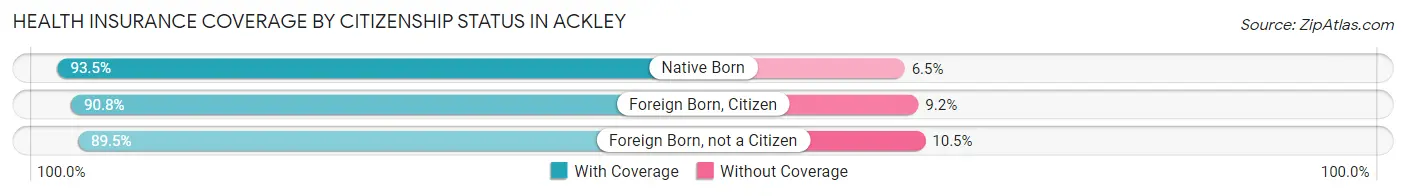
| Citizenship Status | With Coverage | Without Coverage |
| Native Born | 101 (93.5%) | 7 (6.5%) |
| Foreign Born, Citizen | 248 (90.8%) | 25 (9.2%) |
| Foreign Born, not a Citizen | 119 (89.5%) | 14 (10.5%) |
Health Insurance Coverage by Household Income in Ackley
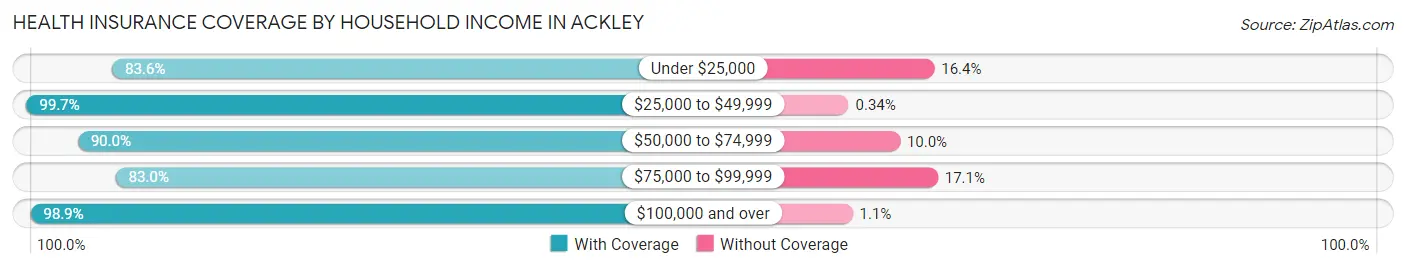
| Household Income | With Coverage | Without Coverage |
| Under $25,000 | 199 (83.6%) | 39 (16.4%) |
| $25,000 to $49,999 | 296 (99.7%) | 1 (0.3%) |
| $50,000 to $74,999 | 235 (90.0%) | 26 (10.0%) |
| $75,000 to $99,999 | 321 (83.0%) | 66 (17.1%) |
| $100,000 and over | 456 (98.9%) | 5 (1.1%) |
Public vs Private Health Insurance Coverage by Age in Ackley
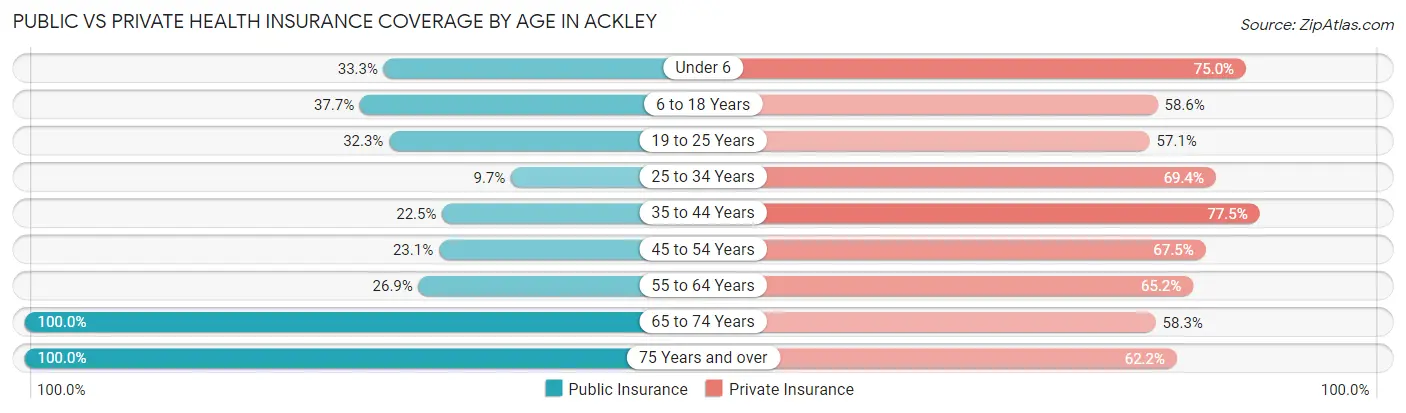
| Age Bracket | Public Insurance | Private Insurance |
| Under 6 | 36 (33.3%) | 81 (75.0%) |
| 6 to 18 Years | 103 (37.7%) | 160 (58.6%) |
| 19 to 25 Years | 43 (32.3%) | 76 (57.1%) |
| 25 to 34 Years | 13 (9.7%) | 93 (69.4%) |
| 35 to 44 Years | 51 (22.5%) | 176 (77.5%) |
| 45 to 54 Years | 54 (23.1%) | 158 (67.5%) |
| 55 to 64 Years | 61 (26.9%) | 148 (65.2%) |
| 65 to 74 Years | 115 (100.0%) | 67 (58.3%) |
| 75 Years and over | 193 (100.0%) | 120 (62.2%) |
| Total | 669 (40.7%) | 1,079 (65.6%) |
Disability Status by Sex by Age in Ackley
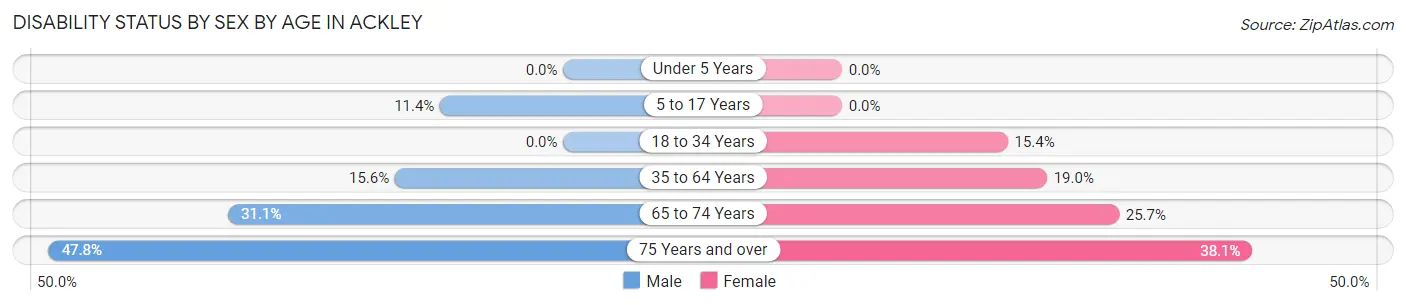
| Age Bracket | Male | Female |
| Under 5 Years | 0 (0.0%) | 0 (0.0%) |
| 5 to 17 Years | 16 (11.4%) | 0 (0.0%) |
| 18 to 34 Years | 0 (0.0%) | 20 (15.4%) |
| 35 to 64 Years | 50 (15.6%) | 70 (19.0%) |
| 65 to 74 Years | 14 (31.1%) | 18 (25.7%) |
| 75 Years and over | 32 (47.8%) | 48 (38.1%) |
Disability Class by Sex by Age in Ackley
Disability Class: Hearing Difficulty
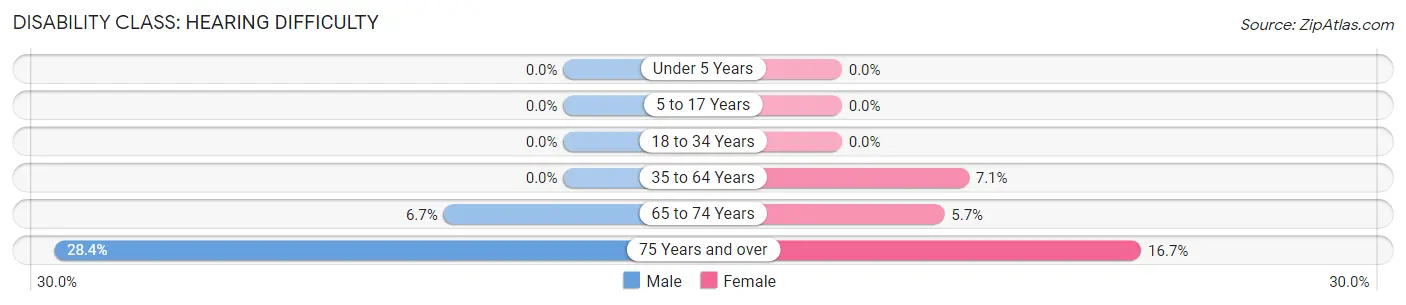
| Age Bracket | Male | Female |
| Under 5 Years | 0 (0.0%) | 0 (0.0%) |
| 5 to 17 Years | 0 (0.0%) | 0 (0.0%) |
| 18 to 34 Years | 0 (0.0%) | 0 (0.0%) |
| 35 to 64 Years | 0 (0.0%) | 26 (7.1%) |
| 65 to 74 Years | 3 (6.7%) | 4 (5.7%) |
| 75 Years and over | 19 (28.4%) | 21 (16.7%) |
Disability Class: Vision Difficulty
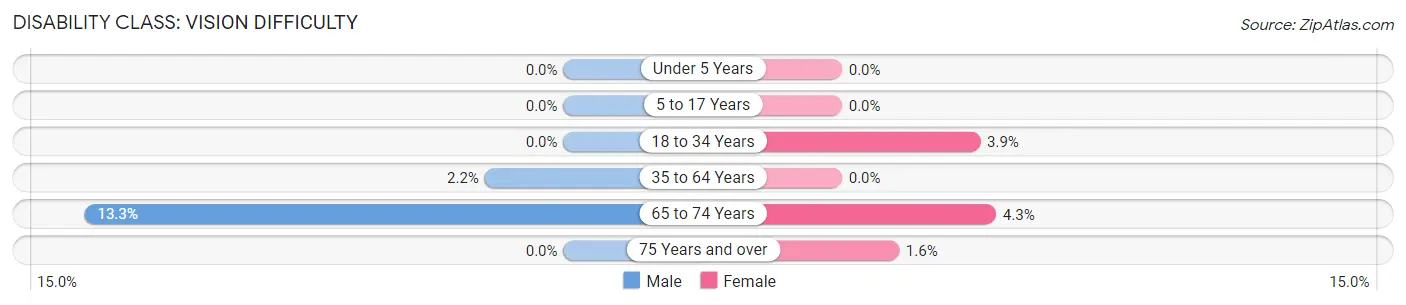
| Age Bracket | Male | Female |
| Under 5 Years | 0 (0.0%) | 0 (0.0%) |
| 5 to 17 Years | 0 (0.0%) | 0 (0.0%) |
| 18 to 34 Years | 0 (0.0%) | 5 (3.8%) |
| 35 to 64 Years | 7 (2.2%) | 0 (0.0%) |
| 65 to 74 Years | 6 (13.3%) | 3 (4.3%) |
| 75 Years and over | 0 (0.0%) | 2 (1.6%) |
Disability Class: Cognitive Difficulty
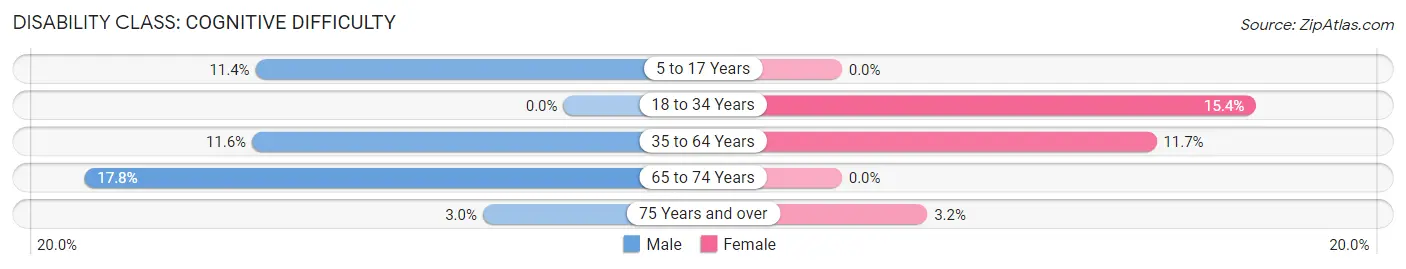
| Age Bracket | Male | Female |
| 5 to 17 Years | 16 (11.4%) | 0 (0.0%) |
| 18 to 34 Years | 0 (0.0%) | 20 (15.4%) |
| 35 to 64 Years | 37 (11.6%) | 43 (11.7%) |
| 65 to 74 Years | 8 (17.8%) | 0 (0.0%) |
| 75 Years and over | 2 (3.0%) | 4 (3.2%) |
Disability Class: Ambulatory Difficulty
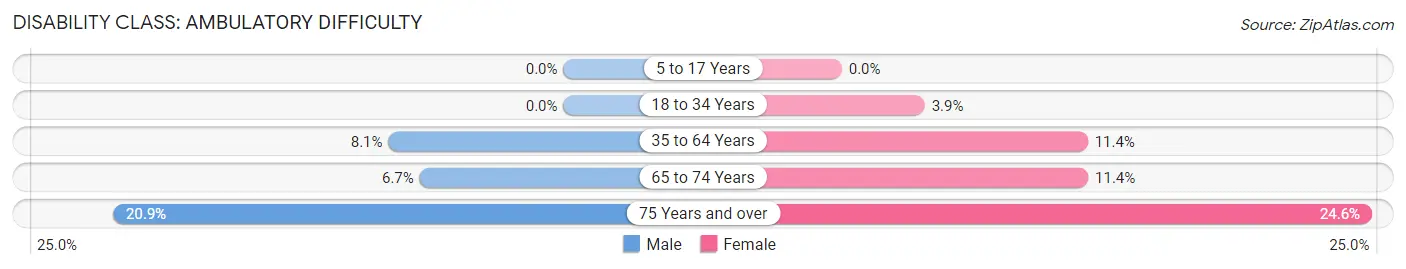
| Age Bracket | Male | Female |
| 5 to 17 Years | 0 (0.0%) | 0 (0.0%) |
| 18 to 34 Years | 0 (0.0%) | 5 (3.8%) |
| 35 to 64 Years | 26 (8.1%) | 42 (11.4%) |
| 65 to 74 Years | 3 (6.7%) | 8 (11.4%) |
| 75 Years and over | 14 (20.9%) | 31 (24.6%) |
Disability Class: Self-Care Difficulty
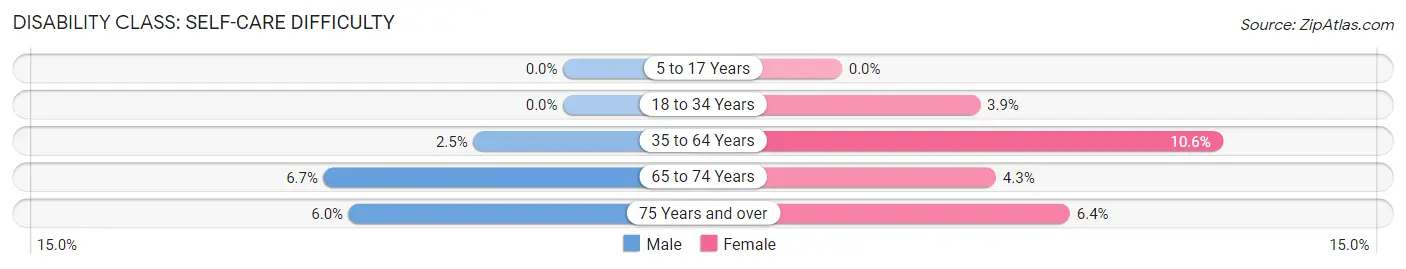
| Age Bracket | Male | Female |
| 5 to 17 Years | 0 (0.0%) | 0 (0.0%) |
| 18 to 34 Years | 0 (0.0%) | 5 (3.8%) |
| 35 to 64 Years | 8 (2.5%) | 39 (10.6%) |
| 65 to 74 Years | 3 (6.7%) | 3 (4.3%) |
| 75 Years and over | 4 (6.0%) | 8 (6.4%) |
Technology Access in Ackley
Computing Device Access in Ackley
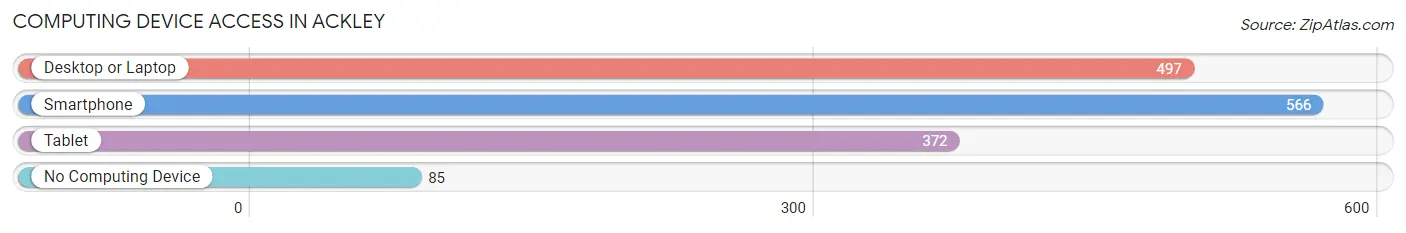
| Device Type | # Households | % Households |
| Desktop or Laptop | 497 | 71.4% |
| Smartphone | 566 | 81.3% |
| Tablet | 372 | 53.4% |
| No Computing Device | 85 | 12.2% |
| Total | 696 | 100.0% |
Internet Access in Ackley
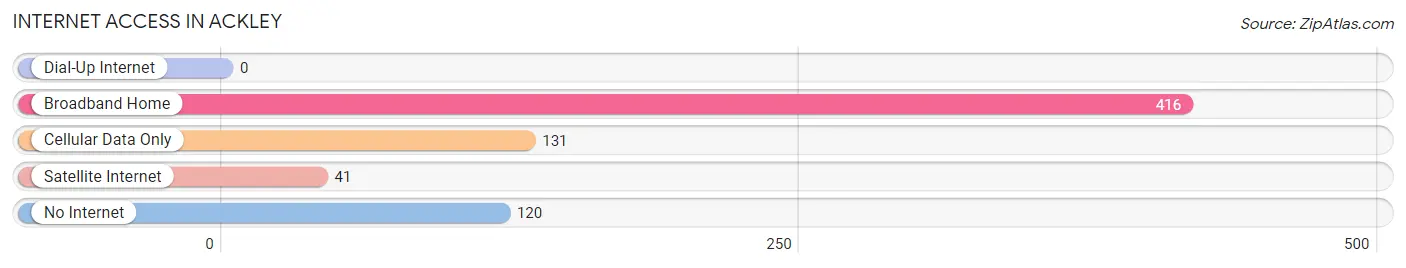
| Internet Type | # Households | % Households |
| Dial-Up Internet | 0 | 0.0% |
| Broadband Home | 416 | 59.8% |
| Cellular Data Only | 131 | 18.8% |
| Satellite Internet | 41 | 5.9% |
| No Internet | 120 | 17.2% |
| Total | 696 | 100.0% |
Ackley Summary
Ackley, Iowa is a small city located in Hardin County in the state of Iowa. It is situated on the banks of the Shell Rock River, approximately 30 miles northeast of the state capital of Des Moines. The city has a population of 1,845 people, according to the 2010 census.
History
Ackley was founded in 1856 by a group of settlers from Pennsylvania. The city was named after a local Native American chief, Chief Ackley. The first settlers were primarily of German and Dutch descent. The city was incorporated in 1881.
In the late 19th century, Ackley was a thriving agricultural community. The city was home to several grain elevators, a creamery, a flour mill, and a sawmill. The city also had a large number of churches, including the First Presbyterian Church, which was founded in 1867.
In the early 20th century, Ackley experienced a period of growth and prosperity. The city was home to several businesses, including a bank, a hotel, a movie theater, and a variety of stores. The city also had a public library, which was established in 1910.
Geography
Ackley is located in Hardin County in the state of Iowa. The city is situated on the banks of the Shell Rock River, approximately 30 miles northeast of the state capital of Des Moines. The city has a total area of 1.2 square miles, all of which is land.
The city has a humid continental climate, with hot summers and cold winters. The average temperature in the summer is around 75 degrees Fahrenheit, while the average temperature in the winter is around 25 degrees Fahrenheit.
Economy
Ackley’s economy is primarily based on agriculture. The city is home to several grain elevators, a creamery, a flour mill, and a sawmill. The city also has a variety of small businesses, including restaurants, retail stores, and service providers.
The city is also home to several manufacturing companies, including a furniture manufacturer, a plastics manufacturer, and a metal fabrication company. The city is also home to a variety of healthcare providers, including a hospital, a nursing home, and several medical clinics.
Demographics
According to the 2010 census, Ackley has a population of 1,845 people. The city has a median household income of $41,944 and a median age of 40.7 years. The city is predominantly white, with 92.3% of the population identifying as white. The city also has a small Hispanic population, with 4.2% of the population identifying as Hispanic or Latino.
The city has a high rate of homeownership, with 73.3% of the population owning their own homes. The city also has a high rate of educational attainment, with 92.3% of the population having at least a high school diploma.
Conclusion
Ackley, Iowa is a small city located in Hardin County in the state of Iowa. The city has a population of 1,845 people, according to the 2010 census. The city has a predominantly white population, with 92.3% of the population identifying as white. The city’s economy is primarily based on agriculture, with several grain elevators, a creamery, a flour mill, and a sawmill. The city also has a variety of small businesses, including restaurants, retail stores, and service providers. The city has a high rate of homeownership, with 73.3% of the population owning their own homes. Ackley is a thriving city with a rich history and a bright future.
Common Questions
What is Per Capita Income in Ackley?
Per Capita income in Ackley is $33,793.
What is the Median Family Income in Ackley?
Median Family Income in Ackley is $85,625.
What is the Median Household income in Ackley?
Median Household Income in Ackley is $60,577.
What is Income or Wage Gap in Ackley?
Income or Wage Gap in Ackley is 31.3%.
Women in Ackley earn 68.7 cents for every dollar earned by a man.
What is Inequality or Gini Index in Ackley?
Inequality or Gini Index in Ackley is 0.47.
What is the Total Population of Ackley?
Total Population of Ackley is 1,699.
What is the Total Male Population of Ackley?
Total Male Population of Ackley is 771.
What is the Total Female Population of Ackley?
Total Female Population of Ackley is 928.
What is the Ratio of Males per 100 Females in Ackley?
There are 83.08 Males per 100 Females in Ackley.
What is the Ratio of Females per 100 Males in Ackley?
There are 120.36 Females per 100 Males in Ackley.
What is the Median Population Age in Ackley?
Median Population Age in Ackley is 42.6 Years.
What is the Average Family Size in Ackley
Average Family Size in Ackley is 3.1 People.
What is the Average Household Size in Ackley
Average Household Size in Ackley is 2.4 People.
How Large is the Labor Force in Ackley?
There are 804 People in the Labor Forcein in Ackley.
What is the Percentage of People in the Labor Force in Ackley?
57.5% of People are in the Labor Force in Ackley.
What is the Unemployment Rate in Ackley?
Unemployment Rate in Ackley is 2.9%.