Zip Codes with the Highest Percentage of Population Employed in Food Preparation & Serving in Storrs Mansfield, CT
RELATED REPORTS & OPTIONS
Food Preparation & Serving
Storrs Mansfield
Compare Zip Codes
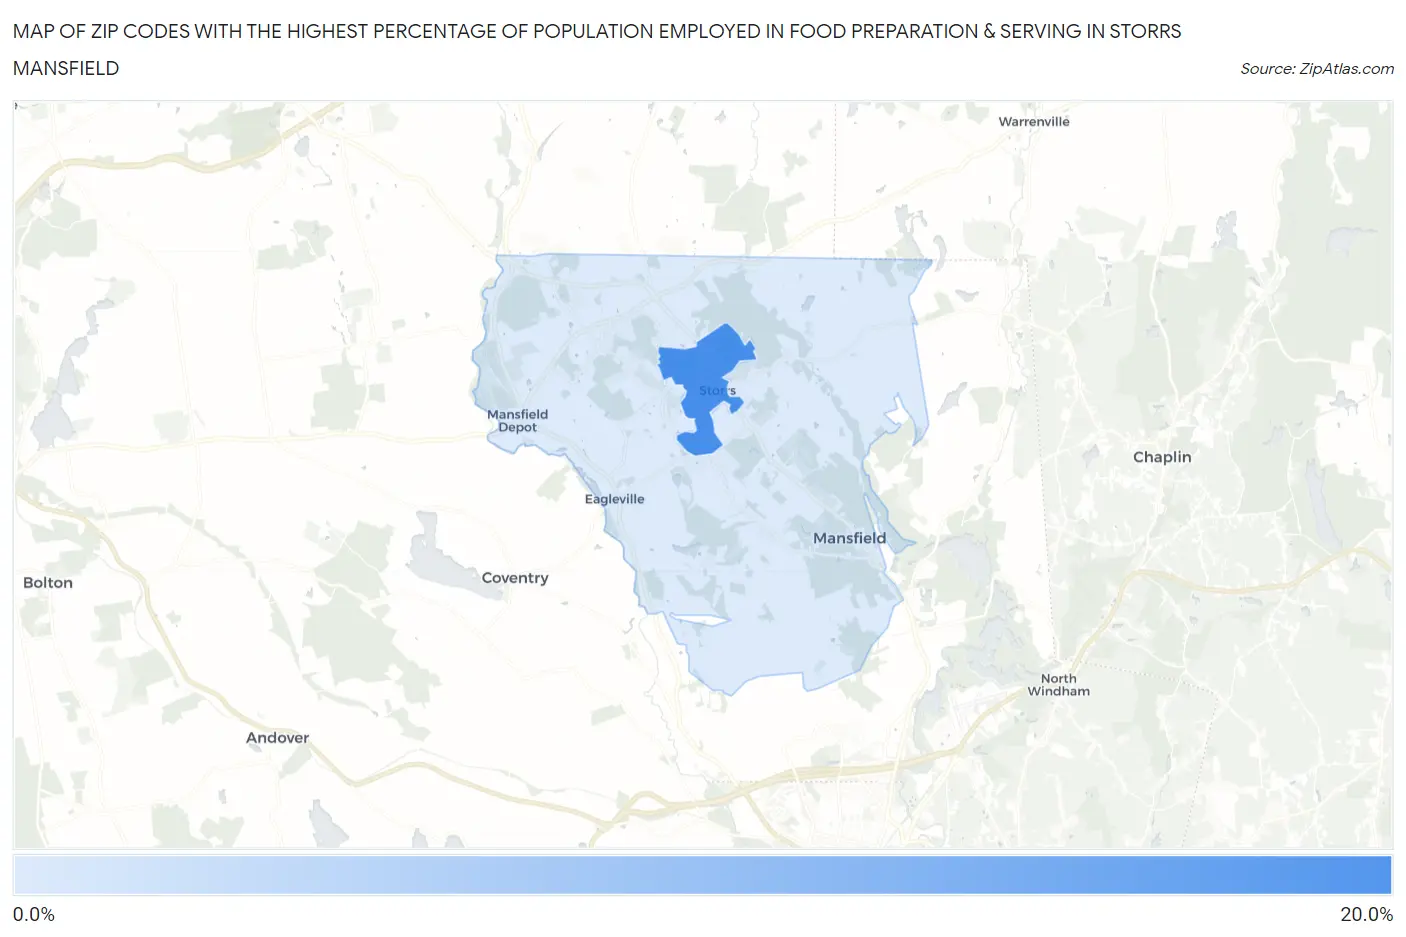
Map of Zip Codes with the Highest Percentage of Population Employed in Food Preparation & Serving in Storrs Mansfield
7.1%
17.0%
Zip Codes with the Highest Percentage of Population Employed in Food Preparation & Serving in Storrs Mansfield, CT
| Zip Code | % Employed | vs State | vs National | |
| 1. | 06269 | 17.0% | 4.7%(+12.3)#5 | 5.3%(+11.7)#748 |
| 2. | 06268 | 7.1% | 4.7%(+2.44)#41 | 5.3%(+1.84)#6,292 |
1
Common Questions
What are the Top Zip Codes with the Highest Percentage of Population Employed in Food Preparation & Serving in Storrs Mansfield, CT?
Top Zip Codes with the Highest Percentage of Population Employed in Food Preparation & Serving in Storrs Mansfield, CT are:
What zip code has the Highest Percentage of Population Employed in Food Preparation & Serving in Storrs Mansfield, CT?
06269 has the Highest Percentage of Population Employed in Food Preparation & Serving in Storrs Mansfield, CT with 17.0%.
What is the Percentage of Population Employed in Food Preparation & Serving in Connecticut?
Percentage of Population Employed in Food Preparation & Serving in Connecticut is 4.7%.
What is the Percentage of Population Employed in Food Preparation & Serving in the United States?
Percentage of Population Employed in Food Preparation & Serving in the United States is 5.3%.