Zip Codes with the Highest Percentage of Population Employed in Arts, Entertainment & Recreation in Colorado
RELATED REPORTS & OPTIONS
Arts, Entertainment & Recreation
Colorado
Compare Zip Codes
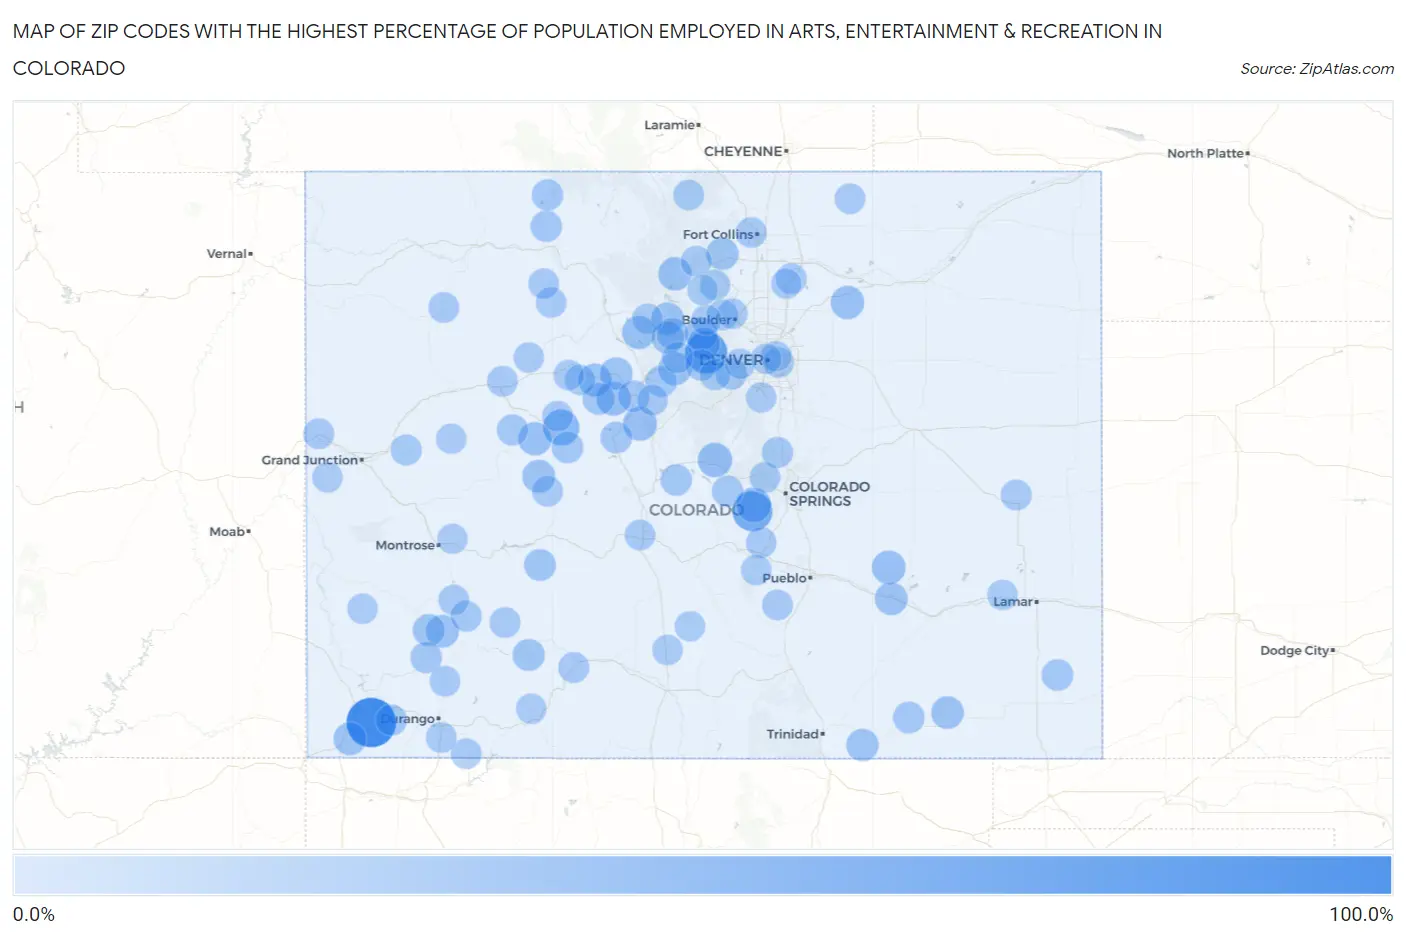
Map of Zip Codes with the Highest Percentage of Population Employed in Arts, Entertainment & Recreation in Colorado
0.0%
100.0%
Zip Codes with the Highest Percentage of Population Employed in Arts, Entertainment & Recreation in Colorado
| Zip Code | % Employed | vs State | vs National | |
| 1. | 81330 | 84.7% | 2.6%(+82.1)#1 | 2.1%(+82.6)#14 |
| 2. | 80427 | 53.2% | 2.6%(+50.6)#2 | 2.1%(+51.1)#28 |
| 3. | 80860 | 43.5% | 2.6%(+40.9)#3 | 2.1%(+41.4)#46 |
| 4. | 81656 | 27.8% | 2.6%(+25.2)#4 | 2.1%(+25.7)#95 |
| 5. | 80813 | 21.9% | 2.6%(+19.3)#5 | 2.1%(+19.8)#150 |
| 6. | 80827 | 20.4% | 2.6%(+17.9)#6 | 2.1%(+18.3)#174 |
| 7. | 80420 | 19.0% | 2.6%(+16.4)#7 | 2.1%(+16.9)#209 |
| 8. | 81649 | 18.7% | 2.6%(+16.1)#8 | 2.1%(+16.6)#214 |
| 9. | 81062 | 17.4% | 2.6%(+14.8)#9 | 2.1%(+15.3)#240 |
| 10. | 80652 | 16.7% | 2.6%(+14.1)#10 | 2.1%(+14.6)#263 |
| 11. | 81654 | 16.6% | 2.6%(+14.0)#11 | 2.1%(+14.5)#269 |
| 12. | 80447 | 16.3% | 2.6%(+13.8)#12 | 2.1%(+14.3)#276 |
| 13. | 80468 | 16.0% | 2.6%(+13.4)#13 | 2.1%(+13.9)#295 |
| 14. | 80476 | 15.5% | 2.6%(+13.0)#14 | 2.1%(+13.5)#314 |
| 15. | 81620 | 14.6% | 2.6%(+12.0)#15 | 2.1%(+12.5)#357 |
| 16. | 81426 | 14.3% | 2.6%(+11.7)#16 | 2.1%(+12.2)#372 |
| 17. | 81225 | 14.3% | 2.6%(+11.7)#17 | 2.1%(+12.2)#373 |
| 18. | 81058 | 14.1% | 2.6%(+11.6)#18 | 2.1%(+12.0)#379 |
| 19. | 81334 | 14.0% | 2.6%(+11.4)#19 | 2.1%(+11.9)#387 |
| 20. | 81657 | 13.8% | 2.6%(+11.3)#20 | 2.1%(+11.8)#400 |
| 21. | 81049 | 13.2% | 2.6%(+10.7)#21 | 2.1%(+11.2)#435 |
| 22. | 80478 | 13.2% | 2.6%(+10.6)#22 | 2.1%(+11.1)#438 |
| 23. | 80474 | 13.1% | 2.6%(+10.6)#23 | 2.1%(+11.0)#442 |
| 24. | 80422 | 13.0% | 2.6%(+10.4)#24 | 2.1%(+10.9)#451 |
| 25. | 81081 | 12.2% | 2.6%(+9.59)#25 | 2.1%(+10.1)#494 |
| 26. | 80442 | 12.1% | 2.6%(+9.53)#26 | 2.1%(+10.0)#500 |
| 27. | 80515 | 11.7% | 2.6%(+9.15)#27 | 2.1%(+9.64)#535 |
| 28. | 81645 | 11.0% | 2.6%(+8.47)#28 | 2.1%(+8.96)#598 |
| 29. | 81130 | 10.7% | 2.6%(+8.08)#29 | 2.1%(+8.57)#628 |
| 30. | 81435 | 10.5% | 2.6%(+7.94)#30 | 2.1%(+8.43)#649 |
| 31. | 81230 | 9.6% | 2.6%(+7.03)#31 | 2.1%(+7.52)#766 |
| 32. | 80482 | 9.6% | 2.6%(+7.02)#32 | 2.1%(+7.50)#768 |
| 33. | 81027 | 9.4% | 2.6%(+6.86)#33 | 2.1%(+7.35)#786 |
| 34. | 80461 | 9.4% | 2.6%(+6.86)#34 | 2.1%(+7.35)#787 |
| 35. | 81084 | 9.1% | 2.6%(+6.52)#35 | 2.1%(+7.01)#840 |
| 36. | 81611 | 9.1% | 2.6%(+6.51)#36 | 2.1%(+7.00)#841 |
| 37. | 80449 | 9.0% | 2.6%(+6.40)#37 | 2.1%(+6.89)#860 |
| 38. | 81332 | 8.9% | 2.6%(+6.29)#38 | 2.1%(+6.77)#875 |
| 39. | 80443 | 8.8% | 2.6%(+6.26)#39 | 2.1%(+6.75)#881 |
| 40. | 80457 | 8.8% | 2.6%(+6.20)#40 | 2.1%(+6.69)#896 |
| 41. | 80435 | 8.5% | 2.6%(+5.88)#41 | 2.1%(+6.37)#953 |
| 42. | 80487 | 8.1% | 2.6%(+5.58)#42 | 2.1%(+6.06)#1,019 |
| 43. | 81328 | 8.0% | 2.6%(+5.44)#43 | 2.1%(+5.93)#1,054 |
| 44. | 80428 | 8.0% | 2.6%(+5.41)#44 | 2.1%(+5.90)#1,063 |
| 45. | 80452 | 7.8% | 2.6%(+5.22)#45 | 2.1%(+5.71)#1,110 |
| 46. | 80816 | 7.6% | 2.6%(+5.00)#46 | 2.1%(+5.49)#1,163 |
| 47. | 80133 | 7.2% | 2.6%(+4.65)#47 | 2.1%(+5.14)#1,256 |
| 48. | 81623 | 7.1% | 2.6%(+4.55)#48 | 2.1%(+5.04)#1,296 |
| 49. | 80438 | 7.1% | 2.6%(+4.54)#49 | 2.1%(+5.03)#1,299 |
| 50. | 81427 | 6.7% | 2.6%(+4.12)#50 | 2.1%(+4.61)#1,421 |
| 51. | 81643 | 6.6% | 2.6%(+3.98)#51 | 2.1%(+4.47)#1,472 |
| 52. | 81154 | 6.2% | 2.6%(+3.61)#52 | 2.1%(+4.10)#1,630 |
| 53. | 80302 | 6.0% | 2.6%(+3.41)#53 | 2.1%(+3.90)#1,708 |
| 54. | 80517 | 6.0% | 2.6%(+3.40)#54 | 2.1%(+3.89)#1,715 |
| 55. | 81224 | 6.0% | 2.6%(+3.39)#55 | 2.1%(+3.88)#1,721 |
| 56. | 80825 | 5.9% | 2.6%(+3.37)#56 | 2.1%(+3.86)#1,729 |
| 57. | 81235 | 5.7% | 2.6%(+3.17)#57 | 2.1%(+3.66)#1,827 |
| 58. | 81525 | 5.7% | 2.6%(+3.09)#58 | 2.1%(+3.58)#1,876 |
| 59. | 81023 | 5.7% | 2.6%(+3.08)#59 | 2.1%(+3.57)#1,885 |
| 60. | 80521 | 5.6% | 2.6%(+3.03)#60 | 2.1%(+3.52)#1,908 |
| 61. | 81641 | 5.6% | 2.6%(+3.03)#61 | 2.1%(+3.51)#1,911 |
| 62. | 80424 | 5.5% | 2.6%(+2.96)#62 | 2.1%(+3.45)#1,949 |
| 63. | 80819 | 5.5% | 2.6%(+2.96)#63 | 2.1%(+3.45)#1,950 |
| 64. | 80623 | 5.4% | 2.6%(+2.82)#64 | 2.1%(+3.31)#2,024 |
| 65. | 81601 | 5.4% | 2.6%(+2.81)#65 | 2.1%(+3.30)#2,030 |
| 66. | 81137 | 5.3% | 2.6%(+2.72)#66 | 2.1%(+3.21)#2,085 |
| 67. | 81621 | 5.1% | 2.6%(+2.53)#67 | 2.1%(+3.02)#2,209 |
| 68. | 81303 | 5.0% | 2.6%(+2.44)#68 | 2.1%(+2.93)#2,277 |
| 69. | 80729 | 5.0% | 2.6%(+2.40)#69 | 2.1%(+2.89)#2,304 |
| 70. | 80545 | 5.0% | 2.6%(+2.40)#70 | 2.1%(+2.89)#2,312 |
| 71. | 80483 | 4.9% | 2.6%(+2.37)#71 | 2.1%(+2.86)#2,328 |
| 72. | 81201 | 4.9% | 2.6%(+2.36)#72 | 2.1%(+2.84)#2,338 |
| 73. | 80467 | 4.9% | 2.6%(+2.31)#73 | 2.1%(+2.80)#2,376 |
| 74. | 80230 | 4.9% | 2.6%(+2.29)#74 | 2.1%(+2.78)#2,389 |
| 75. | 80451 | 4.7% | 2.6%(+2.16)#75 | 2.1%(+2.65)#2,502 |
| 76. | 81301 | 4.7% | 2.6%(+2.14)#76 | 2.1%(+2.63)#2,520 |
| 77. | 81432 | 4.7% | 2.6%(+2.11)#77 | 2.1%(+2.60)#2,545 |
| 78. | 81240 | 4.6% | 2.6%(+2.07)#78 | 2.1%(+2.56)#2,590 |
| 79. | 80304 | 4.5% | 2.6%(+1.95)#79 | 2.1%(+2.44)#2,716 |
| 80. | 81632 | 4.3% | 2.6%(+1.73)#80 | 2.1%(+2.21)#2,971 |
| 81. | 81136 | 4.2% | 2.6%(+1.67)#81 | 2.1%(+2.16)#3,022 |
| 82. | 81624 | 4.2% | 2.6%(+1.61)#82 | 2.1%(+2.10)#3,108 |
| 83. | 81147 | 4.2% | 2.6%(+1.61)#83 | 2.1%(+2.09)#3,110 |
| 84. | 80540 | 4.2% | 2.6%(+1.61)#84 | 2.1%(+2.09)#3,111 |
| 85. | 81226 | 4.1% | 2.6%(+1.58)#85 | 2.1%(+2.06)#3,151 |
| 86. | 81637 | 4.1% | 2.6%(+1.56)#86 | 2.1%(+2.05)#3,170 |
| 87. | 81631 | 4.1% | 2.6%(+1.53)#87 | 2.1%(+2.02)#3,197 |
| 88. | 81523 | 4.1% | 2.6%(+1.52)#88 | 2.1%(+2.00)#3,211 |
| 89. | 80439 | 4.1% | 2.6%(+1.52)#89 | 2.1%(+2.00)#3,212 |
| 90. | 81423 | 4.1% | 2.6%(+1.49)#90 | 2.1%(+1.98)#3,244 |
| 91. | 80207 | 4.1% | 2.6%(+1.49)#91 | 2.1%(+1.98)#3,257 |
| 92. | 80466 | 4.0% | 2.6%(+1.45)#92 | 2.1%(+1.94)#3,303 |
| 93. | 80125 | 4.0% | 2.6%(+1.40)#93 | 2.1%(+1.89)#3,376 |
| 94. | 80401 | 3.9% | 2.6%(+1.36)#94 | 2.1%(+1.85)#3,426 |
| 95. | 80510 | 3.9% | 2.6%(+1.34)#95 | 2.1%(+1.83)#3,458 |
| 96. | 81057 | 3.9% | 2.6%(+1.34)#96 | 2.1%(+1.82)#3,474 |
| 97. | 81401 | 3.9% | 2.6%(+1.31)#97 | 2.1%(+1.79)#3,514 |
| 98. | 81131 | 3.8% | 2.6%(+1.26)#98 | 2.1%(+1.75)#3,576 |
| 99. | 80651 | 3.8% | 2.6%(+1.24)#99 | 2.1%(+1.73)#3,607 |
| 100. | 80202 | 3.8% | 2.6%(+1.23)#100 | 2.1%(+1.72)#3,625 |
Common Questions
What are the Top 10 Zip Codes with the Highest Percentage of Population Employed in Arts, Entertainment & Recreation in Colorado?
Top 10 Zip Codes with the Highest Percentage of Population Employed in Arts, Entertainment & Recreation in Colorado are:
What zip code has the Highest Percentage of Population Employed in Arts, Entertainment & Recreation in Colorado?
81330 has the Highest Percentage of Population Employed in Arts, Entertainment & Recreation in Colorado with 84.7%.
What is the Percentage of Population Employed in Arts, Entertainment & Recreation in the State of Colorado?
Percentage of Population Employed in Arts, Entertainment & Recreation in Colorado is 2.6%.
What is the Percentage of Population Employed in Arts, Entertainment & Recreation in the United States?
Percentage of Population Employed in Arts, Entertainment & Recreation in the United States is 2.1%.