Zip Codes with the Highest Percentage of Population Employed in Community & Social Service in Arvada, CO

RELATED REPORTS & OPTIONS

Community & Social Service
Population
Families and Households
Female Fertility
Female Fertility (Unmarried)
Race (Community Size)
Race (Percentage)
Ancestry (Community Size)
AfricanAmericanApacheArabArgentineanArmenianAustralianAustrianBangladeshiBasqueBelgianBhutaneseBrazilianBritishBulgarianBurmeseCanadianCelticCentral AmericanCentral American IndianCherokeeCheyenneChileanChippewaChoctawColombianCreekCroatianCubanCzechCzechoslovakianDanishDominicanDutchEastern EuropeanEcuadorianEgyptianEnglishEstonianEthiopianEuropeanFilipinoFinnishFrenchFrench CanadianGermanGreekGuamanian / ChamorroGuatemalanHungarianIcelanderIndian (Asian)IranianIrishItalianJamaicanJordanianKoreanLatvianLebaneseLithuanianMalaysianMexicanMexican American IndianNative HawaiianNavajoNew ZealanderNorthern EuropeanNorwegianOsagePakistaniPennsylvania GermanPeruvianPolishPortuguesePuebloPuerto RicanRomanianRussianScandinavianScotch-IrishScottishSerbianSiouxSlavicSlovakSloveneSouth AfricanSouth AmericanSpaniardSpanishSpanish AmericanSri LankanSubsaharan AfricanSwedishSwissSyrianThaiTurkishUkrainianWelshYugoslavian
Ancestry (Percentage)
AfricanAmericanApacheArabArgentineanArmenianAustralianAustrianBangladeshiBasqueBelgianBhutaneseBrazilianBritishBulgarianBurmeseCanadianCelticCentral AmericanCentral American IndianCherokeeCheyenneChileanChippewaChoctawColombianCreekCroatianCubanCzechCzechoslovakianDanishDominicanDutchEastern EuropeanEcuadorianEgyptianEnglishEstonianEthiopianEuropeanFilipinoFinnishFrenchFrench CanadianGermanGreekGuamanian / ChamorroGuatemalanHungarianIcelanderIndian (Asian)IranianIrishItalianJamaicanJordanianKoreanLatvianLebaneseLithuanianMalaysianMexicanMexican American IndianNative HawaiianNavajoNew ZealanderNorthern EuropeanNorwegianOsagePakistaniPennsylvania GermanPeruvianPolishPortuguesePuebloPuerto RicanRomanianRussianScandinavianScotch-IrishScottishSerbianSiouxSlavicSlovakSloveneSouth AfricanSouth AmericanSpaniardSpanishSpanish AmericanSri LankanSubsaharan AfricanSwedishSwissSyrianThaiTurkishUkrainianWelshYugoslavian
Immigrant Origin (Total)
Immigrant Origin (Percentage)
Income
Income (Families)
Income (Households)
Poverty
Poverty (Families)
Unemployment
Employment Occupations
Employment Industries
Employer Class
Commute Time
Commute Means
School Enrollment
Education by Degree Field
Occupancy
Finances
Physical Characteristics
Arvada
Compare Zip Codes
Comparison Subject

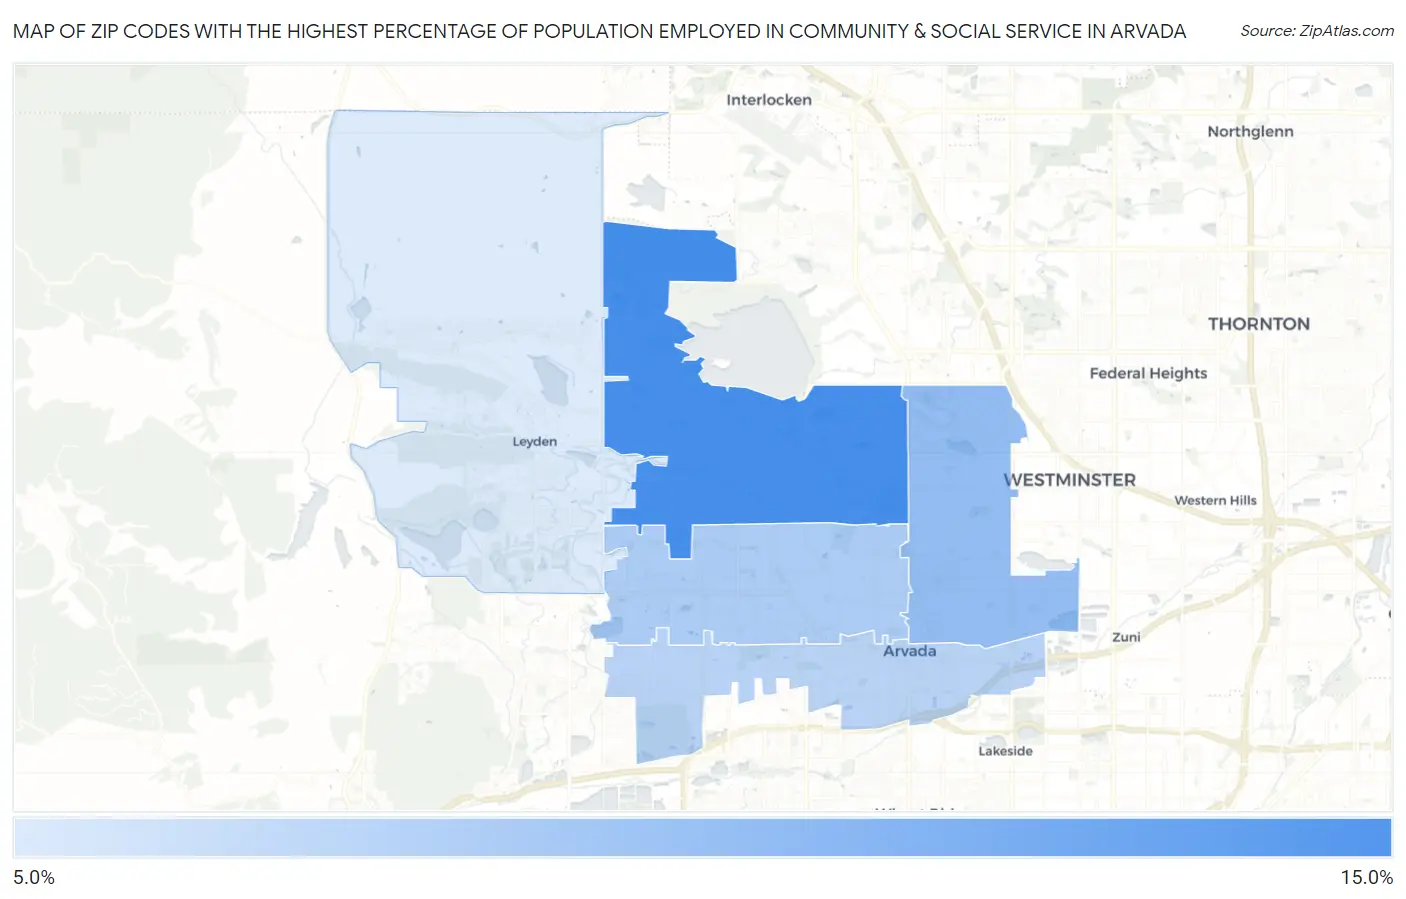
Map of Zip Codes with the Highest Percentage of Population Employed in Community & Social Service in Arvada

0.0%
15.0%
Zip Codes with the Highest Percentage of Population Employed in Community & Social Service  in Arvada Map

Zip Codes with the Highest Percentage of Population Employed in Community & Social Service in Arvada, CO

Zip Code % Employed vs State vs National
1.8000511.6%11.2%(+0.398)#18611.2%(+0.424)#10,141
2.800039.9%11.2%(-1.35)#25811.2%(-1.33)#14,435
3.800049.3%11.2%(-1.90)#28111.2%(-1.87)#15,850
4.800029.1%11.2%(-2.19)#28911.2%(-2.16)#16,679
5.800078.3%11.2%(-2.98)#32911.2%(-2.96)#18,869

Common Questions

What are the Top 3 Zip Codes with the Highest Percentage of Population Employed in Community & Social Service in Arvada, CO?
Top 3 Zip Codes with the Highest Percentage of Population Employed in Community & Social Service in Arvada, CO are:
#1
11.6%
#2
9.9%
#3
9.3%
What zip code has the Highest Percentage of Population Employed in Community & Social Service in Arvada, CO?
80005 has the Highest Percentage of Population Employed in Community & Social Service in Arvada, CO with 11.6%.
What is the Percentage of Population Employed in Community & Social Service in Arvada, CO?
Percentage of Population Employed in Community & Social Service in Arvada is 10.1%.
What is the Percentage of Population Employed in Community & Social Service in Colorado?
Percentage of Population Employed in Community & Social Service in Colorado is 11.2%.
What is the Percentage of Population Employed in Community & Social Service in the United States?
Percentage of Population Employed in Community & Social Service in the United States is 11.2%.