Zip Codes with the Highest Percentage of Population Employed in Life, Physical & Social Science in Boulder, CO

RELATED REPORTS & OPTIONS

Life, Physical & Social Science
Population
Families and Households
Female Fertility
Female Fertility (Unmarried)
Race (Community Size)
Race (Percentage)
Ancestry (Community Size)
AfghanAfricanAlbanianAmericanApacheArabArgentineanArmenianAustralianAustrianBasqueBelgianBhutaneseBolivianBrazilianBritishBulgarianBurmeseCajunCanadianCelticCentral AmericanCherokeeChickasawChileanChippewaChoctawColombianCreekCroatianCubanCzechCzechoslovakianDanishDominicanDutchEastern EuropeanEcuadorianEgyptianEnglishEstonianEthiopianEuropeanFilipinoFinnishFrenchFrench CanadianGermanGerman RussianGhanaianGreekGuatemalanHaitianHonduranHungarianIcelanderIndian (Asian)IranianIraqiIrishIroquoisIsraeliItalianJamaicanJapaneseKoreanLaotianLatvianLebaneseLithuanianLuxembourgerMacedonianMalaysianMexicanMexican American IndianMongolianNative HawaiianNavajoNicaraguanNigerianNorthern EuropeanNorwegianPakistaniPanamanianParaguayanPennsylvania GermanPeruvianPolishPortuguesePuerto RicanRomanianRussianSalvadoranScandinavianScotch-IrishScottishSerbianSiouxSlavicSlovakSloveneSouth AfricanSouth AmericanSpaniardSpanishSri LankanSubsaharan AfricanSwedishSwissThaiTurkishUkrainianVenezuelanVietnameseWelshYugoslavian
Ancestry (Percentage)
AfghanAfricanAlbanianAmericanApacheArabArgentineanArmenianAustralianAustrianBasqueBelgianBhutaneseBolivianBrazilianBritishBulgarianBurmeseCajunCanadianCelticCentral AmericanCherokeeChickasawChileanChippewaChoctawColombianCreekCroatianCubanCzechCzechoslovakianDanishDominicanDutchEastern EuropeanEcuadorianEgyptianEnglishEstonianEthiopianEuropeanFilipinoFinnishFrenchFrench CanadianGermanGerman RussianGhanaianGreekGuatemalanHaitianHonduranHungarianIcelanderIndian (Asian)IranianIraqiIrishIroquoisIsraeliItalianJamaicanJapaneseKoreanLaotianLatvianLebaneseLithuanianLuxembourgerMacedonianMalaysianMexicanMexican American IndianMongolianNative HawaiianNavajoNicaraguanNigerianNorthern EuropeanNorwegianPakistaniPanamanianParaguayanPennsylvania GermanPeruvianPolishPortuguesePuerto RicanRomanianRussianSalvadoranScandinavianScotch-IrishScottishSerbianSiouxSlavicSlovakSloveneSouth AfricanSouth AmericanSpaniardSpanishSri LankanSubsaharan AfricanSwedishSwissThaiTurkishUkrainianVenezuelanVietnameseWelshYugoslavian
Immigrant Origin (Total)
Immigrant Origin (Percentage)
Income
Income (Families)
Income (Households)
Poverty
Poverty (Families)
Unemployment
Employment Occupations
Employment Industries
Employer Class
Commute Time
Commute Means
School Enrollment
Education by Degree Field
Occupancy
Finances
Physical Characteristics
Boulder
Compare Zip Codes
Comparison Subject

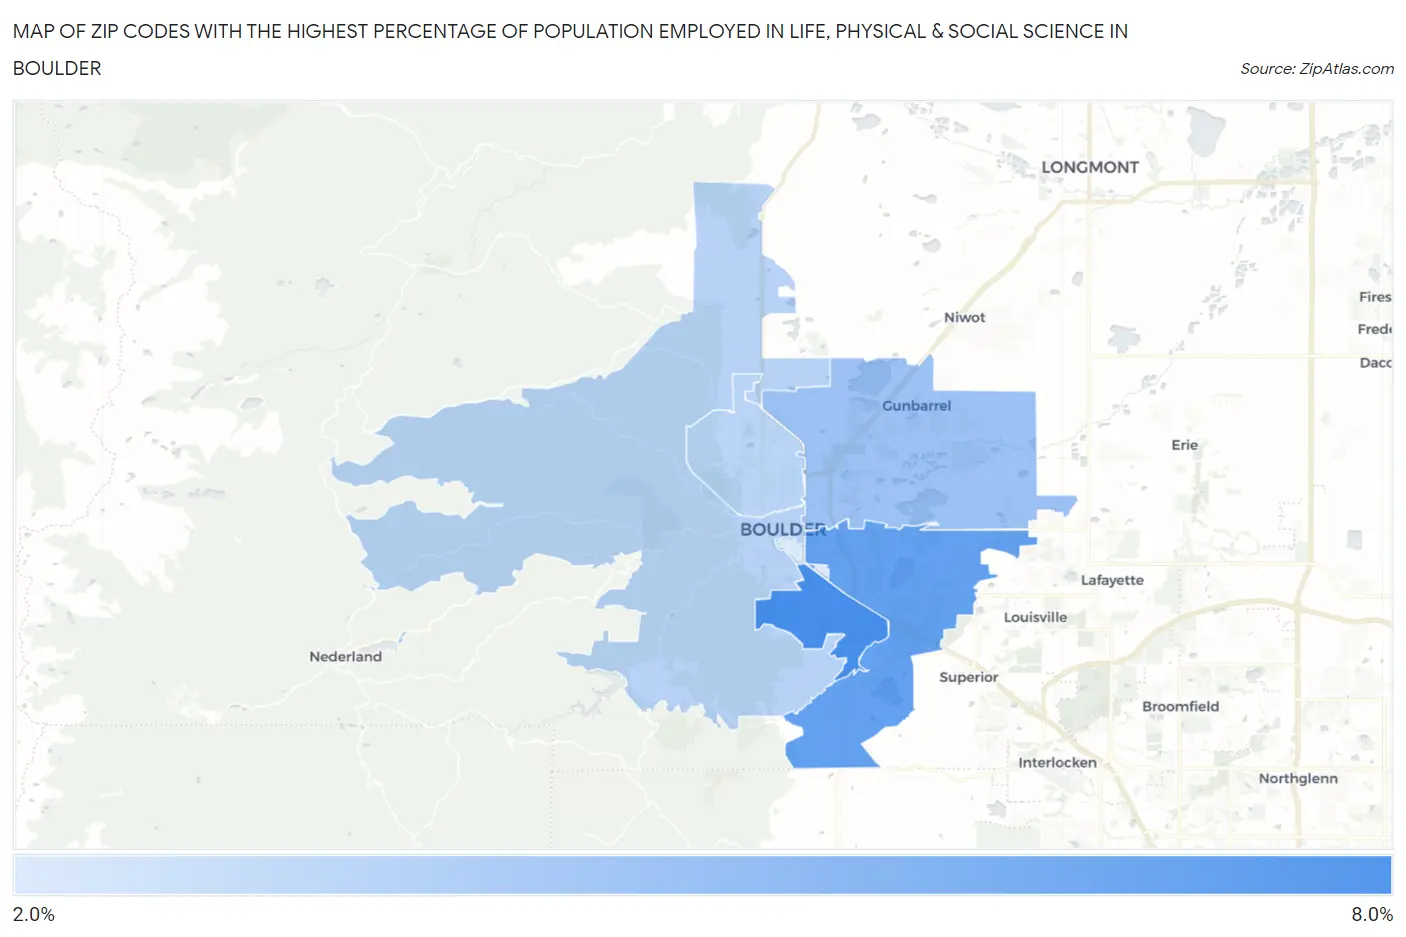
Map of Zip Codes with the Highest Percentage of Population Employed in Life, Physical & Social Science in Boulder

0.0%
8.0%
Zip Codes with the Highest Percentage of Population Employed in Life, Physical & Social Science in Boulder Map

Zip Codes with the Highest Percentage of Population Employed in Life, Physical & Social Science in Boulder, CO

Zip Code % Employed vs State vs National
1.803057.0%1.3%(+5.69)#141.1%(+5.92)#405
2.803036.2%1.3%(+4.92)#161.1%(+5.14)#514
3.803014.7%1.3%(+3.42)#261.1%(+3.65)#835
4.803024.0%1.3%(+2.66)#351.1%(+2.89)#1,165
5.803043.9%1.3%(+2.61)#371.1%(+2.84)#1,199
6.803103.0%1.3%(+1.67)#521.1%(+1.90)#1,891

Common Questions

What are the Top 5 Zip Codes with the Highest Percentage of Population Employed in Life, Physical & Social Science in Boulder, CO?
Top 5 Zip Codes with the Highest Percentage of Population Employed in Life, Physical & Social Science in Boulder, CO are:
#1
7.0%
#2
6.2%
#3
4.7%
#4
4.0%
#5
3.9%
What zip code has the Highest Percentage of Population Employed in Life, Physical & Social Science in Boulder, CO?
80305 has the Highest Percentage of Population Employed in Life, Physical & Social Science in Boulder, CO with 7.0%.
What is the Percentage of Population Employed in Life, Physical & Social Science in Boulder, CO?
Percentage of Population Employed in Life, Physical & Social Science in Boulder is 5.4%.
What is the Percentage of Population Employed in Life, Physical & Social Science in Colorado?
Percentage of Population Employed in Life, Physical & Social Science in Colorado is 1.3%.
What is the Percentage of Population Employed in Life, Physical & Social Science in the United States?
Percentage of Population Employed in Life, Physical & Social Science in the United States is 1.1%.