Twentynine Palms, CA Map & Demographics
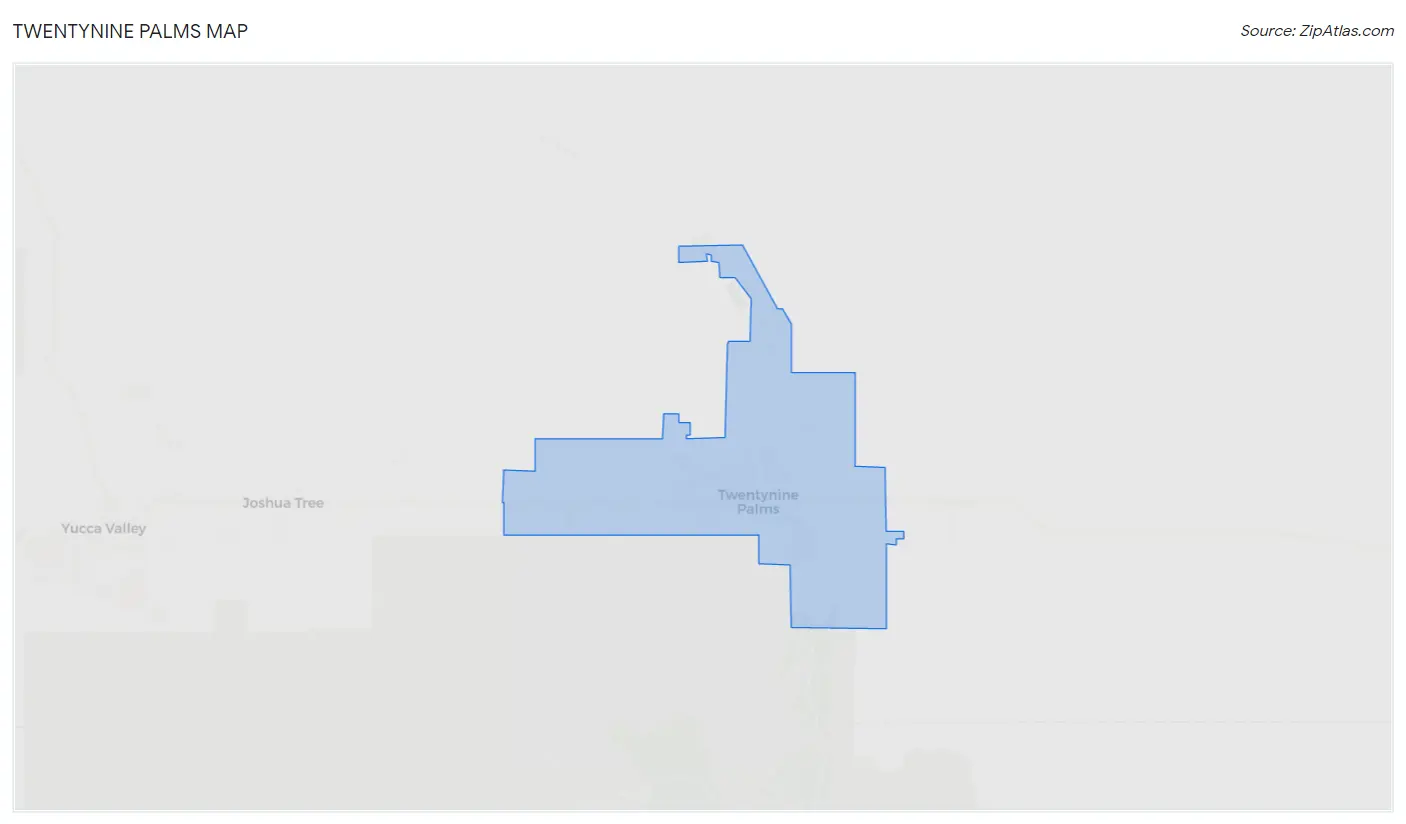
Twentynine Palms Map
Twentynine Palms Overview
$26,734
PER CAPITA INCOME
$53,211
AVG FAMILY INCOME
$51,392
AVG HOUSEHOLD INCOME
0.0%
WAGE / INCOME GAP [ % ]
100.0¢/ $1
WAGE / INCOME GAP [ $ ]
$10,470
FAMILY INCOME DEFICIT
0.42
INEQUALITY / GINI INDEX
28,006
TOTAL POPULATION
15,662
MALE POPULATION
12,344
FEMALE POPULATION
126.88
MALES / 100 FEMALES
78.81
FEMALES / 100 MALES
24.5
MEDIAN AGE
3.3
AVG FAMILY SIZE
2.6
AVG HOUSEHOLD SIZE
14,956
LABOR FORCE [ PEOPLE ]
70.9%
PERCENT IN LABOR FORCE
6.3%
UNEMPLOYMENT RATE
Twentynine Palms Area Codes
Income in Twentynine Palms
Income Overview in Twentynine Palms
Per Capita Income in Twentynine Palms is $26,734, while median incomes of families and households are $53,211 and $51,392 respectively.
| Characteristic | Number | Measure |
| Per Capita Income | 28,006 | $26,734 |
| Median Family Income | 6,117 | $53,211 |
| Mean Family Income | 6,117 | $73,266 |
| Median Household Income | 9,290 | $51,392 |
| Mean Household Income | 9,290 | $69,749 |
| Income Deficit | 6,117 | $10,470 |
| Wage / Income Gap (%) | 28,006 | 0.04% |
| Wage / Income Gap ($) | 28,006 | 99.96¢ per $1 |
| Gini / Inequality Index | 28,006 | 0.42 |
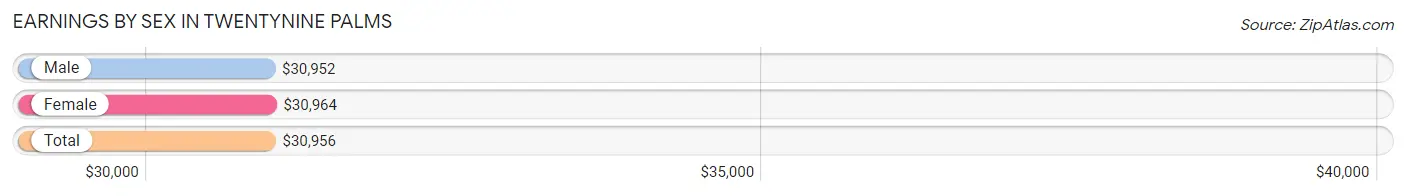
Earnings by Sex in Twentynine Palms
Average Earnings in Twentynine Palms are $30,956, $30,952 for men and $30,964 for women, a difference of 0.0%.
| Sex | Number | Average Earnings |
| Male | 10,242 (66.8%) | $30,952 |
| Female | 5,078 (33.2%) | $30,964 |
| Total | 15,320 (100.0%) | $30,956 |
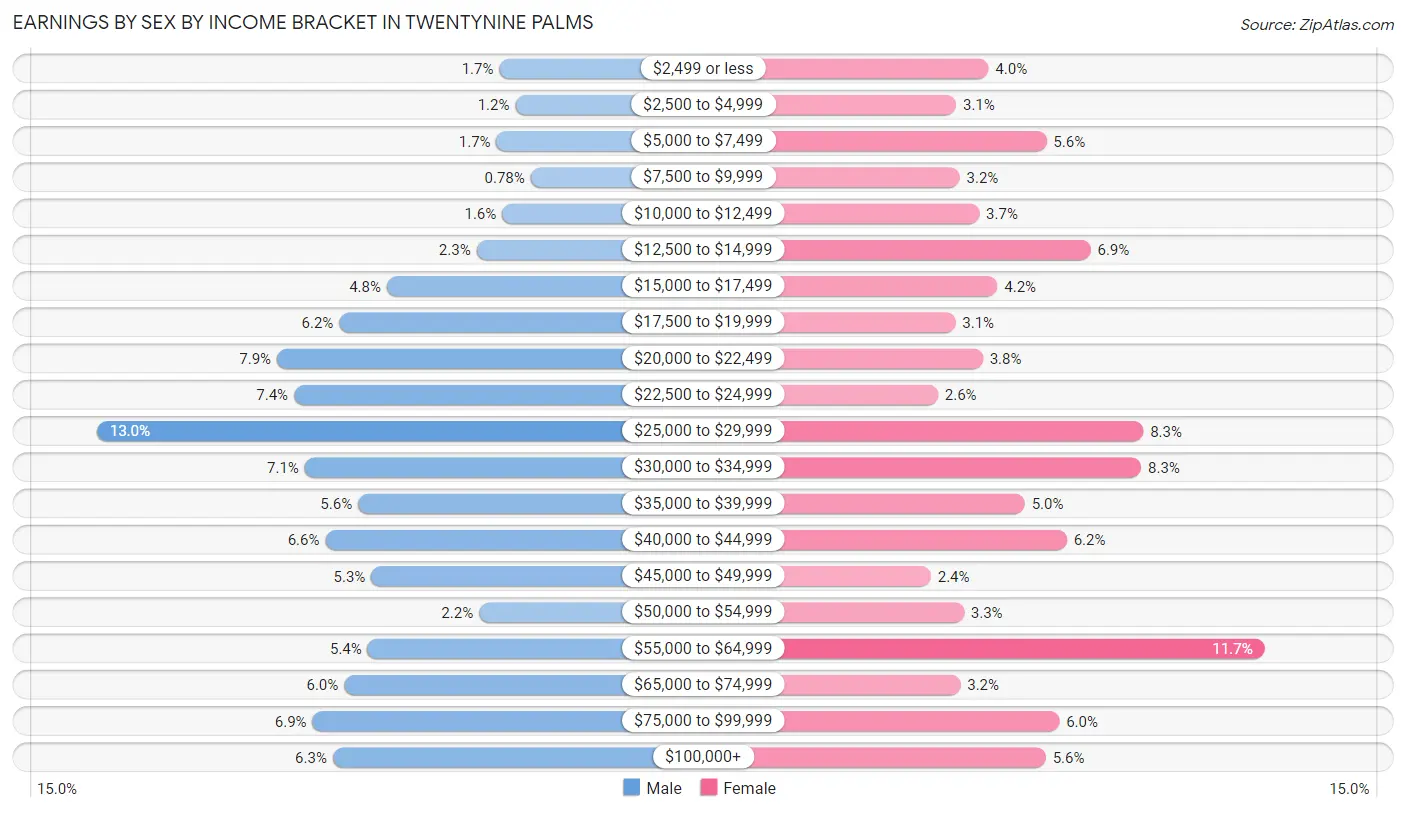
Earnings by Sex by Income Bracket in Twentynine Palms
The most common earnings brackets in Twentynine Palms are $25,000 to $29,999 for men (1,328 | 13.0%) and $55,000 to $64,999 for women (596 | 11.7%).
| Income | Male | Female |
| $2,499 or less | 170 (1.7%) | 202 (4.0%) |
| $2,500 to $4,999 | 124 (1.2%) | 156 (3.1%) |
| $5,000 to $7,499 | 178 (1.7%) | 285 (5.6%) |
| $7,500 to $9,999 | 80 (0.8%) | 161 (3.2%) |
| $10,000 to $12,499 | 162 (1.6%) | 189 (3.7%) |
| $12,500 to $14,999 | 236 (2.3%) | 348 (6.9%) |
| $15,000 to $17,499 | 494 (4.8%) | 215 (4.2%) |
| $17,500 to $19,999 | 631 (6.2%) | 155 (3.0%) |
| $20,000 to $22,499 | 810 (7.9%) | 194 (3.8%) |
| $22,500 to $24,999 | 761 (7.4%) | 130 (2.6%) |
| $25,000 to $29,999 | 1,328 (13.0%) | 423 (8.3%) |
| $30,000 to $34,999 | 730 (7.1%) | 420 (8.3%) |
| $35,000 to $39,999 | 577 (5.6%) | 254 (5.0%) |
| $40,000 to $44,999 | 671 (6.6%) | 314 (6.2%) |
| $45,000 to $49,999 | 539 (5.3%) | 120 (2.4%) |
| $50,000 to $54,999 | 228 (2.2%) | 167 (3.3%) |
| $55,000 to $64,999 | 549 (5.4%) | 596 (11.7%) |
| $65,000 to $74,999 | 617 (6.0%) | 162 (3.2%) |
| $75,000 to $99,999 | 708 (6.9%) | 303 (6.0%) |
| $100,000+ | 649 (6.3%) | 284 (5.6%) |
| Total | 10,242 (100.0%) | 5,078 (100.0%) |
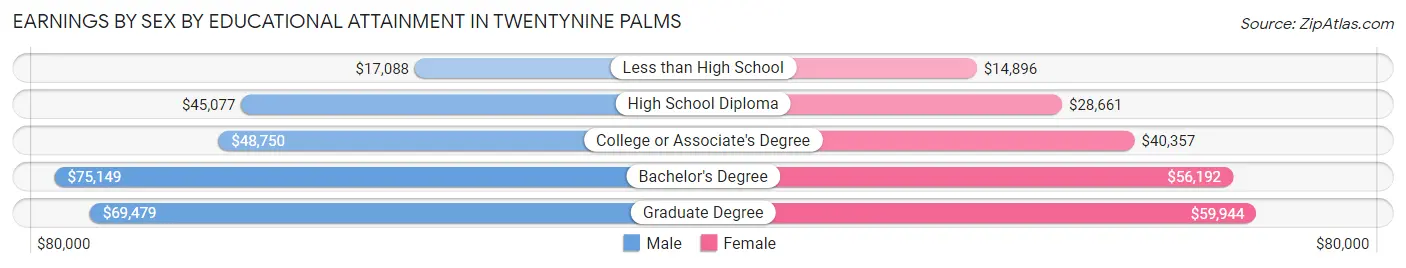
Earnings by Sex by Educational Attainment in Twentynine Palms
Average earnings in Twentynine Palms are $49,220 for men and $40,551 for women, a difference of 17.6%. Men with an educational attainment of bachelor's degree enjoy the highest average annual earnings of $75,149, while those with less than high school education earn the least with $17,088. Women with an educational attainment of graduate degree earn the most with the average annual earnings of $59,944, while those with less than high school education have the smallest earnings of $14,896.
| Educational Attainment | Male Income | Female Income |
| Less than High School | $17,088 | $14,896 |
| High School Diploma | $45,077 | $28,661 |
| College or Associate's Degree | $48,750 | $40,357 |
| Bachelor's Degree | $75,149 | $56,192 |
| Graduate Degree | $69,479 | $59,944 |
| Total | $49,220 | $40,551 |
Family Income in Twentynine Palms
Family Income Brackets in Twentynine Palms
According to the Twentynine Palms family income data, there are 1,456 families falling into the $35,000 to $49,999 income range, which is the most common income bracket and makes up 23.8% of all families. Conversely, the less than $10,000 income bracket is the least frequent group with only 147 families (2.4%) belonging to this category.
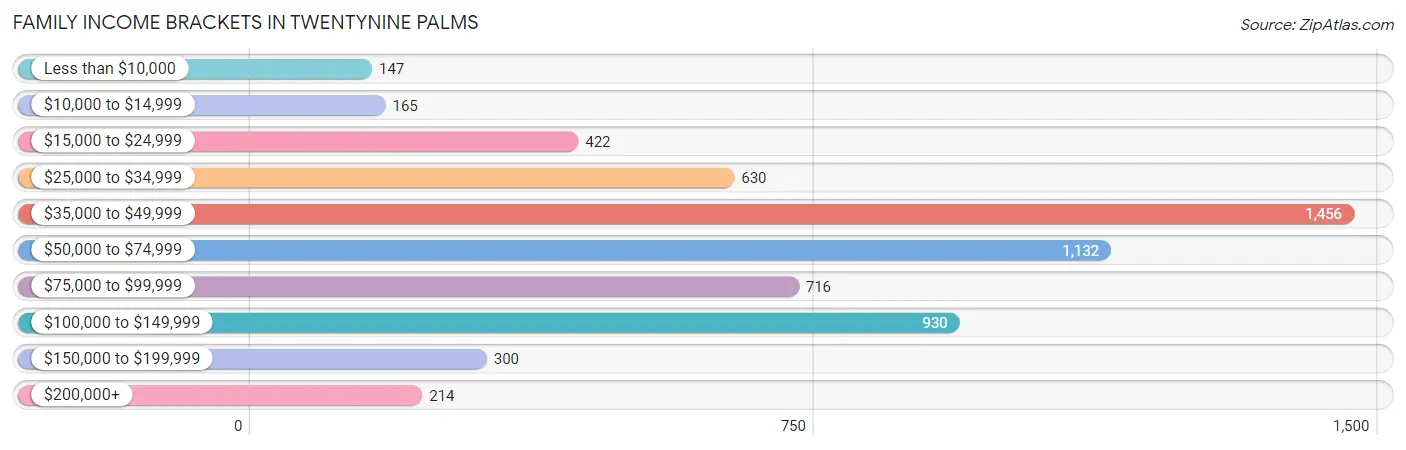
| Income Bracket | # Families | % Families |
| Less than $10,000 | 147 | 2.4% |
| $10,000 to $14,999 | 165 | 2.7% |
| $15,000 to $24,999 | 422 | 6.9% |
| $25,000 to $34,999 | 630 | 10.3% |
| $35,000 to $49,999 | 1,456 | 23.8% |
| $50,000 to $74,999 | 1,132 | 18.5% |
| $75,000 to $99,999 | 716 | 11.7% |
| $100,000 to $149,999 | 930 | 15.2% |
| $150,000 to $199,999 | 300 | 4.9% |
| $200,000+ | 214 | 3.5% |
Family Income by Famaliy Size in Twentynine Palms
4-person families (1,258 | 20.6%) account for the highest median family income in Twentynine Palms with $64,359 per family, while 2-person families (2,435 | 39.8%) have the highest median income of $30,295 per family member.
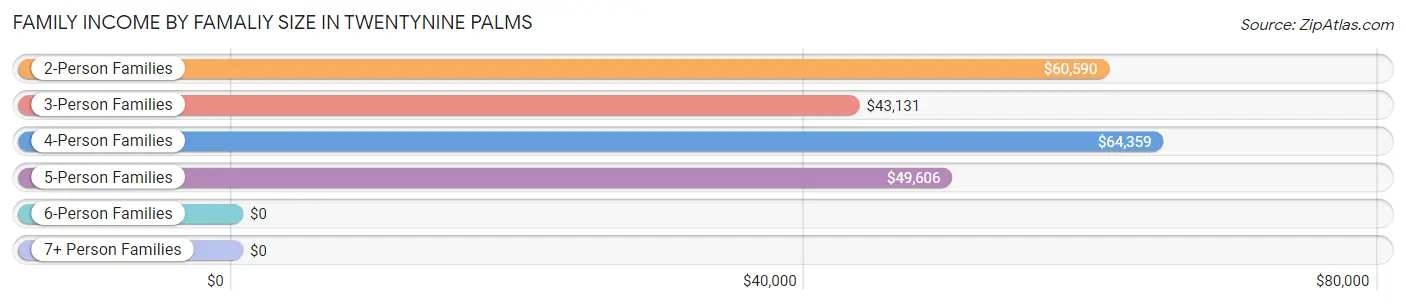
| Income Bracket | # Families | Median Income |
| 2-Person Families | 2,435 (39.8%) | $60,590 |
| 3-Person Families | 1,526 (24.9%) | $43,131 |
| 4-Person Families | 1,258 (20.6%) | $64,359 |
| 5-Person Families | 598 (9.8%) | $49,606 |
| 6-Person Families | 261 (4.3%) | $0 |
| 7+ Person Families | 39 (0.6%) | $0 |
| Total | 6,117 (100.0%) | $53,211 |
Family Income by Number of Earners in Twentynine Palms
The median family income in Twentynine Palms is $53,211, with families comprising 3+ earners (283) having the highest median family income of $152,580, while families with 1 earner (3,093) have the lowest median family income of $42,031, accounting for 4.6% and 50.6% of families, respectively.
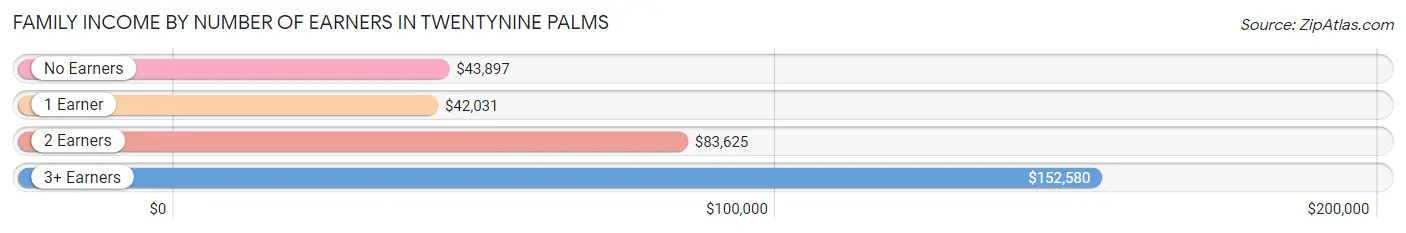
| Number of Earners | # Families | Median Income |
| No Earners | 520 (8.5%) | $43,897 |
| 1 Earner | 3,093 (50.6%) | $42,031 |
| 2 Earners | 2,221 (36.3%) | $83,625 |
| 3+ Earners | 283 (4.6%) | $152,580 |
| Total | 6,117 (100.0%) | $53,211 |
Household Income in Twentynine Palms
Household Income Brackets in Twentynine Palms
With 1,812 households falling in the category, the $35,000 to $49,999 income range is the most frequent in Twentynine Palms, accounting for 19.5% of all households. In contrast, only 279 households (3.0%) fall into the $200,000+ income bracket, making it the least populous group.
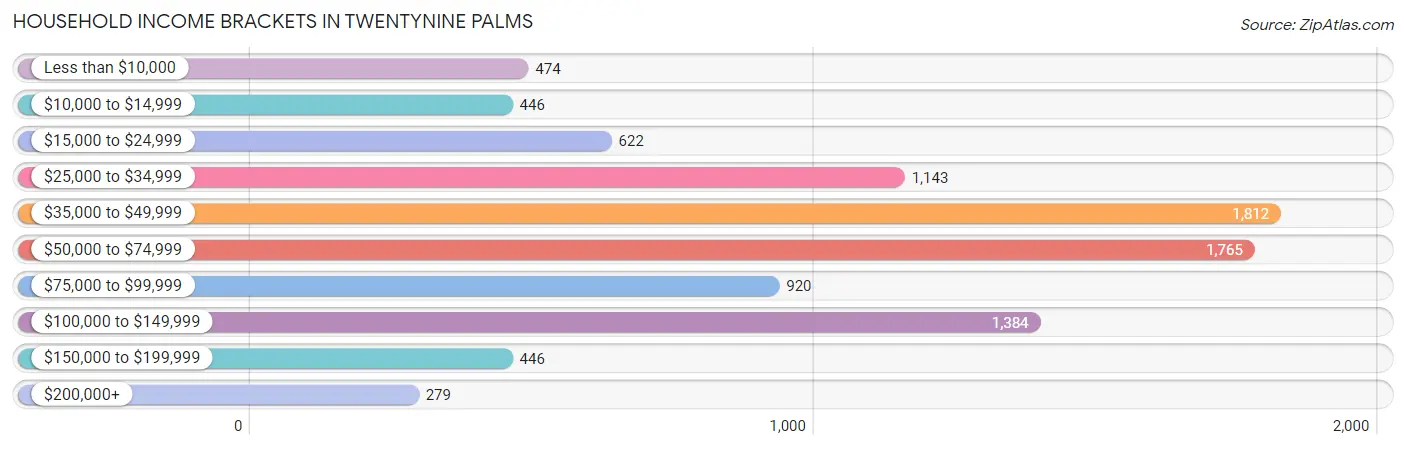
| Income Bracket | # Households | % Households |
| Less than $10,000 | 474 | 5.1% |
| $10,000 to $14,999 | 446 | 4.8% |
| $15,000 to $24,999 | 622 | 6.7% |
| $25,000 to $34,999 | 1,143 | 12.3% |
| $35,000 to $49,999 | 1,812 | 19.5% |
| $50,000 to $74,999 | 1,765 | 19.0% |
| $75,000 to $99,999 | 920 | 9.9% |
| $100,000 to $149,999 | 1,384 | 14.9% |
| $150,000 to $199,999 | 446 | 4.8% |
| $200,000+ | 279 | 3.0% |
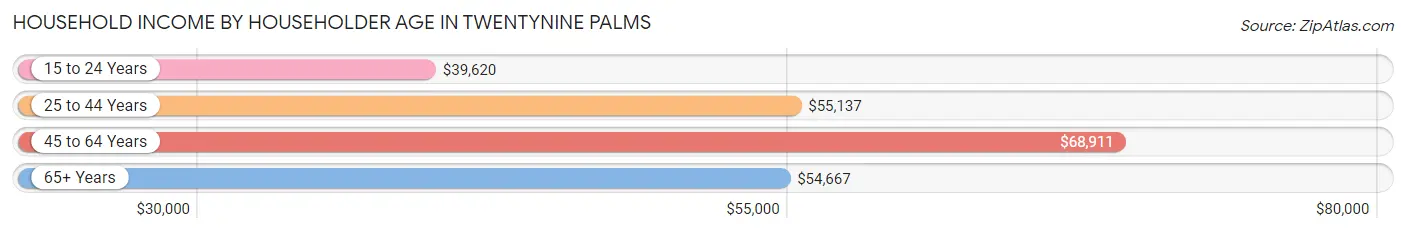
Household Income by Householder Age in Twentynine Palms
The median household income in Twentynine Palms is $51,392, with the highest median household income of $68,911 found in the 45 to 64 years age bracket for the primary householder. A total of 2,073 households (22.3%) fall into this category. Meanwhile, the 15 to 24 years age bracket for the primary householder has the lowest median household income of $39,620, with 1,914 households (20.6%) in this group.
| Income Bracket | # Households | Median Income |
| 15 to 24 Years | 1,914 (20.6%) | $39,620 |
| 25 to 44 Years | 4,069 (43.8%) | $55,137 |
| 45 to 64 Years | 2,073 (22.3%) | $68,911 |
| 65+ Years | 1,234 (13.3%) | $54,667 |
| Total | 9,290 (100.0%) | $51,392 |
Poverty in Twentynine Palms
Income Below Poverty by Sex and Age in Twentynine Palms
With 15.1% poverty level for males and 19.2% for females among the residents of Twentynine Palms, 15 year old males and 5 year old females are the most vulnerable to poverty, with 167 males (66.5%) and 66 females (54.5%) in their respective age groups living below the poverty level.
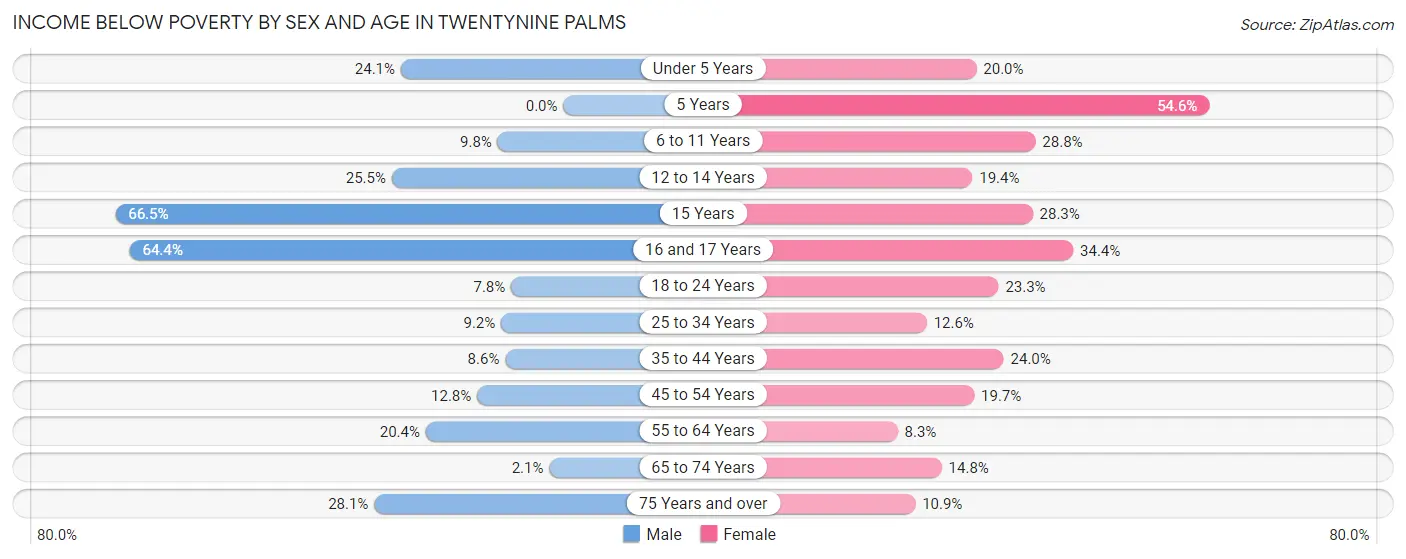
| Age Bracket | Male | Female |
| Under 5 Years | 424 (24.1%) | 338 (20.0%) |
| 5 Years | 0 (0.0%) | 66 (54.5%) |
| 6 to 11 Years | 107 (9.8%) | 297 (28.7%) |
| 12 to 14 Years | 80 (25.5%) | 69 (19.4%) |
| 15 Years | 167 (66.5%) | 34 (28.3%) |
| 16 and 17 Years | 219 (64.4%) | 45 (34.4%) |
| 18 to 24 Years | 149 (7.8%) | 417 (23.3%) |
| 25 to 34 Years | 227 (9.2%) | 368 (12.6%) |
| 35 to 44 Years | 120 (8.6%) | 361 (24.0%) |
| 45 to 54 Years | 114 (12.8%) | 155 (19.7%) |
| 55 to 64 Years | 173 (20.4%) | 66 (8.3%) |
| 65 to 74 Years | 13 (2.1%) | 85 (14.8%) |
| 75 Years and over | 66 (28.1%) | 34 (10.9%) |
| Total | 1,859 (15.1%) | 2,335 (19.2%) |
Income Above Poverty by Sex and Age in Twentynine Palms
According to the poverty statistics in Twentynine Palms, males aged 5 years and females aged 55 to 64 years are the age groups that are most secure financially, with 100.0% of males and 91.7% of females in these age groups living above the poverty line.
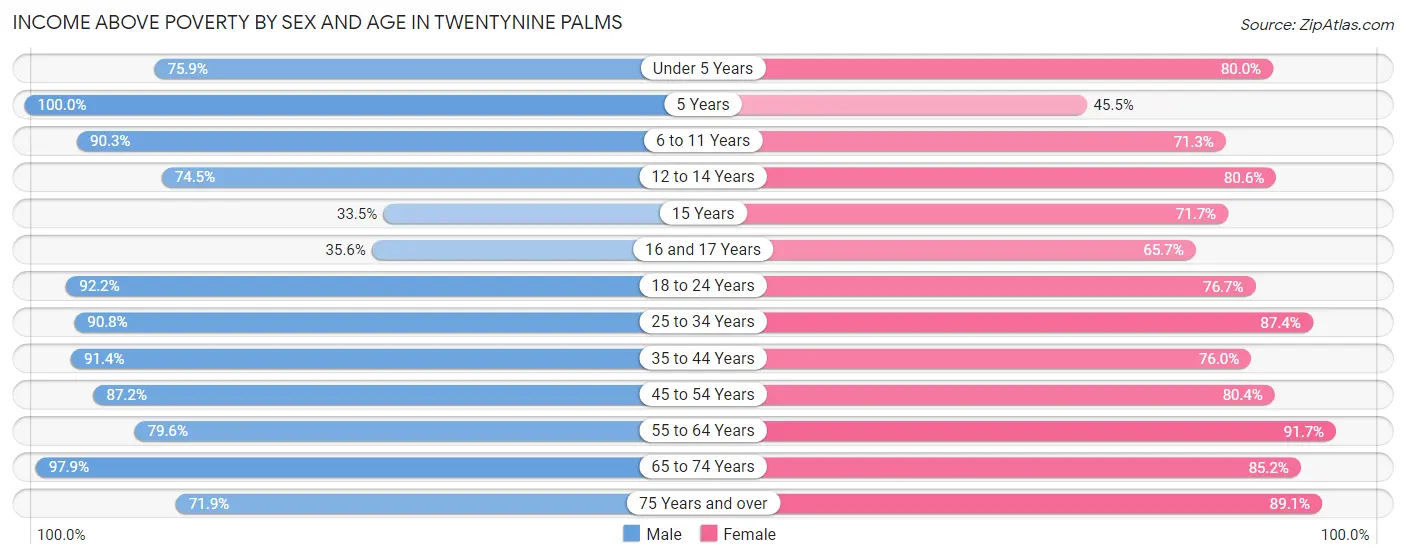
| Age Bracket | Male | Female |
| Under 5 Years | 1,333 (75.9%) | 1,354 (80.0%) |
| 5 Years | 171 (100.0%) | 55 (45.5%) |
| 6 to 11 Years | 990 (90.2%) | 736 (71.3%) |
| 12 to 14 Years | 234 (74.5%) | 287 (80.6%) |
| 15 Years | 84 (33.5%) | 86 (71.7%) |
| 16 and 17 Years | 121 (35.6%) | 86 (65.6%) |
| 18 to 24 Years | 1,770 (92.2%) | 1,376 (76.7%) |
| 25 to 34 Years | 2,231 (90.8%) | 2,551 (87.4%) |
| 35 to 44 Years | 1,271 (91.4%) | 1,141 (76.0%) |
| 45 to 54 Years | 776 (87.2%) | 634 (80.3%) |
| 55 to 64 Years | 674 (79.6%) | 730 (91.7%) |
| 65 to 74 Years | 612 (97.9%) | 488 (85.2%) |
| 75 Years and over | 169 (71.9%) | 278 (89.1%) |
| Total | 10,436 (84.9%) | 9,802 (80.8%) |
Income Below Poverty Among Married-Couple Families in Twentynine Palms
The poverty statistics for married-couple families in Twentynine Palms show that 6.7% or 309 of the total 4,637 families live below the poverty line. Families with 1 or 2 children have the highest poverty rate of 11.9%, comprising of 217 families. On the other hand, families with 5 or more children have the lowest poverty rate of 0.0%, which includes 0 families.
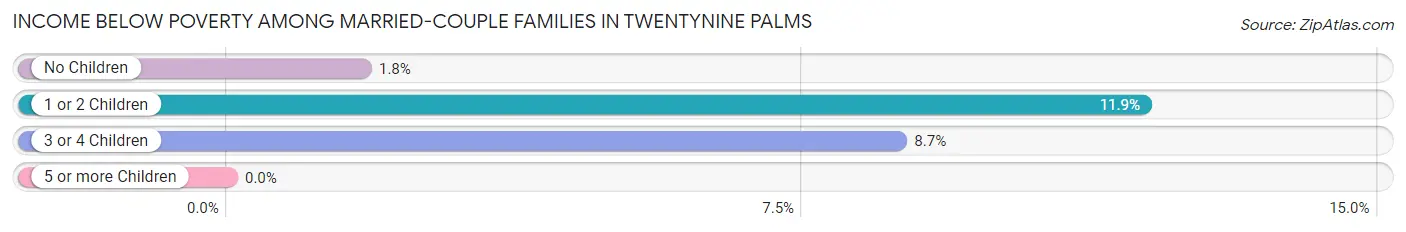
| Children | Above Poverty | Below Poverty |
| No Children | 2,133 (98.3%) | 38 (1.8%) |
| 1 or 2 Children | 1,602 (88.1%) | 217 (11.9%) |
| 3 or 4 Children | 564 (91.3%) | 54 (8.7%) |
| 5 or more Children | 29 (100.0%) | 0 (0.0%) |
| Total | 4,328 (93.3%) | 309 (6.7%) |
Income Below Poverty Among Single-Parent Households in Twentynine Palms
According to the poverty data in Twentynine Palms, 39.0% or 196 single-father households and 30.8% or 301 single-mother households are living below the poverty line. Among single-father households, those with 5 or more children have the highest poverty rate, with 7 households (100.0%) experiencing poverty. Likewise, among single-mother households, those with 5 or more children have the highest poverty rate, with 10 households (100.0%) falling below the poverty line.
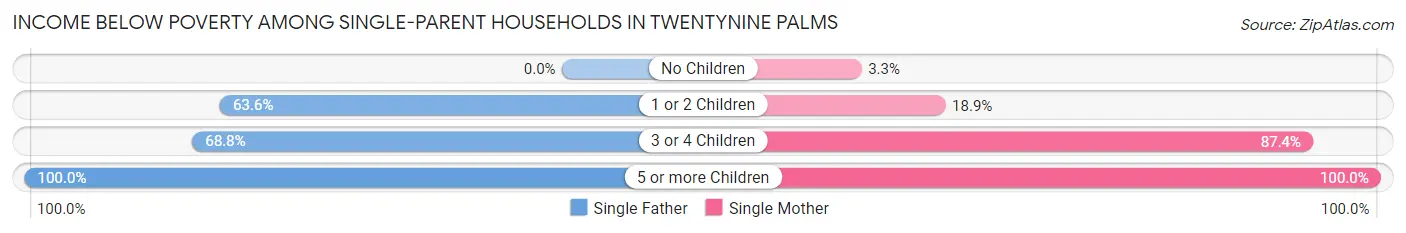
| Children | Single Father | Single Mother |
| No Children | 0 (0.0%) | 8 (3.3%) |
| 1 or 2 Children | 145 (63.6%) | 96 (18.9%) |
| 3 or 4 Children | 44 (68.8%) | 187 (87.4%) |
| 5 or more Children | 7 (100.0%) | 10 (100.0%) |
| Total | 196 (39.0%) | 301 (30.8%) |
Income Below Poverty Among Married-Couple vs Single-Parent Households in Twentynine Palms
The poverty data for Twentynine Palms shows that 309 of the married-couple family households (6.7%) and 497 of the single-parent households (33.6%) are living below the poverty level. Within the married-couple family households, those with 1 or 2 children have the highest poverty rate, with 217 households (11.9%) falling below the poverty line. Among the single-parent households, those with 5 or more children have the highest poverty rate, with 17 household (100.0%) living below poverty.
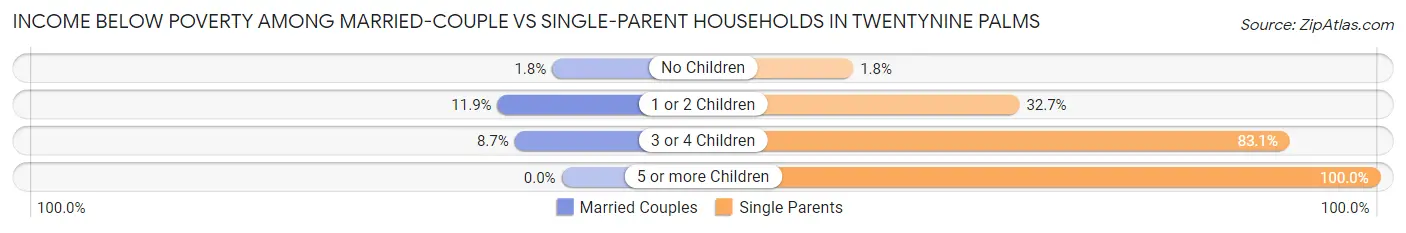
| Children | Married-Couple Families | Single-Parent Households |
| No Children | 38 (1.8%) | 8 (1.8%) |
| 1 or 2 Children | 217 (11.9%) | 241 (32.7%) |
| 3 or 4 Children | 54 (8.7%) | 231 (83.1%) |
| 5 or more Children | 0 (0.0%) | 17 (100.0%) |
| Total | 309 (6.7%) | 497 (33.6%) |
Race in Twentynine Palms
The most populous races in Twentynine Palms are White / Caucasian (17,251 | 61.6%), Hispanic or Latino (7,281 | 26.0%), and Two or more Races (5,814 | 20.8%).
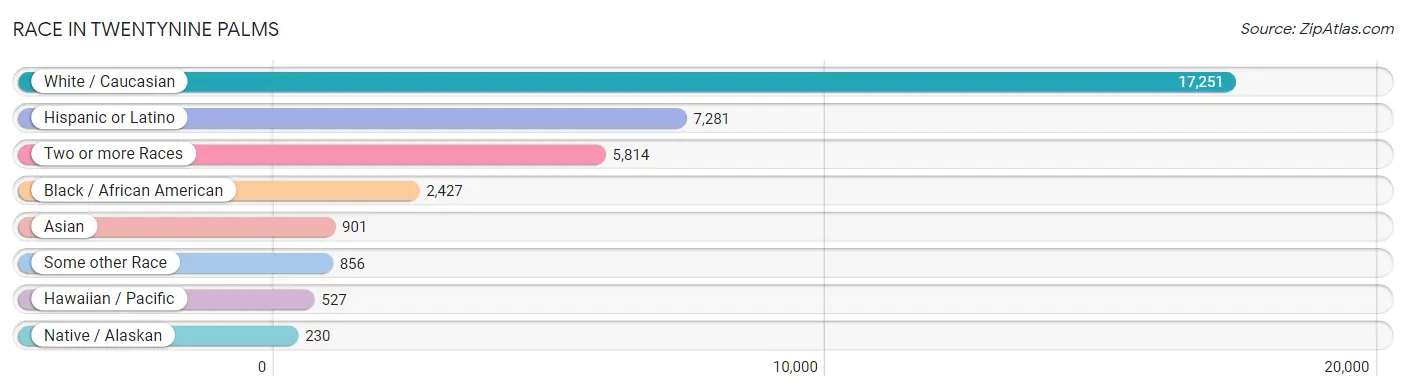
| Race | # Population | % Population |
| Asian | 901 | 3.2% |
| Black / African American | 2,427 | 8.7% |
| Hawaiian / Pacific | 527 | 1.9% |
| Hispanic or Latino | 7,281 | 26.0% |
| Native / Alaskan | 230 | 0.8% |
| White / Caucasian | 17,251 | 61.6% |
| Two or more Races | 5,814 | 20.8% |
| Some other Race | 856 | 3.1% |
| Total | 28,006 | 100.0% |
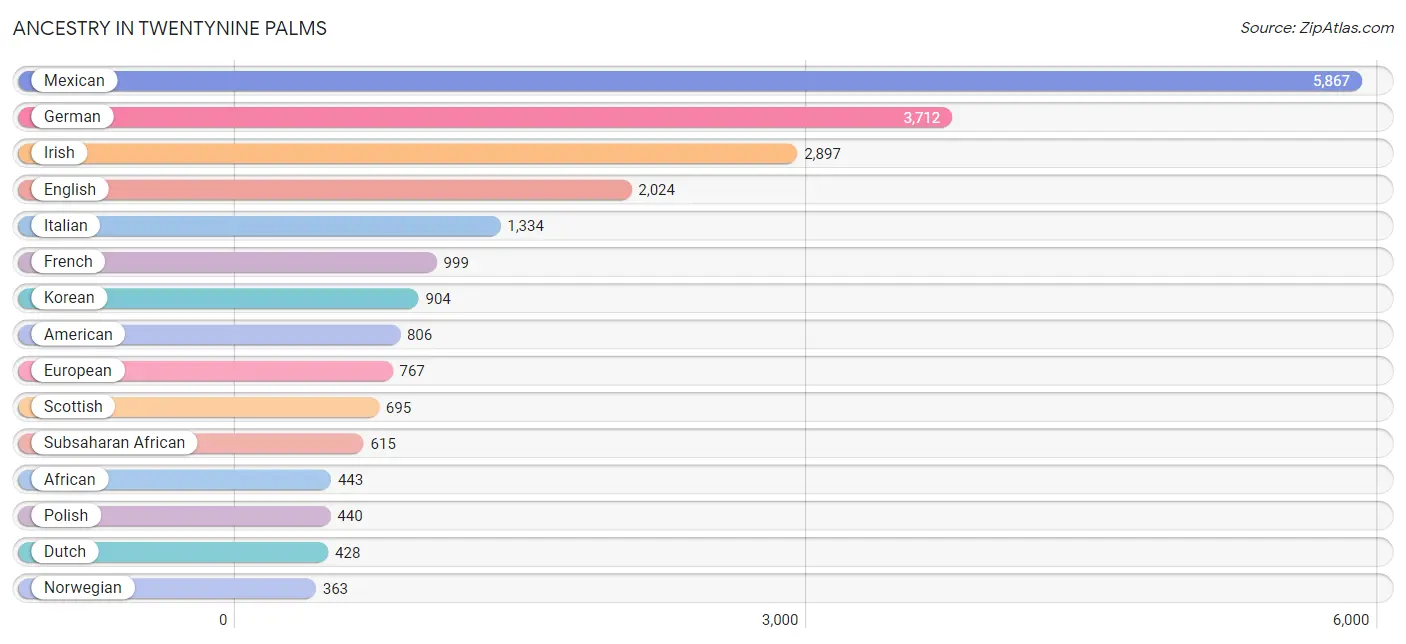
Ancestry in Twentynine Palms
The most populous ancestries reported in Twentynine Palms are Mexican (5,867 | 20.9%), German (3,712 | 13.3%), Irish (2,897 | 10.3%), English (2,024 | 7.2%), and Italian (1,334 | 4.8%), together accounting for 56.5% of all Twentynine Palms residents.
| Ancestry | # Population | % Population |
| African | 443 | 1.6% |
| Alaskan Athabascan | 4 | 0.0% |
| American | 806 | 2.9% |
| Arab | 52 | 0.2% |
| Argentinean | 7 | 0.0% |
| Armenian | 5 | 0.0% |
| Assyrian / Chaldean / Syriac | 11 | 0.0% |
| Austrian | 36 | 0.1% |
| Basque | 5 | 0.0% |
| Belgian | 5 | 0.0% |
| Bhutanese | 123 | 0.4% |
| Blackfeet | 103 | 0.4% |
| Bolivian | 5 | 0.0% |
| Brazilian | 12 | 0.0% |
| British | 160 | 0.6% |
| Bulgarian | 8 | 0.0% |
| Burmese | 135 | 0.5% |
| Canadian | 44 | 0.2% |
| Central American | 238 | 0.9% |
| Central American Indian | 27 | 0.1% |
| Cherokee | 101 | 0.4% |
| Chilean | 66 | 0.2% |
| Choctaw | 20 | 0.1% |
| Colombian | 37 | 0.1% |
| Cuban | 33 | 0.1% |
| Czechoslovakian | 10 | 0.0% |
| Danish | 33 | 0.1% |
| Dominican | 152 | 0.5% |
| Dutch | 428 | 1.5% |
| Eastern European | 41 | 0.2% |
| Ecuadorian | 30 | 0.1% |
| English | 2,024 | 7.2% |
| European | 767 | 2.7% |
| Finnish | 46 | 0.2% |
| French | 999 | 3.6% |
| French Canadian | 13 | 0.1% |
| German | 3,712 | 13.3% |
| Greek | 70 | 0.3% |
| Guamanian / Chamorro | 208 | 0.7% |
| Guatemalan | 54 | 0.2% |
| Guyanese | 5 | 0.0% |
| Honduran | 11 | 0.0% |
| Hungarian | 35 | 0.1% |
| Icelander | 17 | 0.1% |
| Indian (Asian) | 72 | 0.3% |
| Irish | 2,897 | 10.3% |
| Iroquois | 5 | 0.0% |
| Italian | 1,334 | 4.8% |
| Jamaican | 69 | 0.3% |
| Japanese | 45 | 0.2% |
| Korean | 904 | 3.2% |
| Lebanese | 51 | 0.2% |
| Lithuanian | 32 | 0.1% |
| Lumbee | 16 | 0.1% |
| Mexican | 5,867 | 20.9% |
| Mexican American Indian | 7 | 0.0% |
| Native Hawaiian | 252 | 0.9% |
| Navajo | 67 | 0.2% |
| Nicaraguan | 12 | 0.0% |
| Northern European | 152 | 0.5% |
| Norwegian | 363 | 1.3% |
| Pakistani | 152 | 0.5% |
| Panamanian | 18 | 0.1% |
| Peruvian | 3 | 0.0% |
| Polish | 440 | 1.6% |
| Portuguese | 61 | 0.2% |
| Puerto Rican | 287 | 1.0% |
| Russian | 28 | 0.1% |
| Salvadoran | 143 | 0.5% |
| Samoan | 75 | 0.3% |
| Scandinavian | 87 | 0.3% |
| Scotch-Irish | 129 | 0.5% |
| Scottish | 695 | 2.5% |
| Sierra Leonean | 60 | 0.2% |
| Sioux | 5 | 0.0% |
| Slavic | 8 | 0.0% |
| Slovene | 11 | 0.0% |
| South American | 170 | 0.6% |
| South American Indian | 13 | 0.1% |
| Spaniard | 86 | 0.3% |
| Spanish | 9 | 0.0% |
| Spanish American | 50 | 0.2% |
| Sri Lankan | 194 | 0.7% |
| Subsaharan African | 615 | 2.2% |
| Swedish | 143 | 0.5% |
| Swiss | 5 | 0.0% |
| Trinidadian and Tobagonian | 6 | 0.0% |
| Venezuelan | 22 | 0.1% |
| Welsh | 175 | 0.6% | View All 89 Rows |
Immigrants in Twentynine Palms
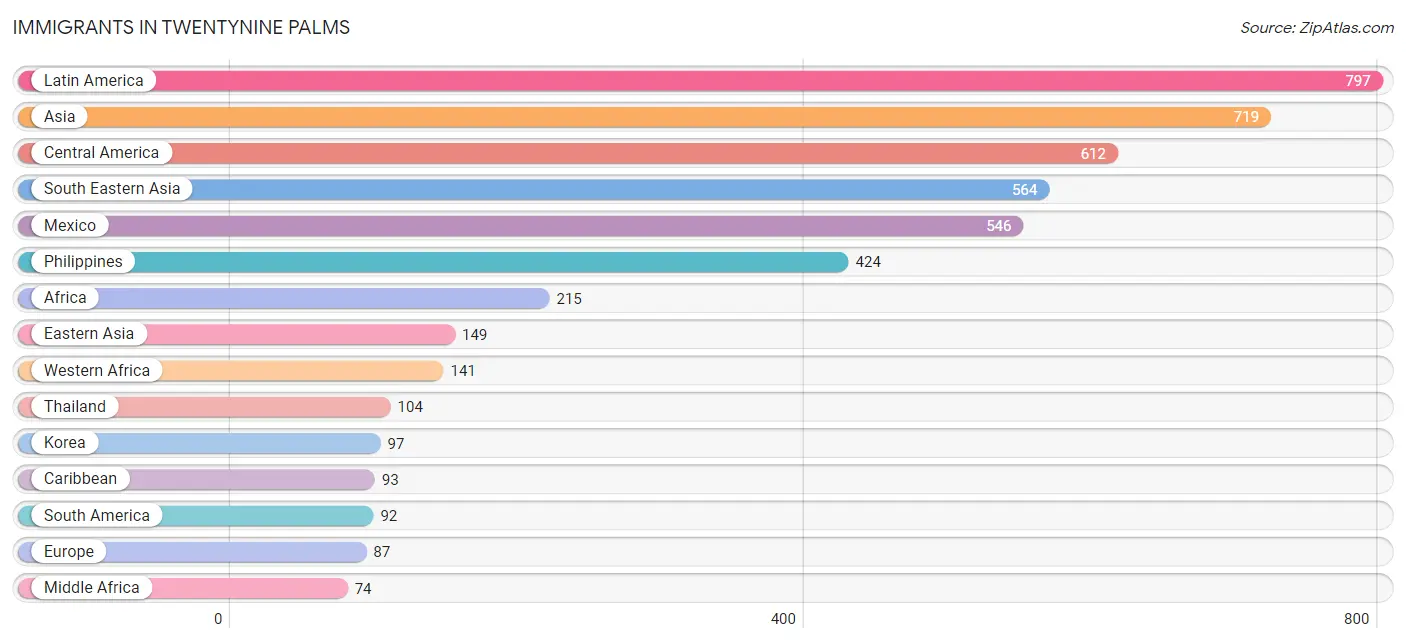
The most numerous immigrant groups reported in Twentynine Palms came from Latin America (797 | 2.9%), Asia (719 | 2.6%), Central America (612 | 2.2%), South Eastern Asia (564 | 2.0%), and Mexico (546 | 1.9%), together accounting for 11.6% of all Twentynine Palms residents.
| Immigration Origin | # Population | % Population |
| Africa | 215 | 0.8% |
| Argentina | 7 | 0.0% |
| Asia | 719 | 2.6% |
| Austria | 9 | 0.0% |
| Barbados | 5 | 0.0% |
| Bolivia | 5 | 0.0% |
| Bulgaria | 8 | 0.0% |
| Canada | 40 | 0.1% |
| Caribbean | 93 | 0.3% |
| Central America | 612 | 2.2% |
| Chile | 38 | 0.1% |
| China | 39 | 0.1% |
| Colombia | 37 | 0.1% |
| Cuba | 12 | 0.0% |
| Dominican Republic | 64 | 0.2% |
| Eastern Asia | 149 | 0.5% |
| Eastern Europe | 20 | 0.1% |
| El Salvador | 36 | 0.1% |
| Europe | 87 | 0.3% |
| Fiji | 14 | 0.1% |
| France | 17 | 0.1% |
| Germany | 18 | 0.1% |
| Ghana | 35 | 0.1% |
| Guyana | 5 | 0.0% |
| Honduras | 11 | 0.0% |
| Ireland | 19 | 0.1% |
| Jamaica | 12 | 0.0% |
| Japan | 13 | 0.1% |
| Korea | 97 | 0.4% |
| Latin America | 797 | 2.9% |
| Mexico | 546 | 1.9% |
| Middle Africa | 74 | 0.3% |
| Nicaragua | 19 | 0.1% |
| Nigeria | 46 | 0.2% |
| Northern Europe | 19 | 0.1% |
| Oceania | 40 | 0.1% |
| Philippines | 424 | 1.5% |
| Portugal | 4 | 0.0% |
| Russia | 12 | 0.0% |
| Saudi Arabia | 6 | 0.0% |
| Sierra Leone | 60 | 0.2% |
| South America | 92 | 0.3% |
| South Eastern Asia | 564 | 2.0% |
| Southern Europe | 4 | 0.0% |
| Thailand | 104 | 0.4% |
| Vietnam | 18 | 0.1% |
| Western Africa | 141 | 0.5% |
| Western Asia | 6 | 0.0% |
| Western Europe | 44 | 0.2% |
| Zaire | 74 | 0.3% | View All 50 Rows |
Sex and Age in Twentynine Palms
Sex and Age in Twentynine Palms
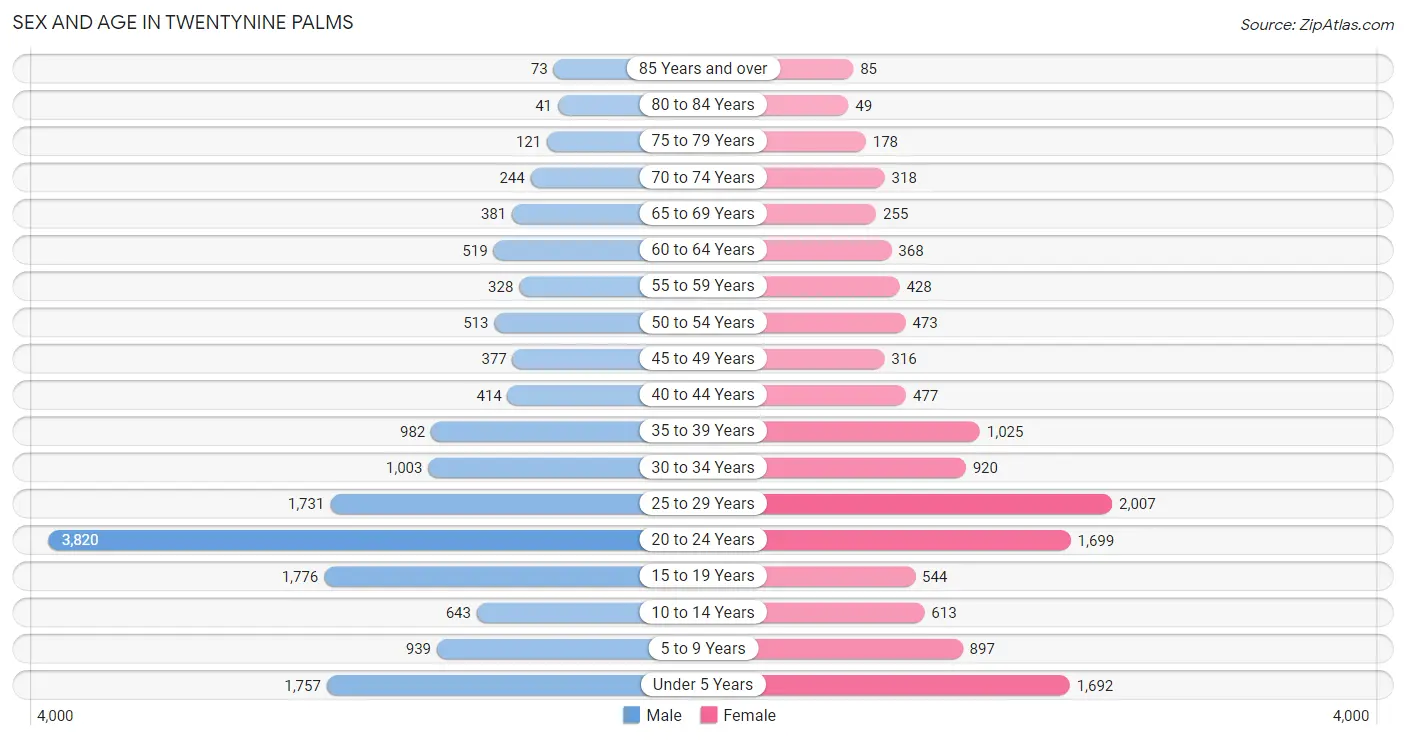
The most populous age groups in Twentynine Palms are 20 to 24 Years (3,820 | 24.4%) for men and 25 to 29 Years (2,007 | 16.3%) for women.
| Age Bracket | Male | Female |
| Under 5 Years | 1,757 (11.2%) | 1,692 (13.7%) |
| 5 to 9 Years | 939 (6.0%) | 897 (7.3%) |
| 10 to 14 Years | 643 (4.1%) | 613 (5.0%) |
| 15 to 19 Years | 1,776 (11.3%) | 544 (4.4%) |
| 20 to 24 Years | 3,820 (24.4%) | 1,699 (13.8%) |
| 25 to 29 Years | 1,731 (11.1%) | 2,007 (16.3%) |
| 30 to 34 Years | 1,003 (6.4%) | 920 (7.4%) |
| 35 to 39 Years | 982 (6.3%) | 1,025 (8.3%) |
| 40 to 44 Years | 414 (2.6%) | 477 (3.9%) |
| 45 to 49 Years | 377 (2.4%) | 316 (2.6%) |
| 50 to 54 Years | 513 (3.3%) | 473 (3.8%) |
| 55 to 59 Years | 328 (2.1%) | 428 (3.5%) |
| 60 to 64 Years | 519 (3.3%) | 368 (3.0%) |
| 65 to 69 Years | 381 (2.4%) | 255 (2.1%) |
| 70 to 74 Years | 244 (1.6%) | 318 (2.6%) |
| 75 to 79 Years | 121 (0.8%) | 178 (1.4%) |
| 80 to 84 Years | 41 (0.3%) | 49 (0.4%) |
| 85 Years and over | 73 (0.5%) | 85 (0.7%) |
| Total | 15,662 (100.0%) | 12,344 (100.0%) |
Families and Households in Twentynine Palms
Median Family Size in Twentynine Palms
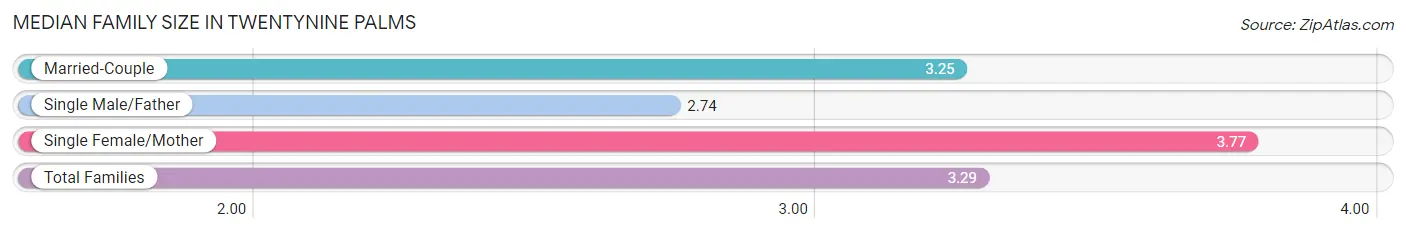
The median family size in Twentynine Palms is 3.29 persons per family, with single female/mother families (977 | 16.0%) accounting for the largest median family size of 3.77 persons per family. On the other hand, single male/father families (503 | 8.2%) represent the smallest median family size with 2.74 persons per family.
| Family Type | # Families | Family Size |
| Married-Couple | 4,637 (75.8%) | 3.25 |
| Single Male/Father | 503 (8.2%) | 2.74 |
| Single Female/Mother | 977 (16.0%) | 3.77 |
| Total Families | 6,117 (100.0%) | 3.29 |
Median Household Size in Twentynine Palms
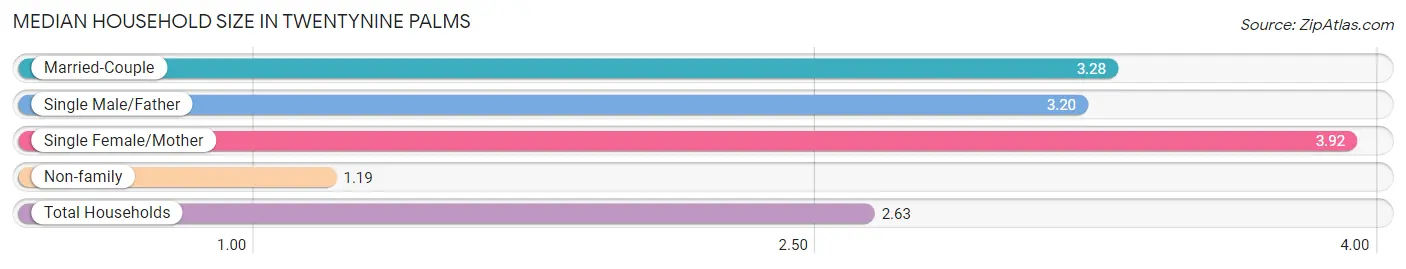
The median household size in Twentynine Palms is 2.63 persons per household, with single female/mother households (977 | 10.5%) accounting for the largest median household size of 3.92 persons per household. non-family households (3,173 | 34.2%) represent the smallest median household size with 1.19 persons per household.
| Household Type | # Households | Household Size |
| Married-Couple | 4,637 (49.9%) | 3.28 |
| Single Male/Father | 503 (5.4%) | 3.20 |
| Single Female/Mother | 977 (10.5%) | 3.92 |
| Non-family | 3,173 (34.2%) | 1.19 |
| Total Households | 9,290 (100.0%) | 2.63 |
Household Size by Marriage Status in Twentynine Palms
Out of a total of 9,290 households in Twentynine Palms, 6,117 (65.8%) are family households, while 3,173 (34.2%) are nonfamily households. The most numerous type of family households are 2-person households, comprising 2,244, and the most common type of nonfamily households are 1-person households, comprising 2,676.
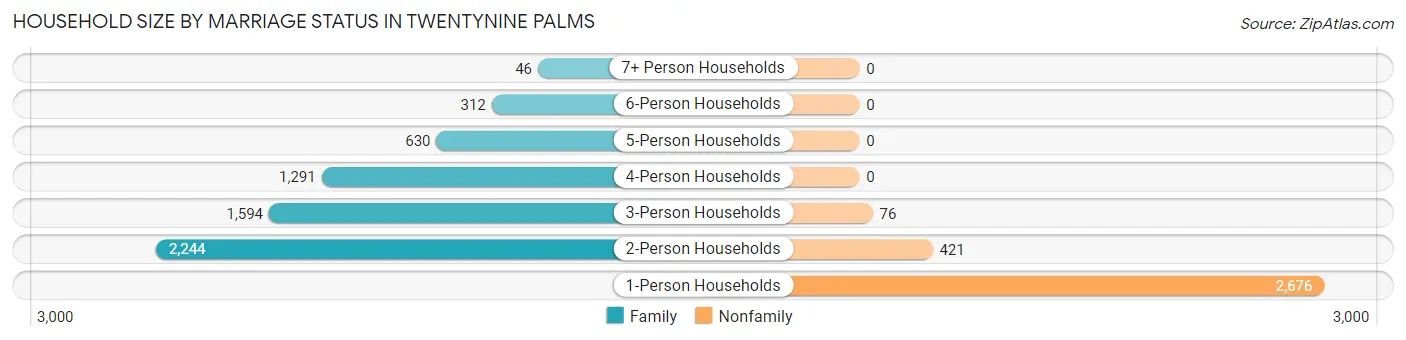
| Household Size | Family Households | Nonfamily Households |
| 1-Person Households | - | 2,676 (28.8%) |
| 2-Person Households | 2,244 (24.2%) | 421 (4.5%) |
| 3-Person Households | 1,594 (17.2%) | 76 (0.8%) |
| 4-Person Households | 1,291 (13.9%) | 0 (0.0%) |
| 5-Person Households | 630 (6.8%) | 0 (0.0%) |
| 6-Person Households | 312 (3.4%) | 0 (0.0%) |
| 7+ Person Households | 46 (0.5%) | 0 (0.0%) |
| Total | 6,117 (65.8%) | 3,173 (34.2%) |
Female Fertility in Twentynine Palms
Fertility by Age in Twentynine Palms
Average fertility rate in Twentynine Palms is 129.0 births per 1,000 women. Women in the age bracket of 20 to 34 years have the highest fertility rate with 188.0 births per 1,000 women. Women in the age bracket of 20 to 34 years acount for 96.1% of all women with births.
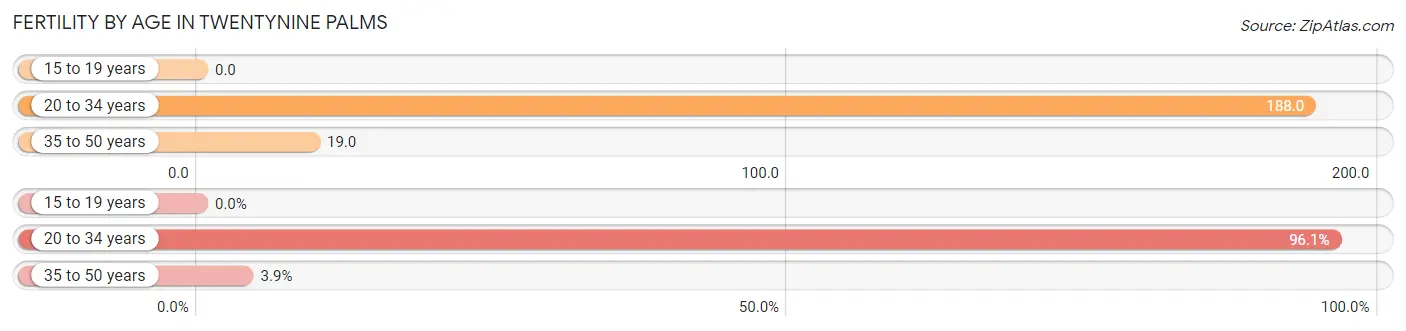
| Age Bracket | Women with Births | Births / 1,000 Women |
| 15 to 19 years | 0 (0.0%) | 0.0 |
| 20 to 34 years | 870 (96.1%) | 188.0 |
| 35 to 50 years | 35 (3.9%) | 19.0 |
| Total | 905 (100.0%) | 129.0 |
Fertility by Age by Marriage Status in Twentynine Palms
88.2% of women with births (905) in Twentynine Palms are married. The highest percentage of unmarried women with births falls into 20 to 34 years age bracket with 12.3% of them unmarried at the time of birth, while the lowest percentage of unmarried women with births belong to 35 to 50 years age bracket with 0.0% of them unmarried.
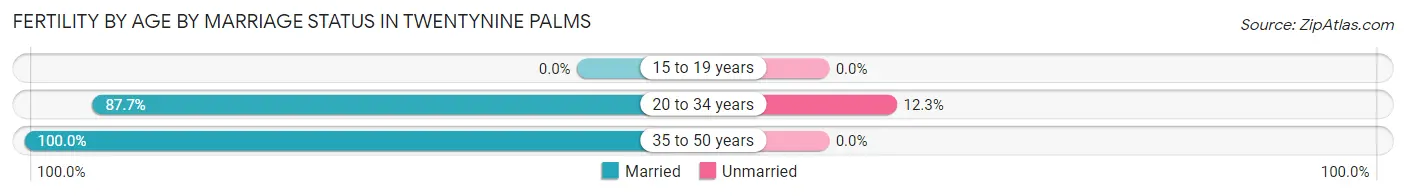
| Age Bracket | Married | Unmarried |
| 15 to 19 years | 0 (0.0%) | 0 (0.0%) |
| 20 to 34 years | 763 (87.7%) | 107 (12.3%) |
| 35 to 50 years | 35 (100.0%) | 0 (0.0%) |
| Total | 798 (88.2%) | 107 (11.8%) |
Fertility by Education in Twentynine Palms
Average fertility rate in Twentynine Palms is 129.0 births per 1,000 women. Women with the education attainment of high school diploma have the highest fertility rate of 195.0 births per 1,000 women, while women with the education attainment of less than high school have the lowest fertility at 43.0 births per 1,000 women. Women with the education attainment of college or associate's degree represent 50.1% of all women with births.
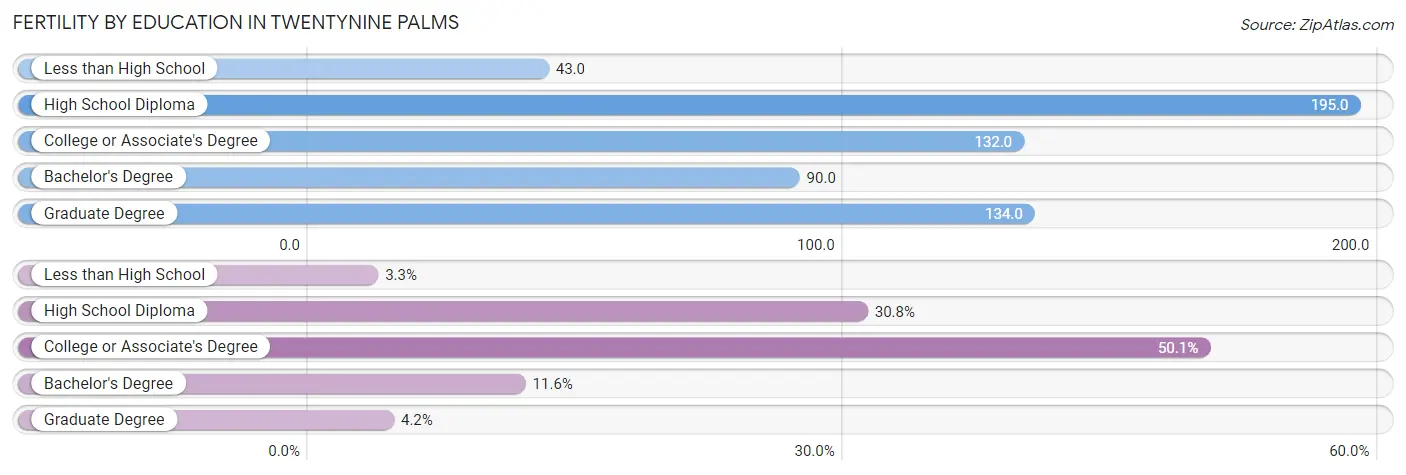
| Educational Attainment | Women with Births | Births / 1,000 Women |
| Less than High School | 30 (3.3%) | 43.0 |
| High School Diploma | 279 (30.8%) | 195.0 |
| College or Associate's Degree | 453 (50.1%) | 132.0 |
| Bachelor's Degree | 105 (11.6%) | 90.0 |
| Graduate Degree | 38 (4.2%) | 134.0 |
| Total | 905 (100.0%) | 129.0 |
Fertility by Education by Marriage Status in Twentynine Palms
11.8% of women with births in Twentynine Palms are unmarried. Women with the educational attainment of less than high school are most likely to be married with 100.0% of them married at childbirth, while women with the educational attainment of college or associate's degree are least likely to be married with 22.5% of them unmarried at childbirth.
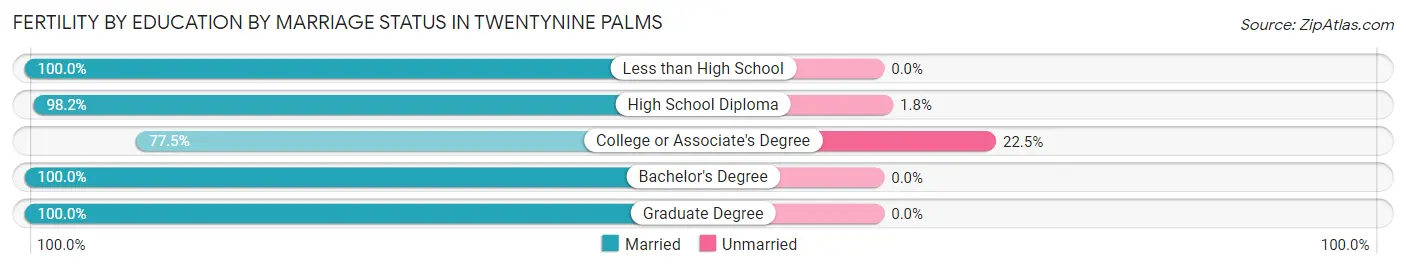
| Educational Attainment | Married | Unmarried |
| Less than High School | 30 (100.0%) | 0 (0.0%) |
| High School Diploma | 274 (98.2%) | 5 (1.8%) |
| College or Associate's Degree | 351 (77.5%) | 102 (22.5%) |
| Bachelor's Degree | 105 (100.0%) | 0 (0.0%) |
| Graduate Degree | 38 (100.0%) | 0 (0.0%) |
| Total | 798 (88.2%) | 107 (11.8%) |
Employment Characteristics in Twentynine Palms
Employment by Class of Employer in Twentynine Palms
Among the 14,377 employed individuals in Twentynine Palms, federal government employees (8,473 | 58.9%), private company employees (4,007 | 27.9%), and not-for-profit organizations (723 | 5.0%) make up the most common classes of employment.
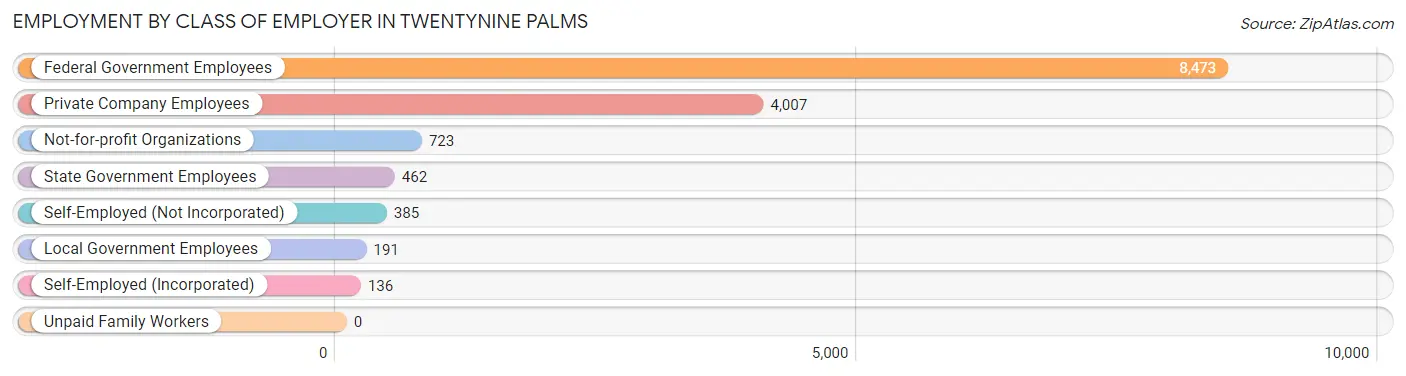
| Employer Class | # Employees | % Employees |
| Private Company Employees | 4,007 | 27.9% |
| Self-Employed (Incorporated) | 136 | 0.9% |
| Self-Employed (Not Incorporated) | 385 | 2.7% |
| Not-for-profit Organizations | 723 | 5.0% |
| Local Government Employees | 191 | 1.3% |
| State Government Employees | 462 | 3.2% |
| Federal Government Employees | 8,473 | 58.9% |
| Unpaid Family Workers | 0 | 0.0% |
| Total | 14,377 | 100.0% |
Employment Status by Age in Twentynine Palms
According to the labor force statistics for Twentynine Palms, out of the total population over 16 years of age (21,094), 70.9% or 14,956 individuals are in the labor force, with 6.3% or 942 of them unemployed. The age group with the highest labor force participation rate is 20 to 24 years, with 85.2% or 4,702 individuals in the labor force. Within the labor force, the 16 to 19 years age range has the highest percentage of unemployed individuals, with 20.6% or 287 of them being unemployed.
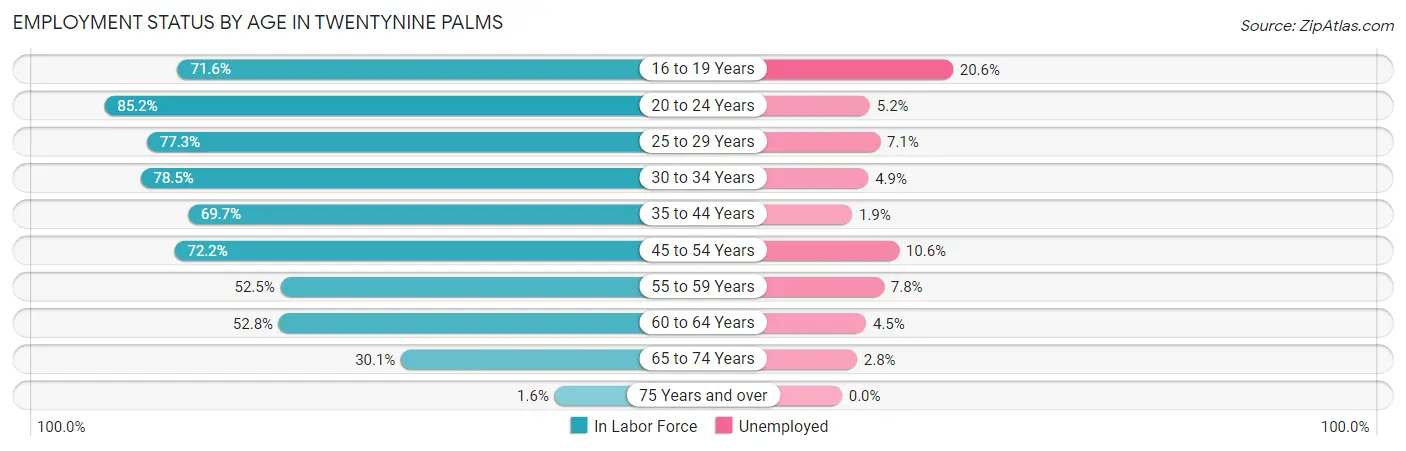
| Age Bracket | In Labor Force | Unemployed |
| 16 to 19 Years | 1,395 (71.6%) | 287 (20.6%) |
| 20 to 24 Years | 4,702 (85.2%) | 245 (5.2%) |
| 25 to 29 Years | 2,889 (77.3%) | 205 (7.1%) |
| 30 to 34 Years | 1,510 (78.5%) | 74 (4.9%) |
| 35 to 44 Years | 2,020 (69.7%) | 38 (1.9%) |
| 45 to 54 Years | 1,212 (72.2%) | 128 (10.6%) |
| 55 to 59 Years | 397 (52.5%) | 31 (7.8%) |
| 60 to 64 Years | 468 (52.8%) | 21 (4.5%) |
| 65 to 74 Years | 361 (30.1%) | 10 (2.8%) |
| 75 Years and over | 9 (1.6%) | 0 (0.0%) |
| Total | 14,956 (70.9%) | 942 (6.3%) |
Employment Status by Educational Attainment in Twentynine Palms
According to labor force statistics for Twentynine Palms, 71.5% of individuals (8,495) out of the total population between 25 and 64 years of age (11,881) are in the labor force, with 6.2% or 527 of them being unemployed. The group with the highest labor force participation rate are those with the educational attainment of bachelor's degree or higher, with 83.9% or 2,509 individuals in the labor force. Within the labor force, individuals with high school diploma education have the highest percentage of unemployment, with 8.9% or 158 of them being unemployed.
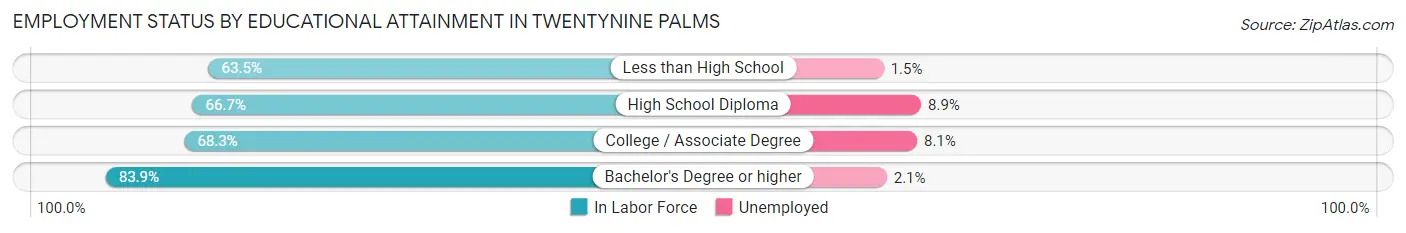
| Educational Attainment | In Labor Force | Unemployed |
| Less than High School | 545 (63.5%) | 13 (1.5%) |
| High School Diploma | 1,775 (66.7%) | 237 (8.9%) |
| College / Associate Degree | 3,669 (68.3%) | 435 (8.1%) |
| Bachelor's Degree or higher | 2,509 (83.9%) | 63 (2.1%) |
| Total | 8,495 (71.5%) | 737 (6.2%) |
Employment Occupations by Sex in Twentynine Palms
Management, Business, Science and Arts Occupations
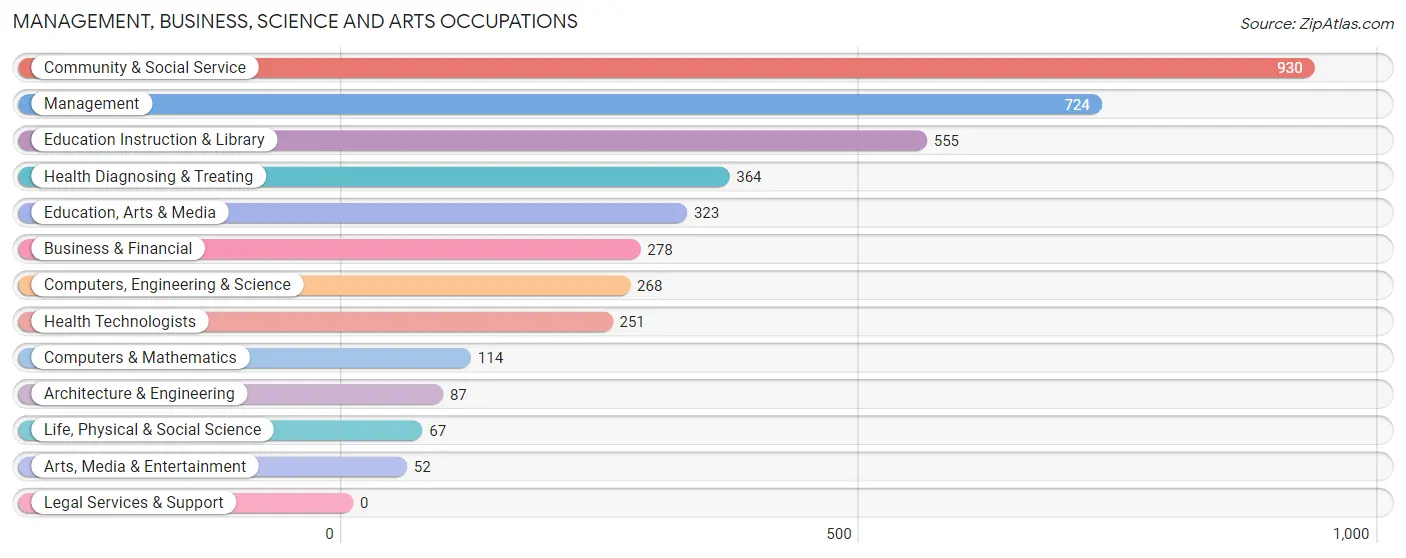
The most common Management, Business, Science and Arts occupations in Twentynine Palms are Community & Social Service (930 | 12.8%), Management (724 | 10.0%), Education Instruction & Library (555 | 7.6%), Health Diagnosing & Treating (364 | 5.0%), and Education, Arts & Media (323 | 4.4%).
Management, Business, Science and Arts Occupations by Sex
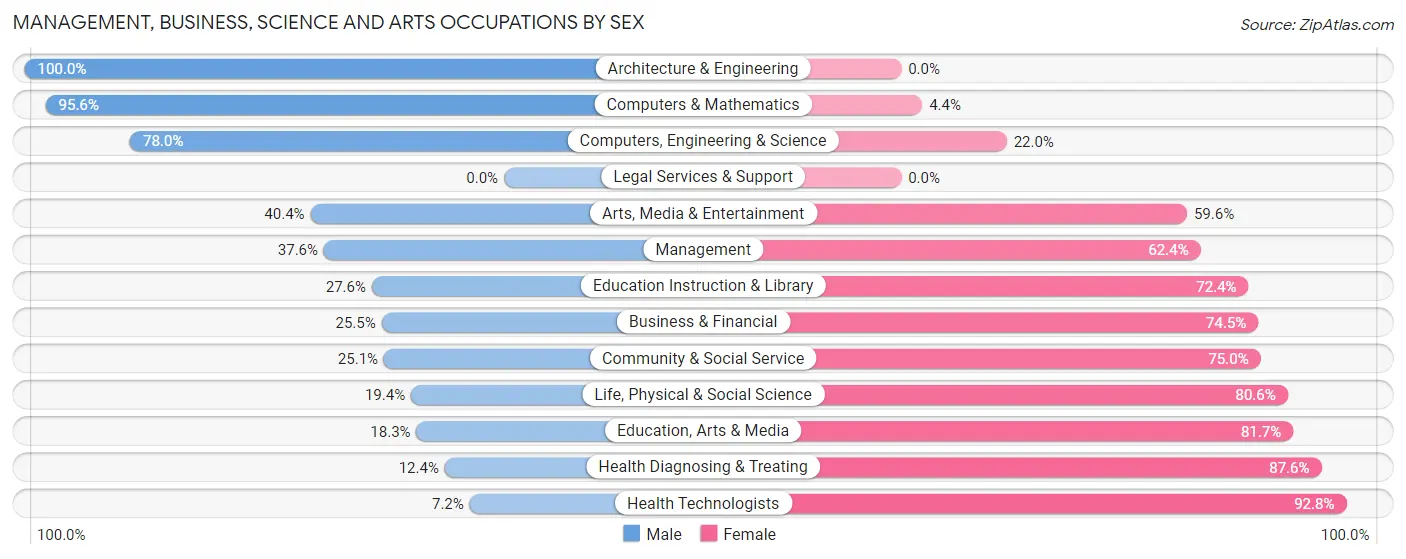
Within the Management, Business, Science and Arts occupations in Twentynine Palms, the most male-oriented occupations are Architecture & Engineering (100.0%), Computers & Mathematics (95.6%), and Computers, Engineering & Science (78.0%), while the most female-oriented occupations are Health Technologists (92.8%), Health Diagnosing & Treating (87.6%), and Education, Arts & Media (81.7%).
| Occupation | Male | Female |
| Management | 272 (37.6%) | 452 (62.4%) |
| Business & Financial | 71 (25.5%) | 207 (74.5%) |
| Computers, Engineering & Science | 209 (78.0%) | 59 (22.0%) |
| Computers & Mathematics | 109 (95.6%) | 5 (4.4%) |
| Architecture & Engineering | 87 (100.0%) | 0 (0.0%) |
| Life, Physical & Social Science | 13 (19.4%) | 54 (80.6%) |
| Community & Social Service | 233 (25.1%) | 697 (75.0%) |
| Education, Arts & Media | 59 (18.3%) | 264 (81.7%) |
| Legal Services & Support | 0 (0.0%) | 0 (0.0%) |
| Education Instruction & Library | 153 (27.6%) | 402 (72.4%) |
| Arts, Media & Entertainment | 21 (40.4%) | 31 (59.6%) |
| Health Diagnosing & Treating | 45 (12.4%) | 319 (87.6%) |
| Health Technologists | 18 (7.2%) | 233 (92.8%) |
| Total (Category) | 830 (32.4%) | 1,734 (67.6%) |
| Total (Overall) | 3,213 (44.3%) | 4,048 (55.7%) |
Services Occupations
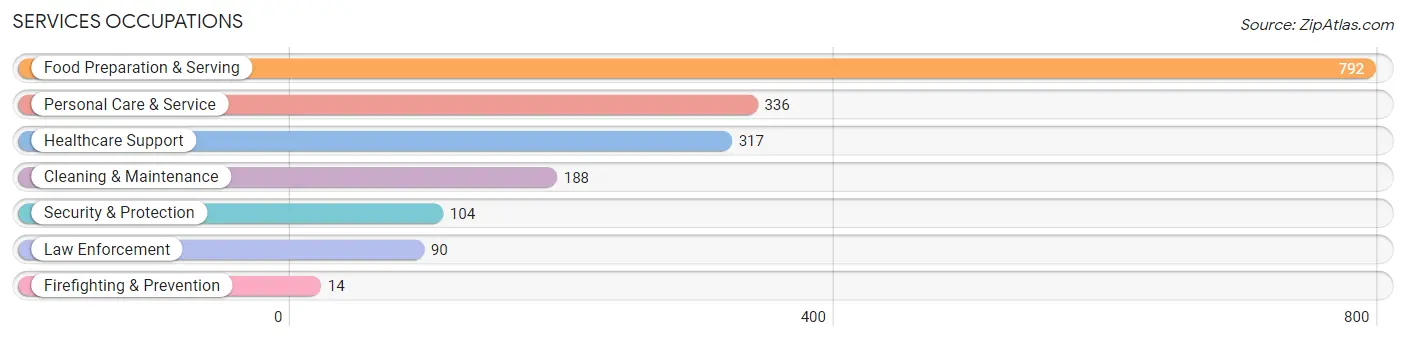
The most common Services occupations in Twentynine Palms are Food Preparation & Serving (792 | 10.9%), Personal Care & Service (336 | 4.6%), Healthcare Support (317 | 4.4%), Cleaning & Maintenance (188 | 2.6%), and Security & Protection (104 | 1.4%).
Services Occupations by Sex
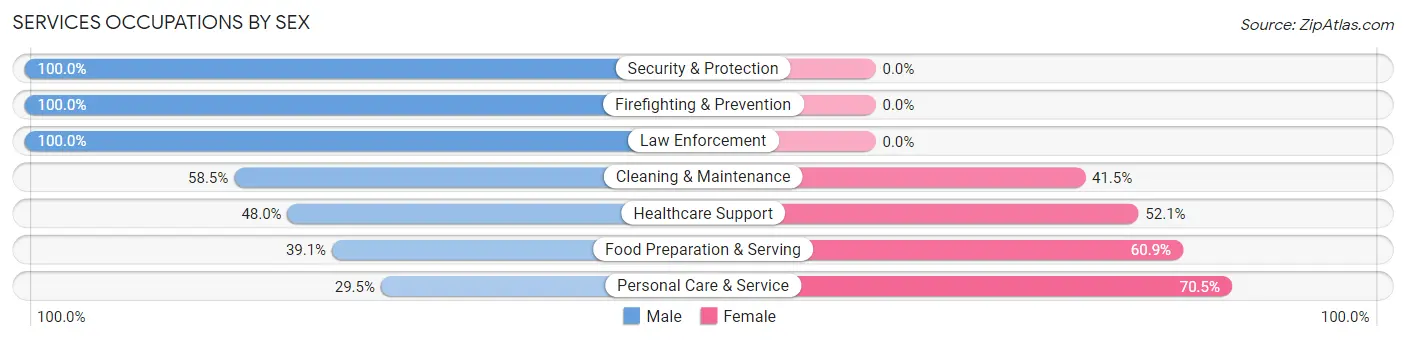
Within the Services occupations in Twentynine Palms, the most male-oriented occupations are Security & Protection (100.0%), Firefighting & Prevention (100.0%), and Law Enforcement (100.0%), while the most female-oriented occupations are Personal Care & Service (70.5%), Food Preparation & Serving (60.9%), and Healthcare Support (52.0%).
| Occupation | Male | Female |
| Healthcare Support | 152 (47.9%) | 165 (52.0%) |
| Security & Protection | 104 (100.0%) | 0 (0.0%) |
| Firefighting & Prevention | 14 (100.0%) | 0 (0.0%) |
| Law Enforcement | 90 (100.0%) | 0 (0.0%) |
| Food Preparation & Serving | 310 (39.1%) | 482 (60.9%) |
| Cleaning & Maintenance | 110 (58.5%) | 78 (41.5%) |
| Personal Care & Service | 99 (29.5%) | 237 (70.5%) |
| Total (Category) | 775 (44.6%) | 962 (55.4%) |
| Total (Overall) | 3,213 (44.3%) | 4,048 (55.7%) |
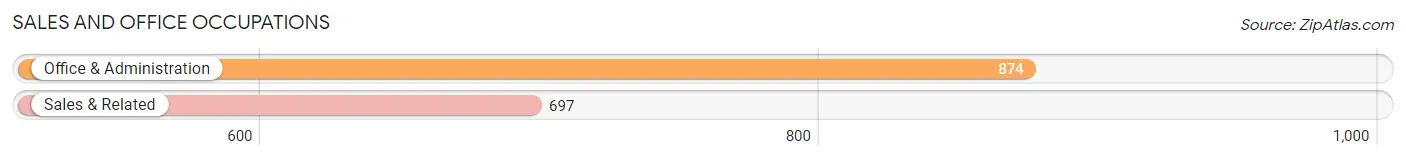
Sales and Office Occupations
The most common Sales and Office occupations in Twentynine Palms are Office & Administration (874 | 12.0%), and Sales & Related (697 | 9.6%).
Sales and Office Occupations by Sex
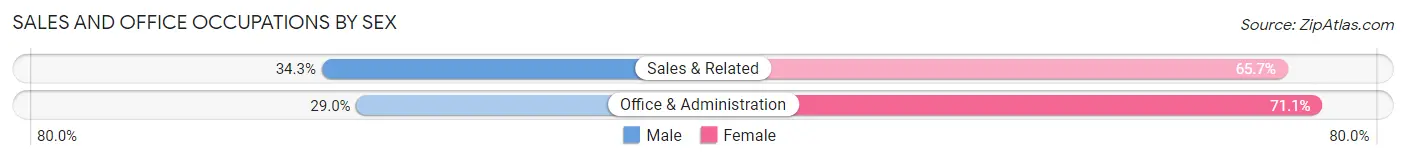
| Occupation | Male | Female |
| Sales & Related | 239 (34.3%) | 458 (65.7%) |
| Office & Administration | 253 (28.9%) | 621 (71.1%) |
| Total (Category) | 492 (31.3%) | 1,079 (68.7%) |
| Total (Overall) | 3,213 (44.3%) | 4,048 (55.7%) |
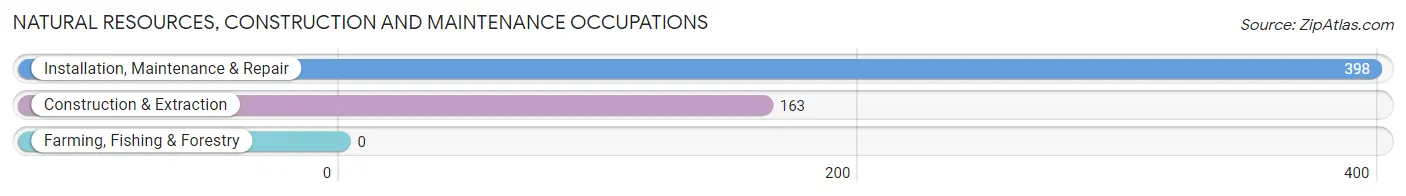
Natural Resources, Construction and Maintenance Occupations
The most common Natural Resources, Construction and Maintenance occupations in Twentynine Palms are Installation, Maintenance & Repair (398 | 5.5%), and Construction & Extraction (163 | 2.2%).
Natural Resources, Construction and Maintenance Occupations by Sex
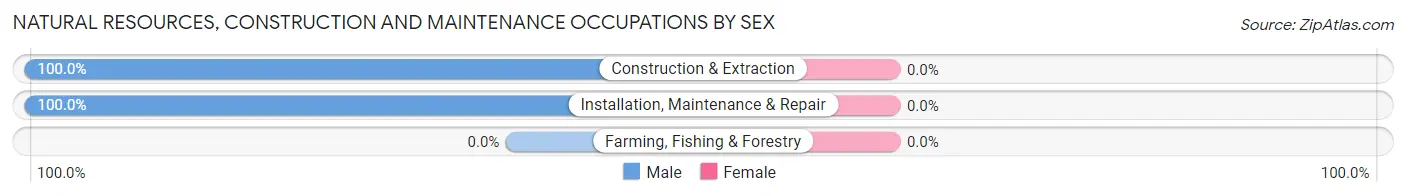
| Occupation | Male | Female |
| Farming, Fishing & Forestry | 0 (0.0%) | 0 (0.0%) |
| Construction & Extraction | 163 (100.0%) | 0 (0.0%) |
| Installation, Maintenance & Repair | 398 (100.0%) | 0 (0.0%) |
| Total (Category) | 561 (100.0%) | 0 (0.0%) |
| Total (Overall) | 3,213 (44.3%) | 4,048 (55.7%) |
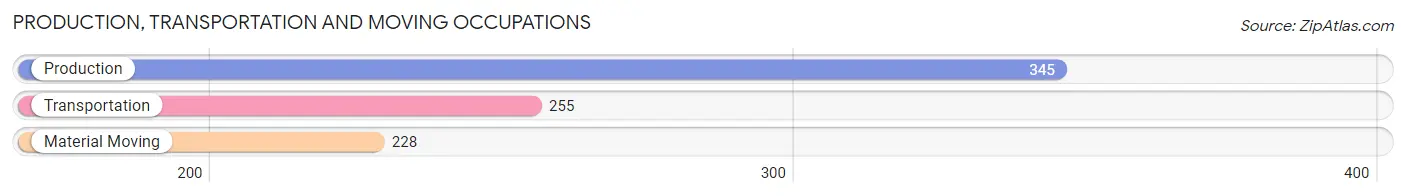
Production, Transportation and Moving Occupations
The most common Production, Transportation and Moving occupations in Twentynine Palms are Production (345 | 4.8%), Transportation (255 | 3.5%), and Material Moving (228 | 3.1%).
Production, Transportation and Moving Occupations by Sex
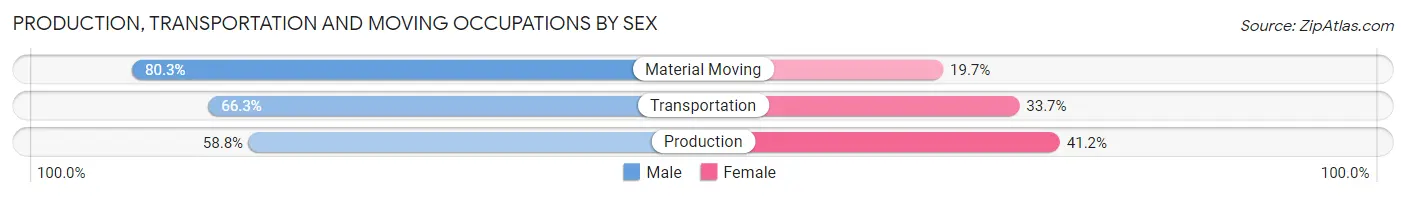
| Occupation | Male | Female |
| Production | 203 (58.8%) | 142 (41.2%) |
| Transportation | 169 (66.3%) | 86 (33.7%) |
| Material Moving | 183 (80.3%) | 45 (19.7%) |
| Total (Category) | 555 (67.0%) | 273 (33.0%) |
| Total (Overall) | 3,213 (44.3%) | 4,048 (55.7%) |
Employment Industries by Sex in Twentynine Palms
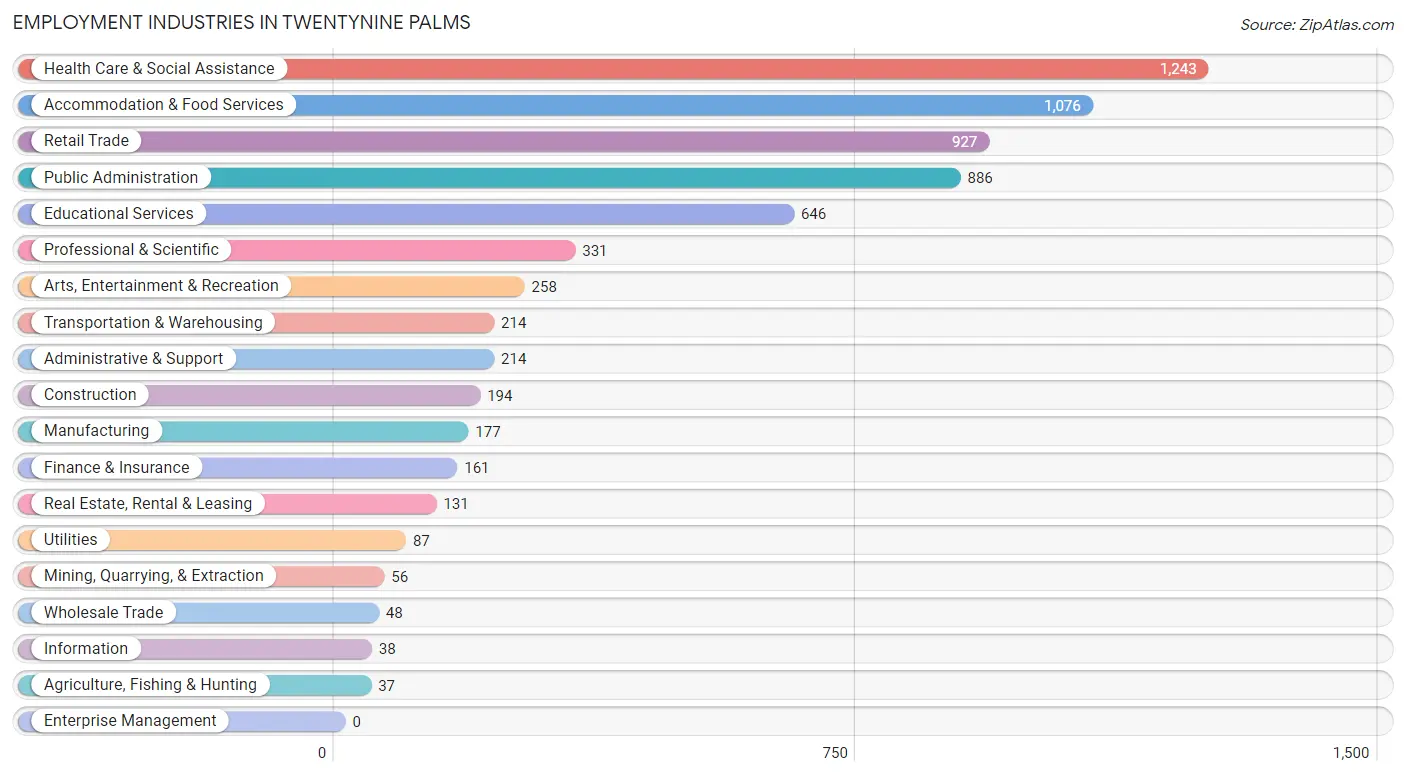
Employment Industries in Twentynine Palms
The major employment industries in Twentynine Palms include Health Care & Social Assistance (1,243 | 17.1%), Accommodation & Food Services (1,076 | 14.8%), Retail Trade (927 | 12.8%), Public Administration (886 | 12.2%), and Educational Services (646 | 8.9%).
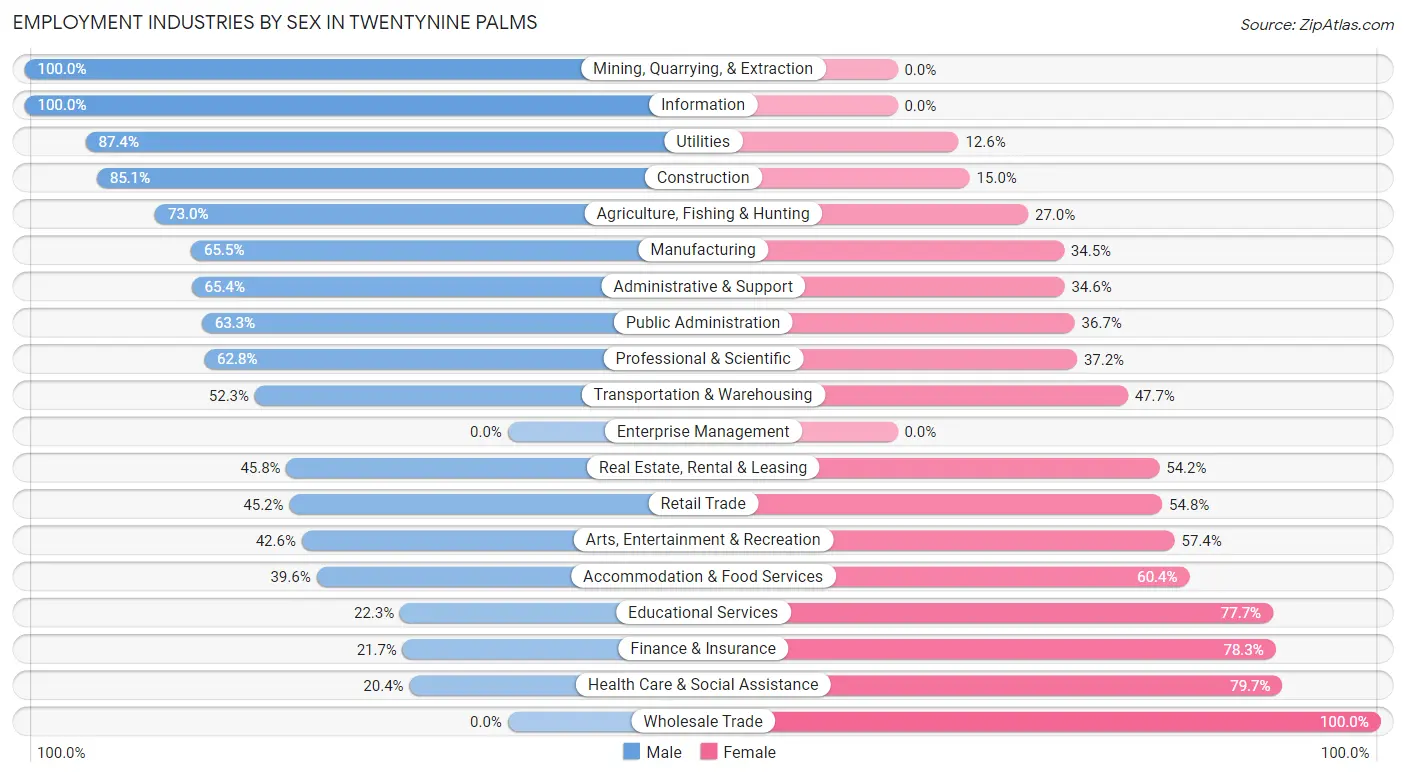
Employment Industries by Sex in Twentynine Palms
The Twentynine Palms industries that see more men than women are Mining, Quarrying, & Extraction (100.0%), Information (100.0%), and Utilities (87.4%), whereas the industries that tend to have a higher number of women are Wholesale Trade (100.0%), Health Care & Social Assistance (79.6%), and Finance & Insurance (78.3%).
| Industry | Male | Female |
| Agriculture, Fishing & Hunting | 27 (73.0%) | 10 (27.0%) |
| Mining, Quarrying, & Extraction | 56 (100.0%) | 0 (0.0%) |
| Construction | 165 (85.1%) | 29 (14.9%) |
| Manufacturing | 116 (65.5%) | 61 (34.5%) |
| Wholesale Trade | 0 (0.0%) | 48 (100.0%) |
| Retail Trade | 419 (45.2%) | 508 (54.8%) |
| Transportation & Warehousing | 112 (52.3%) | 102 (47.7%) |
| Utilities | 76 (87.4%) | 11 (12.6%) |
| Information | 38 (100.0%) | 0 (0.0%) |
| Finance & Insurance | 35 (21.7%) | 126 (78.3%) |
| Real Estate, Rental & Leasing | 60 (45.8%) | 71 (54.2%) |
| Professional & Scientific | 208 (62.8%) | 123 (37.2%) |
| Enterprise Management | 0 (0.0%) | 0 (0.0%) |
| Administrative & Support | 140 (65.4%) | 74 (34.6%) |
| Educational Services | 144 (22.3%) | 502 (77.7%) |
| Health Care & Social Assistance | 253 (20.3%) | 990 (79.6%) |
| Arts, Entertainment & Recreation | 110 (42.6%) | 148 (57.4%) |
| Accommodation & Food Services | 426 (39.6%) | 650 (60.4%) |
| Public Administration | 561 (63.3%) | 325 (36.7%) |
| Total | 3,213 (44.3%) | 4,048 (55.7%) |
Education in Twentynine Palms
School Enrollment in Twentynine Palms
The most common levels of schooling among the 6,585 students in Twentynine Palms are college / undergraduate (2,229 | 33.9%), elementary school (1,356 | 20.6%), and high school (1,140 | 17.3%).
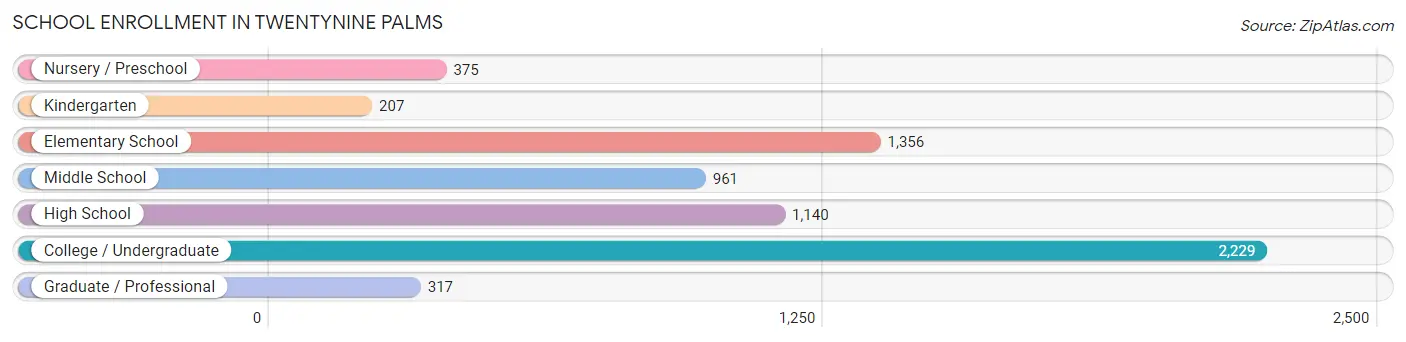
| School Level | # Students | % Students |
| Nursery / Preschool | 375 | 5.7% |
| Kindergarten | 207 | 3.1% |
| Elementary School | 1,356 | 20.6% |
| Middle School | 961 | 14.6% |
| High School | 1,140 | 17.3% |
| College / Undergraduate | 2,229 | 33.9% |
| Graduate / Professional | 317 | 4.8% |
| Total | 6,585 | 100.0% |
School Enrollment by Age by Funding Source in Twentynine Palms
Out of a total of 6,585 students who are enrolled in schools in Twentynine Palms, 1,225 (18.6%) attend a private institution, while the remaining 5,360 (81.4%) are enrolled in public schools. The age group of 18 to 19 year olds has the highest likelihood of being enrolled in private schools, with 272 (63.1% in the age bracket) enrolled. Conversely, the age group of 10 to 14 year olds has the lowest likelihood of being enrolled in a private school, with 1,077 (90.0% in the age bracket) attending a public institution.
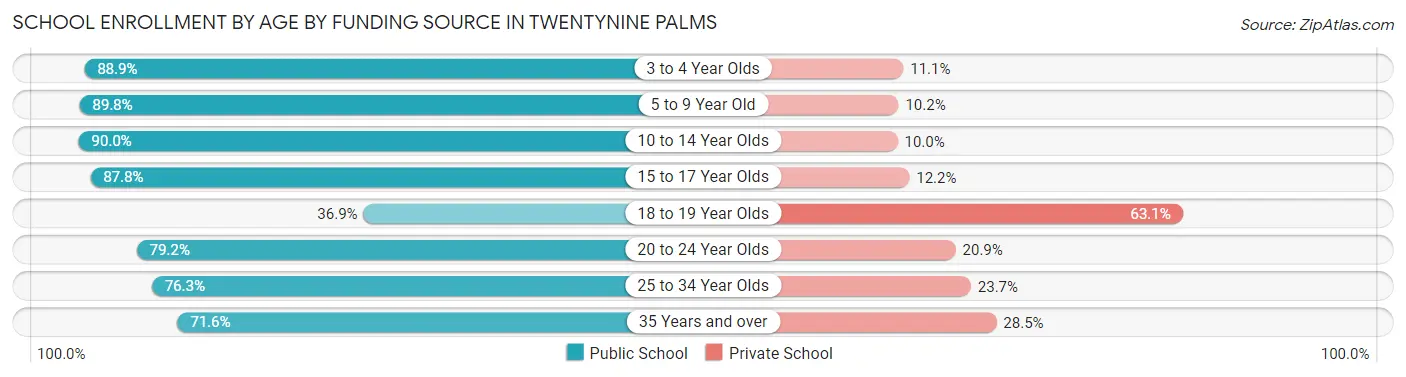
| Age Bracket | Public School | Private School |
| 3 to 4 Year Olds | 184 (88.9%) | 23 (11.1%) |
| 5 to 9 Year Old | 1,556 (89.8%) | 177 (10.2%) |
| 10 to 14 Year Olds | 1,077 (90.0%) | 120 (10.0%) |
| 15 to 17 Year Olds | 632 (87.8%) | 88 (12.2%) |
| 18 to 19 Year Olds | 159 (36.9%) | 272 (63.1%) |
| 20 to 24 Year Olds | 839 (79.1%) | 221 (20.8%) |
| 25 to 34 Year Olds | 496 (76.3%) | 154 (23.7%) |
| 35 Years and over | 420 (71.6%) | 167 (28.4%) |
| Total | 5,360 (81.4%) | 1,225 (18.6%) |
Educational Attainment by Field of Study in Twentynine Palms
Business (757 | 20.2%), psychology (449 | 12.0%), liberal arts & history (444 | 11.8%), social sciences (434 | 11.6%), and arts & humanities (344 | 9.2%) are the most common fields of study among 3,750 individuals in Twentynine Palms who have obtained a bachelor's degree or higher.
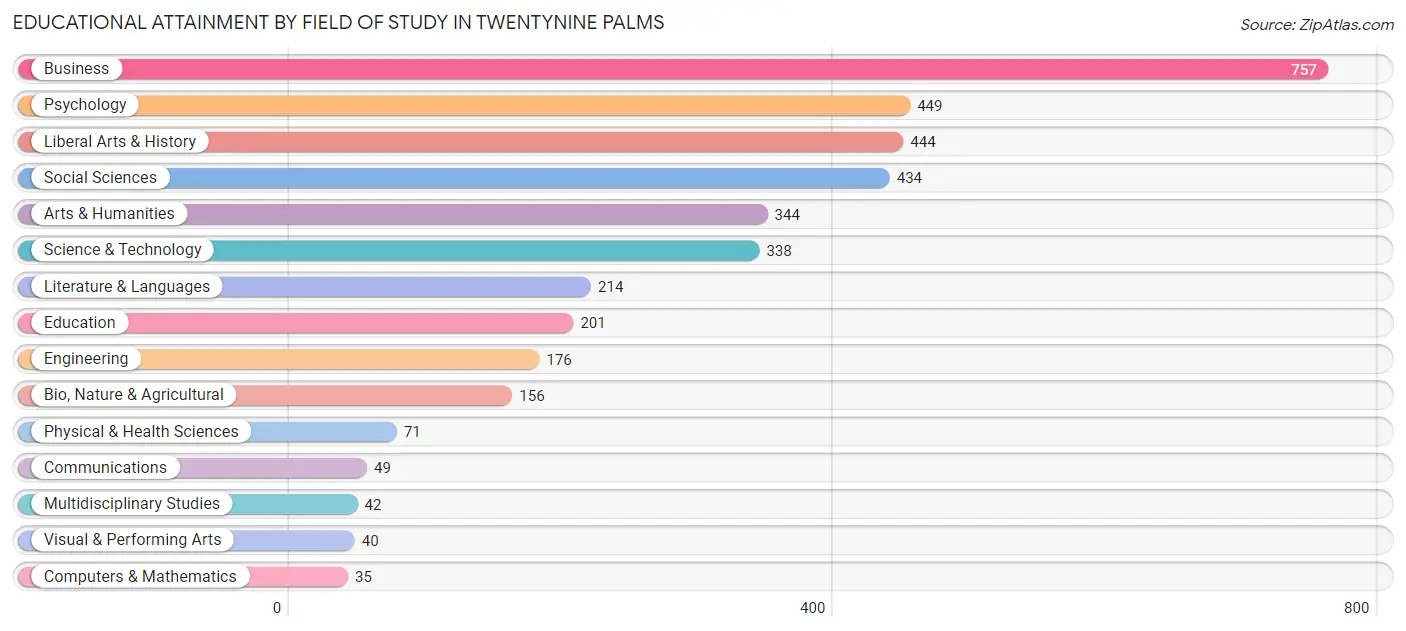
| Field of Study | # Graduates | % Graduates |
| Computers & Mathematics | 35 | 0.9% |
| Bio, Nature & Agricultural | 156 | 4.2% |
| Physical & Health Sciences | 71 | 1.9% |
| Psychology | 449 | 12.0% |
| Social Sciences | 434 | 11.6% |
| Engineering | 176 | 4.7% |
| Multidisciplinary Studies | 42 | 1.1% |
| Science & Technology | 338 | 9.0% |
| Business | 757 | 20.2% |
| Education | 201 | 5.4% |
| Literature & Languages | 214 | 5.7% |
| Liberal Arts & History | 444 | 11.8% |
| Visual & Performing Arts | 40 | 1.1% |
| Communications | 49 | 1.3% |
| Arts & Humanities | 344 | 9.2% |
| Total | 3,750 | 100.0% |
Transportation & Commute in Twentynine Palms
Vehicle Availability by Sex in Twentynine Palms
The most prevalent vehicle ownership categories in Twentynine Palms are males with 2 vehicles (3,488, accounting for 52.8%) and females with 2 vehicles (1,862, making up 82.9%).
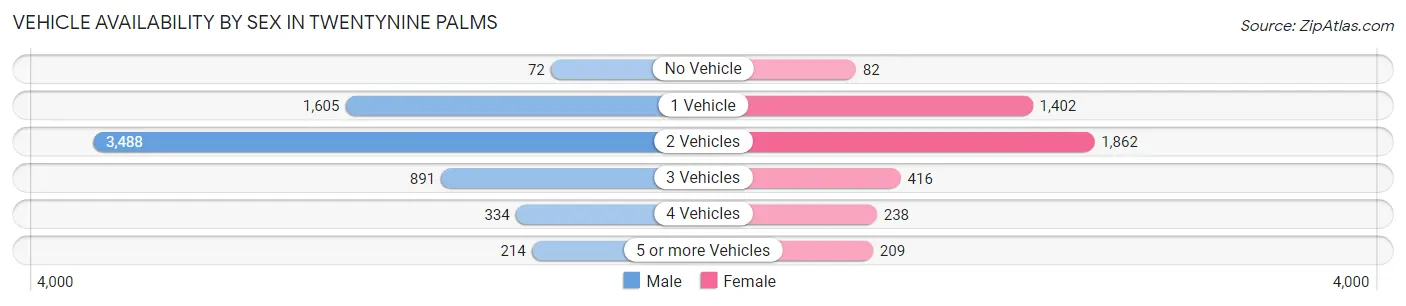
| Vehicles Available | Male | Female |
| No Vehicle | 72 (1.1%) | 82 (1.9%) |
| 1 Vehicle | 1,605 (24.3%) | 1,402 (33.3%) |
| 2 Vehicles | 3,488 (52.8%) | 1,862 (44.2%) |
| 3 Vehicles | 891 (13.5%) | 416 (9.9%) |
| 4 Vehicles | 334 (5.1%) | 238 (5.7%) |
| 5 or more Vehicles | 214 (3.2%) | 209 (5.0%) |
| Total | 6,604 (100.0%) | 4,209 (100.0%) |
Commute Time in Twentynine Palms
The most frequently occuring commute durations in Twentynine Palms are 5 to 9 minutes (4,416 commuters, 33.0%), 15 to 19 minutes (2,415 commuters, 18.0%), and 10 to 14 minutes (2,180 commuters, 16.3%).
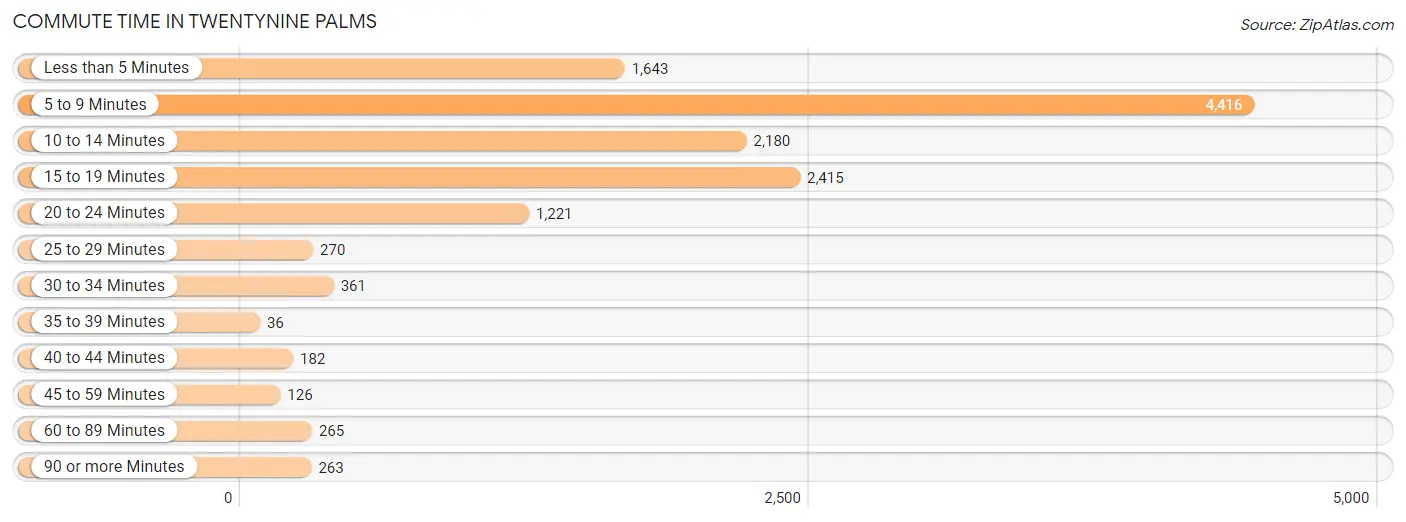
| Commute Time | # Commuters | % Commuters |
| Less than 5 Minutes | 1,643 | 12.3% |
| 5 to 9 Minutes | 4,416 | 33.0% |
| 10 to 14 Minutes | 2,180 | 16.3% |
| 15 to 19 Minutes | 2,415 | 18.0% |
| 20 to 24 Minutes | 1,221 | 9.1% |
| 25 to 29 Minutes | 270 | 2.0% |
| 30 to 34 Minutes | 361 | 2.7% |
| 35 to 39 Minutes | 36 | 0.3% |
| 40 to 44 Minutes | 182 | 1.4% |
| 45 to 59 Minutes | 126 | 0.9% |
| 60 to 89 Minutes | 265 | 2.0% |
| 90 or more Minutes | 263 | 2.0% |
Commute Time by Sex in Twentynine Palms
The most common commute times in Twentynine Palms are 5 to 9 minutes (3,258 commuters, 34.6%) for males and 5 to 9 minutes (1,158 commuters, 29.3%) for females.
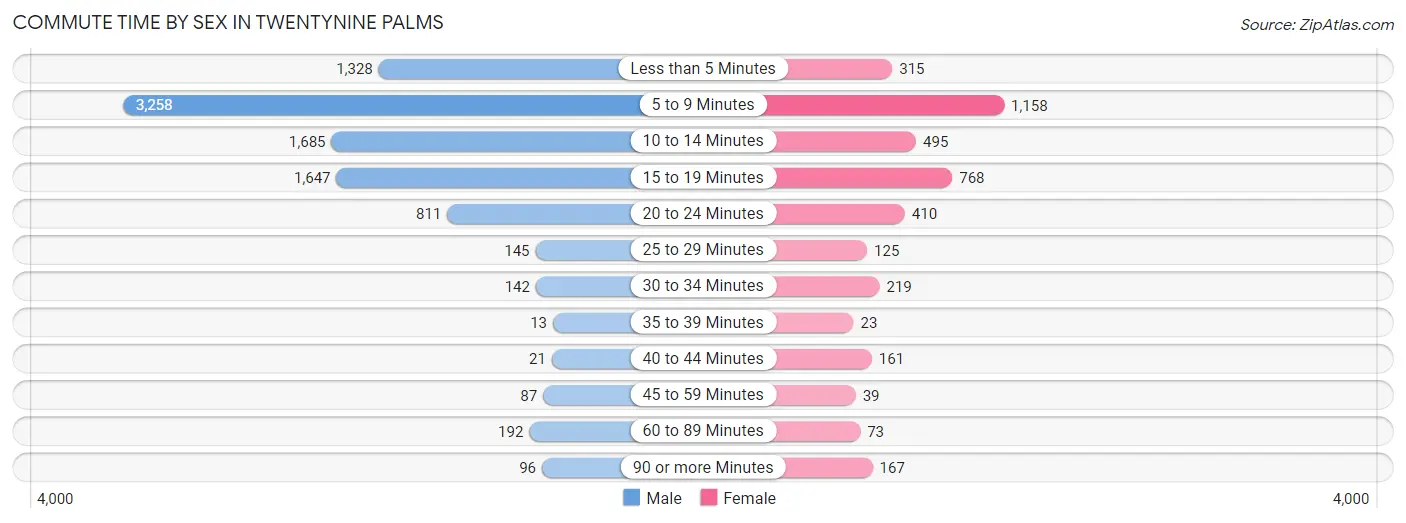
| Commute Time | Male | Female |
| Less than 5 Minutes | 1,328 (14.1%) | 315 (8.0%) |
| 5 to 9 Minutes | 3,258 (34.6%) | 1,158 (29.3%) |
| 10 to 14 Minutes | 1,685 (17.9%) | 495 (12.5%) |
| 15 to 19 Minutes | 1,647 (17.5%) | 768 (19.4%) |
| 20 to 24 Minutes | 811 (8.6%) | 410 (10.4%) |
| 25 to 29 Minutes | 145 (1.5%) | 125 (3.2%) |
| 30 to 34 Minutes | 142 (1.5%) | 219 (5.5%) |
| 35 to 39 Minutes | 13 (0.1%) | 23 (0.6%) |
| 40 to 44 Minutes | 21 (0.2%) | 161 (4.1%) |
| 45 to 59 Minutes | 87 (0.9%) | 39 (1.0%) |
| 60 to 89 Minutes | 192 (2.0%) | 73 (1.8%) |
| 90 or more Minutes | 96 (1.0%) | 167 (4.2%) |
Time of Departure to Work by Sex in Twentynine Palms
The most frequent times of departure to work in Twentynine Palms are 7:00 AM to 7:29 AM (2,191, 23.3%) for males and 7:00 AM to 7:29 AM (537, 13.6%) for females.
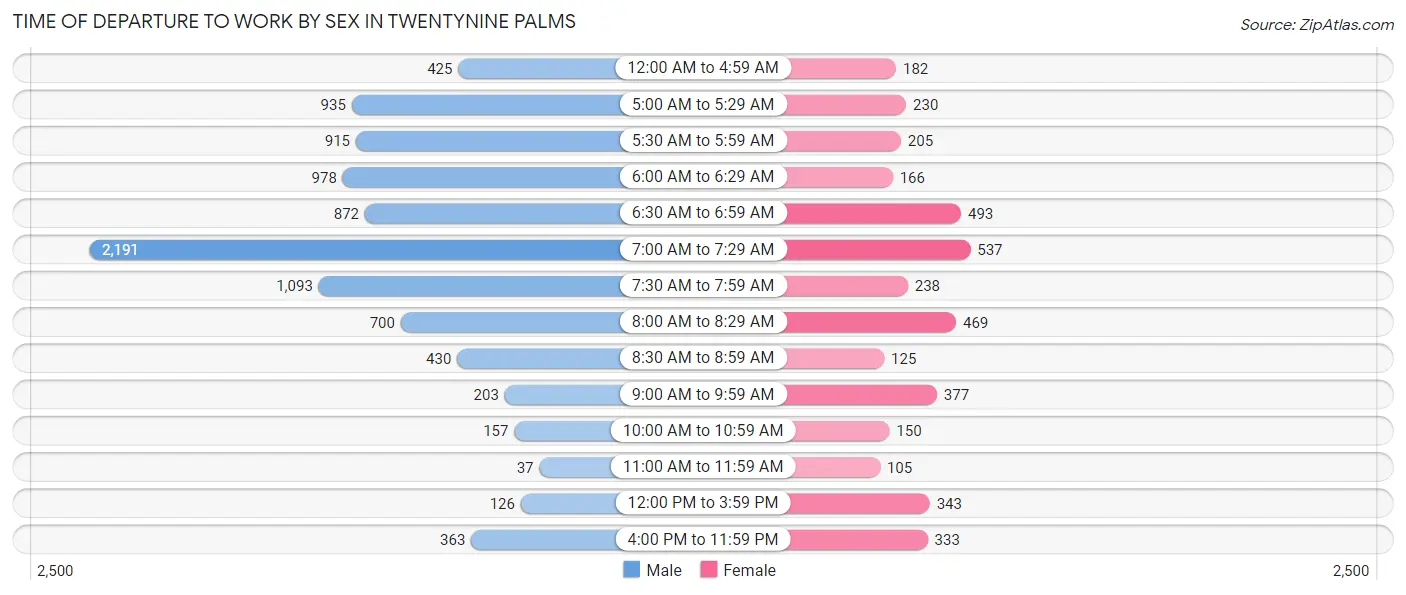
| Time of Departure | Male | Female |
| 12:00 AM to 4:59 AM | 425 (4.5%) | 182 (4.6%) |
| 5:00 AM to 5:29 AM | 935 (9.9%) | 230 (5.8%) |
| 5:30 AM to 5:59 AM | 915 (9.7%) | 205 (5.2%) |
| 6:00 AM to 6:29 AM | 978 (10.4%) | 166 (4.2%) |
| 6:30 AM to 6:59 AM | 872 (9.2%) | 493 (12.5%) |
| 7:00 AM to 7:29 AM | 2,191 (23.3%) | 537 (13.6%) |
| 7:30 AM to 7:59 AM | 1,093 (11.6%) | 238 (6.0%) |
| 8:00 AM to 8:29 AM | 700 (7.4%) | 469 (11.9%) |
| 8:30 AM to 8:59 AM | 430 (4.6%) | 125 (3.2%) |
| 9:00 AM to 9:59 AM | 203 (2.1%) | 377 (9.5%) |
| 10:00 AM to 10:59 AM | 157 (1.7%) | 150 (3.8%) |
| 11:00 AM to 11:59 AM | 37 (0.4%) | 105 (2.7%) |
| 12:00 PM to 3:59 PM | 126 (1.3%) | 343 (8.7%) |
| 4:00 PM to 11:59 PM | 363 (3.8%) | 333 (8.4%) |
| Total | 9,425 (100.0%) | 3,953 (100.0%) |
Housing Occupancy in Twentynine Palms
Occupancy by Ownership in Twentynine Palms
Of the total 9,290 dwellings in Twentynine Palms, owner-occupied units account for 3,145 (33.9%), while renter-occupied units make up 6,145 (66.1%).
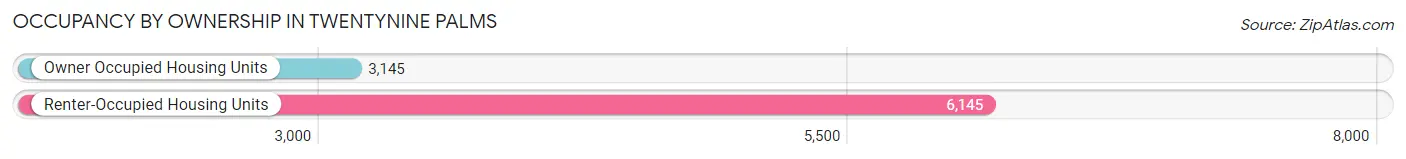
| Occupancy | # Housing Units | % Housing Units |
| Owner Occupied Housing Units | 3,145 | 33.9% |
| Renter-Occupied Housing Units | 6,145 | 66.1% |
| Total Occupied Housing Units | 9,290 | 100.0% |
Occupancy by Household Size in Twentynine Palms
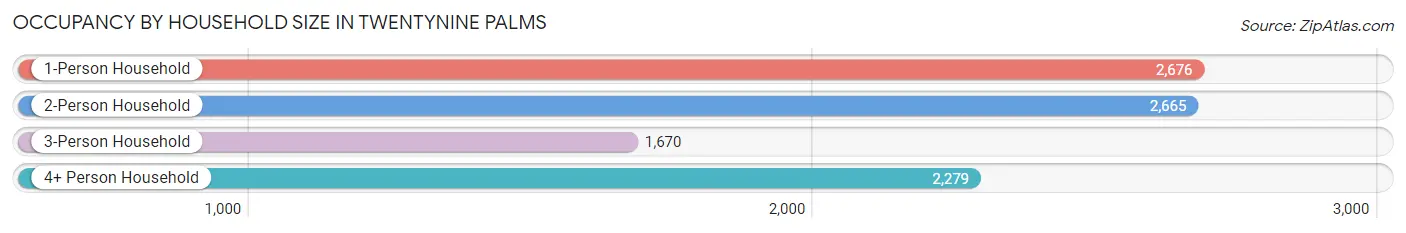
| Household Size | # Housing Units | % Housing Units |
| 1-Person Household | 2,676 | 28.8% |
| 2-Person Household | 2,665 | 28.7% |
| 3-Person Household | 1,670 | 18.0% |
| 4+ Person Household | 2,279 | 24.5% |
| Total Housing Units | 9,290 | 100.0% |
Occupancy by Ownership by Household Size in Twentynine Palms
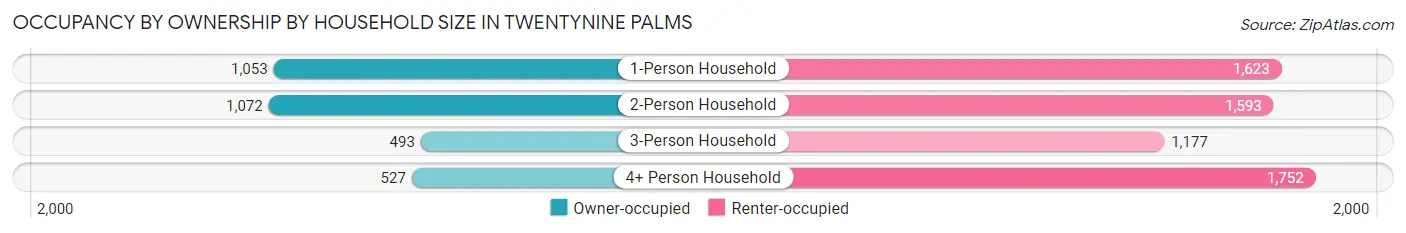
| Household Size | Owner-occupied | Renter-occupied |
| 1-Person Household | 1,053 (39.4%) | 1,623 (60.7%) |
| 2-Person Household | 1,072 (40.2%) | 1,593 (59.8%) |
| 3-Person Household | 493 (29.5%) | 1,177 (70.5%) |
| 4+ Person Household | 527 (23.1%) | 1,752 (76.9%) |
| Total Housing Units | 3,145 (33.9%) | 6,145 (66.1%) |
Occupancy by Educational Attainment in Twentynine Palms
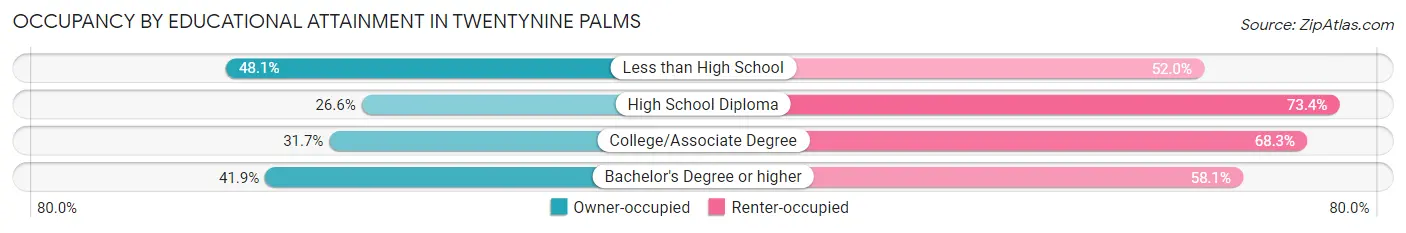
| Household Size | Owner-occupied | Renter-occupied |
| Less than High School | 296 (48.0%) | 320 (51.9%) |
| High School Diploma | 640 (26.6%) | 1,769 (73.4%) |
| College/Associate Degree | 1,289 (31.7%) | 2,778 (68.3%) |
| Bachelor's Degree or higher | 920 (41.9%) | 1,278 (58.1%) |
Occupancy by Age of Householder in Twentynine Palms
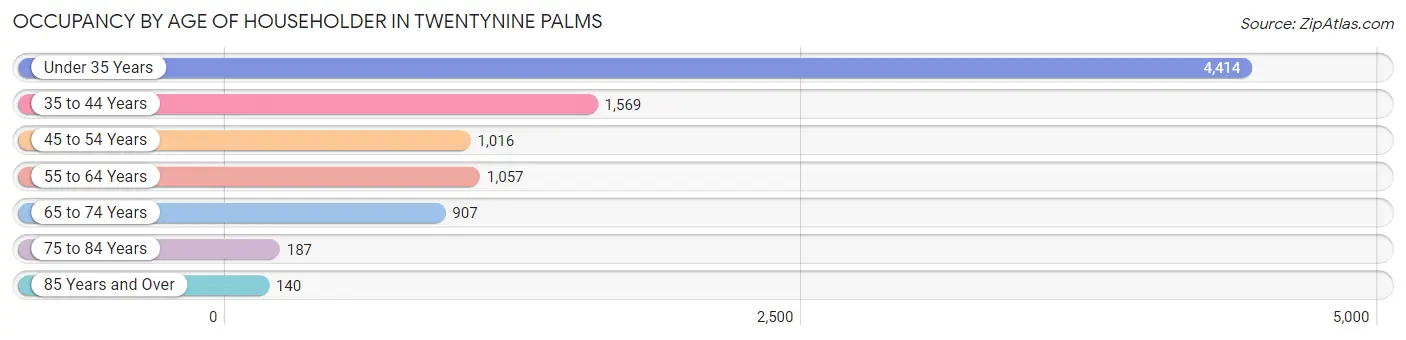
| Age Bracket | # Households | % Households |
| Under 35 Years | 4,414 | 47.5% |
| 35 to 44 Years | 1,569 | 16.9% |
| 45 to 54 Years | 1,016 | 10.9% |
| 55 to 64 Years | 1,057 | 11.4% |
| 65 to 74 Years | 907 | 9.8% |
| 75 to 84 Years | 187 | 2.0% |
| 85 Years and Over | 140 | 1.5% |
| Total | 9,290 | 100.0% |
Housing Finances in Twentynine Palms
Median Income by Occupancy in Twentynine Palms
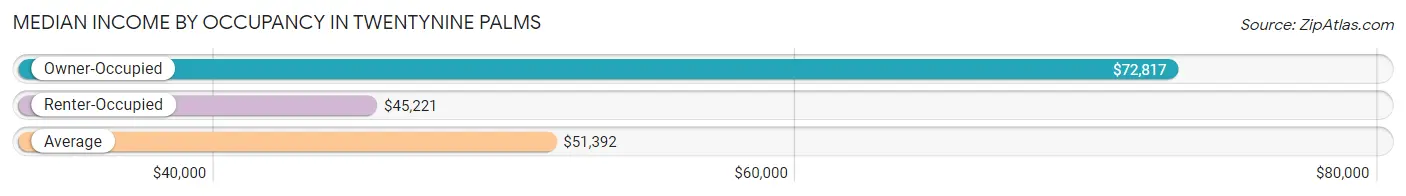
| Occupancy Type | # Households | Median Income |
| Owner-Occupied | 3,145 (33.9%) | $72,817 |
| Renter-Occupied | 6,145 (66.1%) | $45,221 |
| Average | 9,290 (100.0%) | $51,392 |
Occupancy by Householder Income Bracket in Twentynine Palms
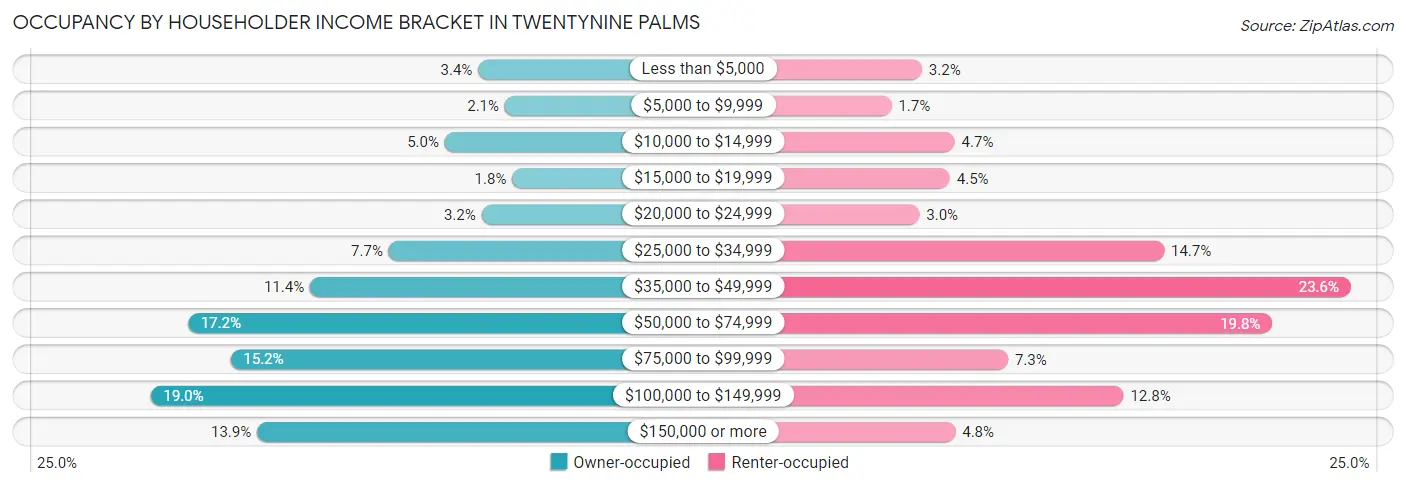
| Income Bracket | Owner-occupied | Renter-occupied |
| Less than $5,000 | 107 (3.4%) | 194 (3.2%) |
| $5,000 to $9,999 | 67 (2.1%) | 105 (1.7%) |
| $10,000 to $14,999 | 157 (5.0%) | 290 (4.7%) |
| $15,000 to $19,999 | 56 (1.8%) | 276 (4.5%) |
| $20,000 to $24,999 | 102 (3.2%) | 187 (3.0%) |
| $25,000 to $34,999 | 241 (7.7%) | 903 (14.7%) |
| $35,000 to $49,999 | 359 (11.4%) | 1,449 (23.6%) |
| $50,000 to $74,999 | 542 (17.2%) | 1,219 (19.8%) |
| $75,000 to $99,999 | 478 (15.2%) | 446 (7.3%) |
| $100,000 to $149,999 | 598 (19.0%) | 784 (12.8%) |
| $150,000 or more | 438 (13.9%) | 292 (4.8%) |
| Total | 3,145 (100.0%) | 6,145 (100.0%) |
Monthly Housing Cost Tiers in Twentynine Palms
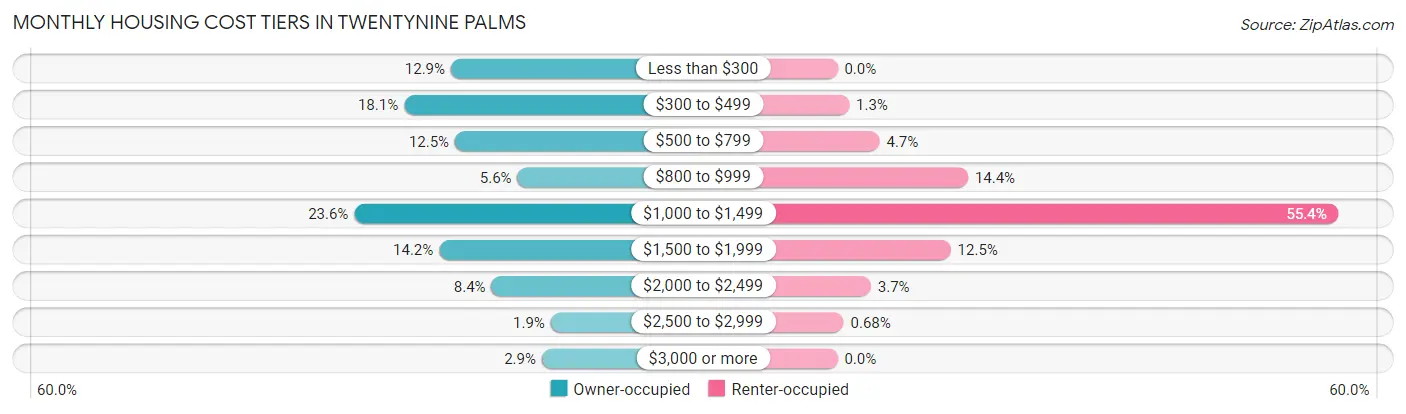
| Monthly Cost | Owner-occupied | Renter-occupied |
| Less than $300 | 406 (12.9%) | 0 (0.0%) |
| $300 to $499 | 569 (18.1%) | 79 (1.3%) |
| $500 to $799 | 392 (12.5%) | 286 (4.6%) |
| $800 to $999 | 175 (5.6%) | 886 (14.4%) |
| $1,000 to $1,499 | 742 (23.6%) | 3,402 (55.4%) |
| $1,500 to $1,999 | 447 (14.2%) | 769 (12.5%) |
| $2,000 to $2,499 | 265 (8.4%) | 227 (3.7%) |
| $2,500 to $2,999 | 59 (1.9%) | 42 (0.7%) |
| $3,000 or more | 90 (2.9%) | 0 (0.0%) |
| Total | 3,145 (100.0%) | 6,145 (100.0%) |
Physical Housing Characteristics in Twentynine Palms
Housing Structures in Twentynine Palms
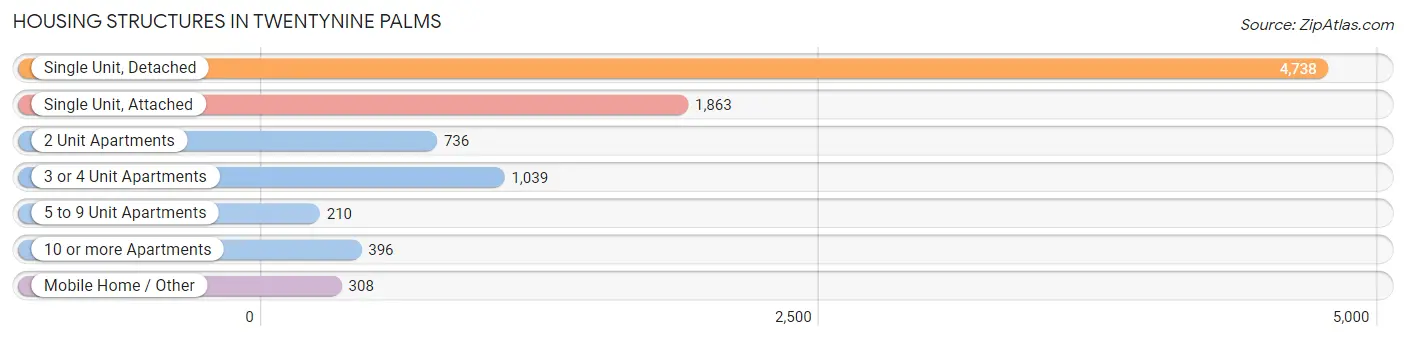
| Structure Type | # Housing Units | % Housing Units |
| Single Unit, Detached | 4,738 | 51.0% |
| Single Unit, Attached | 1,863 | 20.1% |
| 2 Unit Apartments | 736 | 7.9% |
| 3 or 4 Unit Apartments | 1,039 | 11.2% |
| 5 to 9 Unit Apartments | 210 | 2.3% |
| 10 or more Apartments | 396 | 4.3% |
| Mobile Home / Other | 308 | 3.3% |
| Total | 9,290 | 100.0% |
Housing Structures by Occupancy in Twentynine Palms
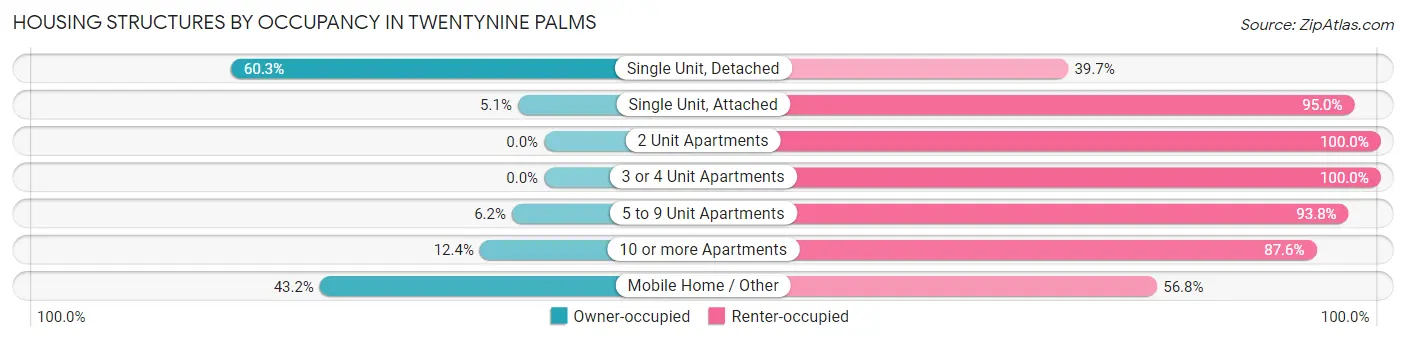
| Structure Type | Owner-occupied | Renter-occupied |
| Single Unit, Detached | 2,856 (60.3%) | 1,882 (39.7%) |
| Single Unit, Attached | 94 (5.1%) | 1,769 (95.0%) |
| 2 Unit Apartments | 0 (0.0%) | 736 (100.0%) |
| 3 or 4 Unit Apartments | 0 (0.0%) | 1,039 (100.0%) |
| 5 to 9 Unit Apartments | 13 (6.2%) | 197 (93.8%) |
| 10 or more Apartments | 49 (12.4%) | 347 (87.6%) |
| Mobile Home / Other | 133 (43.2%) | 175 (56.8%) |
| Total | 3,145 (33.9%) | 6,145 (66.1%) |
Housing Structures by Number of Rooms in Twentynine Palms
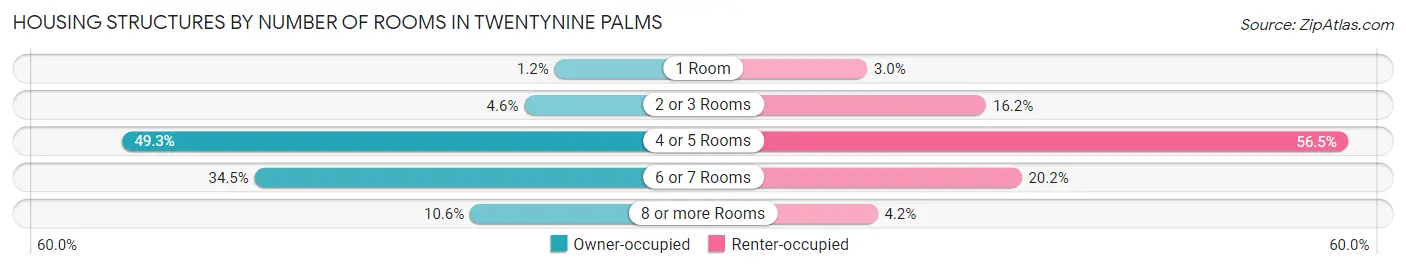
| Number of Rooms | Owner-occupied | Renter-occupied |
| 1 Room | 37 (1.2%) | 185 (3.0%) |
| 2 or 3 Rooms | 143 (4.5%) | 997 (16.2%) |
| 4 or 5 Rooms | 1,549 (49.2%) | 3,469 (56.5%) |
| 6 or 7 Rooms | 1,084 (34.5%) | 1,238 (20.2%) |
| 8 or more Rooms | 332 (10.6%) | 256 (4.2%) |
| Total | 3,145 (100.0%) | 6,145 (100.0%) |
Housing Structure by Heating Type in Twentynine Palms
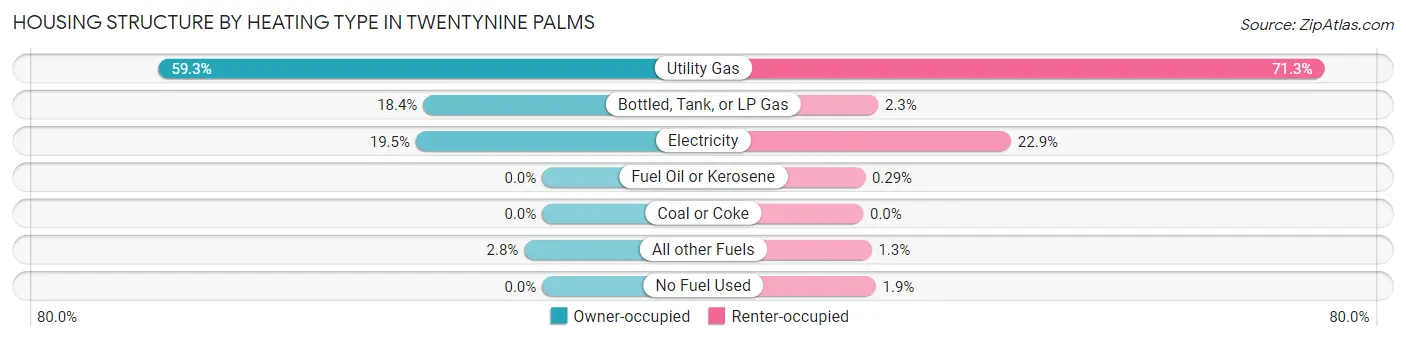
| Heating Type | Owner-occupied | Renter-occupied |
| Utility Gas | 1,866 (59.3%) | 4,381 (71.3%) |
| Bottled, Tank, or LP Gas | 578 (18.4%) | 142 (2.3%) |
| Electricity | 614 (19.5%) | 1,405 (22.9%) |
| Fuel Oil or Kerosene | 0 (0.0%) | 18 (0.3%) |
| Coal or Coke | 0 (0.0%) | 0 (0.0%) |
| All other Fuels | 87 (2.8%) | 80 (1.3%) |
| No Fuel Used | 0 (0.0%) | 119 (1.9%) |
| Total | 3,145 (100.0%) | 6,145 (100.0%) |
Household Vehicle Usage in Twentynine Palms
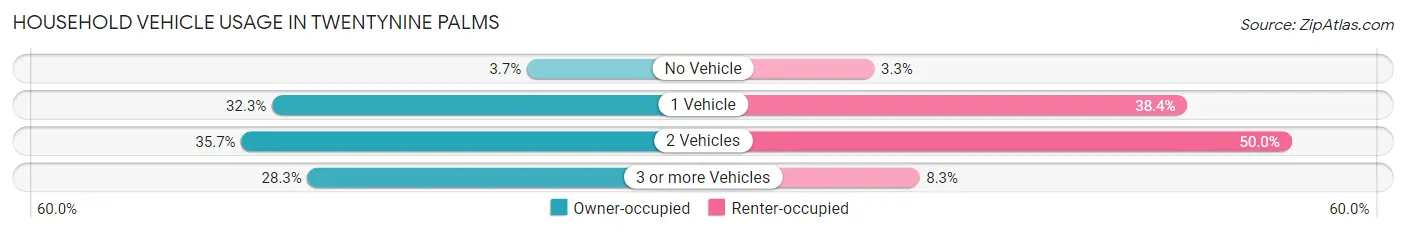
| Vehicles per Household | Owner-occupied | Renter-occupied |
| No Vehicle | 117 (3.7%) | 201 (3.3%) |
| 1 Vehicle | 1,015 (32.3%) | 2,357 (38.4%) |
| 2 Vehicles | 1,123 (35.7%) | 3,075 (50.0%) |
| 3 or more Vehicles | 890 (28.3%) | 512 (8.3%) |
| Total | 3,145 (100.0%) | 6,145 (100.0%) |
Real Estate & Mortgages in Twentynine Palms
Real Estate and Mortgage Overview in Twentynine Palms
| Characteristic | Without Mortgage | With Mortgage |
| Housing Units | 1,250 | 1,895 |
| Median Property Value | $186,100 | $226,300 |
| Median Household Income | $45,556 | $369 |
| Monthly Housing Costs | $391 | $90 |
| Real Estate Taxes | $1,442 | $106 |
Property Value by Mortgage Status in Twentynine Palms
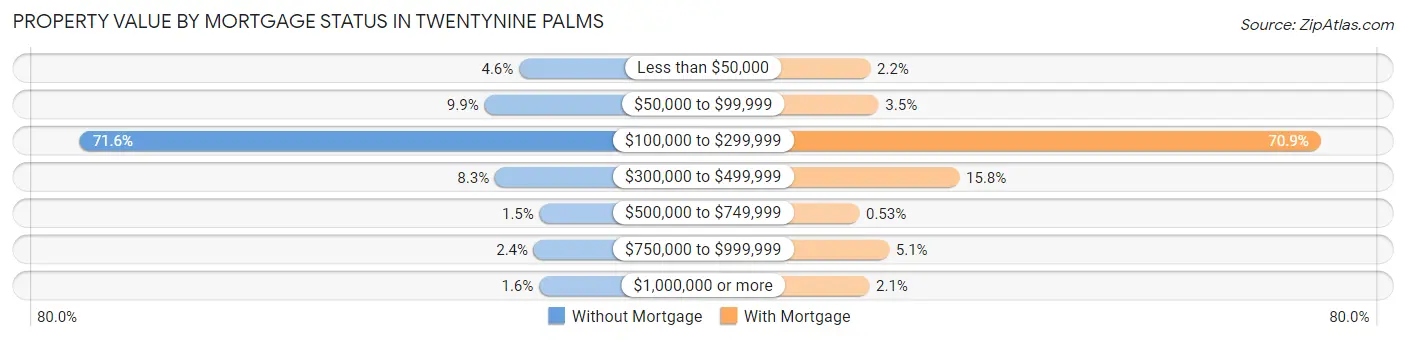
| Property Value | Without Mortgage | With Mortgage |
| Less than $50,000 | 58 (4.6%) | 42 (2.2%) |
| $50,000 to $99,999 | 124 (9.9%) | 66 (3.5%) |
| $100,000 to $299,999 | 895 (71.6%) | 1,343 (70.9%) |
| $300,000 to $499,999 | 104 (8.3%) | 299 (15.8%) |
| $500,000 to $749,999 | 19 (1.5%) | 10 (0.5%) |
| $750,000 to $999,999 | 30 (2.4%) | 96 (5.1%) |
| $1,000,000 or more | 20 (1.6%) | 39 (2.1%) |
| Total | 1,250 (100.0%) | 1,895 (100.0%) |
Household Income by Mortgage Status in Twentynine Palms
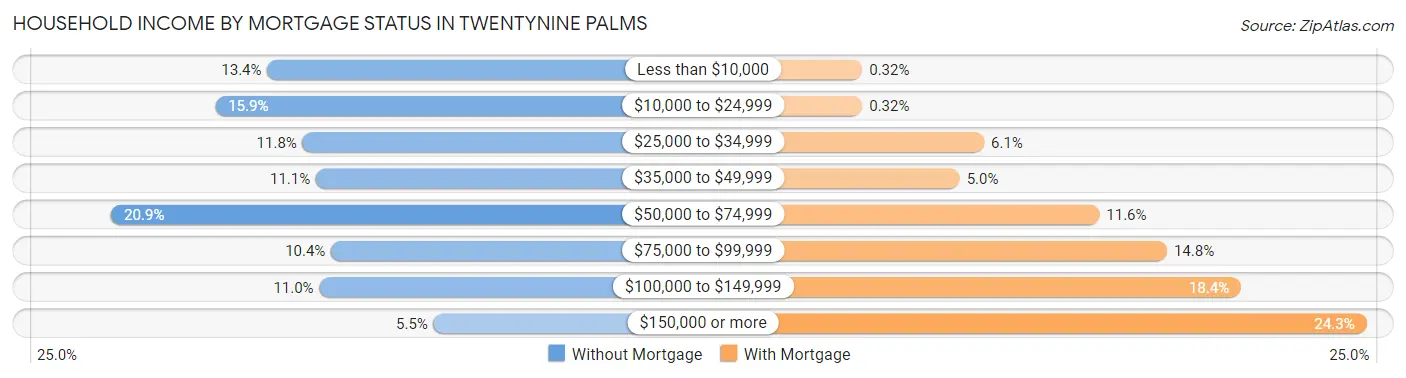
| Household Income | Without Mortgage | With Mortgage |
| Less than $10,000 | 168 (13.4%) | 6 (0.3%) |
| $10,000 to $24,999 | 199 (15.9%) | 6 (0.3%) |
| $25,000 to $34,999 | 147 (11.8%) | 116 (6.1%) |
| $35,000 to $49,999 | 139 (11.1%) | 94 (5.0%) |
| $50,000 to $74,999 | 261 (20.9%) | 220 (11.6%) |
| $75,000 to $99,999 | 130 (10.4%) | 281 (14.8%) |
| $100,000 to $149,999 | 137 (11.0%) | 348 (18.4%) |
| $150,000 or more | 69 (5.5%) | 461 (24.3%) |
| Total | 1,250 (100.0%) | 1,895 (100.0%) |
Property Value to Household Income Ratio in Twentynine Palms
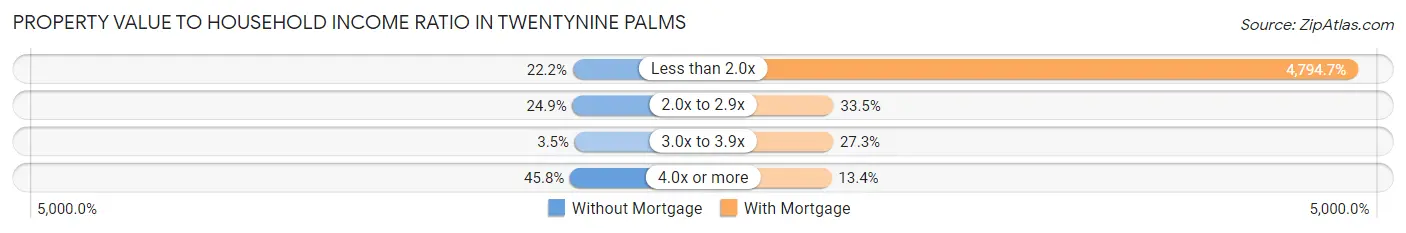
| Value-to-Income Ratio | Without Mortgage | With Mortgage |
| Less than 2.0x | 278 (22.2%) | 90,859 (4,794.7%) |
| 2.0x to 2.9x | 311 (24.9%) | 635 (33.5%) |
| 3.0x to 3.9x | 44 (3.5%) | 518 (27.3%) |
| 4.0x or more | 572 (45.8%) | 254 (13.4%) |
| Total | 1,250 (100.0%) | 1,895 (100.0%) |
Real Estate Taxes by Mortgage Status in Twentynine Palms
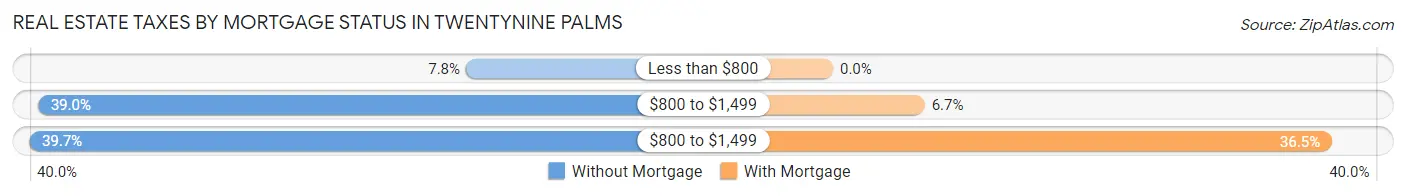
| Property Taxes | Without Mortgage | With Mortgage |
| Less than $800 | 97 (7.8%) | 0 (0.0%) |
| $800 to $1,499 | 488 (39.0%) | 127 (6.7%) |
| $800 to $1,499 | 496 (39.7%) | 691 (36.5%) |
| Total | 1,250 (100.0%) | 1,895 (100.0%) |
Health & Disability in Twentynine Palms
Health Insurance Coverage by Age in Twentynine Palms
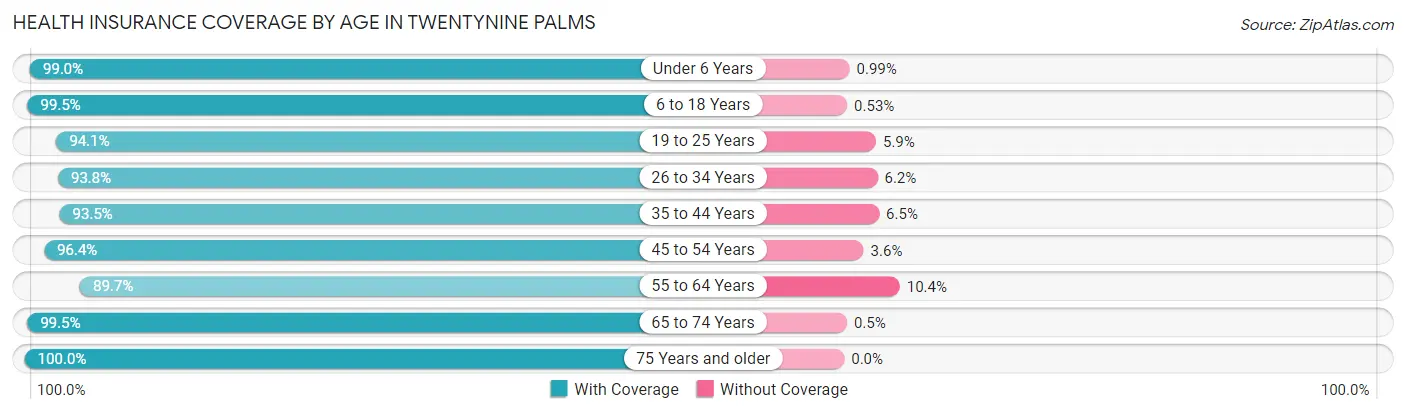
| Age Bracket | With Coverage | Without Coverage |
| Under 6 Years | 3,704 (99.0%) | 37 (1.0%) |
| 6 to 18 Years | 3,756 (99.5%) | 20 (0.5%) |
| 19 to 25 Years | 2,748 (94.1%) | 173 (5.9%) |
| 26 to 34 Years | 2,827 (93.8%) | 187 (6.2%) |
| 35 to 44 Years | 2,057 (93.5%) | 143 (6.5%) |
| 45 to 54 Years | 1,600 (96.4%) | 60 (3.6%) |
| 55 to 64 Years | 1,473 (89.6%) | 170 (10.3%) |
| 65 to 74 Years | 1,192 (99.5%) | 6 (0.5%) |
| 75 Years and older | 547 (100.0%) | 0 (0.0%) |
| Total | 19,904 (96.2%) | 796 (3.8%) |
Health Insurance Coverage by Citizenship Status in Twentynine Palms
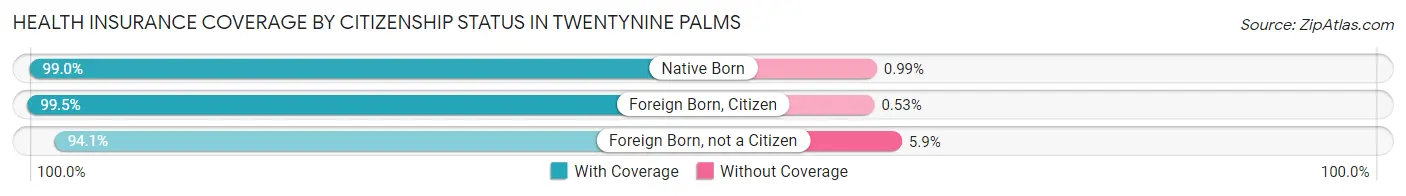
| Citizenship Status | With Coverage | Without Coverage |
| Native Born | 3,704 (99.0%) | 37 (1.0%) |
| Foreign Born, Citizen | 3,756 (99.5%) | 20 (0.5%) |
| Foreign Born, not a Citizen | 2,748 (94.1%) | 173 (5.9%) |
Health Insurance Coverage by Household Income in Twentynine Palms
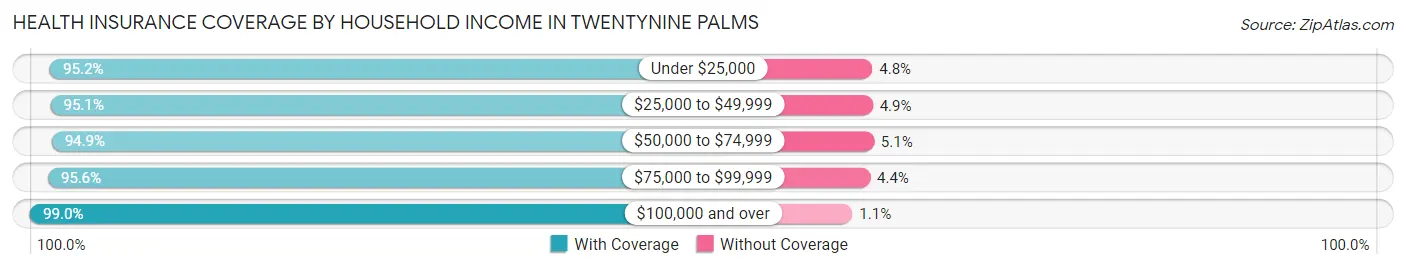
| Household Income | With Coverage | Without Coverage |
| Under $25,000 | 2,944 (95.2%) | 148 (4.8%) |
| $25,000 to $49,999 | 6,422 (95.1%) | 328 (4.9%) |
| $50,000 to $74,999 | 3,085 (94.9%) | 165 (5.1%) |
| $75,000 to $99,999 | 2,174 (95.6%) | 99 (4.4%) |
| $100,000 and over | 5,279 (99.0%) | 56 (1.1%) |
Public vs Private Health Insurance Coverage by Age in Twentynine Palms
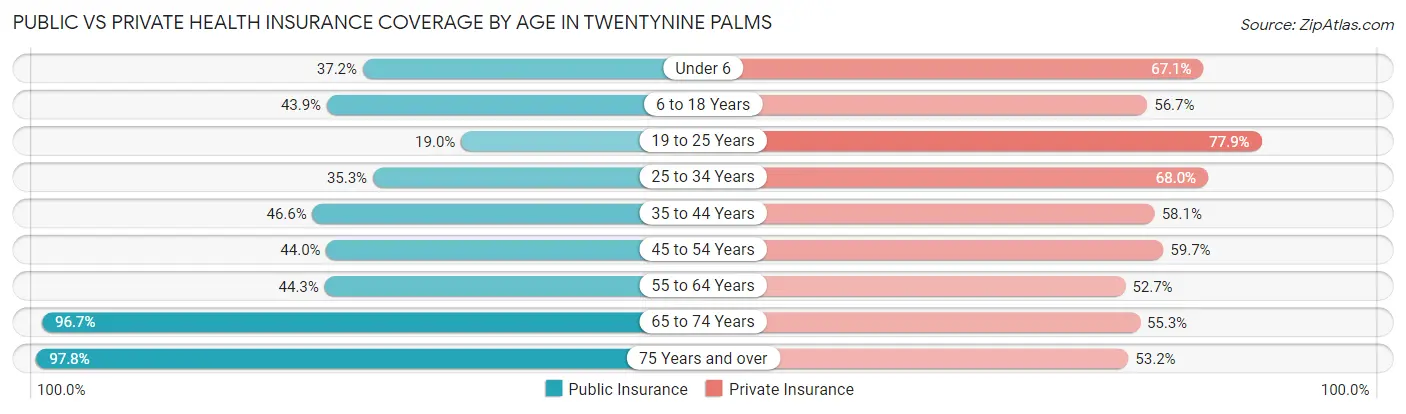
| Age Bracket | Public Insurance | Private Insurance |
| Under 6 | 1,392 (37.2%) | 2,510 (67.1%) |
| 6 to 18 Years | 1,657 (43.9%) | 2,141 (56.7%) |
| 19 to 25 Years | 554 (19.0%) | 2,275 (77.9%) |
| 25 to 34 Years | 1,065 (35.3%) | 2,048 (67.9%) |
| 35 to 44 Years | 1,024 (46.6%) | 1,278 (58.1%) |
| 45 to 54 Years | 730 (44.0%) | 991 (59.7%) |
| 55 to 64 Years | 728 (44.3%) | 865 (52.6%) |
| 65 to 74 Years | 1,159 (96.7%) | 663 (55.3%) |
| 75 Years and over | 535 (97.8%) | 291 (53.2%) |
| Total | 8,844 (42.7%) | 13,062 (63.1%) |
Disability Status by Sex by Age in Twentynine Palms
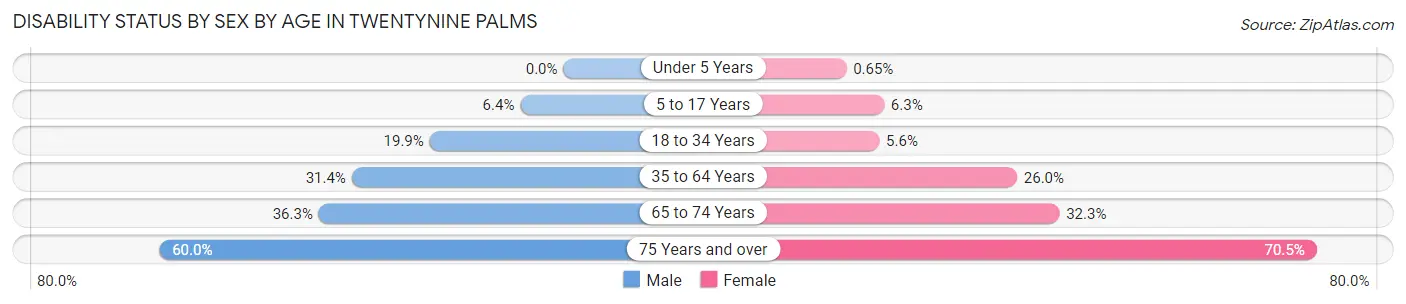
| Age Bracket | Male | Female |
| Under 5 Years | 0 (0.0%) | 11 (0.6%) |
| 5 to 17 Years | 139 (6.4%) | 110 (6.2%) |
| 18 to 34 Years | 311 (19.9%) | 250 (5.6%) |
| 35 to 64 Years | 765 (31.4%) | 798 (26.0%) |
| 65 to 74 Years | 227 (36.3%) | 185 (32.3%) |
| 75 Years and over | 141 (60.0%) | 220 (70.5%) |
Disability Class by Sex by Age in Twentynine Palms
Disability Class: Hearing Difficulty
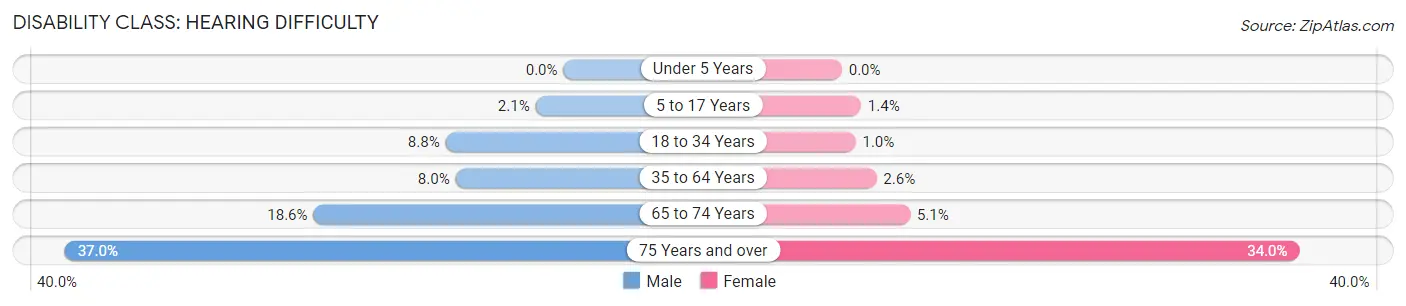
| Age Bracket | Male | Female |
| Under 5 Years | 0 (0.0%) | 0 (0.0%) |
| 5 to 17 Years | 45 (2.1%) | 25 (1.4%) |
| 18 to 34 Years | 137 (8.7%) | 46 (1.0%) |
| 35 to 64 Years | 195 (8.0%) | 79 (2.6%) |
| 65 to 74 Years | 116 (18.6%) | 29 (5.1%) |
| 75 Years and over | 87 (37.0%) | 106 (34.0%) |
Disability Class: Vision Difficulty
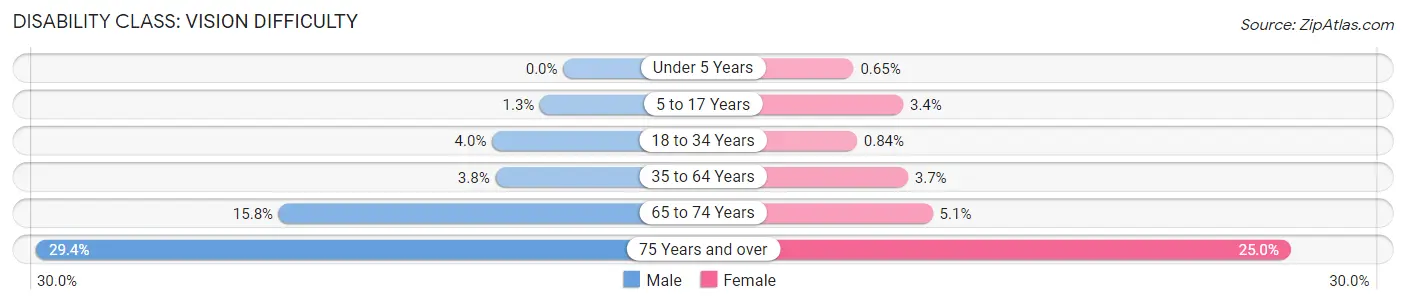
| Age Bracket | Male | Female |
| Under 5 Years | 0 (0.0%) | 11 (0.6%) |
| 5 to 17 Years | 28 (1.3%) | 60 (3.4%) |
| 18 to 34 Years | 62 (4.0%) | 38 (0.8%) |
| 35 to 64 Years | 92 (3.8%) | 113 (3.7%) |
| 65 to 74 Years | 99 (15.8%) | 29 (5.1%) |
| 75 Years and over | 69 (29.4%) | 78 (25.0%) |
Disability Class: Cognitive Difficulty
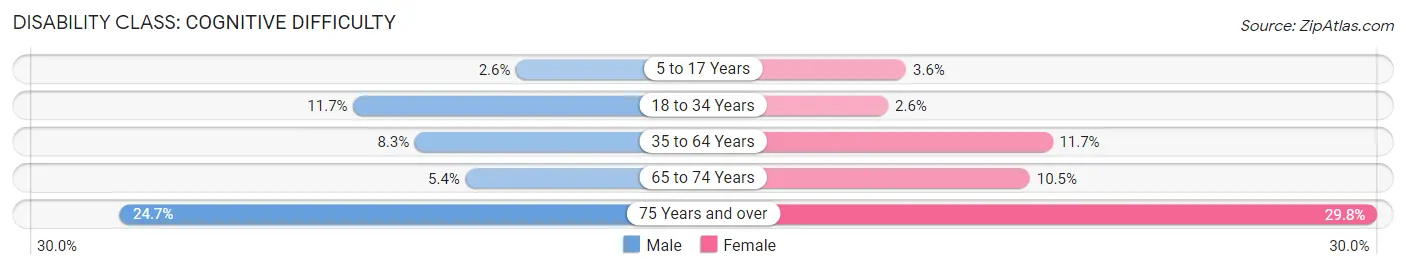
| Age Bracket | Male | Female |
| 5 to 17 Years | 57 (2.6%) | 63 (3.6%) |
| 18 to 34 Years | 183 (11.7%) | 116 (2.6%) |
| 35 to 64 Years | 201 (8.3%) | 360 (11.7%) |
| 65 to 74 Years | 34 (5.4%) | 60 (10.5%) |
| 75 Years and over | 58 (24.7%) | 93 (29.8%) |
Disability Class: Ambulatory Difficulty
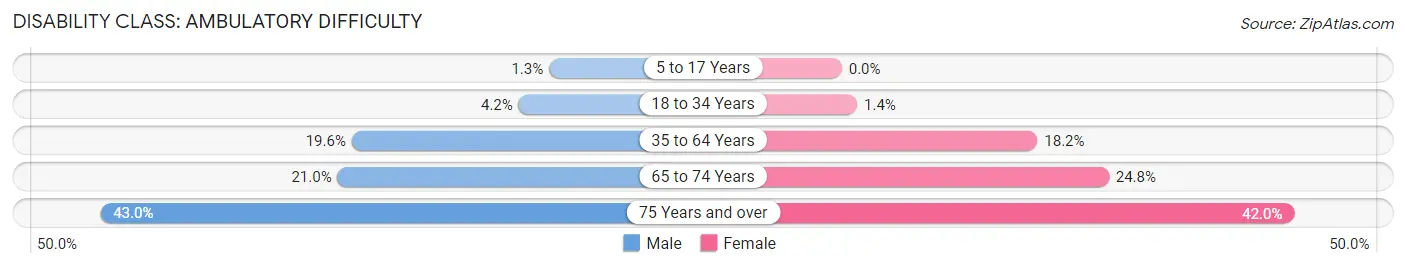
| Age Bracket | Male | Female |
| 5 to 17 Years | 29 (1.3%) | 0 (0.0%) |
| 18 to 34 Years | 65 (4.2%) | 64 (1.4%) |
| 35 to 64 Years | 478 (19.6%) | 557 (18.1%) |
| 65 to 74 Years | 131 (21.0%) | 142 (24.8%) |
| 75 Years and over | 101 (43.0%) | 131 (42.0%) |
Disability Class: Self-Care Difficulty
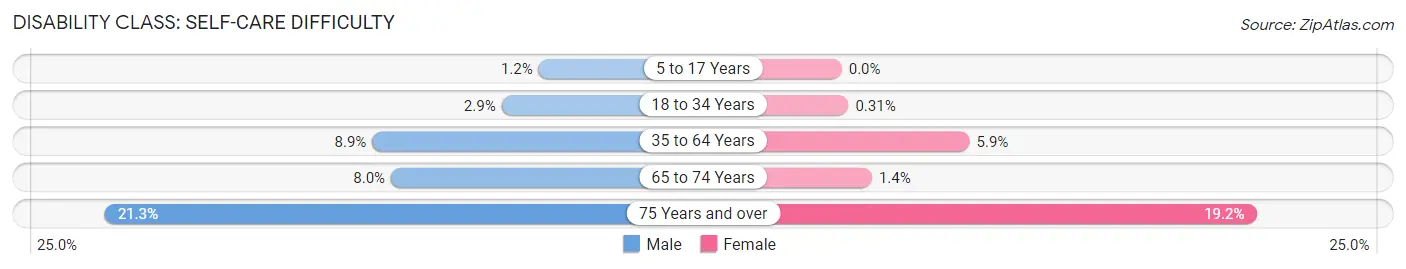
| Age Bracket | Male | Female |
| 5 to 17 Years | 25 (1.1%) | 0 (0.0%) |
| 18 to 34 Years | 45 (2.9%) | 14 (0.3%) |
| 35 to 64 Years | 216 (8.9%) | 182 (5.9%) |
| 65 to 74 Years | 50 (8.0%) | 8 (1.4%) |
| 75 Years and over | 50 (21.3%) | 60 (19.2%) |
Technology Access in Twentynine Palms
Computing Device Access in Twentynine Palms
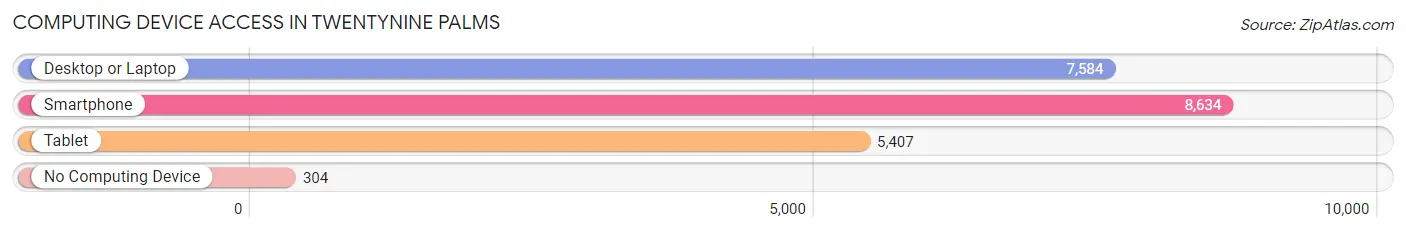
| Device Type | # Households | % Households |
| Desktop or Laptop | 7,584 | 81.6% |
| Smartphone | 8,634 | 92.9% |
| Tablet | 5,407 | 58.2% |
| No Computing Device | 304 | 3.3% |
| Total | 9,290 | 100.0% |
Internet Access in Twentynine Palms
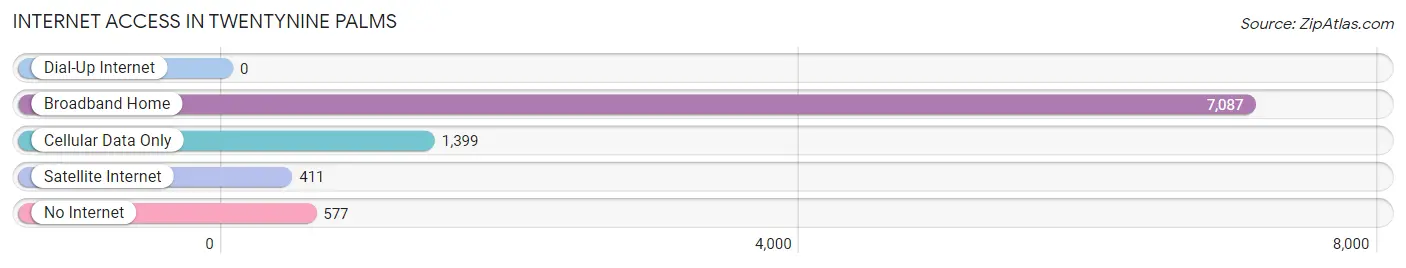
| Internet Type | # Households | % Households |
| Dial-Up Internet | 0 | 0.0% |
| Broadband Home | 7,087 | 76.3% |
| Cellular Data Only | 1,399 | 15.1% |
| Satellite Internet | 411 | 4.4% |
| No Internet | 577 | 6.2% |
| Total | 9,290 | 100.0% |
Twentynine Palms Summary
Twentynine Palms is a city located in San Bernardino County, California, United States. It is situated in the Mojave Desert, approximately 62 miles east of San Bernardino and 140 miles northeast of Los Angeles. The city is home to the world’s largest Marine Corps Base, the Marine Corps Air Ground Combat Center Twentynine Palms. As of the 2010 census, the city had a population of 25,048.
History
The area was first inhabited by the Serrano and Chemehuevi Native American tribes. The first European to visit the area was Father Francisco Garcés in 1776. In the late 19th century, the area was settled by homesteaders and ranchers. The town was originally called “Twentynine Palms” because of the palm trees that grew in the area.
The city was incorporated in 1987. In the early 1990s, the city experienced a population boom due to the expansion of the Marine Corps Air Ground Combat Center Twentynine Palms.
Geography
Twentynine Palms is located at 34°8′N 116°4′W. It is situated in the Mojave Desert, approximately 62 miles east of San Bernardino and 140 miles northeast of Los Angeles. The city has a total area of 59.1 square miles, of which 58.9 square miles is land and 0.2 square miles is water.
The city is surrounded by the Joshua Tree National Park to the south and the Mojave National Preserve to the north. The city is located in the High Desert region of California, with an elevation of 1,988 feet.
Economy
The economy of Twentynine Palms is largely driven by the Marine Corps Air Ground Combat Center Twentynine Palms. The base is the largest employer in the city, with over 8,000 personnel. Other major employers in the city include the Joshua Tree National Park, the Twentynine Palms Unified School District, and the city government.
The city also has a thriving tourism industry, with visitors coming to explore the nearby national parks and take advantage of the city’s outdoor recreation opportunities.
Demographics
As of the 2010 census, the city had a population of 25,048. The racial makeup of the city was 75.3% White, 8.2% African American, 1.2% Native American, 4.2% Asian, 0.3% Pacific Islander, 6.2% from other races, and 4.7% from two or more races. Hispanic or Latino of any race were 15.2% of the population.
The median income for a household in the city was $37,813, and the median income for a family was $45,919. The per capita income for the city was $19,945. About 11.2% of families and 14.3% of the population were below the poverty line, including 19.2% of those under age 18 and 8.2% of those age 65 or over.
Common Questions
What is Per Capita Income in Twentynine Palms?
Per Capita income in Twentynine Palms is $26,734.
What is the Median Family Income in Twentynine Palms?
Median Family Income in Twentynine Palms is $53,211.
What is the Median Household income in Twentynine Palms?
Median Household Income in Twentynine Palms is $51,392.
What is Income or Wage Gap in Twentynine Palms?
Income or Wage Gap in Twentynine Palms is 0.0%.
Women in Twentynine Palms earn 100.0 cents for every dollar earned by a man.
What is Family Income Deficit in Twentynine Palms?
Family Income Deficit in Twentynine Palms is $10,470.
Families that are below poverty line in Twentynine Palms earn $10,470 less on average than the poverty threshold level.
What is Inequality or Gini Index in Twentynine Palms?
Inequality or Gini Index in Twentynine Palms is 0.42.
What is the Total Population of Twentynine Palms?
Total Population of Twentynine Palms is 28,006.
What is the Total Male Population of Twentynine Palms?
Total Male Population of Twentynine Palms is 15,662.
What is the Total Female Population of Twentynine Palms?
Total Female Population of Twentynine Palms is 12,344.
What is the Ratio of Males per 100 Females in Twentynine Palms?
There are 126.88 Males per 100 Females in Twentynine Palms.
What is the Ratio of Females per 100 Males in Twentynine Palms?
There are 78.81 Females per 100 Males in Twentynine Palms.
What is the Median Population Age in Twentynine Palms?
Median Population Age in Twentynine Palms is 24.5 Years.
What is the Average Family Size in Twentynine Palms
Average Family Size in Twentynine Palms is 3.3 People.
What is the Average Household Size in Twentynine Palms
Average Household Size in Twentynine Palms is 2.6 People.
How Large is the Labor Force in Twentynine Palms?
There are 14,956 People in the Labor Forcein in Twentynine Palms.
What is the Percentage of People in the Labor Force in Twentynine Palms?
70.9% of People are in the Labor Force in Twentynine Palms.
What is the Unemployment Rate in Twentynine Palms?
Unemployment Rate in Twentynine Palms is 6.3%.