Zip Codes with the Highest Percentage of Population Employed in Professional & Scientific Services in San Jacinto, CA
RELATED REPORTS & OPTIONS
Professional & Scientific Services
San Jacinto
Compare Zip Codes
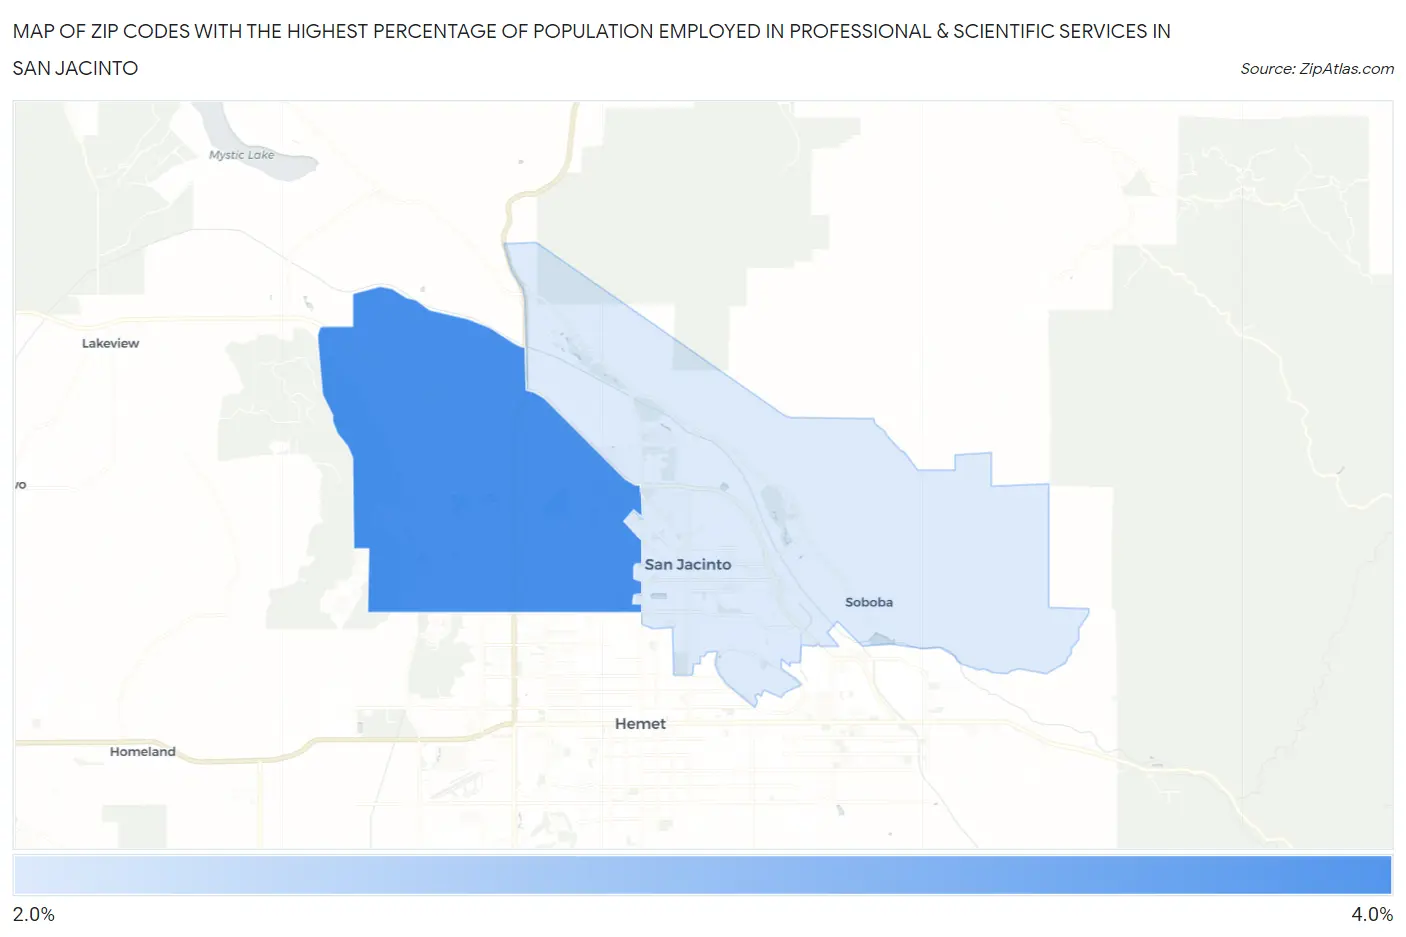
Map of Zip Codes with the Highest Percentage of Population Employed in Professional & Scientific Services in San Jacinto
2.1%
3.7%
Zip Codes with the Highest Percentage of Population Employed in Professional & Scientific Services in San Jacinto, CA
| Zip Code | % Employed | vs State | vs National | |
| 1. | 92582 | 3.7% | 9.4%(-5.73)#1,183 | 7.8%(-4.14)#16,025 |
| 2. | 92583 | 2.1% | 9.4%(-7.36)#1,378 | 7.8%(-5.77)#21,658 |
1
Common Questions
What are the Top Zip Codes with the Highest Percentage of Population Employed in Professional & Scientific Services in San Jacinto, CA?
Top Zip Codes with the Highest Percentage of Population Employed in Professional & Scientific Services in San Jacinto, CA are:
What zip code has the Highest Percentage of Population Employed in Professional & Scientific Services in San Jacinto, CA?
92582 has the Highest Percentage of Population Employed in Professional & Scientific Services in San Jacinto, CA with 3.7%.
What is the Percentage of Population Employed in Professional & Scientific Services in San Jacinto, CA?
Percentage of Population Employed in Professional & Scientific Services in San Jacinto is 2.8%.
What is the Percentage of Population Employed in Professional & Scientific Services in California?
Percentage of Population Employed in Professional & Scientific Services in California is 9.4%.
What is the Percentage of Population Employed in Professional & Scientific Services in the United States?
Percentage of Population Employed in Professional & Scientific Services in the United States is 7.8%.