Zip Codes with the Highest Percentage of Population Employed in Security & Protection in Moraga, CA
RELATED REPORTS & OPTIONS
Security & Protection
Moraga
Compare Zip Codes
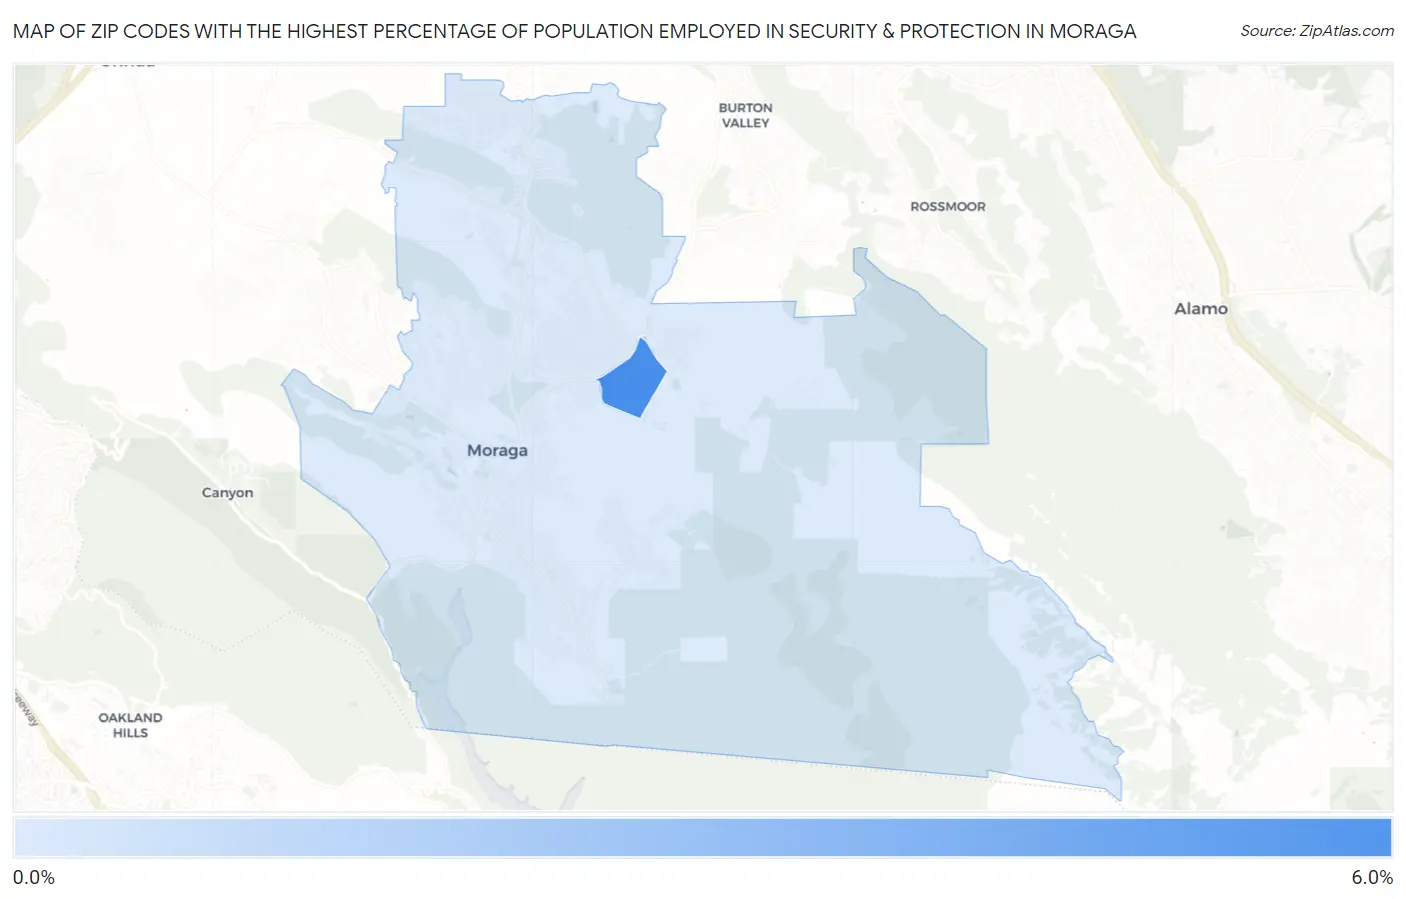
Map of Zip Codes with the Highest Percentage of Population Employed in Security & Protection in Moraga
1.2%
6.0%
Zip Codes with the Highest Percentage of Population Employed in Security & Protection in Moraga, CA
| Zip Code | % Employed | vs State | vs National | |
| 1. | 94575 | 6.0% | 2.1%(+3.89)#101 | 2.1%(+3.83)#2,096 |
| 2. | 94556 | 1.2% | 2.1%(-0.891)#1,106 | 2.1%(-0.959)#18,589 |
1
Common Questions
What are the Top Zip Codes with the Highest Percentage of Population Employed in Security & Protection in Moraga, CA?
Top Zip Codes with the Highest Percentage of Population Employed in Security & Protection in Moraga, CA are:
What zip code has the Highest Percentage of Population Employed in Security & Protection in Moraga, CA?
94575 has the Highest Percentage of Population Employed in Security & Protection in Moraga, CA with 6.0%.
What is the Percentage of Population Employed in Security & Protection in Moraga, CA?
Percentage of Population Employed in Security & Protection in Moraga is 1.4%.
What is the Percentage of Population Employed in Security & Protection in California?
Percentage of Population Employed in Security & Protection in California is 2.1%.
What is the Percentage of Population Employed in Security & Protection in the United States?
Percentage of Population Employed in Security & Protection in the United States is 2.1%.