Zip Codes with the Highest Percentage of Population Employed in Security & Protection in Beverly Hills, CA
RELATED REPORTS & OPTIONS
Security & Protection
Beverly Hills
Compare Zip Codes
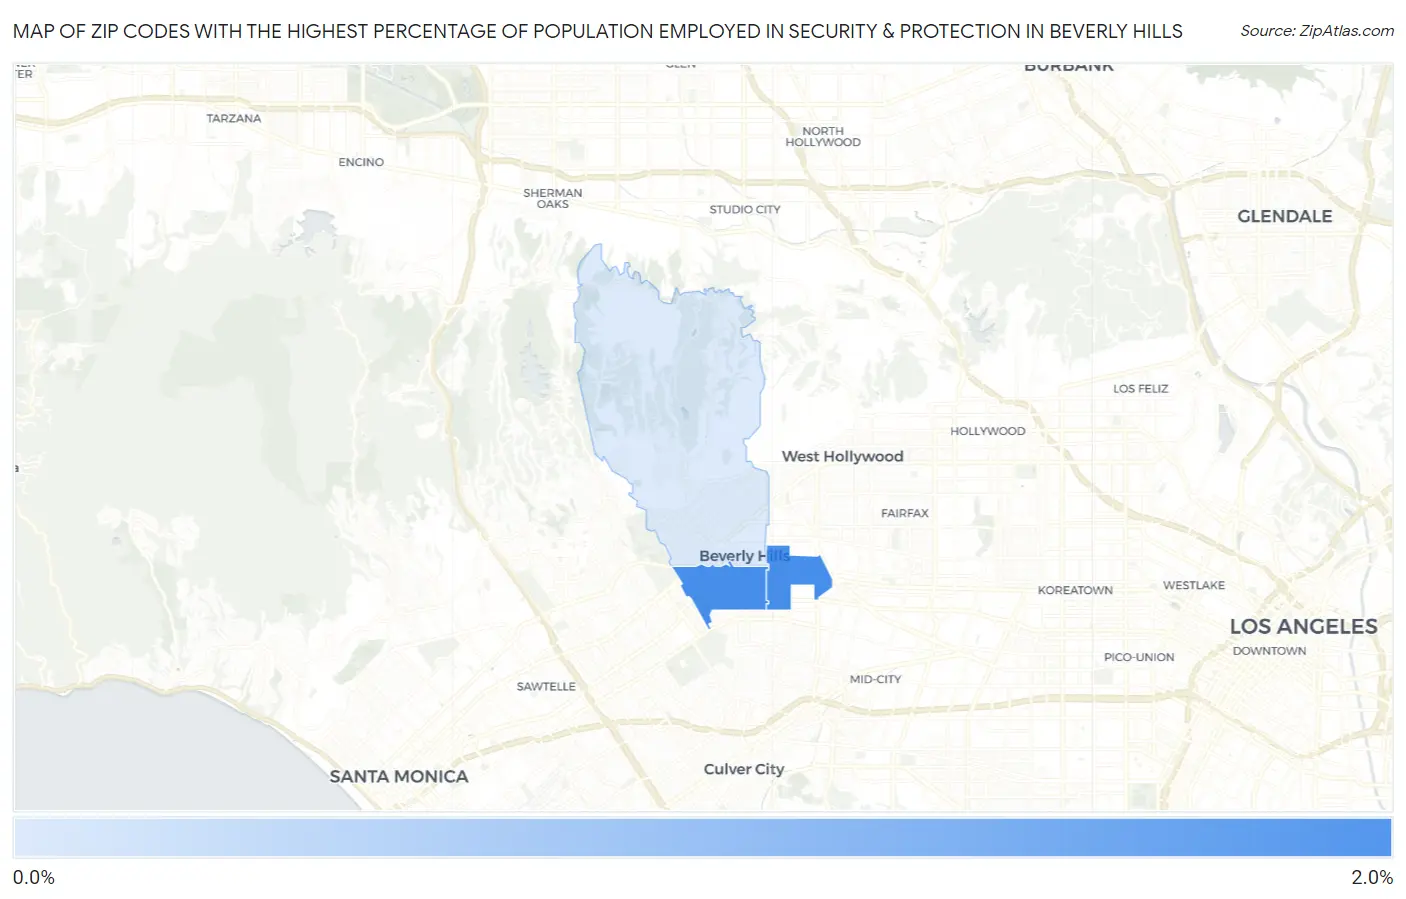
Map of Zip Codes with the Highest Percentage of Population Employed in Security & Protection in Beverly Hills
0.59%
1.8%
Zip Codes with the Highest Percentage of Population Employed in Security & Protection in Beverly Hills, CA
| Zip Code | % Employed | vs State | vs National | |
| 1. | 90211 | 1.8% | 2.1%(-0.289)#805 | 2.1%(-0.357)#14,015 |
| 2. | 90212 | 1.8% | 2.1%(-0.293)#808 | 2.1%(-0.361)#14,043 |
| 3. | 90210 | 0.59% | 2.1%(-1.49)#1,324 | 2.1%(-1.56)#22,722 |
1
Common Questions
What are the Top Zip Codes with the Highest Percentage of Population Employed in Security & Protection in Beverly Hills, CA?
Top Zip Codes with the Highest Percentage of Population Employed in Security & Protection in Beverly Hills, CA are:
What zip code has the Highest Percentage of Population Employed in Security & Protection in Beverly Hills, CA?
90211 has the Highest Percentage of Population Employed in Security & Protection in Beverly Hills, CA with 1.8%.
What is the Percentage of Population Employed in Security & Protection in Beverly Hills, CA?
Percentage of Population Employed in Security & Protection in Beverly Hills is 1.5%.
What is the Percentage of Population Employed in Security & Protection in California?
Percentage of Population Employed in Security & Protection in California is 2.1%.
What is the Percentage of Population Employed in Security & Protection in the United States?
Percentage of Population Employed in Security & Protection in the United States is 2.1%.