Zip Codes with the Highest Percentage of Black / African American Population in Moraga, CA

RELATED REPORTS & OPTIONS

Black / African American
Population
Race (Community Size)
Race (Percentage)
Ancestry (Community Size)
Ancestry (Percentage)
Immigrant Origin (Total)
Immigrant Origin (Percentage)
Income
Poverty
Unemployment
Employment Occupations
Employment Industries
Employer Class
Commute Time
Commute Means
School Enrollment
Education by Degree Field
Moraga
States
California Cities
AlamedaAlhambraAnaheimAntiochApple ValleyArcadiaAuburnBakersfieldBerkeleyBeverly HillsBuena ParkBurbankCamarilloCanoga ParkCanyon CountryCarlsbadCarsonCastro ValleyChicoChinoChula VistaCitrus HeightsClovisComptonConcordCoronaCosta MesaCovinaCulver CityDaly CityDanvilleDavisDesert Hot SpringsDowneyEdwardsEl CajonEl MonteElk GroveEncinoEscondidoEurekaFairfieldFontanaFremontFresnoFullertonGarden GroveGardenaGlendaleGlendoraGrass ValleyHaywardHemetHesperiaHuntington BeachIndioInglewoodIrvineLa JollaLa MesaLa MiradaLa PuenteLake ElsinoreLakewoodLancasterLemooreLivermoreLodiLoma LindaLompocLong BeachLos AltosLos AngelesLos GatosMaderaMalibuMantecaMenifeeMercedMission ViejoModestoMontereyMonterey ParkMoragaMoreno ValleyMountain ViewMurrietaNapaNewport BeachNorth HollywoodNorthridgeNovatoOaklandOceansideOntarioOrangeOrovilleOxnardPalm DesertPalm SpringsPalmdalePalo AltoPasadenaPerrisPetalumaPleasantonPomonaRancho CordovaRancho CucamongaReddingRedlandsRedondo BeachRedwood CityRialtoRichmondRiversideRocklinRosevilleSacramentoSalinasSan BernardinoSan ClementeSan DiegoSan FranciscoSan GabrielSan JacintoSan JoseSan LeandroSan Luis ObispoSan MarcosSan MateoSan PedroSan RafaelSan RamonSanta AnaSanta BarbaraSanta ClaraSanta ClaritaSanta CruzSanta MariaSanta MonicaSanta RosaSherman OaksSimi ValleySpring ValleyStocktonSunnyvaleTehachapiTemeculaThousand OaksTorranceTrabuco CanyonTracyTurlockTustinTwentynine PalmsUplandVacavilleValenciaVallejoVan NuysVenturaVictorvilleVisaliaVistaWalnut CreekWest CovinaWest SacramentoWhittierWoodlandWoodland HillsYorba LindaYuba City
Compare Zip Codes
Comparison Subject

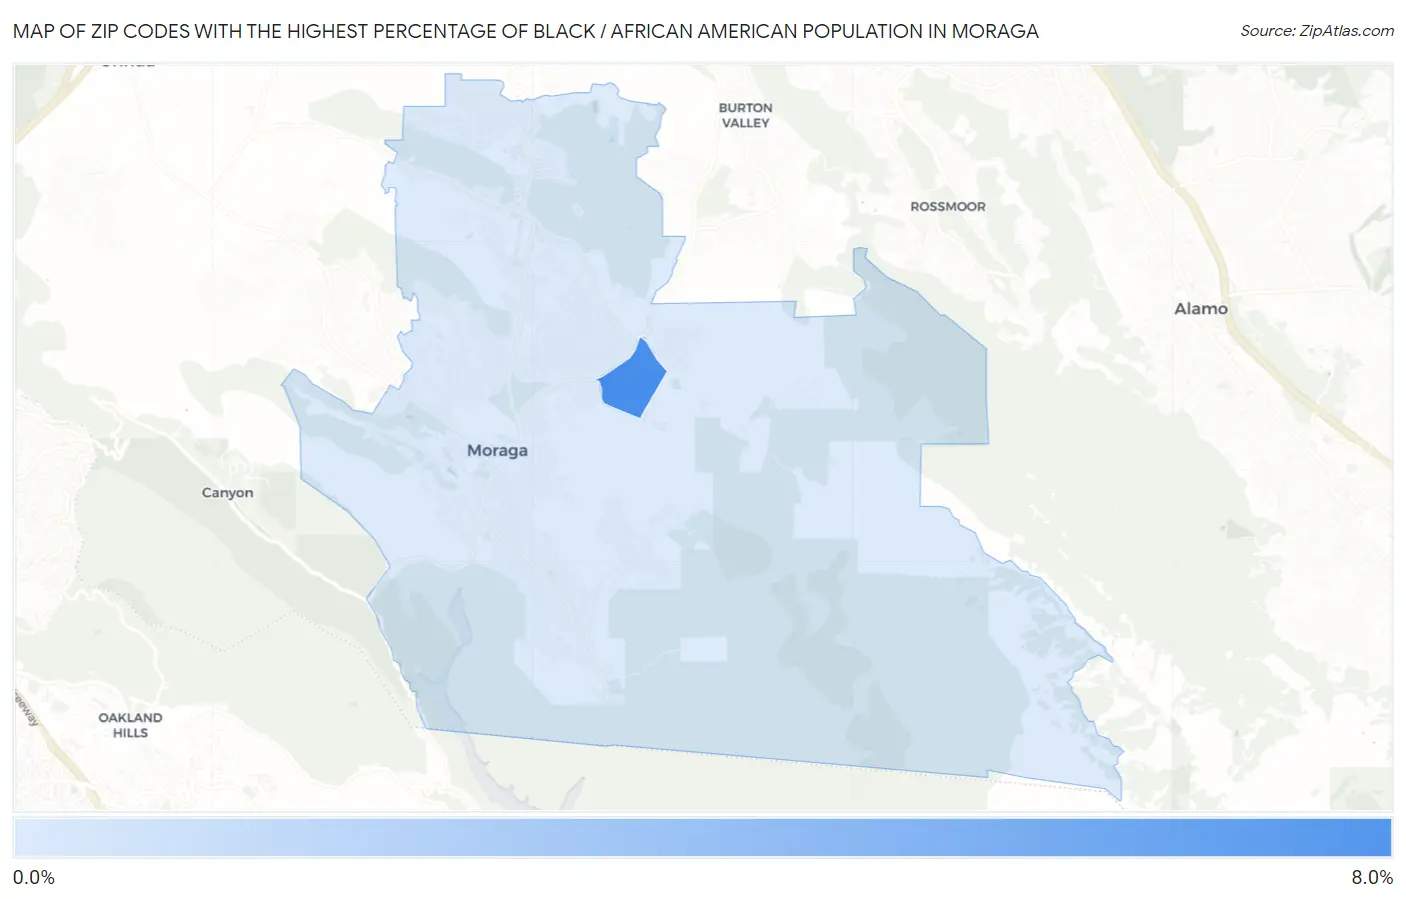
Map of Zip Codes with the Highest Percentage of Black / African American Population in Moraga

0.0%
8.0%
Zip Codes with the Highest Percentage of Black / African American Population in Moraga Map

Zip Codes with the Highest Percentage of Black / African American Population in Moraga, CA

Zip Code Black / African American vs State vs National
1.945757.9%5.6%(+2.32)#27112.5%(-4.55)#7,578
2.945560.58%5.6%(-5.02)#1,21012.5%(-11.9)#18,614

Common Questions

What are the Top Zip Codes with the Highest Percentage of Black / African American Population in Moraga, CA?
Top Zip Codes with the Highest Percentage of Black / African American Population in Moraga, CA are:
#1
7.9%
#2
0.58%
What zip code has the Highest Percentage of Black / African American Population in Moraga, CA?
94575 has the Highest Percentage of Black / African American Population in Moraga, CA with 7.9%.
What is the Percentage of Black / African American Population in Moraga, CA?
Percentage of Black / African American Population in Moraga is 1.0%.
What is the Percentage of Black / African American Population in California?
Percentage of Black / African American Population in California is 5.6%.
What is the Percentage of Black / African American Population in the United States?
Percentage of Black / African American Population in the United States is 12.5%.