Zip Codes with the Highest Percentage of Population Employed in Food Preparation & Serving in Yuma, AZ
RELATED REPORTS & OPTIONS
Food Preparation & Serving
Yuma
Compare Zip Codes
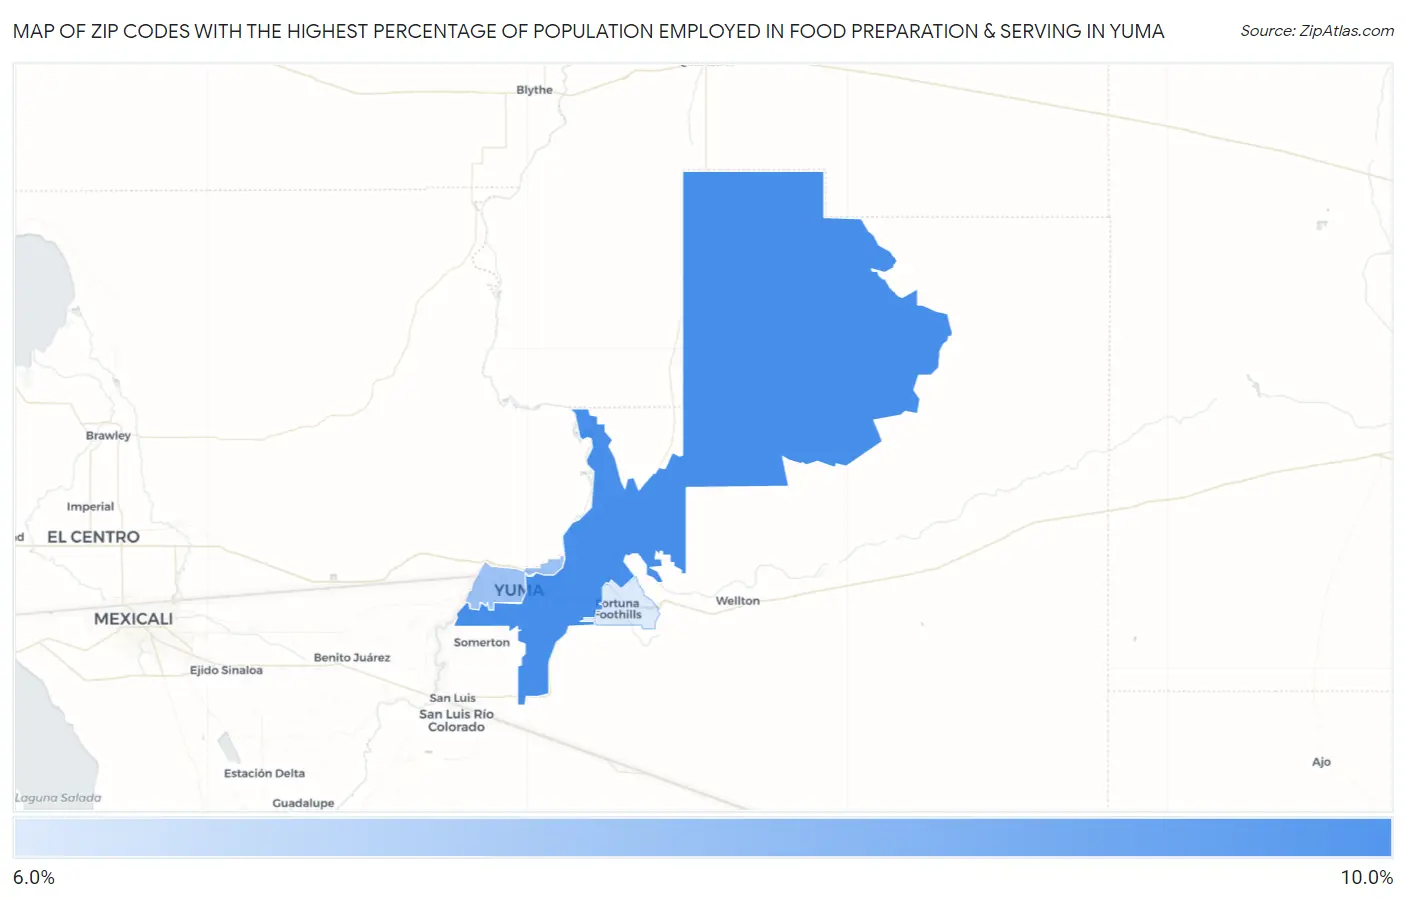
Map of Zip Codes with the Highest Percentage of Population Employed in Food Preparation & Serving in Yuma
6.9%
8.0%
Zip Codes with the Highest Percentage of Population Employed in Food Preparation & Serving in Yuma, AZ
| Zip Code | % Employed | vs State | vs National | |
| 1. | 85365 | 8.0% | 5.7%(+2.36)#82 | 5.3%(+2.75)#4,684 |
| 2. | 85364 | 7.4% | 5.7%(+1.72)#91 | 5.3%(+2.10)#5,775 |
| 3. | 85367 | 6.9% | 5.7%(+1.24)#109 | 5.3%(+1.62)#6,793 |
1
Common Questions
What are the Top Zip Codes with the Highest Percentage of Population Employed in Food Preparation & Serving in Yuma, AZ?
Top Zip Codes with the Highest Percentage of Population Employed in Food Preparation & Serving in Yuma, AZ are:
What zip code has the Highest Percentage of Population Employed in Food Preparation & Serving in Yuma, AZ?
85365 has the Highest Percentage of Population Employed in Food Preparation & Serving in Yuma, AZ with 8.0%.
What is the Percentage of Population Employed in Food Preparation & Serving in Yuma, AZ?
Percentage of Population Employed in Food Preparation & Serving in Yuma is 7.7%.
What is the Percentage of Population Employed in Food Preparation & Serving in Arizona?
Percentage of Population Employed in Food Preparation & Serving in Arizona is 5.7%.
What is the Percentage of Population Employed in Food Preparation & Serving in the United States?
Percentage of Population Employed in Food Preparation & Serving in the United States is 5.3%.