Zip Codes with the Highest Percentage of Population Employed in Food Preparation & Serving in Surprise, AZ
RELATED REPORTS & OPTIONS
Food Preparation & Serving
Surprise
Compare Zip Codes
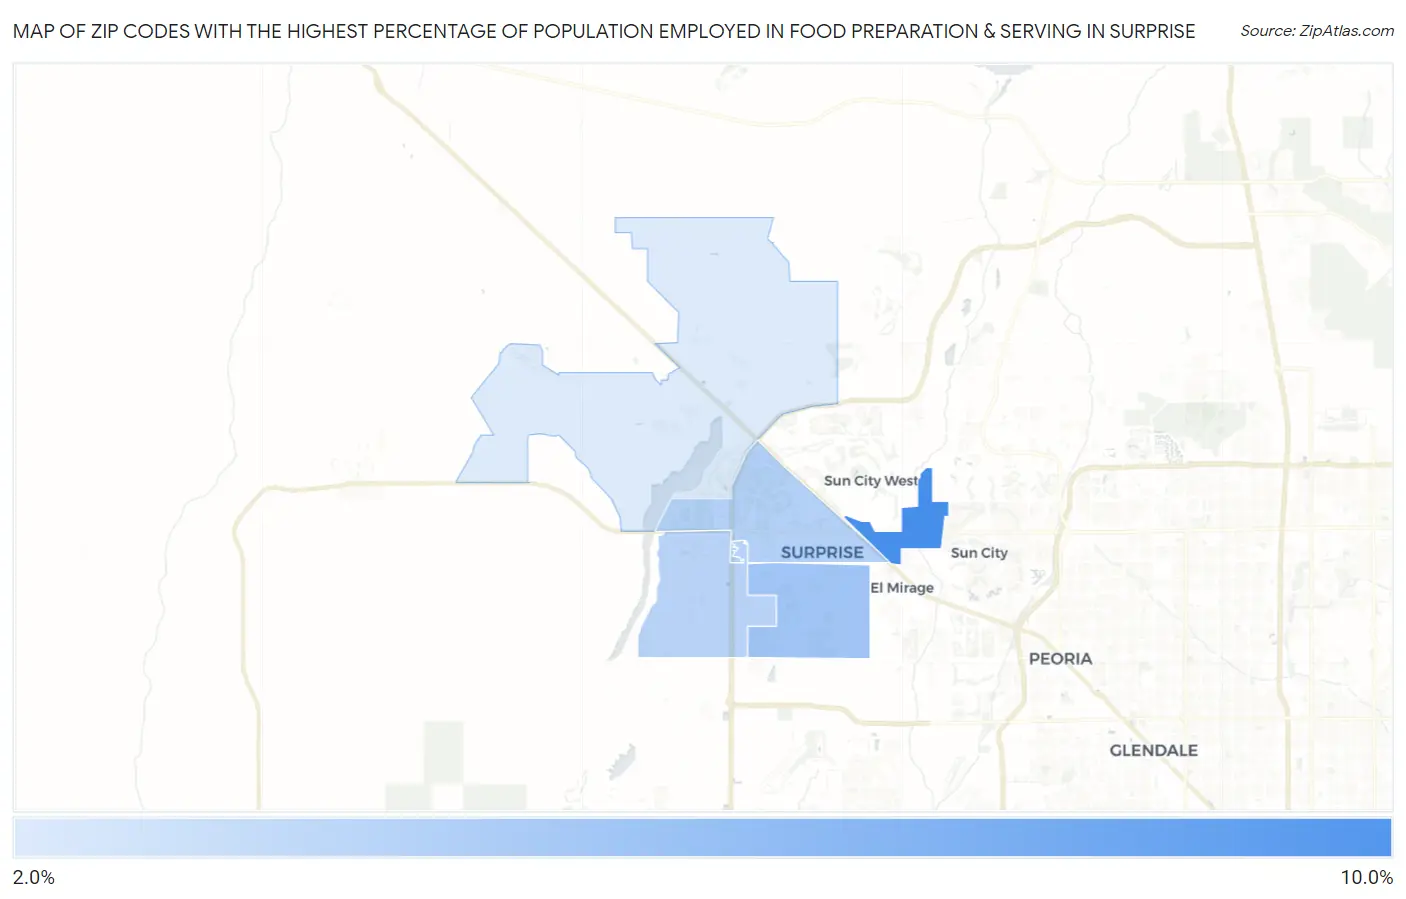
Map of Zip Codes with the Highest Percentage of Population Employed in Food Preparation & Serving in Surprise
2.8%
9.9%
Zip Codes with the Highest Percentage of Population Employed in Food Preparation & Serving in Surprise, AZ
| Zip Code | % Employed | vs State | vs National | |
| 1. | 85378 | 9.9% | 5.7%(+4.24)#50 | 5.3%(+4.62)#2,702 |
| 2. | 85379 | 5.6% | 5.7%(-0.019)#172 | 5.3%(+0.362)#10,526 |
| 3. | 85374 | 4.7% | 5.7%(-0.962)#211 | 5.3%(-0.581)#14,141 |
| 4. | 85388 | 4.6% | 5.7%(-1.09)#220 | 5.3%(-0.705)#14,693 |
| 5. | 85387 | 2.8% | 5.7%(-2.83)#304 | 5.3%(-2.45)#21,937 |
1
Common Questions
What are the Top 3 Zip Codes with the Highest Percentage of Population Employed in Food Preparation & Serving in Surprise, AZ?
Top 3 Zip Codes with the Highest Percentage of Population Employed in Food Preparation & Serving in Surprise, AZ are:
What zip code has the Highest Percentage of Population Employed in Food Preparation & Serving in Surprise, AZ?
85378 has the Highest Percentage of Population Employed in Food Preparation & Serving in Surprise, AZ with 9.9%.
What is the Percentage of Population Employed in Food Preparation & Serving in Surprise, AZ?
Percentage of Population Employed in Food Preparation & Serving in Surprise is 5.3%.
What is the Percentage of Population Employed in Food Preparation & Serving in Arizona?
Percentage of Population Employed in Food Preparation & Serving in Arizona is 5.7%.
What is the Percentage of Population Employed in Food Preparation & Serving in the United States?
Percentage of Population Employed in Food Preparation & Serving in the United States is 5.3%.