Zip Codes with the Highest Percentage of Population Employed in Food Preparation & Serving in San Tan Valley, AZ
RELATED REPORTS & OPTIONS
Food Preparation & Serving
San Tan Valley
Compare Zip Codes
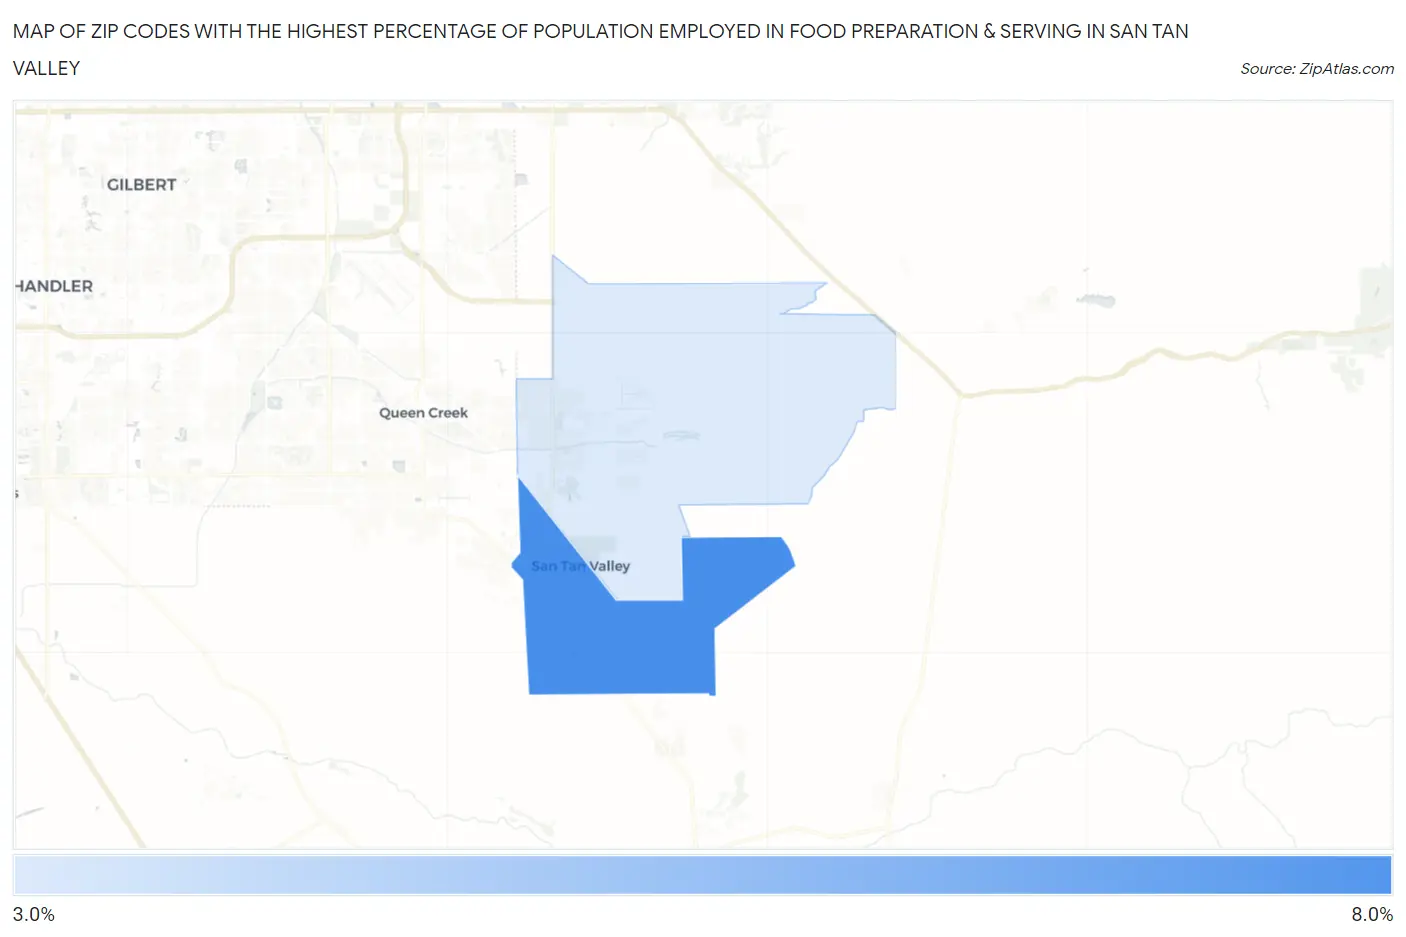
Map of Zip Codes with the Highest Percentage of Population Employed in Food Preparation & Serving in San Tan Valley
3.4%
6.0%
Zip Codes with the Highest Percentage of Population Employed in Food Preparation & Serving in San Tan Valley, AZ
| Zip Code | % Employed | vs State | vs National | |
| 1. | 85143 | 6.0% | 5.7%(+0.367)#151 | 5.3%(+0.748)#9,233 |
| 2. | 85140 | 3.4% | 5.7%(-2.26)#280 | 5.3%(-1.88)#19,613 |
1
Common Questions
What are the Top Zip Codes with the Highest Percentage of Population Employed in Food Preparation & Serving in San Tan Valley, AZ?
Top Zip Codes with the Highest Percentage of Population Employed in Food Preparation & Serving in San Tan Valley, AZ are:
What zip code has the Highest Percentage of Population Employed in Food Preparation & Serving in San Tan Valley, AZ?
85143 has the Highest Percentage of Population Employed in Food Preparation & Serving in San Tan Valley, AZ with 6.0%.
What is the Percentage of Population Employed in Food Preparation & Serving in San Tan Valley, AZ?
Percentage of Population Employed in Food Preparation & Serving in San Tan Valley is 4.7%.
What is the Percentage of Population Employed in Food Preparation & Serving in Arizona?
Percentage of Population Employed in Food Preparation & Serving in Arizona is 5.7%.
What is the Percentage of Population Employed in Food Preparation & Serving in the United States?
Percentage of Population Employed in Food Preparation & Serving in the United States is 5.3%.