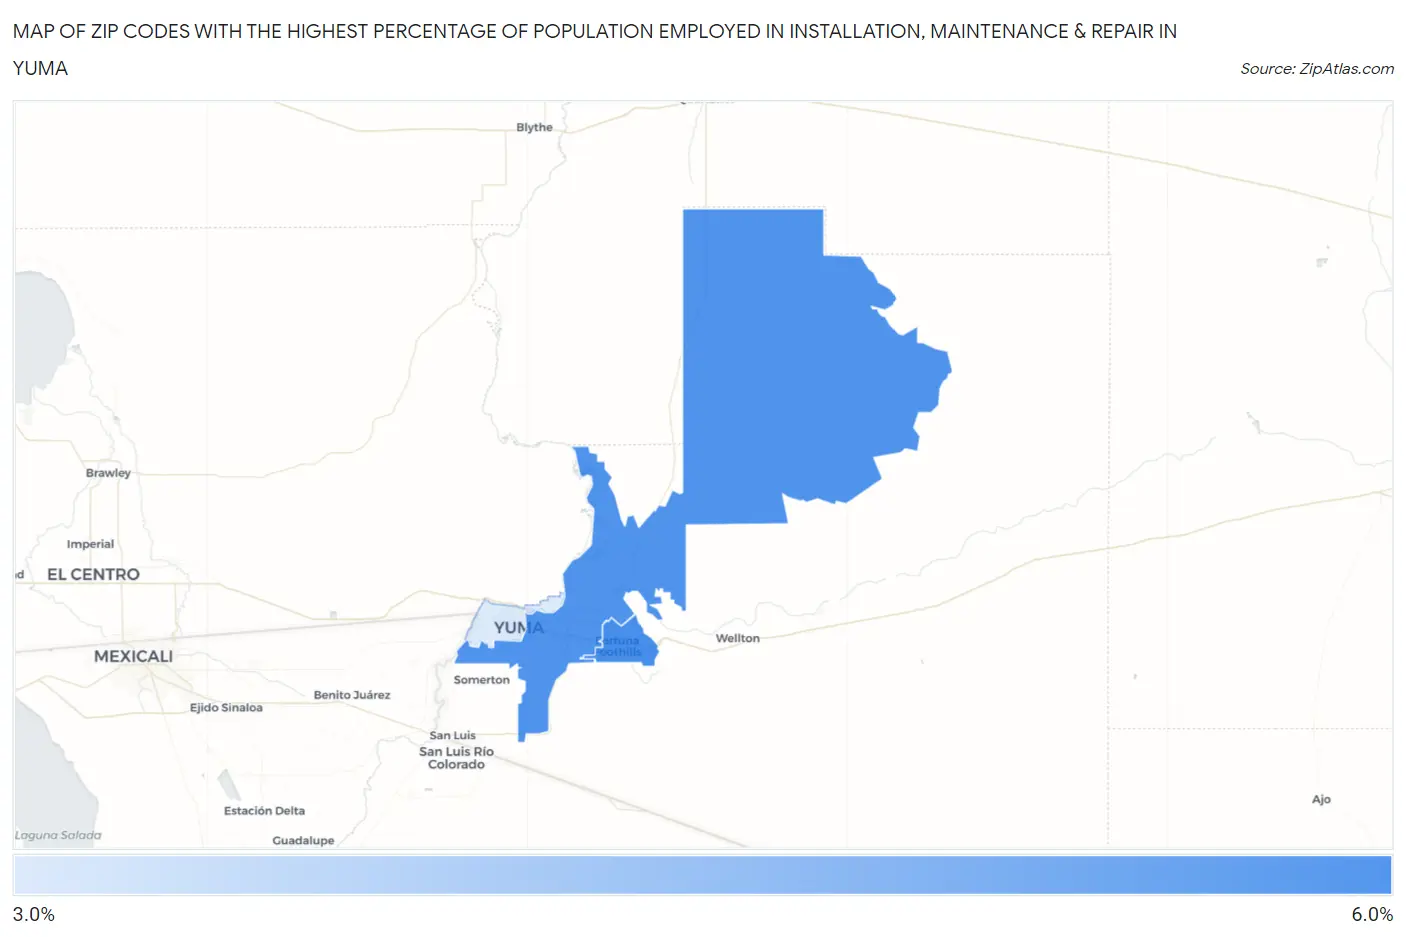
Zip Codes with the Highest Percentage of Population Employed in Installation, Maintenance & Repair in Yuma, AZ
RELATED REPORTS & OPTIONS
Installation, Maintenance & Repair
Yuma
Compare Zip Codes
Map of Zip Codes with the Highest Percentage of Population Employed in Installation, Maintenance & Repair in Yuma
3.1%
5.6%
Zip Codes with the Highest Percentage of Population Employed in Installation, Maintenance & Repair in Yuma, AZ
| Zip Code | % Employed | vs State | vs National | |
| 1. | 85367 | 5.6% | 3.3%(+2.37)#51 | 3.1%(+2.56)#6,953 |
| 2. | 85365 | 5.5% | 3.3%(+2.27)#54 | 3.1%(+2.46)#7,197 |
| 3. | 85364 | 3.1% | 3.3%(-0.123)#176 | 3.1%(+0.067)#16,361 |
1
Common Questions
What are the Top Zip Codes with the Highest Percentage of Population Employed in Installation, Maintenance & Repair in Yuma, AZ?
Top Zip Codes with the Highest Percentage of Population Employed in Installation, Maintenance & Repair in Yuma, AZ are:
What zip code has the Highest Percentage of Population Employed in Installation, Maintenance & Repair in Yuma, AZ?
85367 has the Highest Percentage of Population Employed in Installation, Maintenance & Repair in Yuma, AZ with 5.6%.
What is the Percentage of Population Employed in Installation, Maintenance & Repair in Yuma, AZ?
Percentage of Population Employed in Installation, Maintenance & Repair in Yuma is 4.0%.
What is the Percentage of Population Employed in Installation, Maintenance & Repair in Arizona?
Percentage of Population Employed in Installation, Maintenance & Repair in Arizona is 3.3%.
What is the Percentage of Population Employed in Installation, Maintenance & Repair in the United States?
Percentage of Population Employed in Installation, Maintenance & Repair in the United States is 3.1%.