Zip Codes with the Highest Percentage of Population Employed in Office & Administration in Yuma, AZ
RELATED REPORTS & OPTIONS
Office & Administration
Yuma
Compare Zip Codes
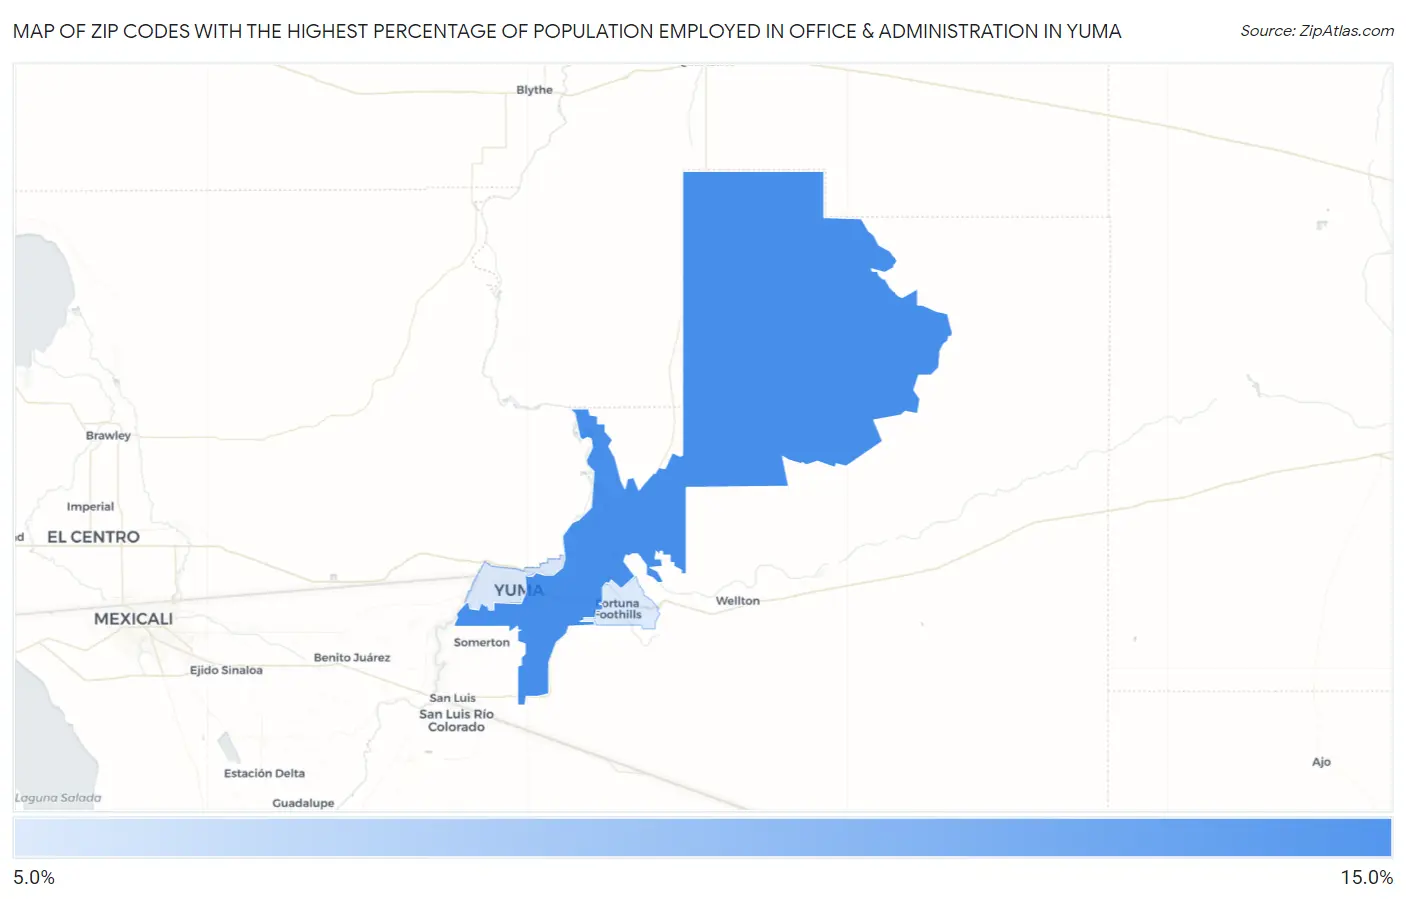
Map of Zip Codes with the Highest Percentage of Population Employed in Office & Administration in Yuma
12.9%
14.7%
Zip Codes with the Highest Percentage of Population Employed in Office & Administration in Yuma, AZ
| Zip Code | % Employed | vs State | vs National | |
| 1. | 85365 | 14.7% | 12.6%(+2.06)#104 | 10.9%(+3.80)#5,039 |
| 2. | 85364 | 13.0% | 12.6%(+0.377)#157 | 10.9%(+2.11)#8,141 |
| 3. | 85367 | 12.9% | 12.6%(+0.326)#158 | 10.9%(+2.06)#8,264 |
1
Common Questions
What are the Top Zip Codes with the Highest Percentage of Population Employed in Office & Administration in Yuma, AZ?
Top Zip Codes with the Highest Percentage of Population Employed in Office & Administration in Yuma, AZ are:
What zip code has the Highest Percentage of Population Employed in Office & Administration in Yuma, AZ?
85365 has the Highest Percentage of Population Employed in Office & Administration in Yuma, AZ with 14.7%.
What is the Percentage of Population Employed in Office & Administration in Yuma, AZ?
Percentage of Population Employed in Office & Administration in Yuma is 14.0%.
What is the Percentage of Population Employed in Office & Administration in Arizona?
Percentage of Population Employed in Office & Administration in Arizona is 12.6%.
What is the Percentage of Population Employed in Office & Administration in the United States?
Percentage of Population Employed in Office & Administration in the United States is 10.9%.