Zip Codes with the Highest Percentage of Population Employed in Legal Services & Support in Yuma, AZ
RELATED REPORTS & OPTIONS
Legal Services & Support
Yuma
Compare Zip Codes
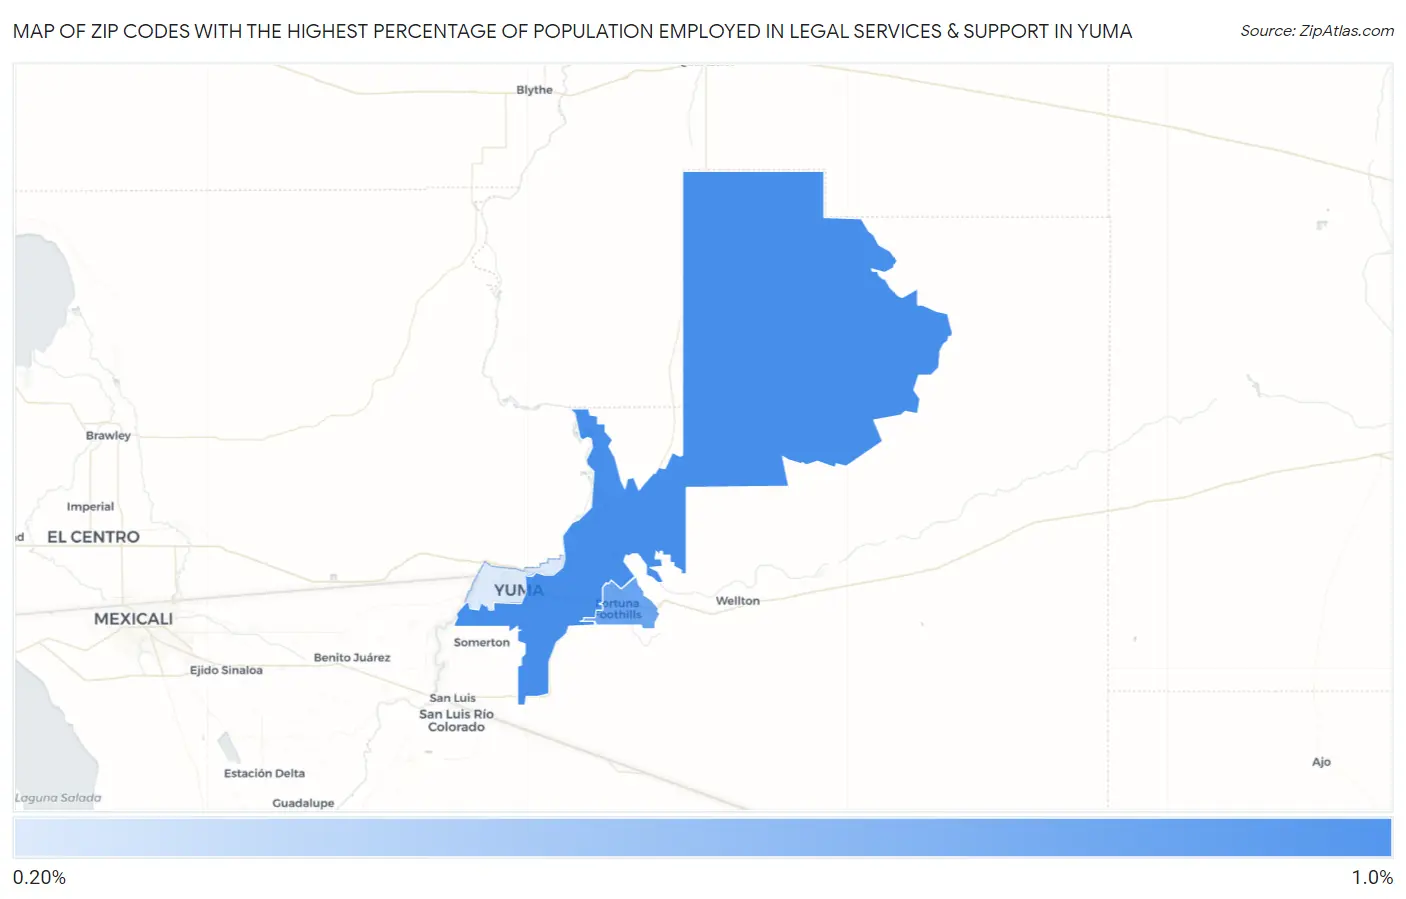
Map of Zip Codes with the Highest Percentage of Population Employed in Legal Services & Support in Yuma
0.25%
0.97%
Zip Codes with the Highest Percentage of Population Employed in Legal Services & Support in Yuma, AZ
| Zip Code | % Employed | vs State | vs National | |
| 1. | 85365 | 0.97% | 0.99%(-0.014)#109 | 1.2%(-0.212)#8,020 |
| 2. | 85367 | 0.80% | 0.99%(-0.185)#137 | 1.2%(-0.383)#9,429 |
| 3. | 85364 | 0.25% | 0.99%(-0.735)#221 | 1.2%(-0.933)#15,623 |
1
Common Questions
What are the Top Zip Codes with the Highest Percentage of Population Employed in Legal Services & Support in Yuma, AZ?
Top Zip Codes with the Highest Percentage of Population Employed in Legal Services & Support in Yuma, AZ are:
What zip code has the Highest Percentage of Population Employed in Legal Services & Support in Yuma, AZ?
85365 has the Highest Percentage of Population Employed in Legal Services & Support in Yuma, AZ with 0.97%.
What is the Percentage of Population Employed in Legal Services & Support in Yuma, AZ?
Percentage of Population Employed in Legal Services & Support in Yuma is 0.58%.
What is the Percentage of Population Employed in Legal Services & Support in Arizona?
Percentage of Population Employed in Legal Services & Support in Arizona is 0.99%.
What is the Percentage of Population Employed in Legal Services & Support in the United States?
Percentage of Population Employed in Legal Services & Support in the United States is 1.2%.