Zip Codes with the Highest Percentage of Population Employed in Agriculture, Fishing & Hunting in Tucson, AZ
RELATED REPORTS & OPTIONS
Agriculture, Fishing & Hunting
Tucson
Compare Zip Codes
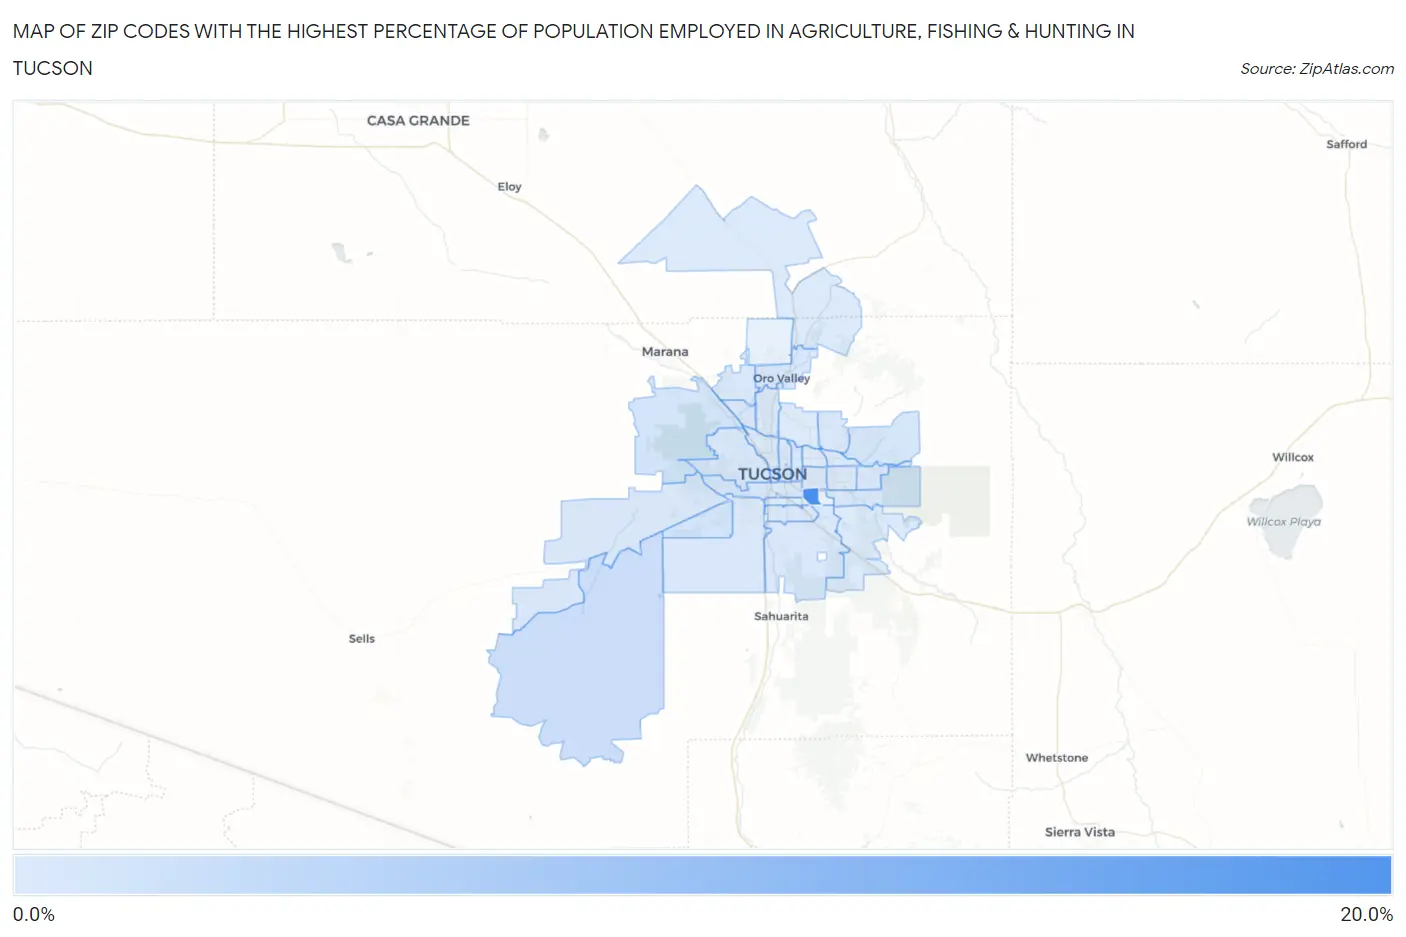
Map of Zip Codes with the Highest Percentage of Population Employed in Agriculture, Fishing & Hunting in Tucson
0.0%
20.0%
Zip Codes with the Highest Percentage of Population Employed in Agriculture, Fishing & Hunting in Tucson, AZ
| Zip Code | % Employed | vs State | vs National | |
| 1. | 85707 | 19.5% | 0.80%(+18.7)#19 | 1.2%(+18.3)#1,839 |
| 2. | 85736 | 2.3% | 0.80%(+1.45)#77 | 1.2%(+1.06)#12,128 |
| 3. | 85743 | 1.2% | 0.80%(+0.418)#108 | 1.2%(+0.022)#15,325 |
| 4. | 85757 | 1.2% | 0.80%(+0.407)#109 | 1.2%(+0.010)#15,364 |
| 5. | 85701 | 0.84% | 0.80%(+0.036)#126 | 1.2%(-0.361)#17,023 |
| 6. | 85749 | 0.77% | 0.80%(-0.028)#133 | 1.2%(-0.424)#17,390 |
| 7. | 85706 | 0.67% | 0.80%(-0.137)#140 | 1.2%(-0.534)#18,049 |
| 8. | 85745 | 0.66% | 0.80%(-0.145)#141 | 1.2%(-0.542)#18,088 |
| 9. | 85741 | 0.64% | 0.80%(-0.163)#147 | 1.2%(-0.560)#18,203 |
| 10. | 85742 | 0.51% | 0.80%(-0.290)#163 | 1.2%(-0.687)#19,164 |
| 11. | 85730 | 0.44% | 0.80%(-0.365)#175 | 1.2%(-0.762)#19,821 |
| 12. | 85735 | 0.43% | 0.80%(-0.370)#177 | 1.2%(-0.767)#19,870 |
| 13. | 85748 | 0.43% | 0.80%(-0.371)#178 | 1.2%(-0.767)#19,877 |
| 14. | 85750 | 0.41% | 0.80%(-0.390)#185 | 1.2%(-0.786)#20,032 |
| 15. | 85711 | 0.38% | 0.80%(-0.422)#192 | 1.2%(-0.819)#20,332 |
| 16. | 85713 | 0.37% | 0.80%(-0.434)#198 | 1.2%(-0.830)#20,447 |
| 17. | 85705 | 0.35% | 0.80%(-0.455)#204 | 1.2%(-0.851)#20,675 |
| 18. | 85746 | 0.34% | 0.80%(-0.466)#209 | 1.2%(-0.862)#20,784 |
| 19. | 85710 | 0.29% | 0.80%(-0.513)#216 | 1.2%(-0.910)#21,287 |
| 20. | 85756 | 0.28% | 0.80%(-0.521)#218 | 1.2%(-0.917)#21,393 |
| 21. | 85704 | 0.27% | 0.80%(-0.534)#223 | 1.2%(-0.930)#21,551 |
| 22. | 85719 | 0.19% | 0.80%(-0.614)#237 | 1.2%(-1.01)#22,490 |
| 23. | 85716 | 0.17% | 0.80%(-0.635)#242 | 1.2%(-1.03)#22,767 |
| 24. | 85737 | 0.16% | 0.80%(-0.646)#244 | 1.2%(-1.04)#22,907 |
| 25. | 85739 | 0.14% | 0.80%(-0.660)#248 | 1.2%(-1.06)#23,117 |
| 26. | 85714 | 0.13% | 0.80%(-0.678)#253 | 1.2%(-1.07)#23,341 |
| 27. | 85712 | 0.095% | 0.80%(-0.707)#265 | 1.2%(-1.10)#23,740 |
| 28. | 85747 | 0.059% | 0.80%(-0.744)#275 | 1.2%(-1.14)#24,243 |
| 29. | 85715 | 0.055% | 0.80%(-0.748)#277 | 1.2%(-1.14)#24,282 |
| 30. | 85718 | 0.0075% | 0.80%(-0.795)#282 | 1.2%(-1.19)#24,632 |
1
Common Questions
What are the Top 10 Zip Codes with the Highest Percentage of Population Employed in Agriculture, Fishing & Hunting in Tucson, AZ?
Top 10 Zip Codes with the Highest Percentage of Population Employed in Agriculture, Fishing & Hunting in Tucson, AZ are:
What zip code has the Highest Percentage of Population Employed in Agriculture, Fishing & Hunting in Tucson, AZ?
85707 has the Highest Percentage of Population Employed in Agriculture, Fishing & Hunting in Tucson, AZ with 19.5%.
What is the Percentage of Population Employed in Agriculture, Fishing & Hunting in Tucson, AZ?
Percentage of Population Employed in Agriculture, Fishing & Hunting in Tucson is 0.33%.
What is the Percentage of Population Employed in Agriculture, Fishing & Hunting in Arizona?
Percentage of Population Employed in Agriculture, Fishing & Hunting in Arizona is 0.80%.
What is the Percentage of Population Employed in Agriculture, Fishing & Hunting in the United States?
Percentage of Population Employed in Agriculture, Fishing & Hunting in the United States is 1.2%.