Zip Codes with the Highest Percentage of Population Employed in Agriculture, Fishing & Hunting in Maricopa, AZ
RELATED REPORTS & OPTIONS
Agriculture, Fishing & Hunting
Maricopa
Compare Zip Codes
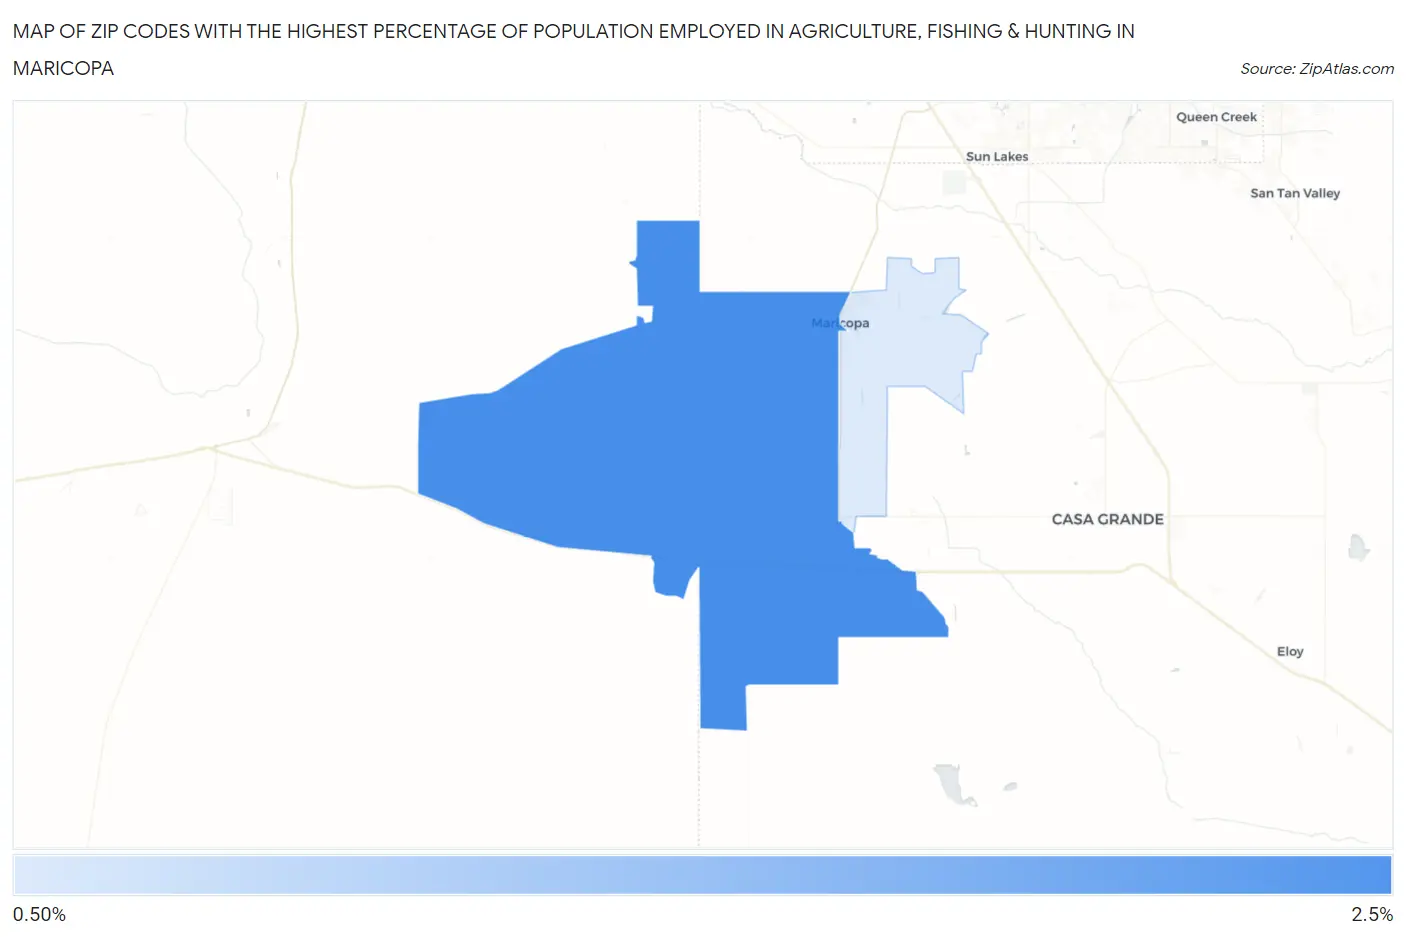
Map of Zip Codes with the Highest Percentage of Population Employed in Agriculture, Fishing & Hunting in Maricopa
1.3%
2.1%
Zip Codes with the Highest Percentage of Population Employed in Agriculture, Fishing & Hunting in Maricopa, AZ
| Zip Code | % Employed | vs State | vs National | |
| 1. | 85139 | 2.1% | 0.80%(+1.32)#79 | 1.2%(+0.924)#12,444 |
| 2. | 85138 | 1.3% | 0.80%(+0.533)#99 | 1.2%(+0.137)#14,887 |
1
Common Questions
What are the Top Zip Codes with the Highest Percentage of Population Employed in Agriculture, Fishing & Hunting in Maricopa, AZ?
Top Zip Codes with the Highest Percentage of Population Employed in Agriculture, Fishing & Hunting in Maricopa, AZ are:
What zip code has the Highest Percentage of Population Employed in Agriculture, Fishing & Hunting in Maricopa, AZ?
85139 has the Highest Percentage of Population Employed in Agriculture, Fishing & Hunting in Maricopa, AZ with 2.1%.
What is the Percentage of Population Employed in Agriculture, Fishing & Hunting in Maricopa, AZ?
Percentage of Population Employed in Agriculture, Fishing & Hunting in Maricopa is 0.85%.
What is the Percentage of Population Employed in Agriculture, Fishing & Hunting in Arizona?
Percentage of Population Employed in Agriculture, Fishing & Hunting in Arizona is 0.80%.
What is the Percentage of Population Employed in Agriculture, Fishing & Hunting in the United States?
Percentage of Population Employed in Agriculture, Fishing & Hunting in the United States is 1.2%.