Zip Codes with the Highest Percentage of Population with a Degree in Visual and Performing Arts in Prescott Valley, AZ
RELATED REPORTS & OPTIONS
Visual and Performing Arts
Prescott Valley
Compare Zip Codes
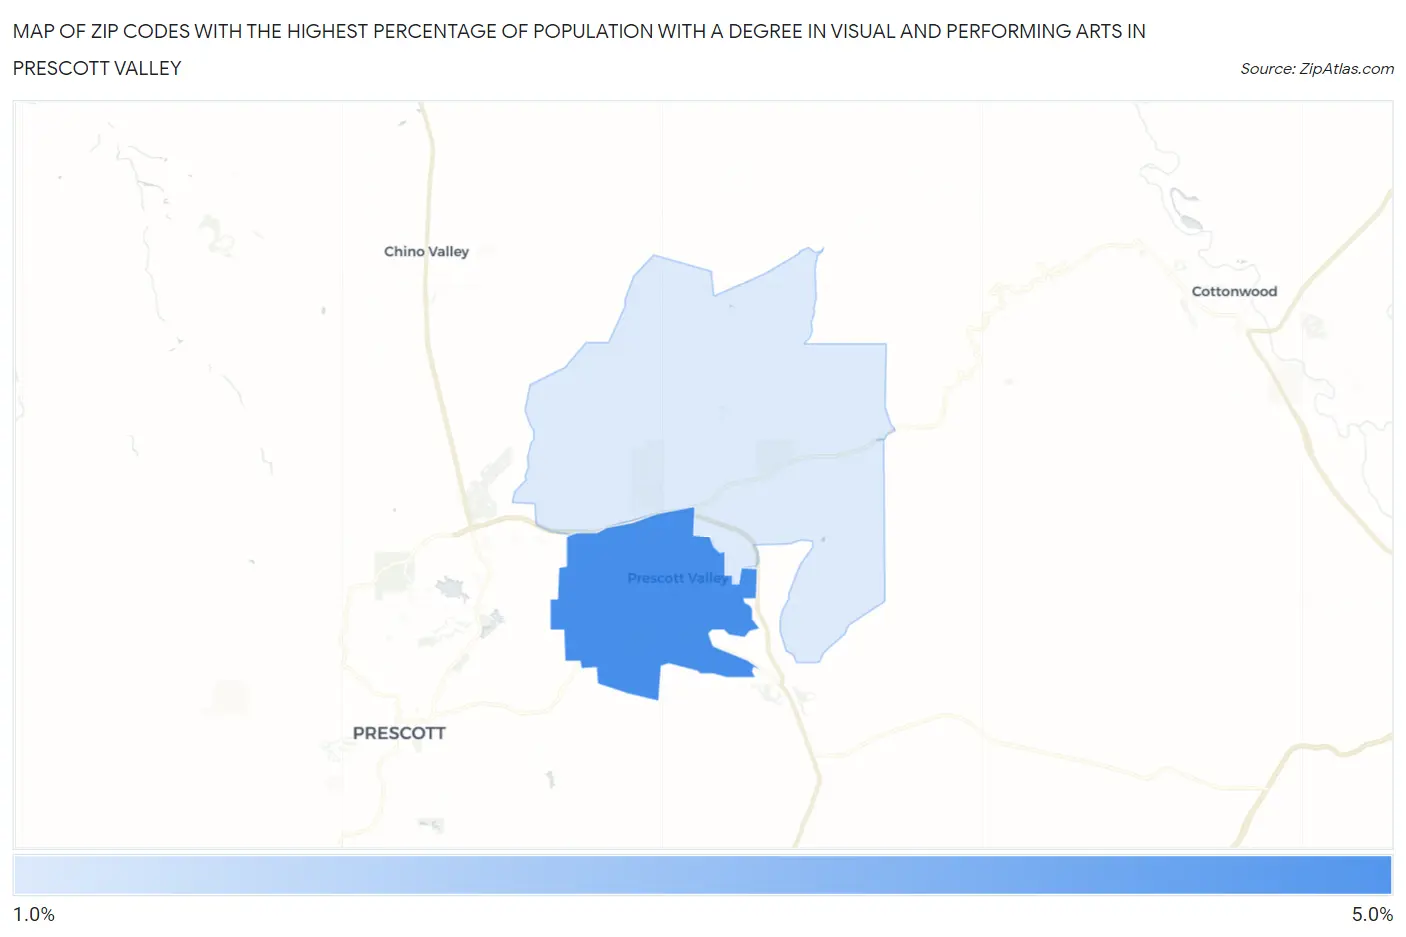
Map of Zip Codes with the Highest Percentage of Population with a Degree in Visual and Performing Arts in Prescott Valley
1.4%
4.1%
Zip Codes with the Highest Percentage of Population with a Degree in Visual and Performing Arts in Prescott Valley, AZ
| Zip Code | % Graduates | vs State | vs National | |
| 1. | 86314 | 4.1% | 3.6%(+0.567)#114 | 4.3%(-0.110)#8,786 |
| 2. | 86315 | 1.4% | 3.6%(-2.19)#256 | 4.3%(-2.87)#18,507 |
1
Common Questions
What are the Top Zip Codes with the Highest Percentage of Population with a Degree in Visual and Performing Arts in Prescott Valley, AZ?
Top Zip Codes with the Highest Percentage of Population with a Degree in Visual and Performing Arts in Prescott Valley, AZ are:
What zip code has the Highest Percentage of Population with a Degree in Visual and Performing Arts in Prescott Valley, AZ?
86314 has the Highest Percentage of Population with a Degree in Visual and Performing Arts in Prescott Valley, AZ with 4.1%.
What is the Percentage of Population with a Degree in Visual and Performing Arts in Prescott Valley, AZ?
Percentage of Population with a Degree in Visual and Performing Arts in Prescott Valley is 2.5%.
What is the Percentage of Population with a Degree in Visual and Performing Arts in Arizona?
Percentage of Population with a Degree in Visual and Performing Arts in Arizona is 3.6%.
What is the Percentage of Population with a Degree in Visual and Performing Arts in the United States?
Percentage of Population with a Degree in Visual and Performing Arts in the United States is 4.3%.