Zip Codes with the Most Immigrants from China in Prescott Valley, AZ
RELATED REPORTS & OPTIONS
China
Prescott Valley
Compare Zip Codes
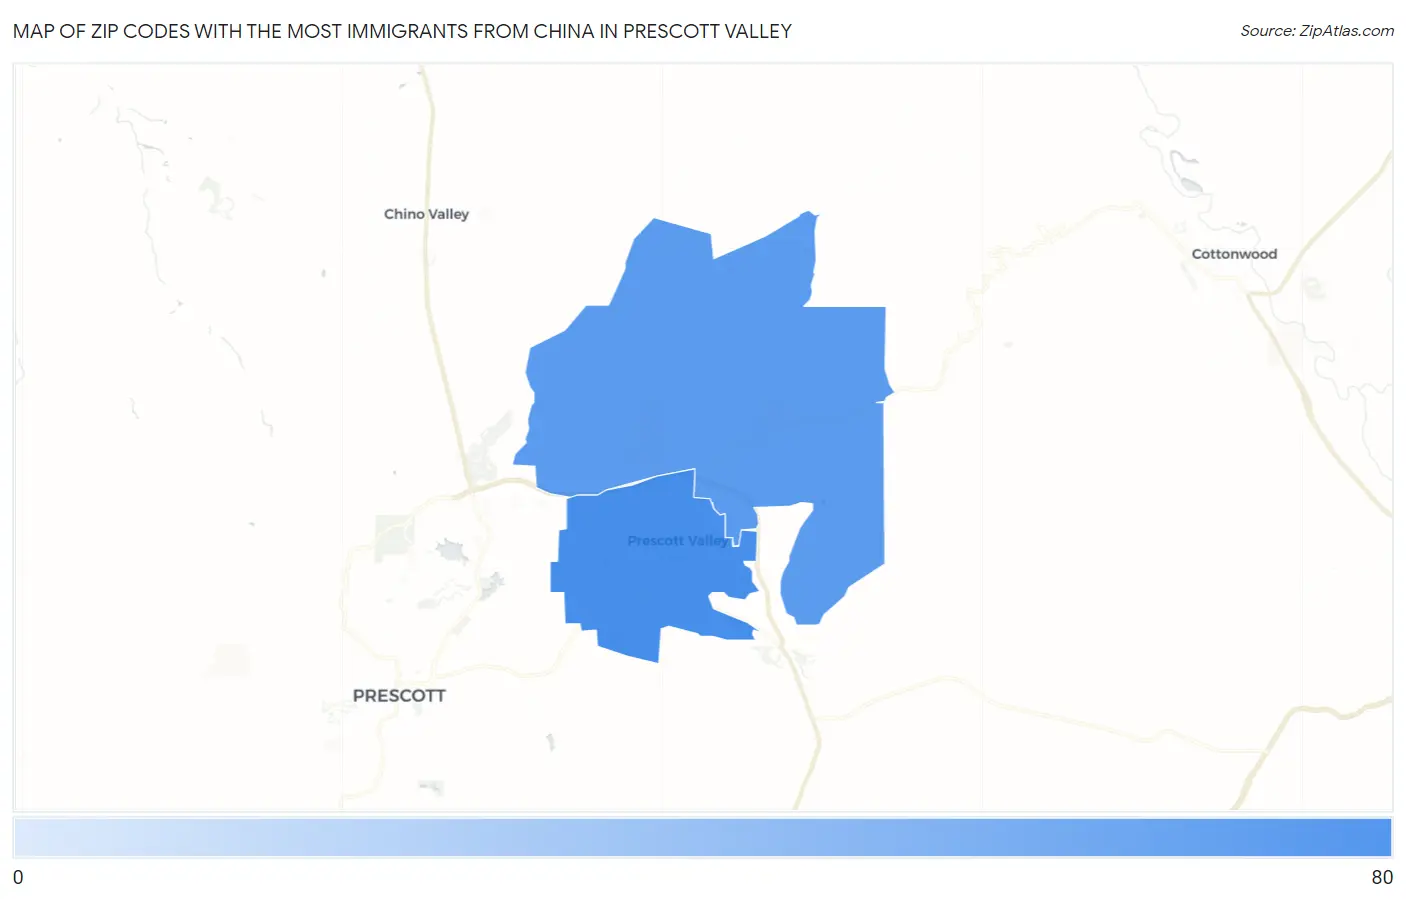
Map of Zip Codes with the Most Immigrants from China in Prescott Valley
38
64
Zip Codes with the Most Immigrants from China in Prescott Valley, AZ
| Zip Code | China | vs State | vs National | |
| 1. | 86314 | 64 | 28,617(0.22%)#102 | 2,829,008(0.00%)#4,975 |
| 2. | 86315 | 38 | 28,617(0.13%)#118 | 2,829,008(0.00%)#6,224 |
1
Common Questions
What are the Top Zip Codes with the Most Immigrants from China in Prescott Valley, AZ?
Top Zip Codes with the Most Immigrants from China in Prescott Valley, AZ are:
What zip code has the Most Immigrants from China in Prescott Valley, AZ?
86314 has the Most Immigrants from China in Prescott Valley, AZ with 64.
What is the Total Immigrants from China in Prescott Valley, AZ?
Total Immigrants from China in Prescott Valley is 102.
What is the Total Immigrants from China in Arizona?
Total Immigrants from China in Arizona is 28,617.
What is the Total Immigrants from China in the United States?
Total Immigrants from China in the United States is 2,829,008.