Zip Codes with the Highest Percentage of Population Employed in Arts, Entertainment & Recreation in Phoenix, AZ
RELATED REPORTS & OPTIONS
Arts, Entertainment & Recreation
Phoenix
Compare Zip Codes
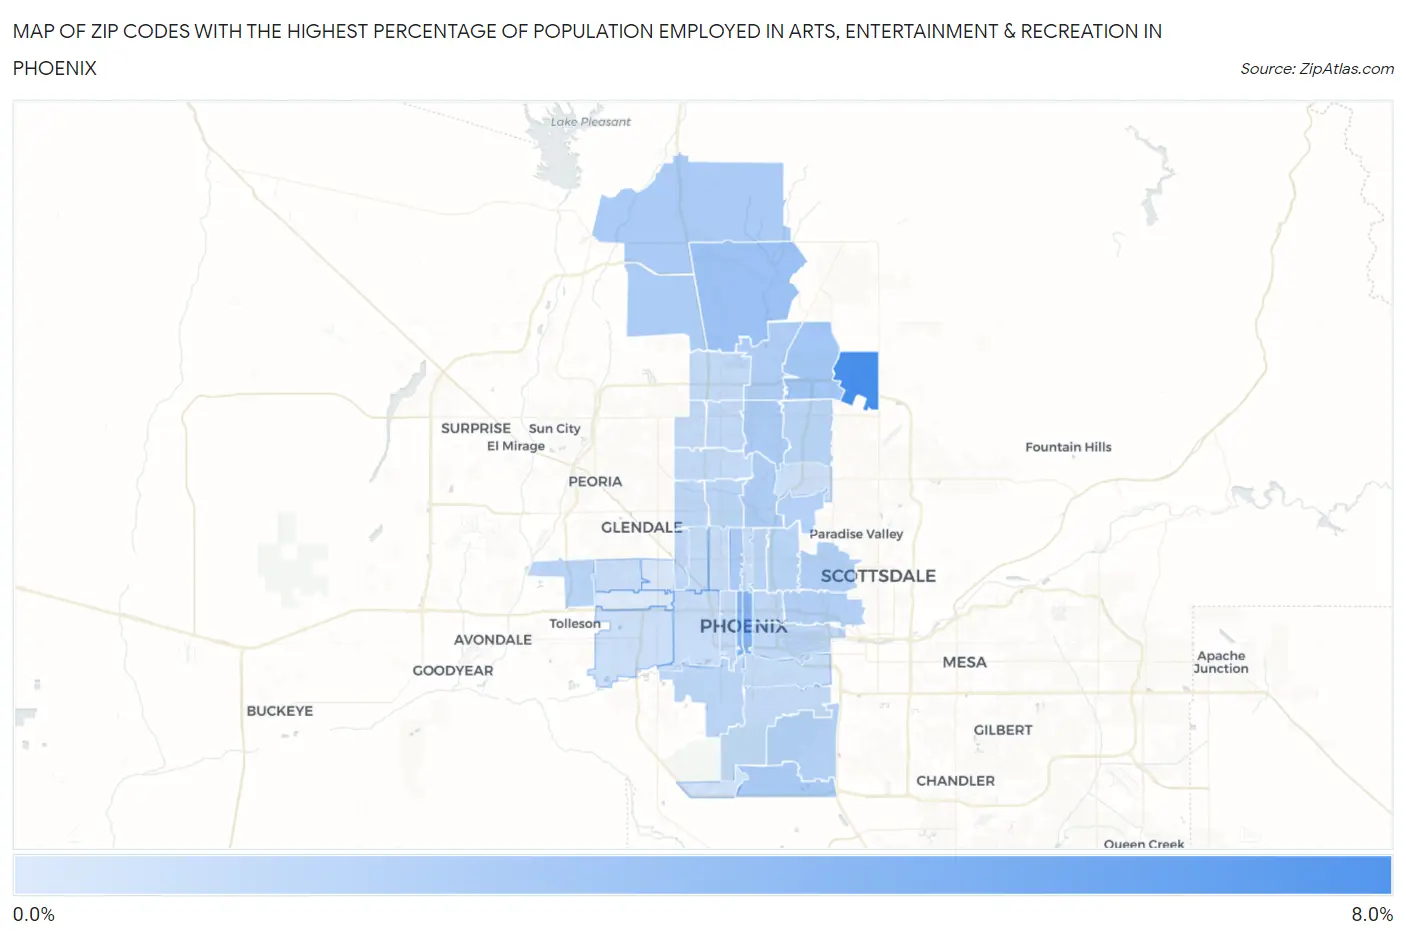
Map of Zip Codes with the Highest Percentage of Population Employed in Arts, Entertainment & Recreation in Phoenix
0.0%
8.0%
Zip Codes with the Highest Percentage of Population Employed in Arts, Entertainment & Recreation in Phoenix, AZ
| Zip Code | % Employed | vs State | vs National | |
| 1. | 85054 | 7.0% | 2.3%(+4.67)#34 | 2.1%(+4.89)#1,340 |
| 2. | 85004 | 4.3% | 2.3%(+2.00)#57 | 2.1%(+2.23)#2,946 |
| 3. | 85003 | 4.2% | 2.3%(+1.89)#62 | 2.1%(+2.12)#3,079 |
| 4. | 85085 | 3.3% | 2.3%(+1.04)#83 | 2.1%(+1.26)#4,470 |
| 5. | 85050 | 3.0% | 2.3%(+0.674)#101 | 2.1%(+0.902)#5,403 |
| 6. | 85086 | 2.7% | 2.3%(+0.391)#123 | 2.1%(+0.619)#6,354 |
| 7. | 85048 | 2.6% | 2.3%(+0.335)#133 | 2.1%(+0.563)#6,581 |
| 8. | 85022 | 2.6% | 2.3%(+0.280)#136 | 2.1%(+0.508)#6,793 |
| 9. | 85013 | 2.5% | 2.3%(+0.238)#140 | 2.1%(+0.465)#6,963 |
| 10. | 85083 | 2.5% | 2.3%(+0.231)#141 | 2.1%(+0.458)#6,998 |
| 11. | 85024 | 2.5% | 2.3%(+0.173)#144 | 2.1%(+0.401)#7,247 |
| 12. | 85020 | 2.5% | 2.3%(+0.161)#145 | 2.1%(+0.389)#7,302 |
| 13. | 85018 | 2.3% | 2.3%(-0.021)#154 | 2.1%(+0.206)#8,180 |
| 14. | 85008 | 2.3% | 2.3%(-0.026)#155 | 2.1%(+0.202)#8,198 |
| 15. | 85044 | 2.2% | 2.3%(-0.112)#165 | 2.1%(+0.116)#8,650 |
| 16. | 85032 | 2.0% | 2.3%(-0.300)#186 | 2.1%(-0.073)#9,713 |
| 17. | 85037 | 2.0% | 2.3%(-0.307)#187 | 2.1%(-0.079)#9,757 |
| 18. | 85016 | 2.0% | 2.3%(-0.359)#193 | 2.1%(-0.131)#10,065 |
| 19. | 85014 | 1.9% | 2.3%(-0.407)#199 | 2.1%(-0.179)#10,361 |
| 20. | 85021 | 1.9% | 2.3%(-0.409)#200 | 2.1%(-0.181)#10,368 |
| 21. | 85041 | 1.9% | 2.3%(-0.450)#202 | 2.1%(-0.222)#10,615 |
| 22. | 85051 | 1.8% | 2.3%(-0.469)#204 | 2.1%(-0.242)#10,750 |
| 23. | 85034 | 1.8% | 2.3%(-0.540)#209 | 2.1%(-0.312)#11,226 |
| 24. | 85019 | 1.7% | 2.3%(-0.579)#212 | 2.1%(-0.351)#11,514 |
| 25. | 85023 | 1.7% | 2.3%(-0.608)#217 | 2.1%(-0.381)#11,721 |
| 26. | 85006 | 1.7% | 2.3%(-0.639)#219 | 2.1%(-0.411)#11,932 |
| 27. | 85042 | 1.6% | 2.3%(-0.717)#227 | 2.1%(-0.490)#12,513 |
| 28. | 85007 | 1.6% | 2.3%(-0.724)#229 | 2.1%(-0.496)#12,565 |
| 29. | 85053 | 1.6% | 2.3%(-0.730)#230 | 2.1%(-0.502)#12,607 |
| 30. | 85027 | 1.6% | 2.3%(-0.730)#231 | 2.1%(-0.502)#12,608 |
| 31. | 85029 | 1.6% | 2.3%(-0.736)#232 | 2.1%(-0.508)#12,663 |
| 32. | 85040 | 1.5% | 2.3%(-0.765)#235 | 2.1%(-0.537)#12,906 |
| 33. | 85017 | 1.5% | 2.3%(-0.766)#236 | 2.1%(-0.539)#12,923 |
| 34. | 85015 | 1.4% | 2.3%(-0.900)#249 | 2.1%(-0.672)#13,910 |
| 35. | 85009 | 1.4% | 2.3%(-0.902)#250 | 2.1%(-0.674)#13,919 |
| 36. | 85012 | 1.3% | 2.3%(-0.986)#258 | 2.1%(-0.758)#14,540 |
| 37. | 85033 | 1.3% | 2.3%(-1.04)#264 | 2.1%(-0.809)#14,904 |
| 38. | 85043 | 1.3% | 2.3%(-1.06)#267 | 2.1%(-0.832)#15,094 |
| 39. | 85028 | 1.1% | 2.3%(-1.20)#277 | 2.1%(-0.973)#16,164 |
| 40. | 85045 | 1.0% | 2.3%(-1.29)#282 | 2.1%(-1.07)#16,834 |
| 41. | 85031 | 0.64% | 2.3%(-1.67)#297 | 2.1%(-1.45)#19,573 |
| 42. | 85035 | 0.54% | 2.3%(-1.77)#300 | 2.1%(-1.54)#20,238 |
1
Common Questions
What are the Top 10 Zip Codes with the Highest Percentage of Population Employed in Arts, Entertainment & Recreation in Phoenix, AZ?
Top 10 Zip Codes with the Highest Percentage of Population Employed in Arts, Entertainment & Recreation in Phoenix, AZ are:
What zip code has the Highest Percentage of Population Employed in Arts, Entertainment & Recreation in Phoenix, AZ?
85054 has the Highest Percentage of Population Employed in Arts, Entertainment & Recreation in Phoenix, AZ with 7.0%.
What is the Percentage of Population Employed in Arts, Entertainment & Recreation in Phoenix, AZ?
Percentage of Population Employed in Arts, Entertainment & Recreation in Phoenix is 1.9%.
What is the Percentage of Population Employed in Arts, Entertainment & Recreation in Arizona?
Percentage of Population Employed in Arts, Entertainment & Recreation in Arizona is 2.3%.
What is the Percentage of Population Employed in Arts, Entertainment & Recreation in the United States?
Percentage of Population Employed in Arts, Entertainment & Recreation in the United States is 2.1%.