Zip Codes with the Highest Percentage of Population with a Degree in Literature and Languages in Gilbert, AZ

RELATED REPORTS & OPTIONS

Literature and Languages
Population
Families and Households
Female Fertility
Female Fertility (Unmarried)
Race (Community Size)
Race (Percentage)
Ancestry (Community Size)
AfricanAmericanApacheArabArgentineanArmenianAssyrian / Chaldean / SyriacAustralianAustrianBangladeshiBelgianBhutaneseBlackfeetBrazilianBritishBulgarianBurmeseCanadianCentral AmericanCentral American IndianCherokeeChippewaChoctawColombianCosta RicanCreekCroatianCubanCzechCzechoslovakianDanishDominicanDutchEastern EuropeanEcuadorianEgyptianEnglishEthiopianEuropeanFilipinoFinnishFrenchFrench American IndianFrench CanadianGermanGreekGuamanian / ChamorroGuatemalanHaitianHonduranHungarianIcelanderIndian (Asian)IndonesianIranianIraqiIrishIroquoisItalianJamaicanJapaneseKenyanKoreanLaotianLatvianLebaneseLiberianLithuanianLuxembourgerMacedonianMalteseMexicanMexican American IndianNative HawaiianNavajoNew ZealanderNicaraguanNigerianNorthern EuropeanNorwegianOsagePakistaniPanamanianPennsylvania GermanPeruvianPimaPolishPortuguesePotawatomiPuerto RicanRomanianRussianSalvadoranSamoanScandinavianScotch-IrishScottishSerbianSiouxSlavicSlovakSloveneSouth AfricanSouth AmericanSpaniardSpanishSpanish AmericanSri LankanSubsaharan AfricanSudaneseSwedishSwissSyrianThaiTohono O'OdhamTonganTrinidadian and TobagonianTurkishUkrainianUruguayanVenezuelanVietnameseWelshYaquiYugoslavian
Ancestry (Percentage)
AfricanAmericanApacheArabArgentineanArmenianAssyrian / Chaldean / SyriacAustralianAustrianBangladeshiBelgianBhutaneseBlackfeetBrazilianBritishBulgarianBurmeseCanadianCentral AmericanCentral American IndianCherokeeChippewaChoctawColombianCosta RicanCreekCroatianCubanCzechCzechoslovakianDanishDominicanDutchEastern EuropeanEcuadorianEgyptianEnglishEthiopianEuropeanFilipinoFinnishFrenchFrench American IndianFrench CanadianGermanGreekGuamanian / ChamorroGuatemalanHaitianHonduranHungarianIcelanderIndian (Asian)IndonesianIranianIraqiIrishIroquoisItalianJamaicanJapaneseKenyanKoreanLaotianLatvianLebaneseLiberianLithuanianLuxembourgerMacedonianMalteseMexicanMexican American IndianNative HawaiianNavajoNew ZealanderNicaraguanNigerianNorthern EuropeanNorwegianOsagePakistaniPanamanianPennsylvania GermanPeruvianPimaPolishPortuguesePotawatomiPuerto RicanRomanianRussianSalvadoranSamoanScandinavianScotch-IrishScottishSerbianSiouxSlavicSlovakSloveneSouth AfricanSouth AmericanSpaniardSpanishSpanish AmericanSri LankanSubsaharan AfricanSudaneseSwedishSwissSyrianThaiTohono O'OdhamTonganTrinidadian and TobagonianTurkishUkrainianUruguayanVenezuelanVietnameseWelshYaquiYugoslavian
Immigrant Origin (Total)
Immigrant Origin (Percentage)
Income
Income (Families)
Income (Households)
Poverty
Poverty (Families)
Unemployment
Employment Occupations
Employment Industries
Employer Class
Commute Time
Commute Means
School Enrollment
Education by Degree Field
Occupancy
Finances
Physical Characteristics
Gilbert
Compare Zip Codes
Comparison Subject

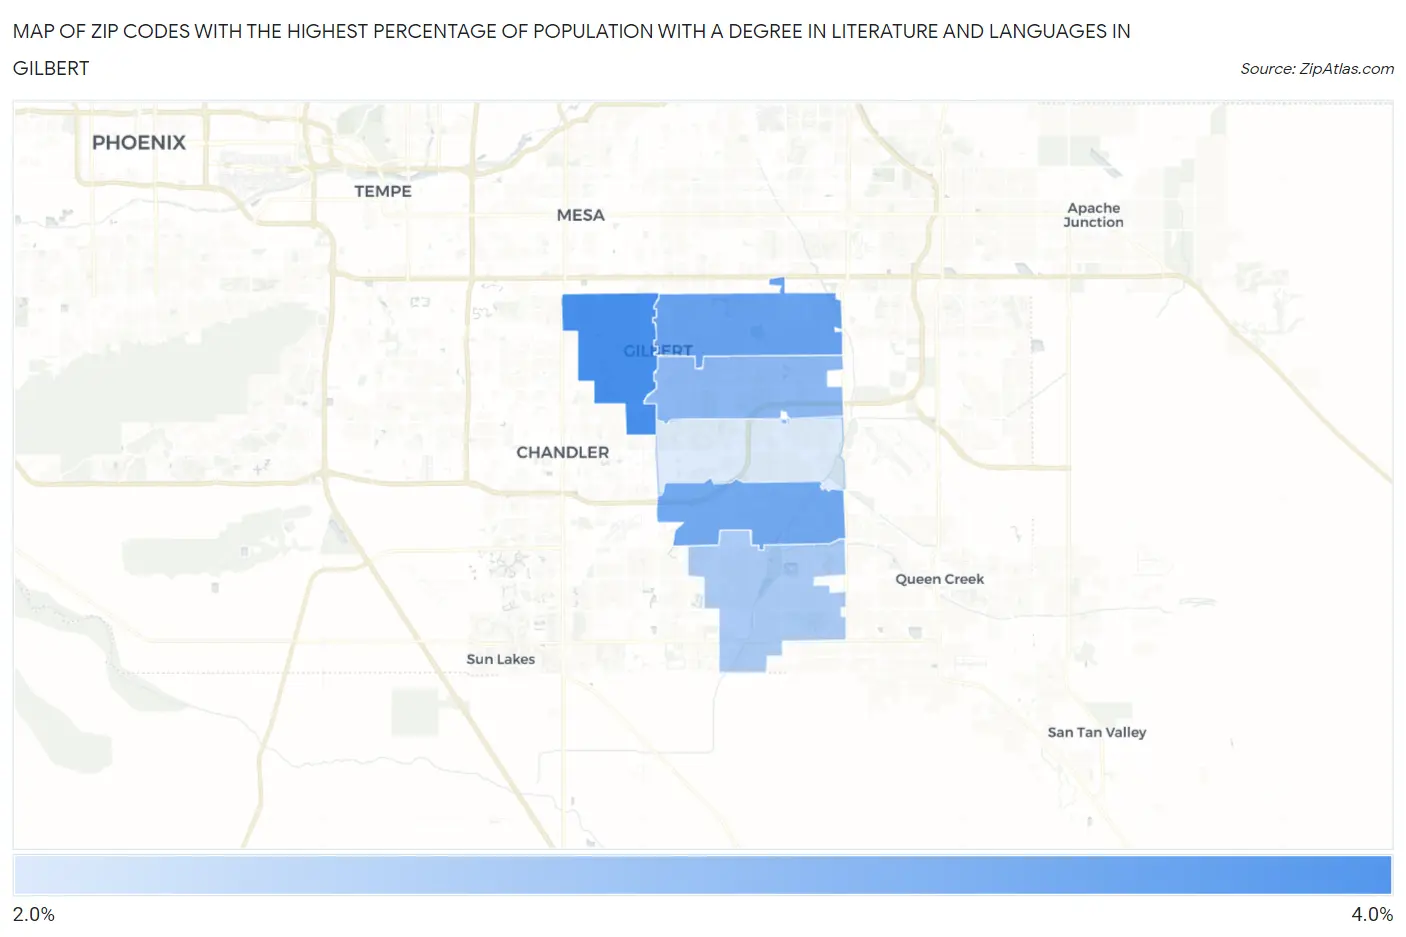
Map of Zip Codes with the Highest Percentage of Population with a Degree in Literature and Languages in Gilbert

0.0%
4.0%
Zip Codes with the Highest Percentage of Population with a Degree in Literature and Languages in Gilbert Map

Zip Codes with the Highest Percentage of Population with a Degree in Literature and Languages in Gilbert, AZ

Zip Code % Graduates vs State vs National
1.852333.9%3.6%(+0.253)#1094.4%(-0.531)#10,567
2.852343.6%3.6%(-0.058)#1274.4%(-0.842)#11,617
3.852973.5%3.6%(-0.145)#1374.4%(-0.929)#11,919
4.852963.2%3.6%(-0.381)#1554.4%(-1.17)#12,748
5.852983.0%3.6%(-0.672)#1724.4%(-1.46)#13,731
6.852952.5%3.6%(-1.13)#1964.4%(-1.92)#15,337

Common Questions

What are the Top 5 Zip Codes with the Highest Percentage of Population with a Degree in Literature and Languages in Gilbert, AZ?
Top 5 Zip Codes with the Highest Percentage of Population with a Degree in Literature and Languages in Gilbert, AZ are:
#1
3.9%
#2
3.6%
#3
3.5%
#4
3.2%
#5
3.0%
What zip code has the Highest Percentage of Population with a Degree in Literature and Languages in Gilbert, AZ?
85233 has the Highest Percentage of Population with a Degree in Literature and Languages in Gilbert, AZ with 3.9%.
What is the Percentage of Population with a Degree in Literature and Languages in Gilbert, AZ?
Percentage of Population with a Degree in Literature and Languages in Gilbert is 3.2%.
What is the Percentage of Population with a Degree in Literature and Languages in Arizona?
Percentage of Population with a Degree in Literature and Languages in Arizona is 3.6%.
What is the Percentage of Population with a Degree in Literature and Languages in the United States?
Percentage of Population with a Degree in Literature and Languages in the United States is 4.4%.