Zip Codes with the Highest Percentage of Population Employed in Health Diagnosing & Treating in North Little Rock, AR
RELATED REPORTS & OPTIONS
Health Diagnosing & Treating
North Little Rock
Compare Zip Codes
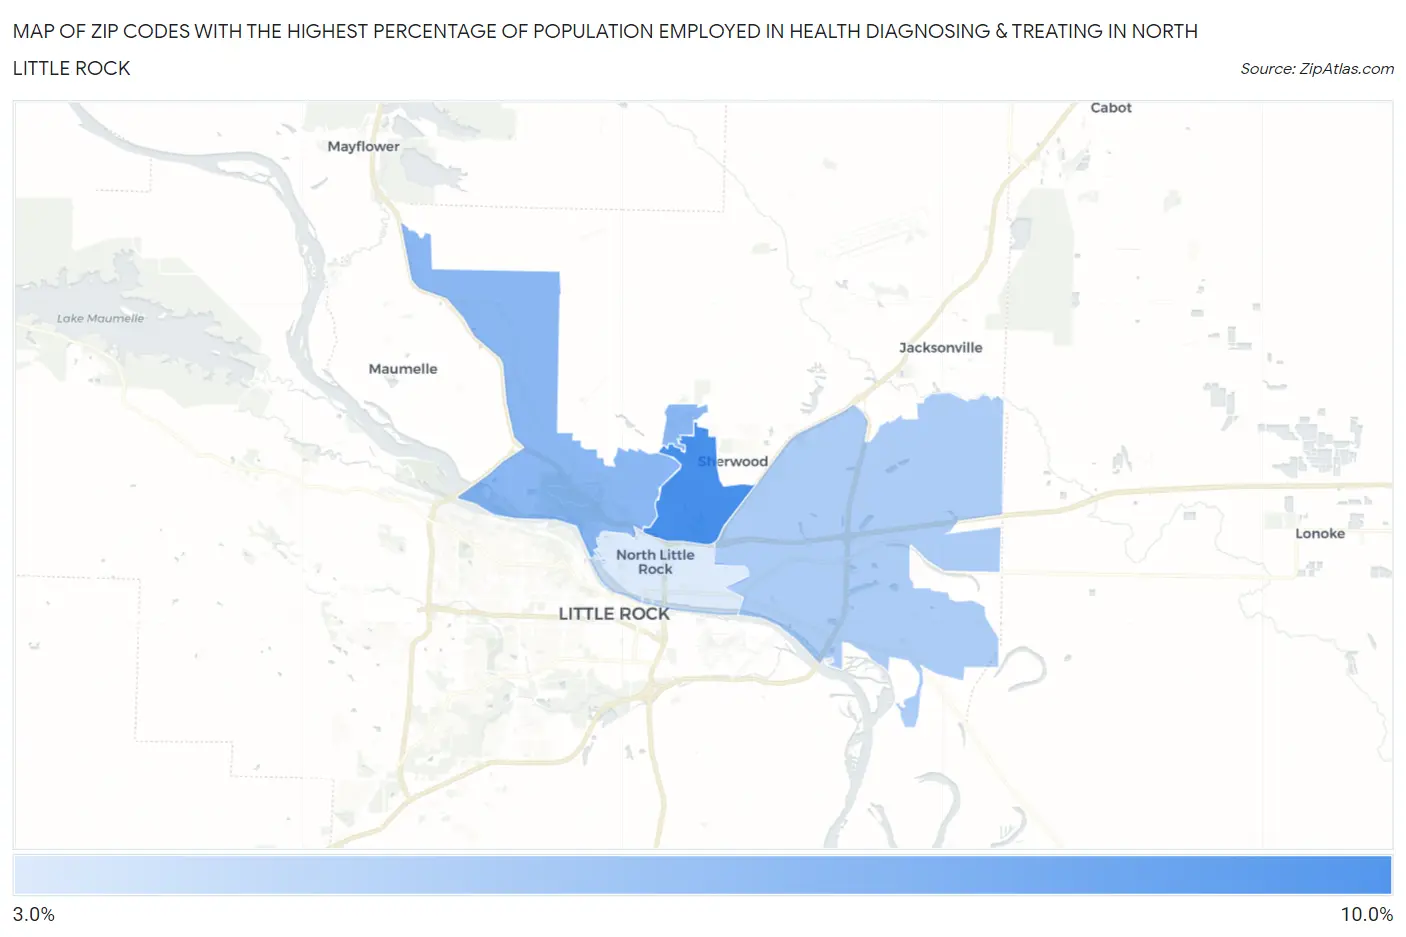
Map of Zip Codes with the Highest Percentage of Population Employed in Health Diagnosing & Treating in North Little Rock
3.9%
10.0%
Zip Codes with the Highest Percentage of Population Employed in Health Diagnosing & Treating in North Little Rock, AR
| Zip Code | % Employed | vs State | vs National | |
| 1. | 72116 | 10.0% | 7.2%(+2.77)#99 | 6.2%(+3.71)#3,953 |
| 2. | 72118 | 7.2% | 7.2%(+0.023)#199 | 6.2%(+0.956)#9,711 |
| 3. | 72117 | 5.8% | 7.2%(-1.39)#255 | 6.2%(-0.454)#14,643 |
| 4. | 72114 | 3.9% | 7.2%(-3.26)#342 | 6.2%(-2.33)#21,625 |
1
Common Questions
What are the Top 3 Zip Codes with the Highest Percentage of Population Employed in Health Diagnosing & Treating in North Little Rock, AR?
Top 3 Zip Codes with the Highest Percentage of Population Employed in Health Diagnosing & Treating in North Little Rock, AR are:
What zip code has the Highest Percentage of Population Employed in Health Diagnosing & Treating in North Little Rock, AR?
72116 has the Highest Percentage of Population Employed in Health Diagnosing & Treating in North Little Rock, AR with 10.0%.
What is the Percentage of Population Employed in Health Diagnosing & Treating in North Little Rock, AR?
Percentage of Population Employed in Health Diagnosing & Treating in North Little Rock is 8.2%.
What is the Percentage of Population Employed in Health Diagnosing & Treating in Arkansas?
Percentage of Population Employed in Health Diagnosing & Treating in Arkansas is 7.2%.
What is the Percentage of Population Employed in Health Diagnosing & Treating in the United States?
Percentage of Population Employed in Health Diagnosing & Treating in the United States is 6.2%.