Zip Codes with the Highest Percentage of Population Employed in Legal Services & Support in North Little Rock, AR
RELATED REPORTS & OPTIONS
Legal Services & Support
North Little Rock
Compare Zip Codes
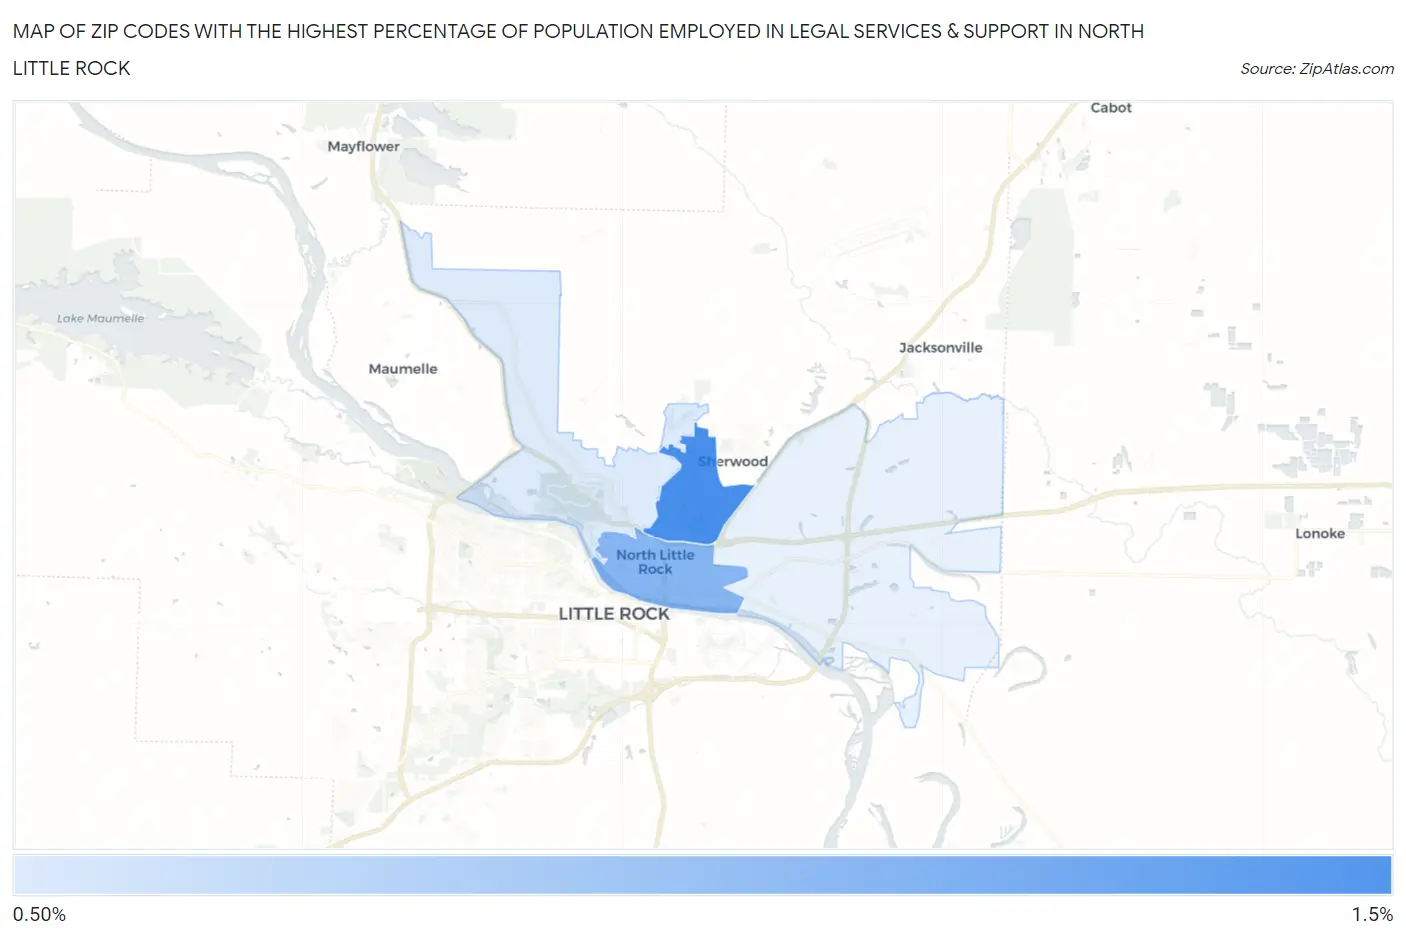
Map of Zip Codes with the Highest Percentage of Population Employed in Legal Services & Support in North Little Rock
0.94%
1.4%
Zip Codes with the Highest Percentage of Population Employed in Legal Services & Support in North Little Rock, AR
| Zip Code | % Employed | vs State | vs National | |
| 1. | 72116 | 1.4% | 0.79%(+0.658)#38 | 1.2%(+0.260)#5,277 |
| 2. | 72114 | 1.2% | 0.79%(+0.447)#53 | 1.2%(+0.048)#6,309 |
| 3. | 72118 | 0.94% | 0.79%(+0.158)#75 | 1.2%(-0.241)#8,253 |
1
Common Questions
What are the Top 3 Zip Codes with the Highest Percentage of Population Employed in Legal Services & Support in North Little Rock, AR?
Top 3 Zip Codes with the Highest Percentage of Population Employed in Legal Services & Support in North Little Rock, AR are:
What zip code has the Highest Percentage of Population Employed in Legal Services & Support in North Little Rock, AR?
72116 has the Highest Percentage of Population Employed in Legal Services & Support in North Little Rock, AR with 1.4%.
What is the Percentage of Population Employed in Legal Services & Support in North Little Rock, AR?
Percentage of Population Employed in Legal Services & Support in North Little Rock is 0.87%.
What is the Percentage of Population Employed in Legal Services & Support in Arkansas?
Percentage of Population Employed in Legal Services & Support in Arkansas is 0.79%.
What is the Percentage of Population Employed in Legal Services & Support in the United States?
Percentage of Population Employed in Legal Services & Support in the United States is 1.2%.