Zip Codes with the Highest Percentage of Households Heated by Utility Gas in Eureka Springs, AR
RELATED REPORTS & OPTIONS
Utility Gas Heating
Eureka Springs
Compare Zip Codes
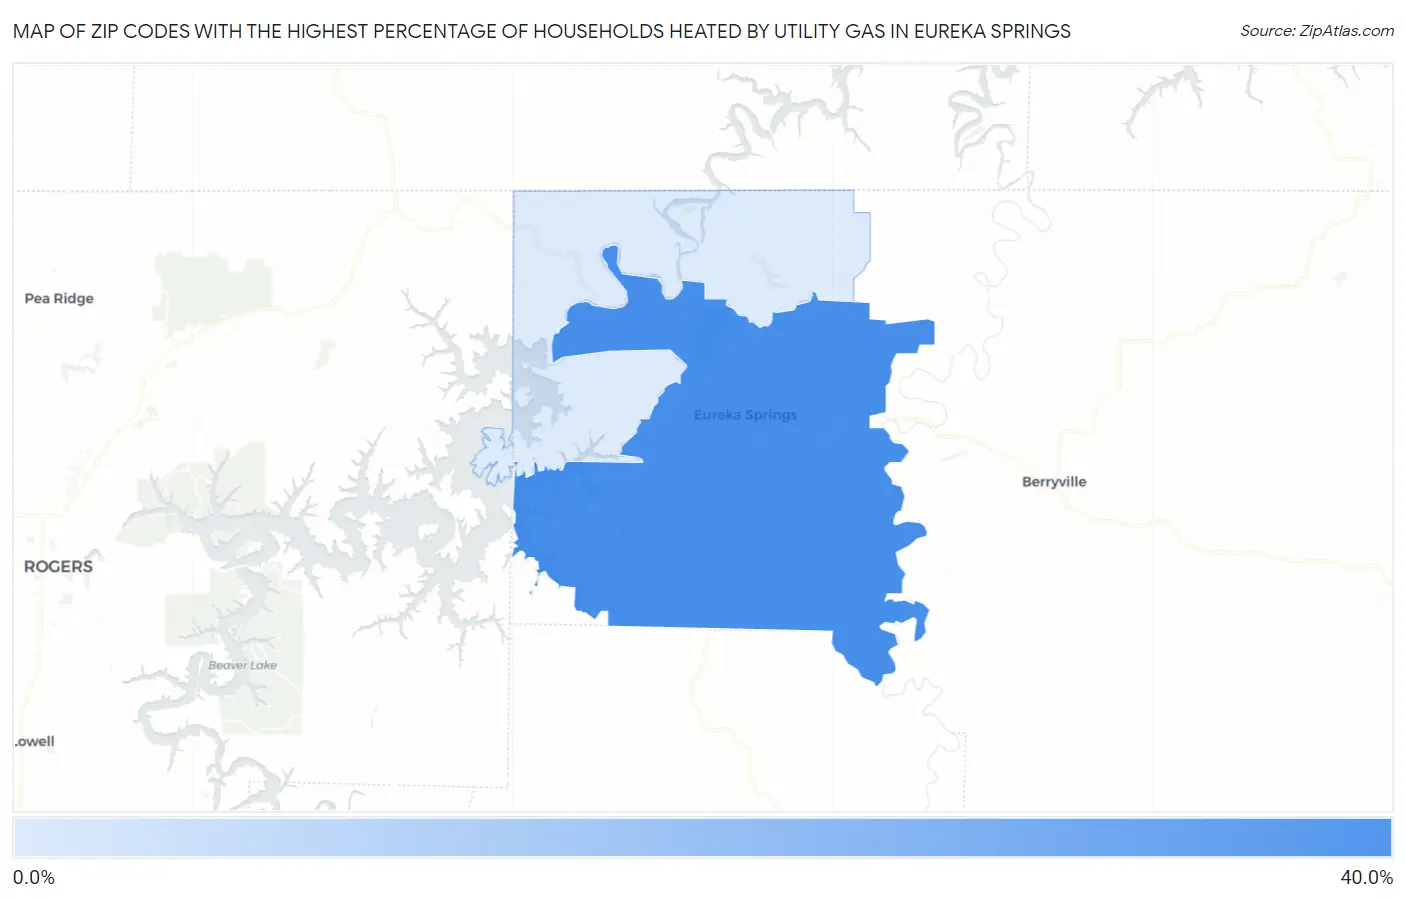
Map of Zip Codes with the Highest Percentage of Households Heated by Utility Gas in Eureka Springs
0.0%
40.0%
Zip Codes with the Highest Percentage of Households Heated by Utility Gas in Eureka Springs, AR
| Zip Code | Utility Gas Heating | vs State | vs National | |
| 1. | 72632 | 34.8% | 37.3%(-2.50)#203 | 47.1%(-12.3)#14,541 |
| 2. | 72631 | 4.1% | 37.3%(-33.2)#435 | 47.1%(-43.0)#23,555 |
1
Common Questions
What are the Top Zip Codes with the Highest Percentage of Households Heated by Utility Gas in Eureka Springs, AR?
Top Zip Codes with the Highest Percentage of Households Heated by Utility Gas in Eureka Springs, AR are:
What zip code has the Highest Percentage of Households Heated by Utility Gas in Eureka Springs, AR?
72632 has the Highest Percentage of Households Heated by Utility Gas in Eureka Springs, AR with 34.8%.
What is the Percentage of Households Heated by Utility Gas in Eureka Springs, AR?
Percentage of Households Heated by Utility Gas in Eureka Springs is 58.0%.
What is the Percentage of Households Heated by Utility Gas in Arkansas?
Percentage of Households Heated by Utility Gas in Arkansas is 37.3%.
What is the Percentage of Households Heated by Utility Gas in the United States?
Percentage of Households Heated by Utility Gas in the United States is 47.1%.