Zip Codes with the Highest Percentage of Population Employed in Life, Physical & Social Science in Lynnwood, WA
RELATED REPORTS & OPTIONS
Life, Physical & Social Science
Lynnwood
Compare Zip Codes
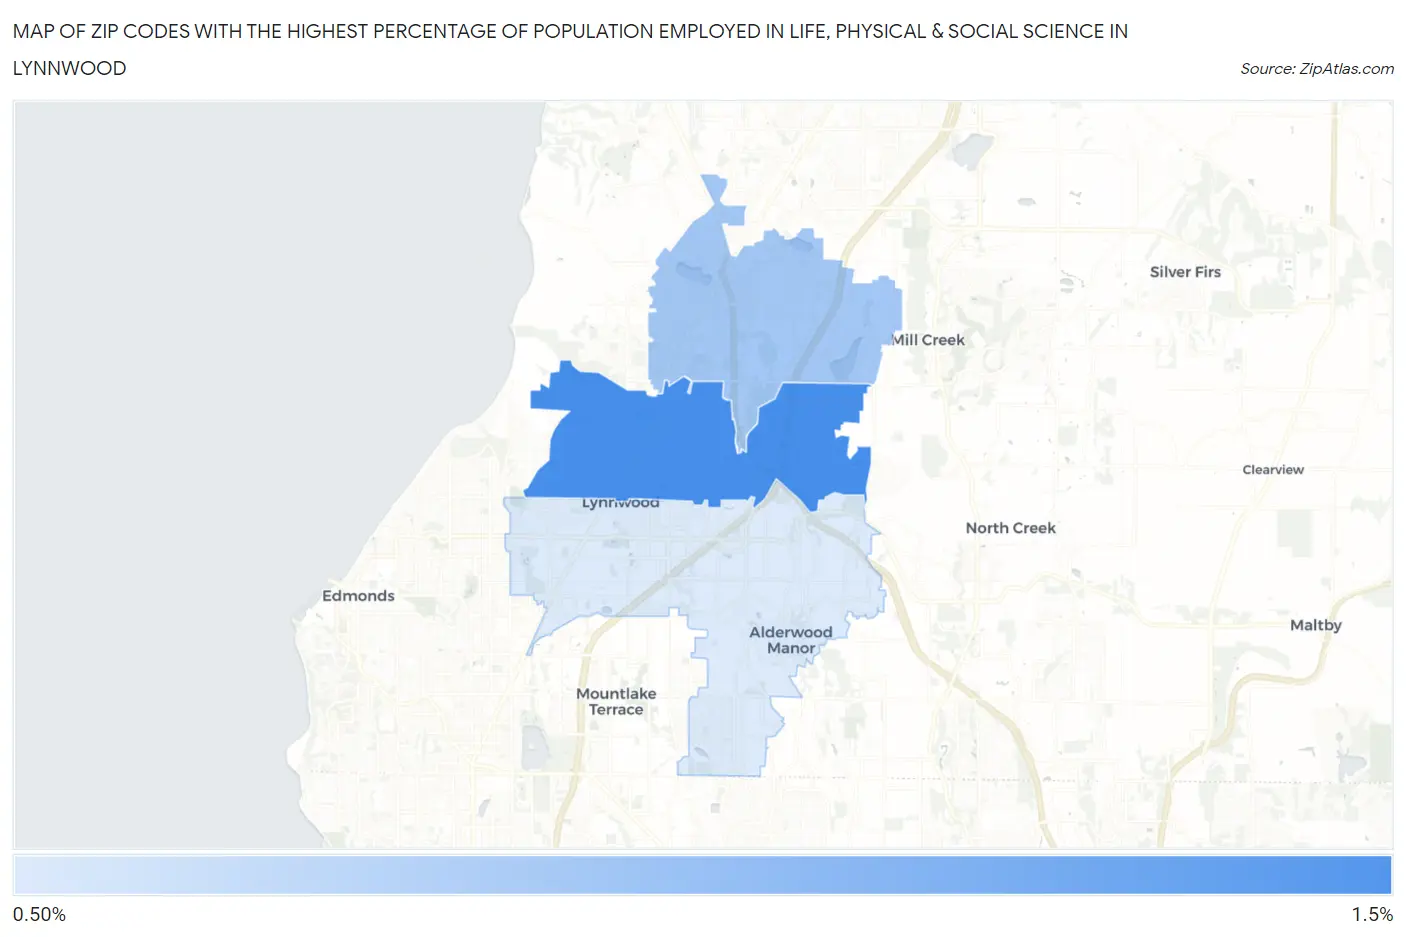
Map of Zip Codes with the Highest Percentage of Population Employed in Life, Physical & Social Science in Lynnwood
0.75%
1.3%
Zip Codes with the Highest Percentage of Population Employed in Life, Physical & Social Science in Lynnwood, WA
| Zip Code | % Employed | vs State | vs National | |
| 1. | 98037 | 1.3% | 1.3%(+0.032)#178 | 1.1%(+0.252)#6,507 |
| 2. | 98087 | 0.98% | 1.3%(-0.331)#225 | 1.1%(-0.110)#9,228 |
| 3. | 98036 | 0.75% | 1.3%(-0.564)#279 | 1.1%(-0.344)#11,541 |
1
Common Questions
What are the Top Zip Codes with the Highest Percentage of Population Employed in Life, Physical & Social Science in Lynnwood, WA?
Top Zip Codes with the Highest Percentage of Population Employed in Life, Physical & Social Science in Lynnwood, WA are:
What zip code has the Highest Percentage of Population Employed in Life, Physical & Social Science in Lynnwood, WA?
98037 has the Highest Percentage of Population Employed in Life, Physical & Social Science in Lynnwood, WA with 1.3%.
What is the Percentage of Population Employed in Life, Physical & Social Science in Lynnwood, WA?
Percentage of Population Employed in Life, Physical & Social Science in Lynnwood is 0.79%.
What is the Percentage of Population Employed in Life, Physical & Social Science in Washington?
Percentage of Population Employed in Life, Physical & Social Science in Washington is 1.3%.
What is the Percentage of Population Employed in Life, Physical & Social Science in the United States?
Percentage of Population Employed in Life, Physical & Social Science in the United States is 1.1%.