Zip Codes with the Highest Percentage of Population Employed in Finance & Insurance in Seattle, WA
RELATED REPORTS & OPTIONS
Finance & Insurance
Seattle
Compare Zip Codes
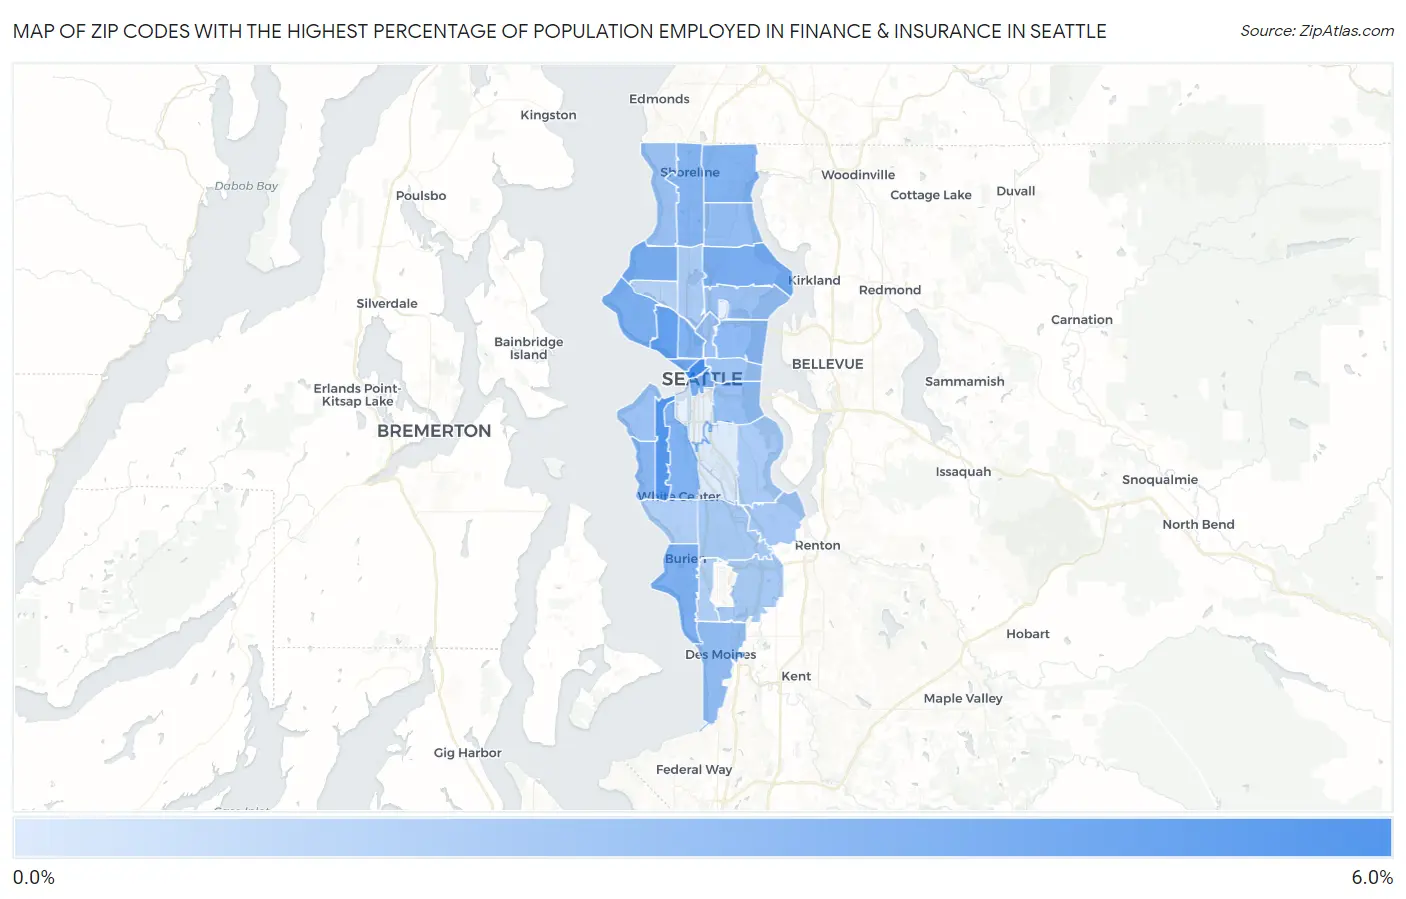
Map of Zip Codes with the Highest Percentage of Population Employed in Finance & Insurance in Seattle
0.0%
6.0%
Zip Codes with the Highest Percentage of Population Employed in Finance & Insurance in Seattle, WA
| Zip Code | % Employed | vs State | vs National | |
| 1. | 98101 | 5.8% | 3.2%(+2.55)#38 | 4.8%(+0.993)#6,374 |
| 2. | 98126 | 5.3% | 3.2%(+2.09)#52 | 4.8%(+0.529)#7,471 |
| 3. | 98119 | 4.7% | 3.2%(+1.52)#82 | 4.8%(-0.042)#9,132 |
| 4. | 98121 | 4.2% | 3.2%(+0.975)#115 | 4.8%(-0.583)#10,903 |
| 5. | 98104 | 4.2% | 3.2%(+0.956)#118 | 4.8%(-0.602)#10,977 |
| 6. | 98117 | 4.2% | 3.2%(+0.945)#120 | 4.8%(-0.613)#11,026 |
| 7. | 98115 | 4.1% | 3.2%(+0.885)#123 | 4.8%(-0.673)#11,214 |
| 8. | 98199 | 4.0% | 3.2%(+0.796)#130 | 4.8%(-0.763)#11,569 |
| 9. | 98166 | 3.9% | 3.2%(+0.668)#137 | 4.8%(-0.890)#12,082 |
| 10. | 98106 | 3.8% | 3.2%(+0.637)#139 | 4.8%(-0.921)#12,188 |
| 11. | 98109 | 3.8% | 3.2%(+0.623)#140 | 4.8%(-0.935)#12,258 |
| 12. | 98155 | 3.8% | 3.2%(+0.579)#142 | 4.8%(-0.979)#12,428 |
| 13. | 98133 | 3.7% | 3.2%(+0.443)#156 | 4.8%(-1.11)#12,958 |
| 14. | 98136 | 3.5% | 3.2%(+0.287)#165 | 4.8%(-1.27)#13,612 |
| 15. | 98112 | 3.3% | 3.2%(+0.140)#175 | 4.8%(-1.42)#14,254 |
| 16. | 98198 | 3.2% | 3.2%(-0.003)#187 | 4.8%(-1.56)#14,881 |
| 17. | 98125 | 3.2% | 3.2%(-0.007)#189 | 4.8%(-1.56)#14,900 |
| 18. | 98144 | 3.1% | 3.2%(-0.101)#205 | 4.8%(-1.66)#15,340 |
| 19. | 98116 | 3.0% | 3.2%(-0.227)#209 | 4.8%(-1.79)#15,906 |
| 20. | 98105 | 3.0% | 3.2%(-0.236)#210 | 4.8%(-1.79)#15,946 |
| 21. | 98102 | 3.0% | 3.2%(-0.255)#214 | 4.8%(-1.81)#16,035 |
| 22. | 98177 | 2.9% | 3.2%(-0.270)#217 | 4.8%(-1.83)#16,106 |
| 23. | 98122 | 2.9% | 3.2%(-0.327)#223 | 4.8%(-1.89)#16,362 |
| 24. | 98178 | 2.6% | 3.2%(-0.595)#247 | 4.8%(-2.15)#17,614 |
| 25. | 98188 | 2.6% | 3.2%(-0.657)#255 | 4.8%(-2.21)#17,917 |
| 26. | 98168 | 2.5% | 3.2%(-0.671)#260 | 4.8%(-2.23)#17,994 |
| 27. | 98103 | 2.5% | 3.2%(-0.745)#268 | 4.8%(-2.30)#18,357 |
| 28. | 98118 | 2.4% | 3.2%(-0.769)#270 | 4.8%(-2.33)#18,461 |
| 29. | 98146 | 2.3% | 3.2%(-0.935)#293 | 4.8%(-2.49)#19,218 |
| 30. | 98148 | 2.1% | 3.2%(-1.08)#312 | 4.8%(-2.64)#19,910 |
| 31. | 98107 | 2.1% | 3.2%(-1.09)#313 | 4.8%(-2.65)#19,963 |
| 32. | 98108 | 0.82% | 3.2%(-2.39)#414 | 4.8%(-3.95)#24,777 |
1
Common Questions
What are the Top 10 Zip Codes with the Highest Percentage of Population Employed in Finance & Insurance in Seattle, WA?
Top 10 Zip Codes with the Highest Percentage of Population Employed in Finance & Insurance in Seattle, WA are:
What zip code has the Highest Percentage of Population Employed in Finance & Insurance in Seattle, WA?
98101 has the Highest Percentage of Population Employed in Finance & Insurance in Seattle, WA with 5.8%.
What is the Percentage of Population Employed in Finance & Insurance in Seattle, WA?
Percentage of Population Employed in Finance & Insurance in Seattle is 3.3%.
What is the Percentage of Population Employed in Finance & Insurance in Washington?
Percentage of Population Employed in Finance & Insurance in Washington is 3.2%.
What is the Percentage of Population Employed in Finance & Insurance in the United States?
Percentage of Population Employed in Finance & Insurance in the United States is 4.8%.