Zip Codes with the Highest Percentage of Population Employed in Agriculture, Fishing & Hunting in Seattle, WA
RELATED REPORTS & OPTIONS
Agriculture, Fishing & Hunting
Seattle
Compare Zip Codes
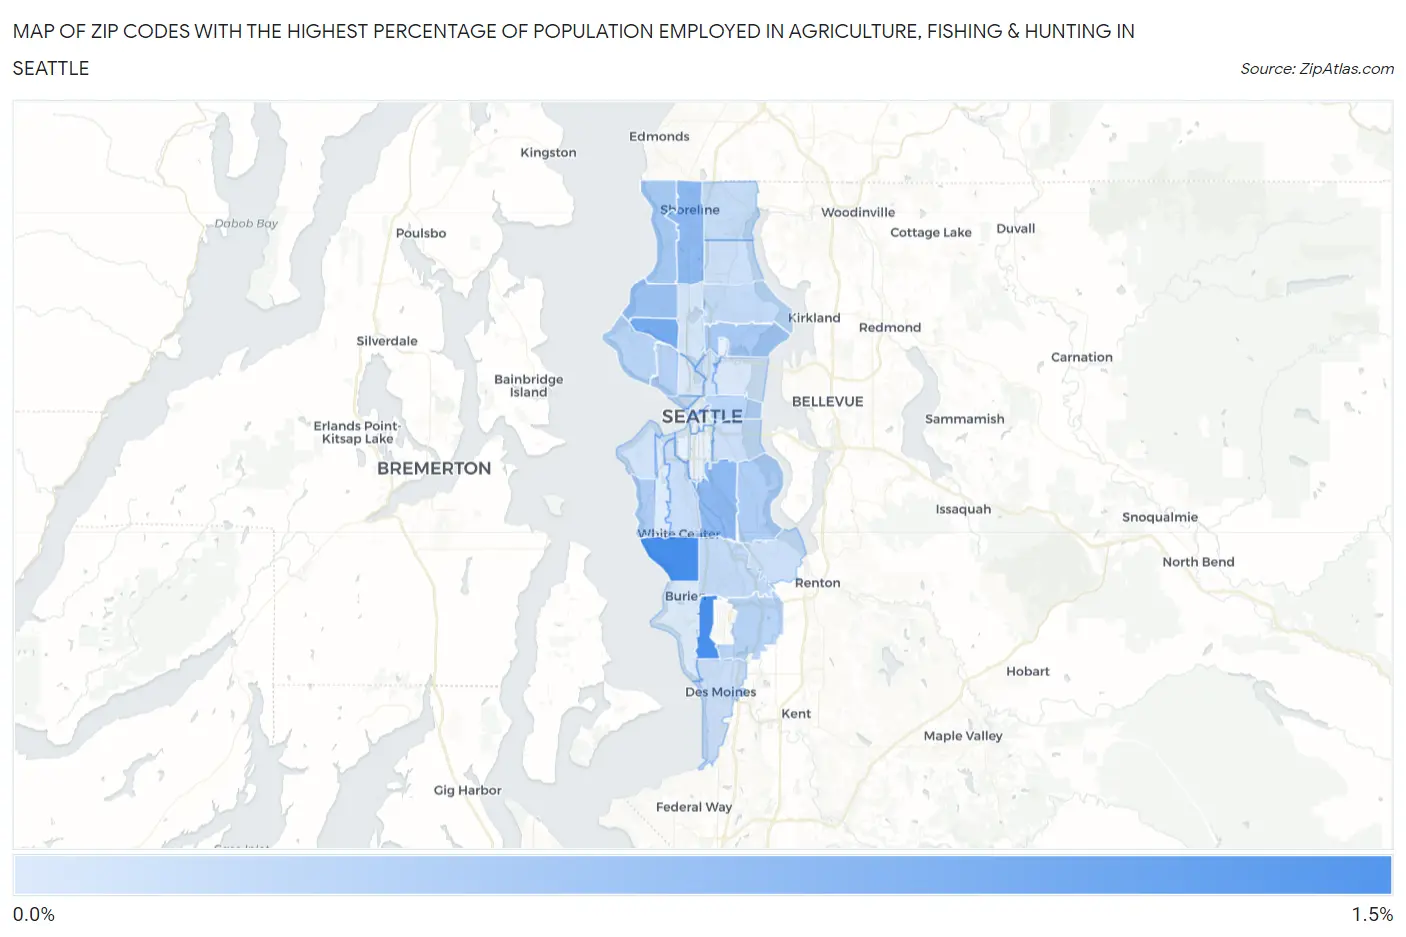
Map of Zip Codes with the Highest Percentage of Population Employed in Agriculture, Fishing & Hunting in Seattle
0.0%
1.5%
Zip Codes with the Highest Percentage of Population Employed in Agriculture, Fishing & Hunting in Seattle, WA
| Zip Code | % Employed | vs State | vs National | |
| 1. | 98146 | 1.1% | 2.4%(-1.25)#330 | 1.2%(-0.059)#15,637 |
| 2. | 98148 | 1.1% | 2.4%(-1.26)#332 | 1.2%(-0.068)#15,672 |
| 3. | 98107 | 0.80% | 2.4%(-1.59)#368 | 1.2%(-0.398)#17,229 |
| 4. | 98108 | 0.65% | 2.4%(-1.74)#385 | 1.2%(-0.545)#18,110 |
| 5. | 98133 | 0.65% | 2.4%(-1.74)#388 | 1.2%(-0.553)#18,159 |
| 6. | 98117 | 0.55% | 2.4%(-1.84)#403 | 1.2%(-0.646)#18,824 |
| 7. | 98177 | 0.48% | 2.4%(-1.91)#411 | 1.2%(-0.721)#19,455 |
| 8. | 98105 | 0.46% | 2.4%(-1.93)#414 | 1.2%(-0.738)#19,605 |
| 9. | 98136 | 0.43% | 2.4%(-1.96)#420 | 1.2%(-0.767)#19,873 |
| 10. | 98118 | 0.42% | 2.4%(-1.97)#425 | 1.2%(-0.782)#20,003 |
| 11. | 98119 | 0.37% | 2.4%(-2.02)#433 | 1.2%(-0.830)#20,448 |
| 12. | 98199 | 0.36% | 2.4%(-2.03)#437 | 1.2%(-0.844)#20,592 |
| 13. | 98188 | 0.36% | 2.4%(-2.04)#438 | 1.2%(-0.844)#20,596 |
| 14. | 98122 | 0.35% | 2.4%(-2.04)#440 | 1.2%(-0.850)#20,664 |
| 15. | 98168 | 0.30% | 2.4%(-2.09)#451 | 1.2%(-0.901)#21,190 |
| 16. | 98115 | 0.29% | 2.4%(-2.10)#452 | 1.2%(-0.906)#21,238 |
| 17. | 98155 | 0.27% | 2.4%(-2.12)#456 | 1.2%(-0.927)#21,515 |
| 18. | 98121 | 0.26% | 2.4%(-2.13)#459 | 1.2%(-0.936)#21,609 |
| 19. | 98106 | 0.25% | 2.4%(-2.14)#462 | 1.2%(-0.949)#21,754 |
| 20. | 98198 | 0.24% | 2.4%(-2.15)#465 | 1.2%(-0.959)#21,871 |
| 21. | 98125 | 0.23% | 2.4%(-2.16)#467 | 1.2%(-0.971)#21,998 |
| 22. | 98144 | 0.23% | 2.4%(-2.16)#469 | 1.2%(-0.971)#22,002 |
| 23. | 98178 | 0.22% | 2.4%(-2.17)#473 | 1.2%(-0.978)#22,086 |
| 24. | 98102 | 0.20% | 2.4%(-2.19)#476 | 1.2%(-1.00)#22,414 |
| 25. | 98116 | 0.19% | 2.4%(-2.20)#479 | 1.2%(-1.01)#22,480 |
| 26. | 98103 | 0.17% | 2.4%(-2.22)#485 | 1.2%(-1.03)#22,750 |
| 27. | 98112 | 0.16% | 2.4%(-2.23)#486 | 1.2%(-1.04)#22,900 |
| 28. | 98109 | 0.15% | 2.4%(-2.24)#488 | 1.2%(-1.05)#23,070 |
| 29. | 98166 | 0.12% | 2.4%(-2.27)#494 | 1.2%(-1.08)#23,365 |
| 30. | 98126 | 0.12% | 2.4%(-2.27)#496 | 1.2%(-1.08)#23,431 |
1
Common Questions
What are the Top 10 Zip Codes with the Highest Percentage of Population Employed in Agriculture, Fishing & Hunting in Seattle, WA?
Top 10 Zip Codes with the Highest Percentage of Population Employed in Agriculture, Fishing & Hunting in Seattle, WA are:
What zip code has the Highest Percentage of Population Employed in Agriculture, Fishing & Hunting in Seattle, WA?
98146 has the Highest Percentage of Population Employed in Agriculture, Fishing & Hunting in Seattle, WA with 1.1%.
What is the Percentage of Population Employed in Agriculture, Fishing & Hunting in Seattle, WA?
Percentage of Population Employed in Agriculture, Fishing & Hunting in Seattle is 0.32%.
What is the Percentage of Population Employed in Agriculture, Fishing & Hunting in Washington?
Percentage of Population Employed in Agriculture, Fishing & Hunting in Washington is 2.4%.
What is the Percentage of Population Employed in Agriculture, Fishing & Hunting in the United States?
Percentage of Population Employed in Agriculture, Fishing & Hunting in the United States is 1.2%.