Troy, VT Map & Demographics
Troy Map
Troy Overview
$41,725
PER CAPITA INCOME
$84,107
AVG FAMILY INCOME
$83,810
AVG HOUSEHOLD INCOME
0.23
INEQUALITY / GINI INDEX
137
TOTAL POPULATION
73
MALE POPULATION
64
FEMALE POPULATION
114.06
MALES / 100 FEMALES
87.67
FEMALES / 100 MALES
66.3
MEDIAN AGE
2.1
AVG FAMILY SIZE
2.0
AVG HOUSEHOLD SIZE
82
LABOR FORCE [ PEOPLE ]
63.1%
PERCENT IN LABOR FORCE
Troy Zip Codes
Troy Area Codes
Income in Troy
Income Overview in Troy
Per Capita Income in Troy is $41,725, while median incomes of families and households are $84,107 and $83,810 respectively.
| Characteristic | Number | Measure |
| Per Capita Income | 137 | $41,725 |
| Median Family Income | 53 | $84,107 |
| Mean Family Income | 53 | $88,038 |
| Median Household Income | 68 | $83,810 |
| Mean Household Income | 68 | $84,466 |
| Income Deficit | 53 | $0 |
| Wage / Income Gap (%) | 137 | 0.00% |
| Wage / Income Gap ($) | 137 | 100.00¢ per $1 |
| Gini / Inequality Index | 137 | 0.23 |
Earnings by Sex in Troy
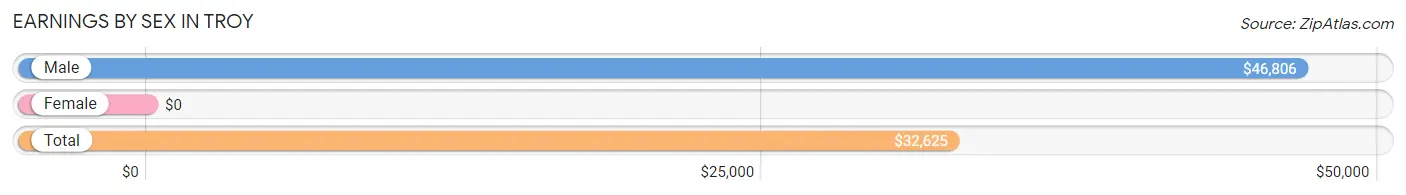
| Sex | Number | Average Earnings |
| Male | 61 (54.9%) | $46,806 |
| Female | 50 (45.1%) | $0 |
| Total | 111 (100.0%) | $32,625 |
Earnings by Sex by Income Bracket in Troy
The most common earnings brackets in Troy are $65,000 to $74,999 for men (21 | 34.4%) and $5,000 to $7,499 for women (16 | 32.0%).
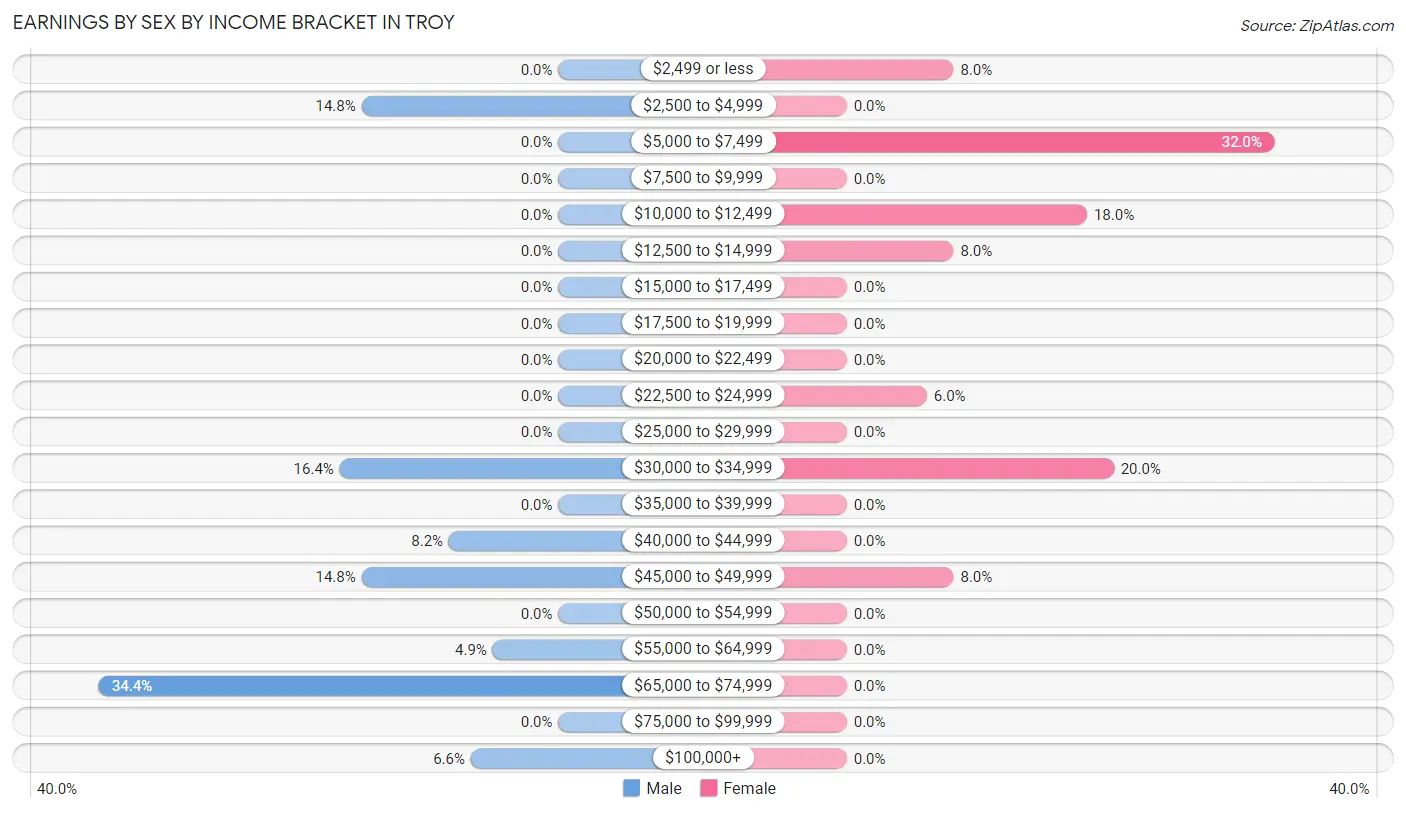
| Income | Male | Female |
| $2,499 or less | 0 (0.0%) | 4 (8.0%) |
| $2,500 to $4,999 | 9 (14.7%) | 0 (0.0%) |
| $5,000 to $7,499 | 0 (0.0%) | 16 (32.0%) |
| $7,500 to $9,999 | 0 (0.0%) | 0 (0.0%) |
| $10,000 to $12,499 | 0 (0.0%) | 9 (18.0%) |
| $12,500 to $14,999 | 0 (0.0%) | 4 (8.0%) |
| $15,000 to $17,499 | 0 (0.0%) | 0 (0.0%) |
| $17,500 to $19,999 | 0 (0.0%) | 0 (0.0%) |
| $20,000 to $22,499 | 0 (0.0%) | 0 (0.0%) |
| $22,500 to $24,999 | 0 (0.0%) | 3 (6.0%) |
| $25,000 to $29,999 | 0 (0.0%) | 0 (0.0%) |
| $30,000 to $34,999 | 10 (16.4%) | 10 (20.0%) |
| $35,000 to $39,999 | 0 (0.0%) | 0 (0.0%) |
| $40,000 to $44,999 | 5 (8.2%) | 0 (0.0%) |
| $45,000 to $49,999 | 9 (14.7%) | 4 (8.0%) |
| $50,000 to $54,999 | 0 (0.0%) | 0 (0.0%) |
| $55,000 to $64,999 | 3 (4.9%) | 0 (0.0%) |
| $65,000 to $74,999 | 21 (34.4%) | 0 (0.0%) |
| $75,000 to $99,999 | 0 (0.0%) | 0 (0.0%) |
| $100,000+ | 4 (6.6%) | 0 (0.0%) |
| Total | 61 (100.0%) | 50 (100.0%) |
Earnings by Sex by Educational Attainment in Troy
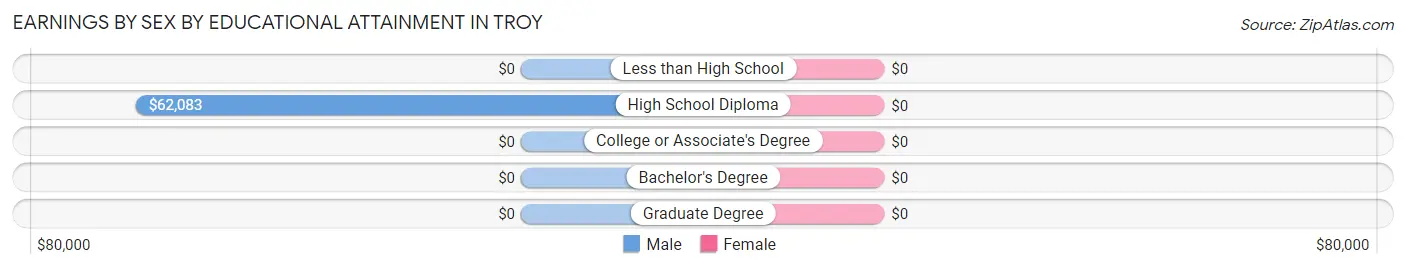
| Educational Attainment | Male Income | Female Income |
| Less than High School | - | - |
| High School Diploma | $62,083 | $0 |
| College or Associate's Degree | - | - |
| Bachelor's Degree | - | - |
| Graduate Degree | - | - |
| Total | $53,750 | $10,694 |
Family Income in Troy
Family Income Brackets in Troy
According to the Troy family income data, there are 31 families falling into the $75,000 to $99,999 income range, which is the most common income bracket and makes up 58.5% of all families.
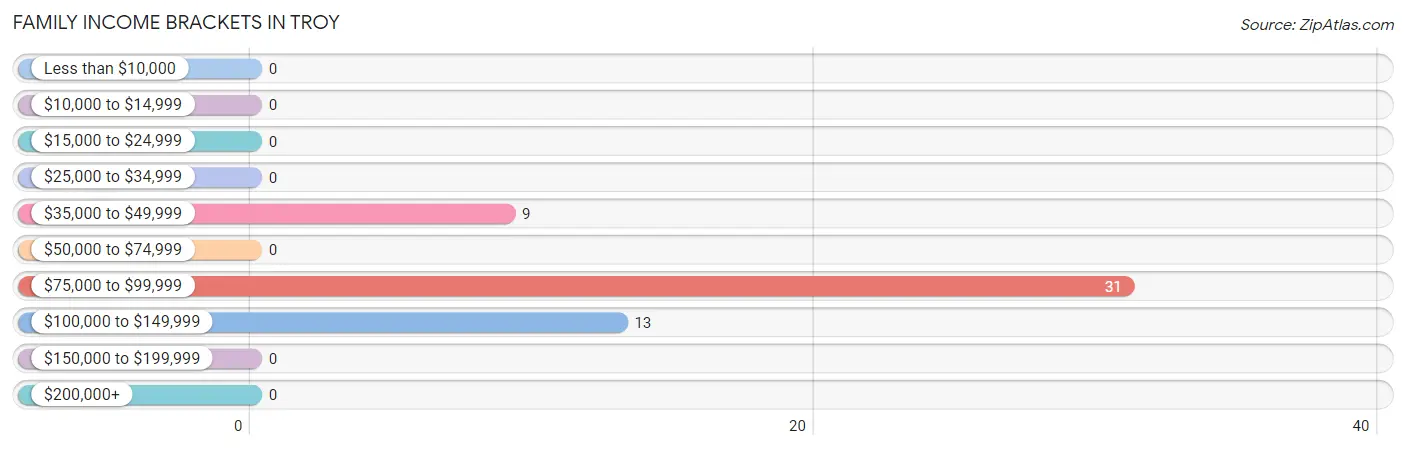
| Income Bracket | # Families | % Families |
| Less than $10,000 | 0 | 0.0% |
| $10,000 to $14,999 | 0 | 0.0% |
| $15,000 to $24,999 | 0 | 0.0% |
| $25,000 to $34,999 | 0 | 0.0% |
| $35,000 to $49,999 | 9 | 17.0% |
| $50,000 to $74,999 | 0 | 0.0% |
| $75,000 to $99,999 | 31 | 58.5% |
| $100,000 to $149,999 | 13 | 24.5% |
| $150,000 to $199,999 | 0 | 0.0% |
| $200,000+ | 0 | 0.0% |
Family Income by Famaliy Size in Troy
2-person families (50 | 94.3%) account for the highest median family income in Troy with $83,929 per family, while 2-person families (50 | 94.3%) have the highest median income of $41,964 per family member.
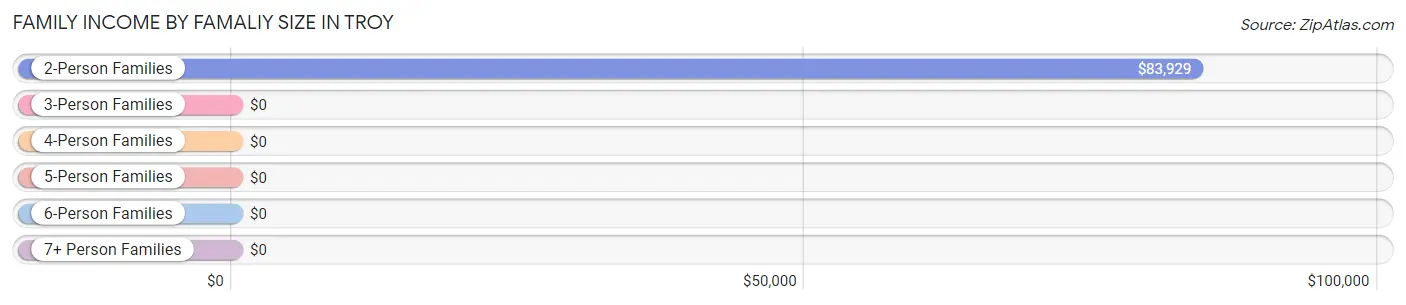
| Income Bracket | # Families | Median Income |
| 2-Person Families | 50 (94.3%) | $83,929 |
| 3-Person Families | 0 (0.0%) | $0 |
| 4-Person Families | 0 (0.0%) | $0 |
| 5-Person Families | 3 (5.7%) | $0 |
| 6-Person Families | 0 (0.0%) | $0 |
| 7+ Person Families | 0 (0.0%) | $0 |
| Total | 53 (100.0%) | $84,107 |
Family Income by Number of Earners in Troy
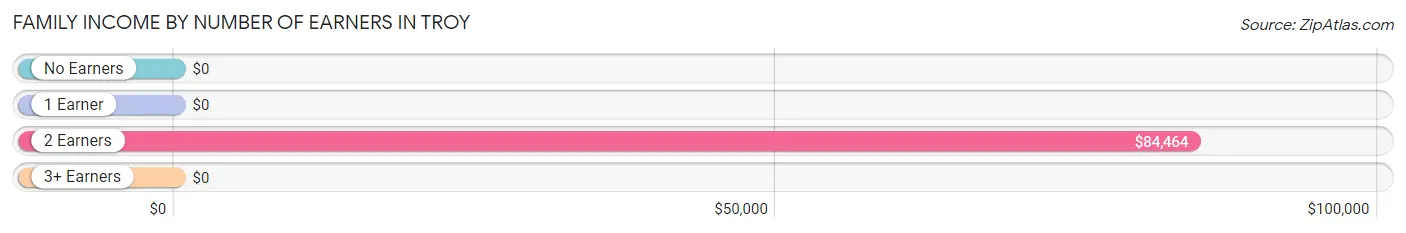
| Number of Earners | # Families | Median Income |
| No Earners | 3 (5.7%) | $0 |
| 1 Earner | 9 (17.0%) | $0 |
| 2 Earners | 41 (77.4%) | $84,464 |
| 3+ Earners | 0 (0.0%) | $0 |
| Total | 53 (100.0%) | $84,107 |
Household Income in Troy
Household Income Brackets in Troy
With 31 households falling in the category, the $75,000 to $99,999 income range is the most frequent in Troy, accounting for 45.6% of all households.
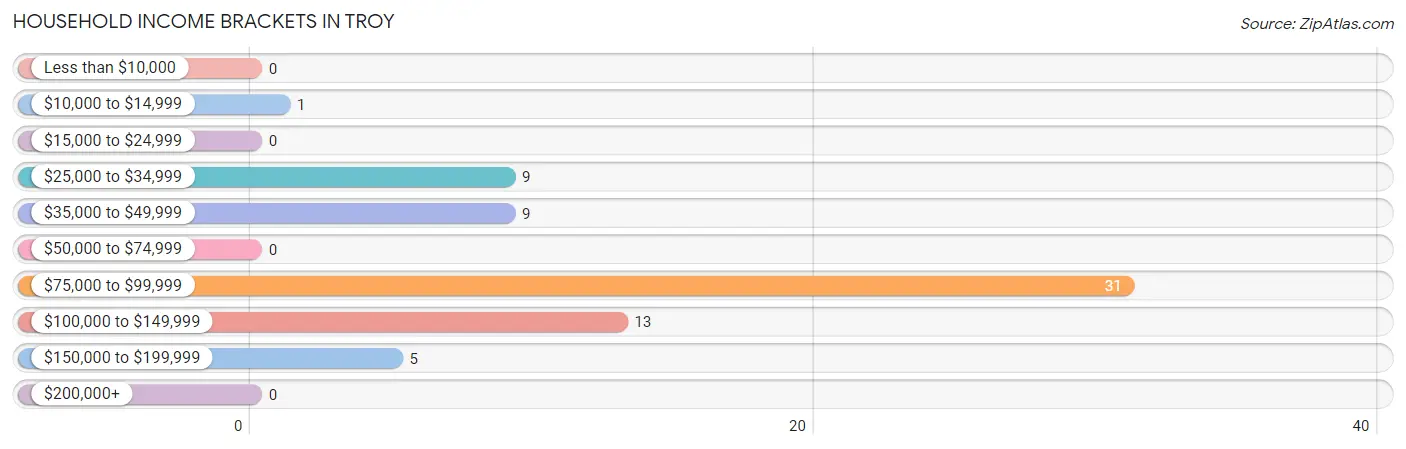
| Income Bracket | # Households | % Households |
| Less than $10,000 | 0 | 0.0% |
| $10,000 to $14,999 | 1 | 1.5% |
| $15,000 to $24,999 | 0 | 0.0% |
| $25,000 to $34,999 | 9 | 13.2% |
| $35,000 to $49,999 | 9 | 13.2% |
| $50,000 to $74,999 | 0 | 0.0% |
| $75,000 to $99,999 | 31 | 45.6% |
| $100,000 to $149,999 | 13 | 19.1% |
| $150,000 to $199,999 | 5 | 7.4% |
| $200,000+ | 0 | 0.0% |
Household Income by Householder Age in Troy
The median household income in Troy is $83,810, with the highest median household income of $83,631 found in the 65+ years age bracket for the primary householder. A total of 47 households (69.1%) fall into this category. Meanwhile, the 15 to 24 years age bracket for the primary householder has the lowest median household income of $0, with 5 households (7.3%) in this group.
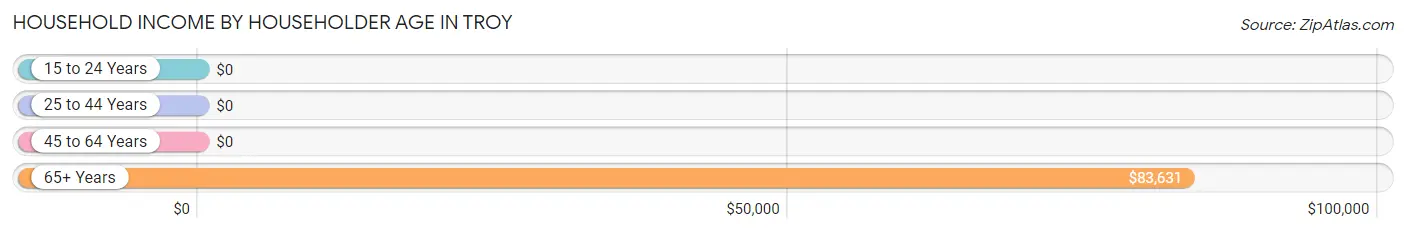
| Income Bracket | # Households | Median Income |
| 15 to 24 Years | 5 (7.3%) | $0 |
| 25 to 44 Years | 7 (10.3%) | $0 |
| 45 to 64 Years | 9 (13.2%) | $0 |
| 65+ Years | 47 (69.1%) | $83,631 |
| Total | 68 (100.0%) | $83,810 |
Poverty in Troy
Income Below Poverty by Sex and Age in Troy
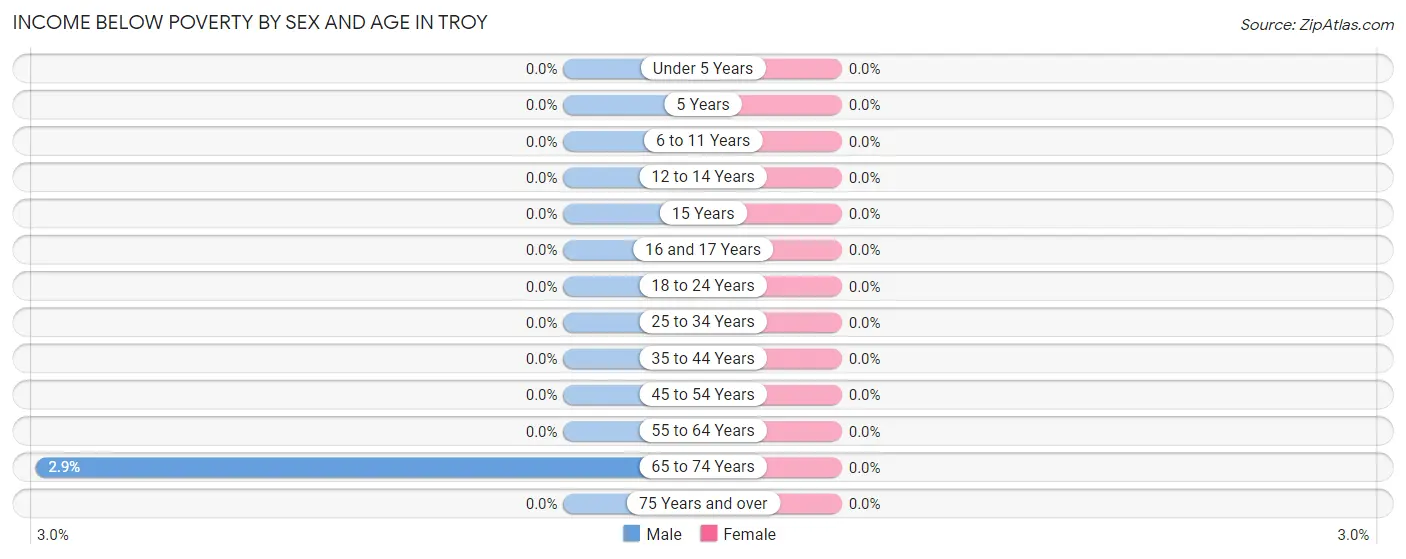
| Age Bracket | Male | Female |
| Under 5 Years | 0 (0.0%) | 0 (0.0%) |
| 5 Years | 0 (0.0%) | 0 (0.0%) |
| 6 to 11 Years | 0 (0.0%) | 0 (0.0%) |
| 12 to 14 Years | 0 (0.0%) | 0 (0.0%) |
| 15 Years | 0 (0.0%) | 0 (0.0%) |
| 16 and 17 Years | 0 (0.0%) | 0 (0.0%) |
| 18 to 24 Years | 0 (0.0%) | 0 (0.0%) |
| 25 to 34 Years | 0 (0.0%) | 0 (0.0%) |
| 35 to 44 Years | 0 (0.0%) | 0 (0.0%) |
| 45 to 54 Years | 0 (0.0%) | 0 (0.0%) |
| 55 to 64 Years | 0 (0.0%) | 0 (0.0%) |
| 65 to 74 Years | 1 (2.9%) | 0 (0.0%) |
| 75 Years and over | 0 (0.0%) | 0 (0.0%) |
| Total | 1 (1.4%) | 0 (0.0%) |
Income Above Poverty by Sex and Age in Troy
According to the poverty statistics in Troy, males aged under 5 years and females aged under 5 years are the age groups that are most secure financially, with 100.0% of males and 100.0% of females in these age groups living above the poverty line.
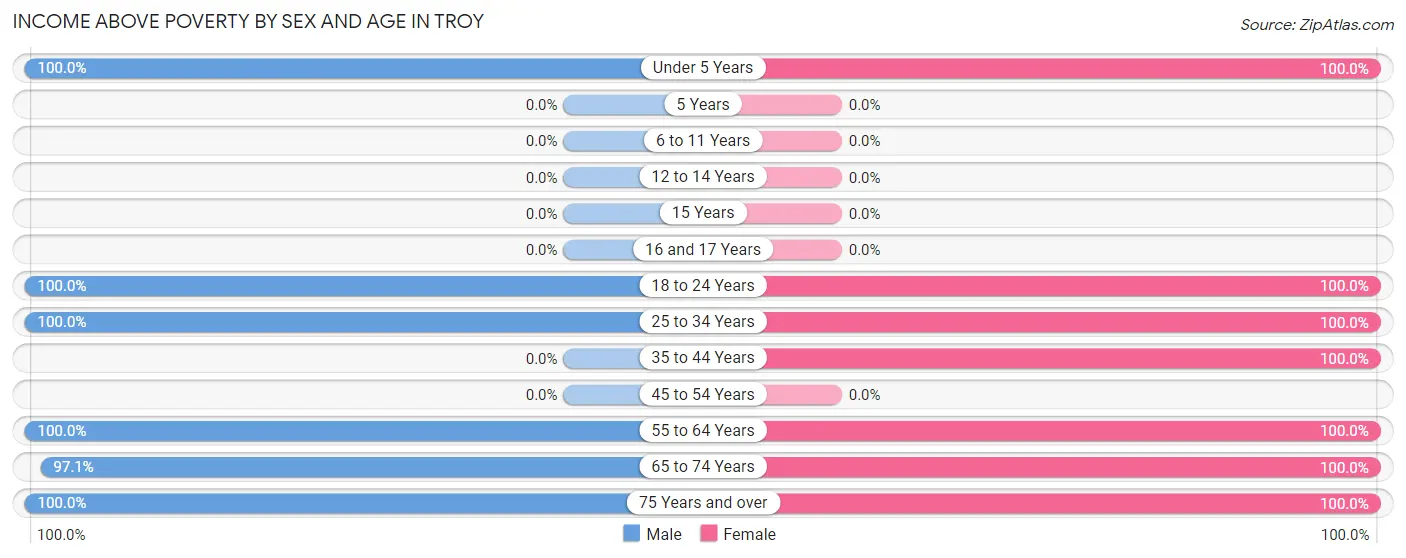
| Age Bracket | Male | Female |
| Under 5 Years | 4 (100.0%) | 3 (100.0%) |
| 5 Years | 0 (0.0%) | 0 (0.0%) |
| 6 to 11 Years | 0 (0.0%) | 0 (0.0%) |
| 12 to 14 Years | 0 (0.0%) | 0 (0.0%) |
| 15 Years | 0 (0.0%) | 0 (0.0%) |
| 16 and 17 Years | 0 (0.0%) | 0 (0.0%) |
| 18 to 24 Years | 5 (100.0%) | 5 (100.0%) |
| 25 to 34 Years | 8 (100.0%) | 3 (100.0%) |
| 35 to 44 Years | 0 (0.0%) | 4 (100.0%) |
| 45 to 54 Years | 0 (0.0%) | 0 (0.0%) |
| 55 to 64 Years | 9 (100.0%) | 9 (100.0%) |
| 65 to 74 Years | 33 (97.1%) | 37 (100.0%) |
| 75 Years and over | 13 (100.0%) | 3 (100.0%) |
| Total | 72 (98.6%) | 64 (100.0%) |
Income Below Poverty Among Married-Couple Families in Troy
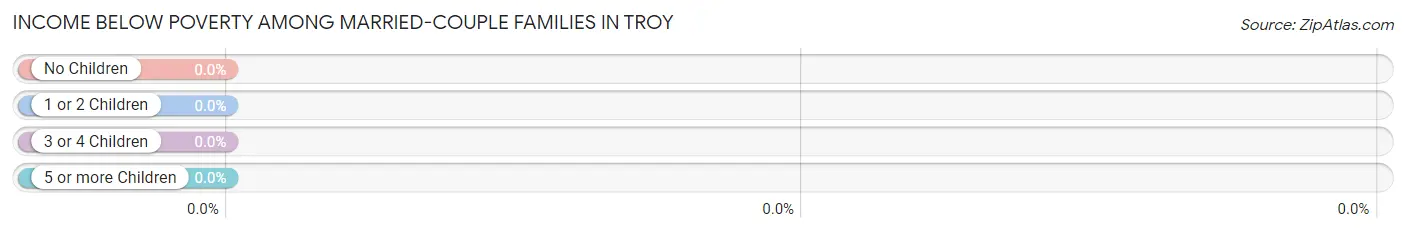
| Children | Above Poverty | Below Poverty |
| No Children | 50 (100.0%) | 0 (0.0%) |
| 1 or 2 Children | 3 (100.0%) | 0 (0.0%) |
| 3 or 4 Children | 0 (0.0%) | 0 (0.0%) |
| 5 or more Children | 0 (0.0%) | 0 (0.0%) |
| Total | 53 (100.0%) | 0 (0.0%) |
Income Below Poverty Among Single-Parent Households in Troy
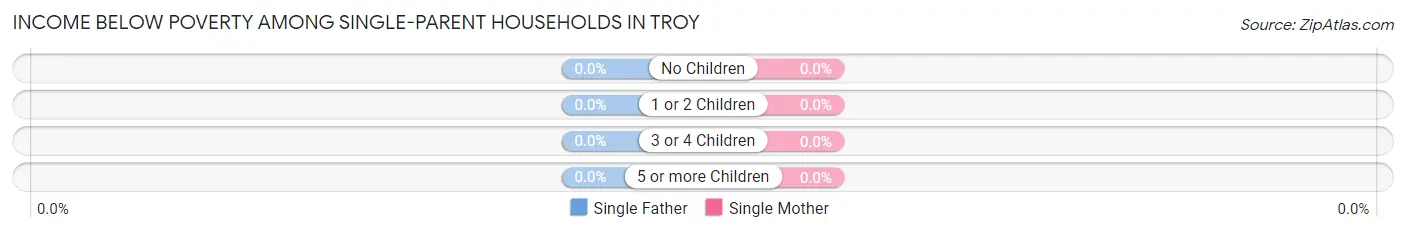
| Children | Single Father | Single Mother |
| No Children | 0 (0.0%) | 0 (0.0%) |
| 1 or 2 Children | 0 (0.0%) | 0 (0.0%) |
| 3 or 4 Children | 0 (0.0%) | 0 (0.0%) |
| 5 or more Children | 0 (0.0%) | 0 (0.0%) |
| Total | 0 (0.0%) | 0 (0.0%) |
Income Below Poverty Among Married-Couple vs Single-Parent Households in Troy
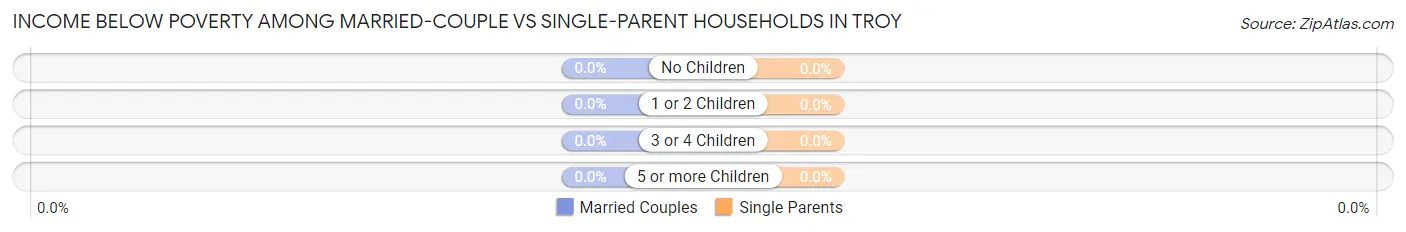
| Children | Married-Couple Families | Single-Parent Households |
| No Children | 0 (0.0%) | 0 (0.0%) |
| 1 or 2 Children | 0 (0.0%) | 0 (0.0%) |
| 3 or 4 Children | 0 (0.0%) | 0 (0.0%) |
| 5 or more Children | 0 (0.0%) | 0 (0.0%) |
| Total | 0 (0.0%) | 0 (0.0%) |
Race in Troy
The most populous races in Troy are White / Caucasian (129 | 94.2%), and Native / Alaskan (8 | 5.8%).
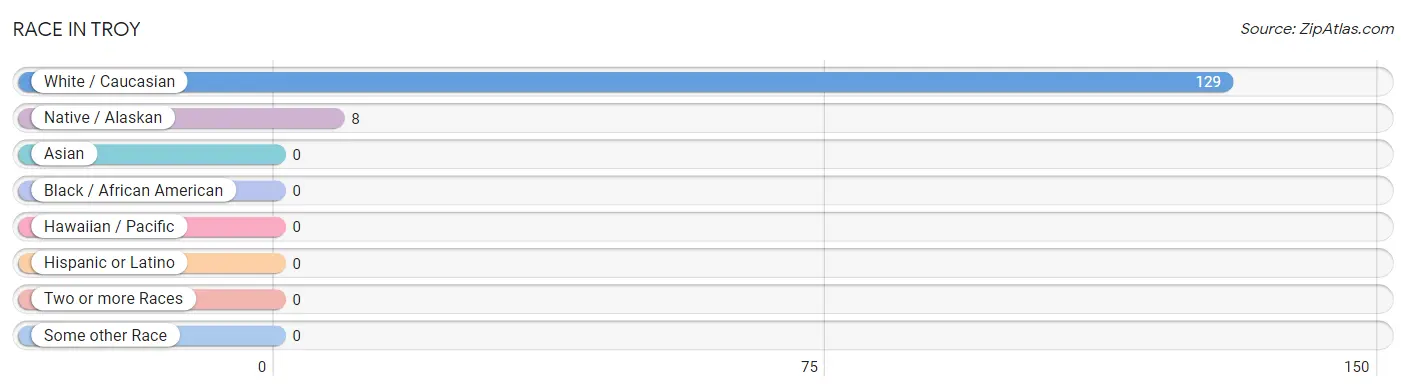
| Race | # Population | % Population |
| Asian | 0 | 0.0% |
| Black / African American | 0 | 0.0% |
| Hawaiian / Pacific | 0 | 0.0% |
| Hispanic or Latino | 0 | 0.0% |
| Native / Alaskan | 8 | 5.8% |
| White / Caucasian | 129 | 94.2% |
| Two or more Races | 0 | 0.0% |
| Some other Race | 0 | 0.0% |
| Total | 137 | 100.0% |
Ancestry in Troy
The most populous ancestries reported in Troy are French Canadian (69 | 50.4%), English (10 | 7.3%), Irish (9 | 6.6%), American (5 | 3.6%), and Polish (5 | 3.6%), together accounting for 71.5% of all Troy residents.
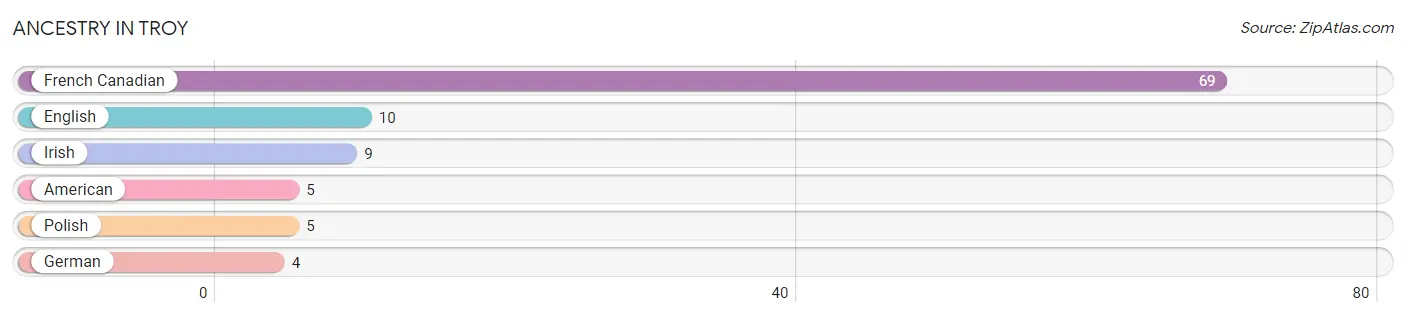
| Ancestry | # Population | % Population |
| American | 5 | 3.6% |
| English | 10 | 7.3% |
| French Canadian | 69 | 50.4% |
| German | 4 | 2.9% |
| Irish | 9 | 6.6% |
| Polish | 5 | 3.6% | View All 6 Rows |
Immigrants in Troy
The most numerous immigrant groups reported in Troy came from Europe (4 | 2.9%), Germany (4 | 2.9%), and Western Europe (4 | 2.9%), together accounting for 8.8% of all Troy residents.
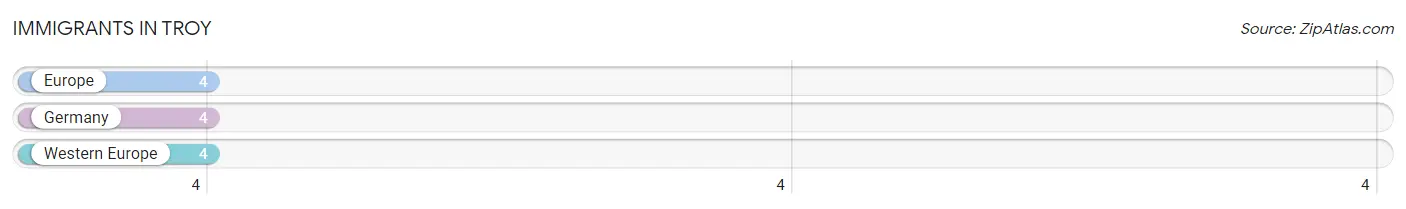
| Immigration Origin | # Population | % Population |
| Europe | 4 | 2.9% |
| Germany | 4 | 2.9% |
| Western Europe | 4 | 2.9% | View All 3 Rows |
Sex and Age in Troy
Sex and Age in Troy
The most populous age groups in Troy are 65 to 69 Years (21 | 28.8%) for men and 65 to 69 Years (29 | 45.3%) for women.
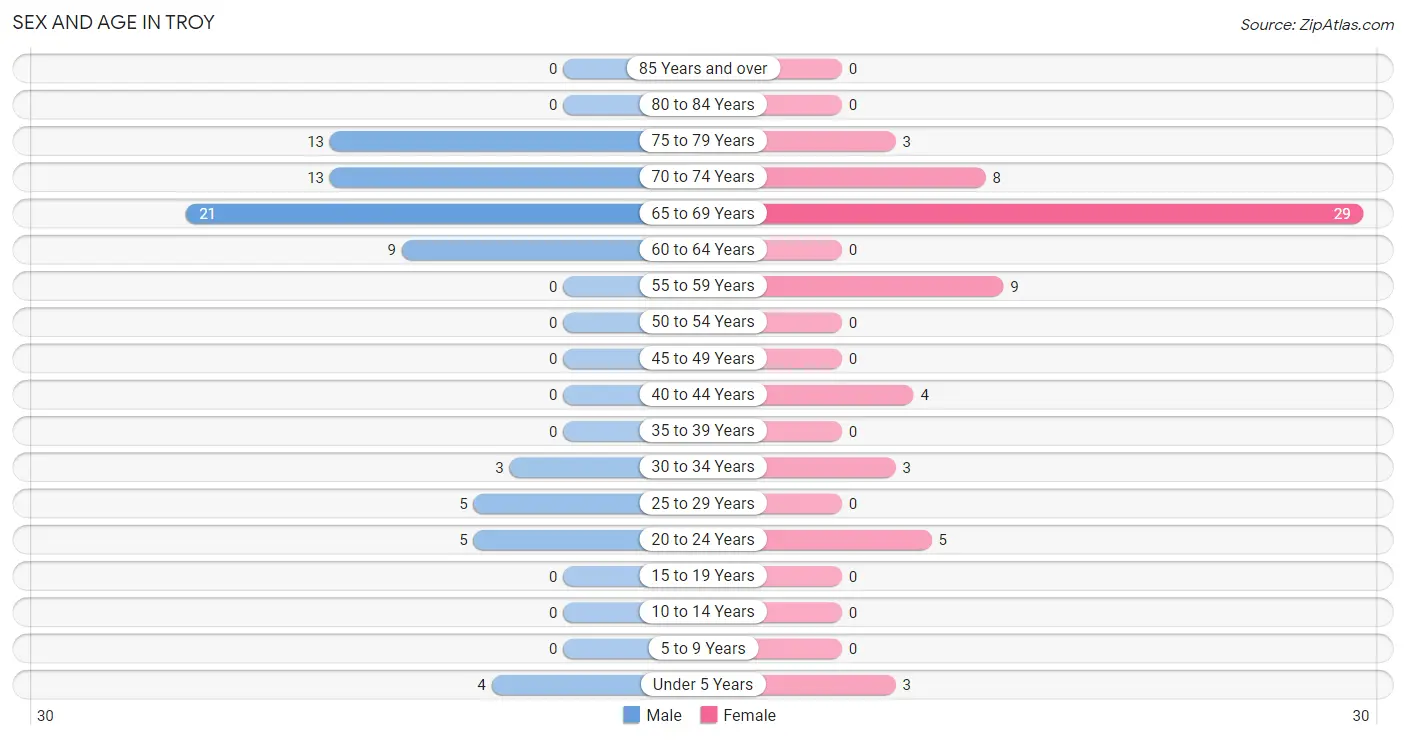
| Age Bracket | Male | Female |
| Under 5 Years | 4 (5.5%) | 3 (4.7%) |
| 5 to 9 Years | 0 (0.0%) | 0 (0.0%) |
| 10 to 14 Years | 0 (0.0%) | 0 (0.0%) |
| 15 to 19 Years | 0 (0.0%) | 0 (0.0%) |
| 20 to 24 Years | 5 (6.9%) | 5 (7.8%) |
| 25 to 29 Years | 5 (6.9%) | 0 (0.0%) |
| 30 to 34 Years | 3 (4.1%) | 3 (4.7%) |
| 35 to 39 Years | 0 (0.0%) | 0 (0.0%) |
| 40 to 44 Years | 0 (0.0%) | 4 (6.2%) |
| 45 to 49 Years | 0 (0.0%) | 0 (0.0%) |
| 50 to 54 Years | 0 (0.0%) | 0 (0.0%) |
| 55 to 59 Years | 0 (0.0%) | 9 (14.1%) |
| 60 to 64 Years | 9 (12.3%) | 0 (0.0%) |
| 65 to 69 Years | 21 (28.8%) | 29 (45.3%) |
| 70 to 74 Years | 13 (17.8%) | 8 (12.5%) |
| 75 to 79 Years | 13 (17.8%) | 3 (4.7%) |
| 80 to 84 Years | 0 (0.0%) | 0 (0.0%) |
| 85 Years and over | 0 (0.0%) | 0 (0.0%) |
| Total | 73 (100.0%) | 64 (100.0%) |
Families and Households in Troy
Median Family Size in Troy
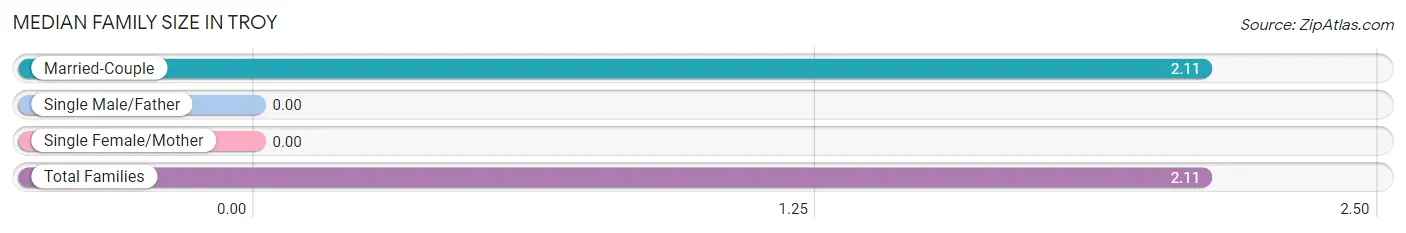
| Family Type | # Families | Family Size |
| Married-Couple | 53 (100.0%) | 2.11 |
| Single Male/Father | 0 (0.0%) | - |
| Single Female/Mother | 0 (0.0%) | - |
| Total Families | 53 (100.0%) | 2.11 |
Median Household Size in Troy
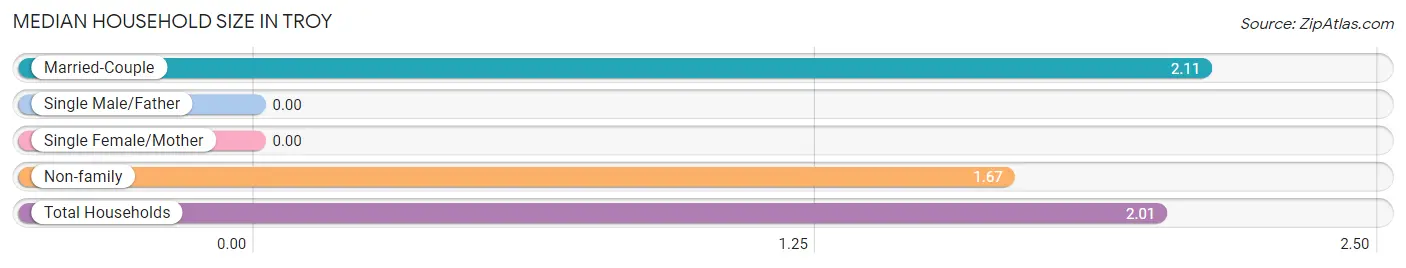
| Household Type | # Households | Household Size |
| Married-Couple | 53 (77.9%) | 2.11 |
| Single Male/Father | 0 (0.0%) | - |
| Single Female/Mother | 0 (0.0%) | - |
| Non-family | 15 (22.1%) | 1.67 |
| Total Households | 68 (100.0%) | 2.01 |
Household Size by Marriage Status in Troy
Out of a total of 68 households in Troy, 53 (77.9%) are family households, while 15 (22.1%) are nonfamily households. The most numerous type of family households are 2-person households, comprising 50, and the most common type of nonfamily households are 1-person households, comprising 10.
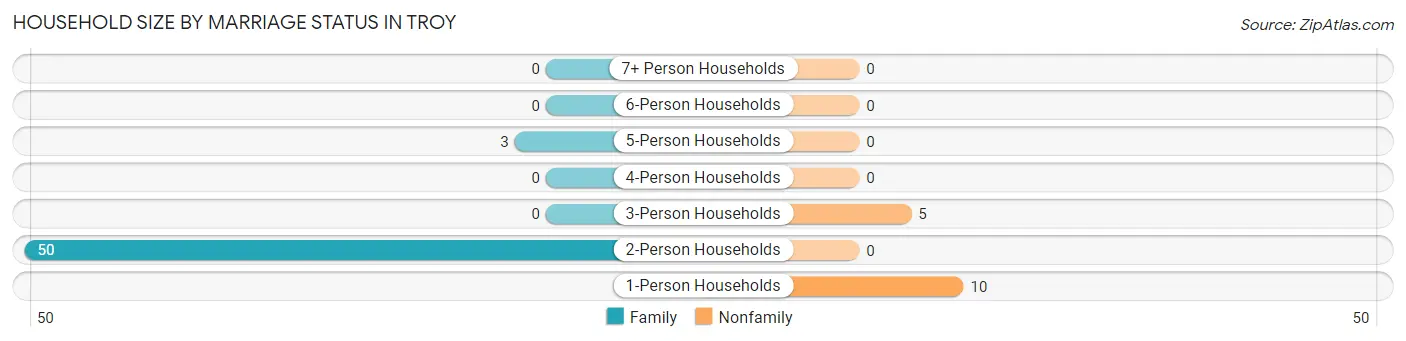
| Household Size | Family Households | Nonfamily Households |
| 1-Person Households | - | 10 (14.7%) |
| 2-Person Households | 50 (73.5%) | 0 (0.0%) |
| 3-Person Households | 0 (0.0%) | 5 (7.3%) |
| 4-Person Households | 0 (0.0%) | 0 (0.0%) |
| 5-Person Households | 3 (4.4%) | 0 (0.0%) |
| 6-Person Households | 0 (0.0%) | 0 (0.0%) |
| 7+ Person Households | 0 (0.0%) | 0 (0.0%) |
| Total | 53 (77.9%) | 15 (22.1%) |
Female Fertility in Troy
Fertility by Age in Troy
Average fertility rate in Troy is 250.0 births per 1,000 women. Women in the age bracket of 20 to 34 years have the highest fertility rate with 375.0 births per 1,000 women. Women in the age bracket of 20 to 34 years acount for 100.0% of all women with births.
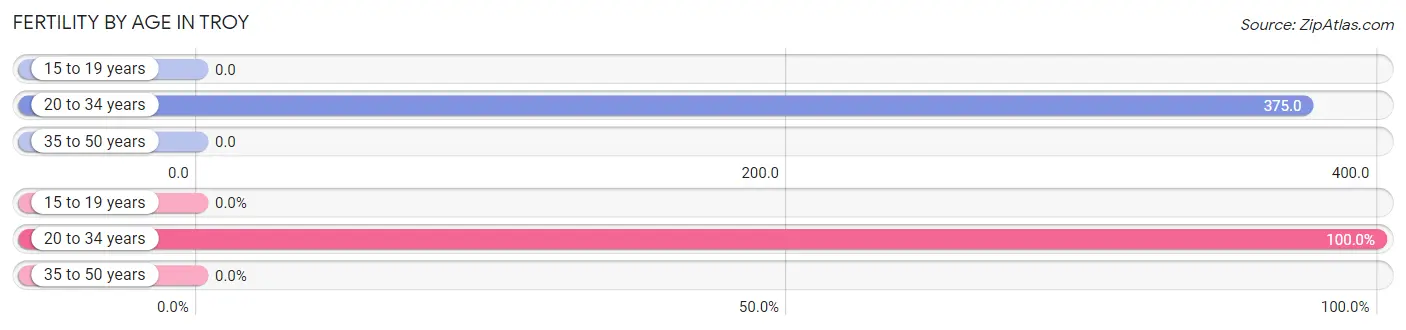
| Age Bracket | Women with Births | Births / 1,000 Women |
| 15 to 19 years | 0 (0.0%) | 0.0 |
| 20 to 34 years | 3 (100.0%) | 375.0 |
| 35 to 50 years | 0 (0.0%) | 0.0 |
| Total | 3 (100.0%) | 250.0 |
Fertility by Age by Marriage Status in Troy
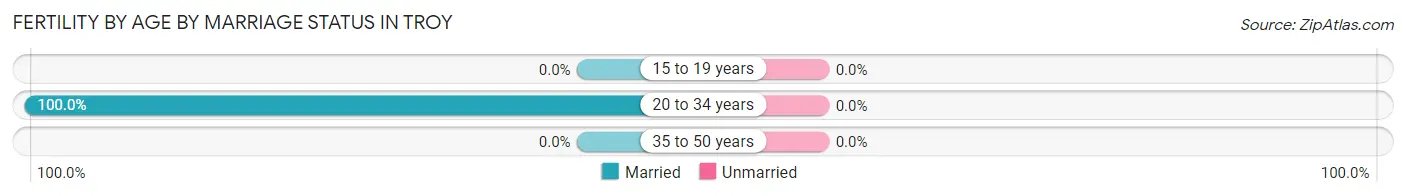
| Age Bracket | Married | Unmarried |
| 15 to 19 years | 0 (0.0%) | 0 (0.0%) |
| 20 to 34 years | 3 (100.0%) | 0 (0.0%) |
| 35 to 50 years | 0 (0.0%) | 0 (0.0%) |
| Total | 3 (100.0%) | 0 (0.0%) |
Fertility by Education in Troy
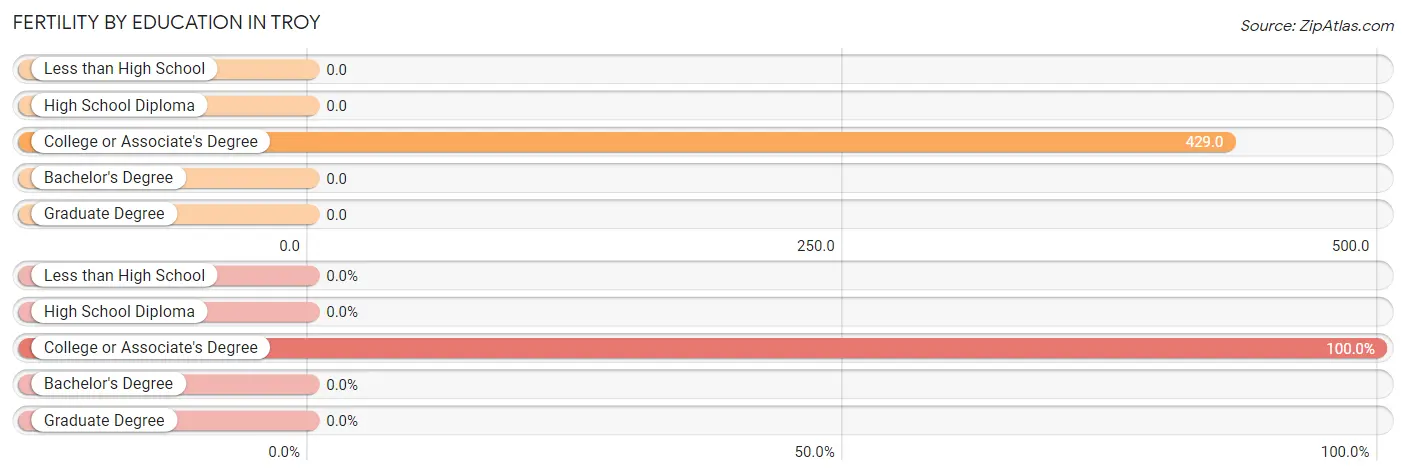
| Educational Attainment | Women with Births | Births / 1,000 Women |
| Less than High School | 0 (0.0%) | 0.0 |
| High School Diploma | 0 (0.0%) | 0.0 |
| College or Associate's Degree | 3 (100.0%) | 429.0 |
| Bachelor's Degree | 0 (0.0%) | 0.0 |
| Graduate Degree | 0 (0.0%) | 0.0 |
| Total | 3 (100.0%) | 250.0 |
Fertility by Education by Marriage Status in Troy
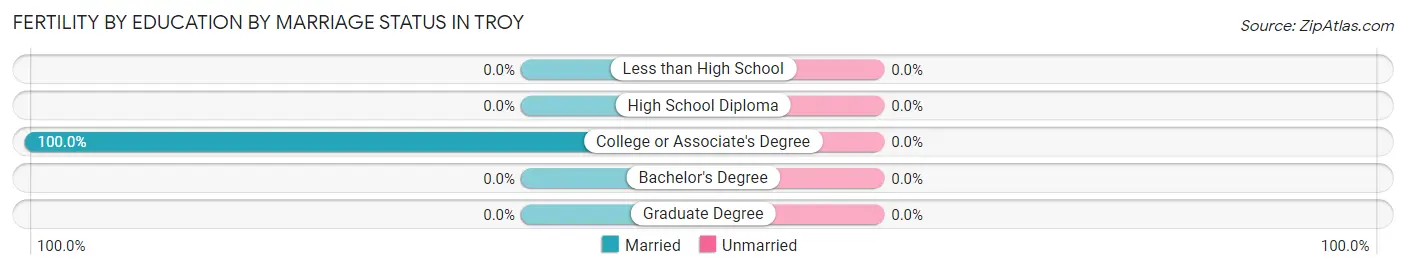
| Educational Attainment | Married | Unmarried |
| Less than High School | 0 (0.0%) | 0 (0.0%) |
| High School Diploma | 0 (0.0%) | 0 (0.0%) |
| College or Associate's Degree | 3 (100.0%) | 0 (0.0%) |
| Bachelor's Degree | 0 (0.0%) | 0 (0.0%) |
| Graduate Degree | 0 (0.0%) | 0 (0.0%) |
| Total | 3 (100.0%) | 0 (0.0%) |
Employment Characteristics in Troy
Employment by Class of Employer in Troy
Among the 82 employed individuals in Troy, private company employees (43 | 52.4%), self-employed (not incorporated) (25 | 30.5%), and not-for-profit organizations (14 | 17.1%) make up the most common classes of employment.
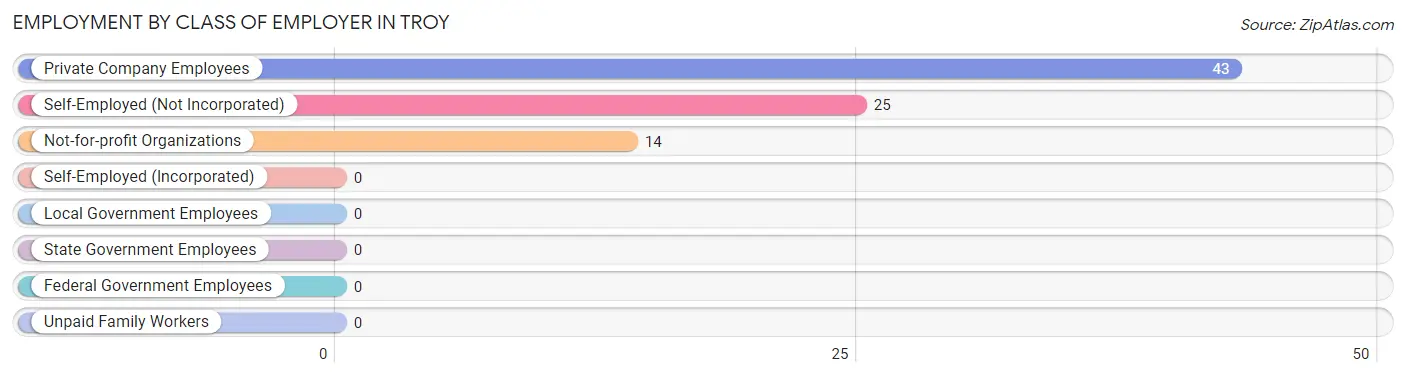
| Employer Class | # Employees | % Employees |
| Private Company Employees | 43 | 52.4% |
| Self-Employed (Incorporated) | 0 | 0.0% |
| Self-Employed (Not Incorporated) | 25 | 30.5% |
| Not-for-profit Organizations | 14 | 17.1% |
| Local Government Employees | 0 | 0.0% |
| State Government Employees | 0 | 0.0% |
| Federal Government Employees | 0 | 0.0% |
| Unpaid Family Workers | 0 | 0.0% |
| Total | 82 | 100.0% |
Employment Status by Age in Troy
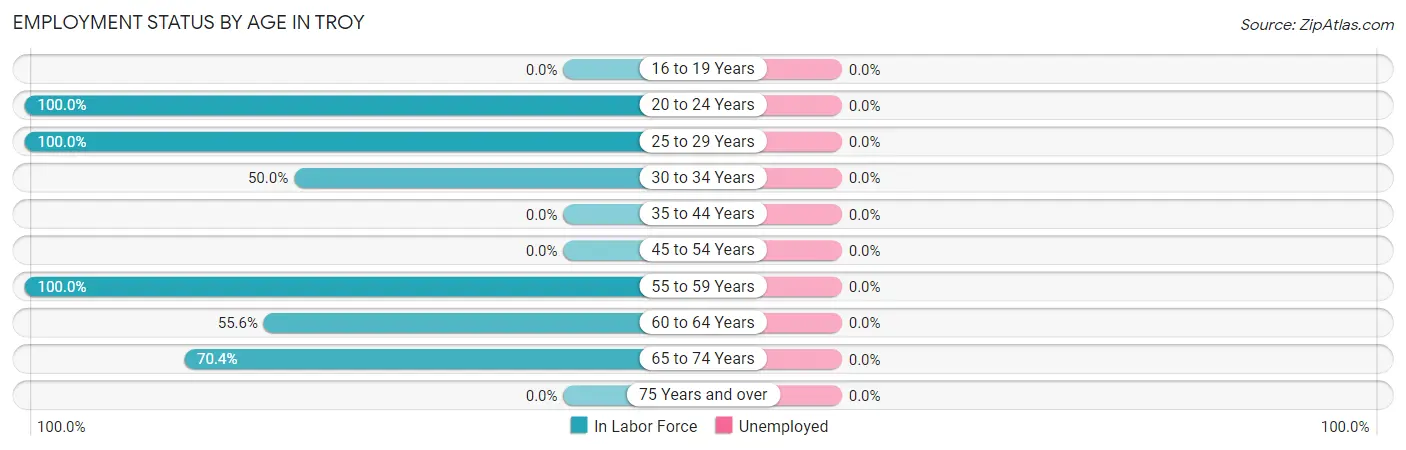
| Age Bracket | In Labor Force | Unemployed |
| 16 to 19 Years | 0 (0.0%) | 0 (0.0%) |
| 20 to 24 Years | 10 (100.0%) | 0 (0.0%) |
| 25 to 29 Years | 5 (100.0%) | 0 (0.0%) |
| 30 to 34 Years | 3 (50.0%) | 0 (0.0%) |
| 35 to 44 Years | 0 (0.0%) | 0 (0.0%) |
| 45 to 54 Years | 0 (0.0%) | 0 (0.0%) |
| 55 to 59 Years | 9 (100.0%) | 0 (0.0%) |
| 60 to 64 Years | 5 (55.6%) | 0 (0.0%) |
| 65 to 74 Years | 50 (70.4%) | 0 (0.0%) |
| 75 Years and over | 0 (0.0%) | 0 (0.0%) |
| Total | 82 (63.1%) | 0 (0.0%) |
Employment Status by Educational Attainment in Troy
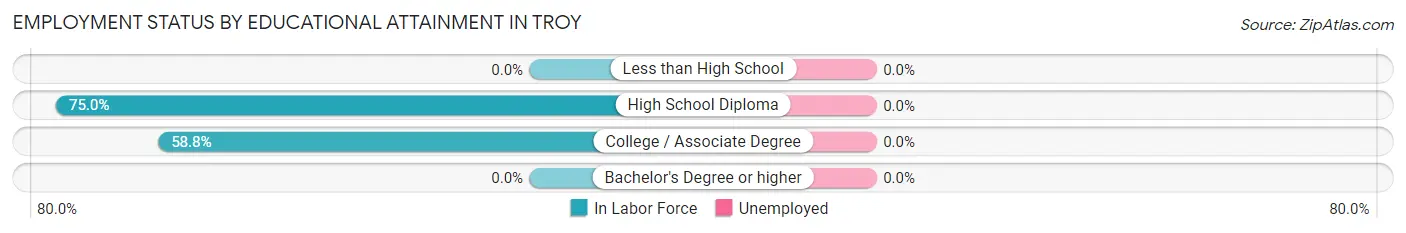
| Educational Attainment | In Labor Force | Unemployed |
| Less than High School | 0 (0.0%) | 0 (0.0%) |
| High School Diploma | 12 (75.0%) | 0 (0.0%) |
| College / Associate Degree | 10 (58.8%) | 0 (0.0%) |
| Bachelor's Degree or higher | 0 (0.0%) | 0 (0.0%) |
| Total | 22 (66.7%) | 0 (0.0%) |
Employment Occupations by Sex in Troy
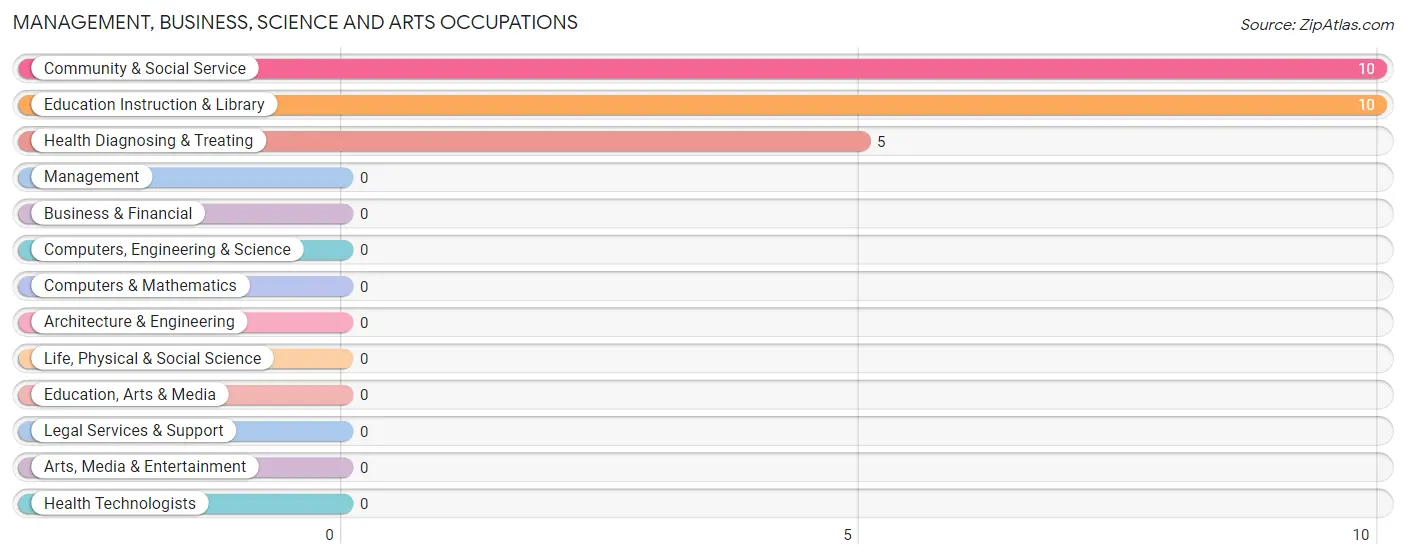
Management, Business, Science and Arts Occupations
The most common Management, Business, Science and Arts occupations in Troy are Community & Social Service (10 | 12.2%), Education Instruction & Library (10 | 12.2%), and Health Diagnosing & Treating (5 | 6.1%).
Management, Business, Science and Arts Occupations by Sex
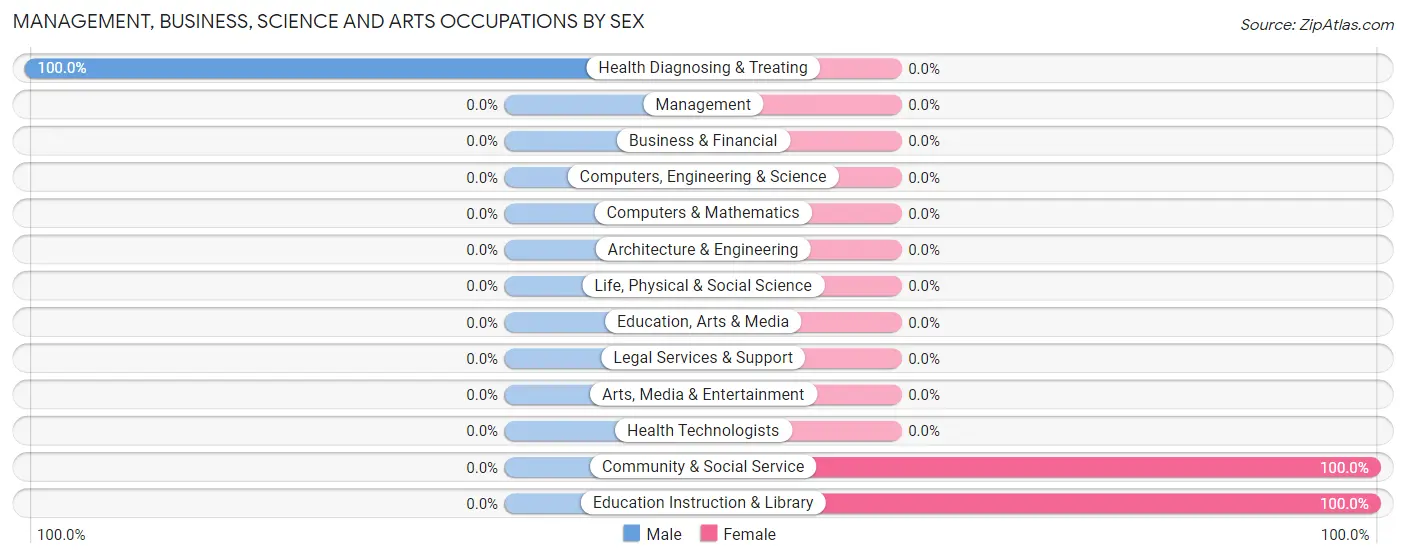
| Occupation | Male | Female |
| Management | 0 (0.0%) | 0 (0.0%) |
| Business & Financial | 0 (0.0%) | 0 (0.0%) |
| Computers, Engineering & Science | 0 (0.0%) | 0 (0.0%) |
| Computers & Mathematics | 0 (0.0%) | 0 (0.0%) |
| Architecture & Engineering | 0 (0.0%) | 0 (0.0%) |
| Life, Physical & Social Science | 0 (0.0%) | 0 (0.0%) |
| Community & Social Service | 0 (0.0%) | 10 (100.0%) |
| Education, Arts & Media | 0 (0.0%) | 0 (0.0%) |
| Legal Services & Support | 0 (0.0%) | 0 (0.0%) |
| Education Instruction & Library | 0 (0.0%) | 10 (100.0%) |
| Arts, Media & Entertainment | 0 (0.0%) | 0 (0.0%) |
| Health Diagnosing & Treating | 5 (100.0%) | 0 (0.0%) |
| Health Technologists | 0 (0.0%) | 0 (0.0%) |
| Total (Category) | 5 (33.3%) | 10 (66.7%) |
| Total (Overall) | 48 (58.5%) | 34 (41.5%) |
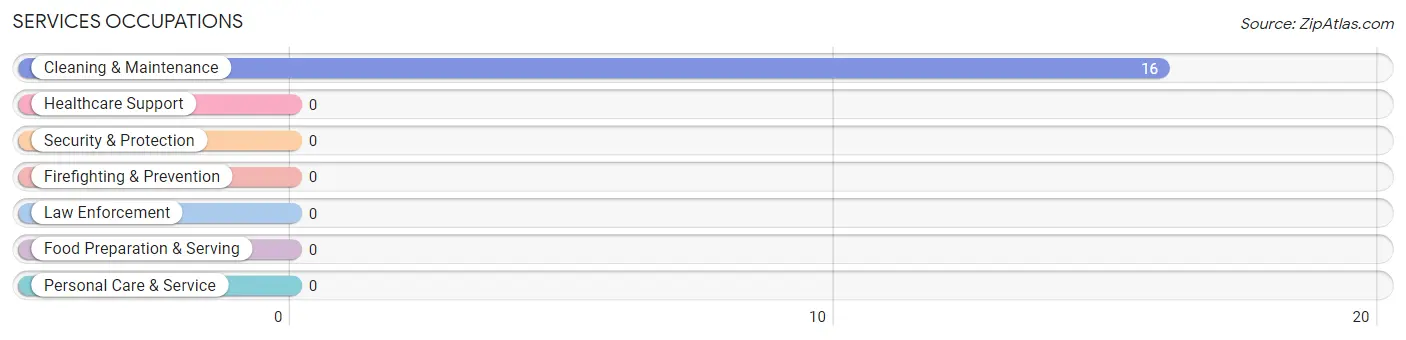
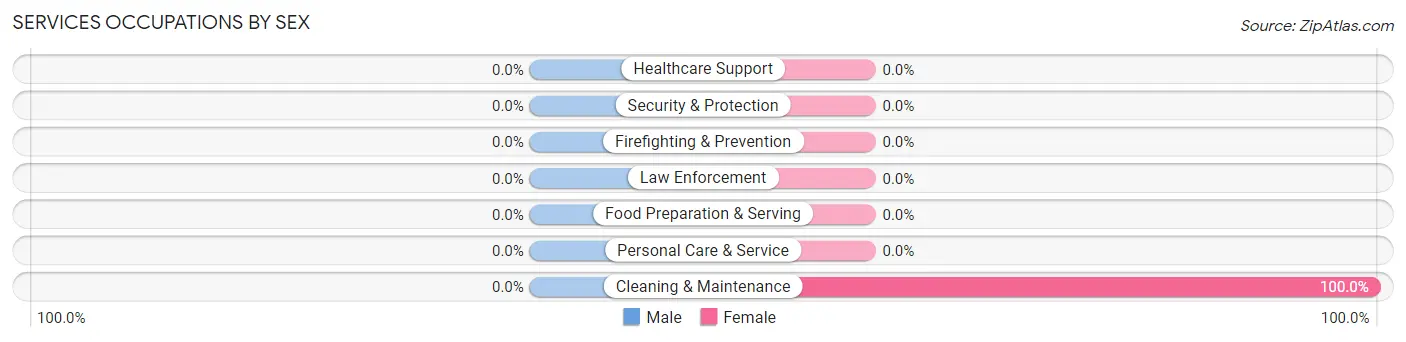
Services Occupations
The most common Services occupations in Troy are , and Cleaning & Maintenance (16 | 19.5%).
Services Occupations by Sex
| Occupation | Male | Female |
| Healthcare Support | 0 (0.0%) | 0 (0.0%) |
| Security & Protection | 0 (0.0%) | 0 (0.0%) |
| Firefighting & Prevention | 0 (0.0%) | 0 (0.0%) |
| Law Enforcement | 0 (0.0%) | 0 (0.0%) |
| Food Preparation & Serving | 0 (0.0%) | 0 (0.0%) |
| Cleaning & Maintenance | 0 (0.0%) | 16 (100.0%) |
| Personal Care & Service | 0 (0.0%) | 0 (0.0%) |
| Total (Category) | 0 (0.0%) | 16 (100.0%) |
| Total (Overall) | 48 (58.5%) | 34 (41.5%) |
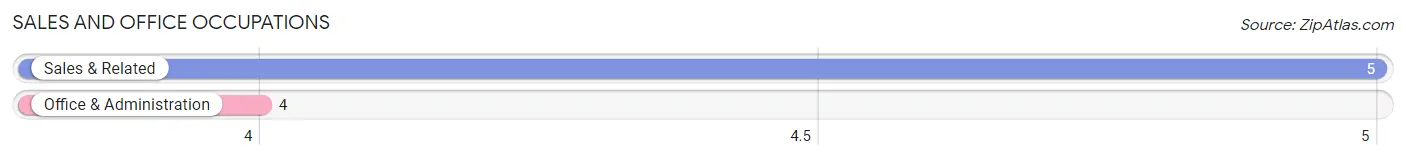
Sales and Office Occupations
The most common Sales and Office occupations in Troy are Sales & Related (5 | 6.1%), and Office & Administration (4 | 4.9%).
Sales and Office Occupations by Sex

| Occupation | Male | Female |
| Sales & Related | 5 (100.0%) | 0 (0.0%) |
| Office & Administration | 0 (0.0%) | 4 (100.0%) |
| Total (Category) | 5 (55.6%) | 4 (44.4%) |
| Total (Overall) | 48 (58.5%) | 34 (41.5%) |
Natural Resources, Construction and Maintenance Occupations

Natural Resources, Construction and Maintenance Occupations by Sex
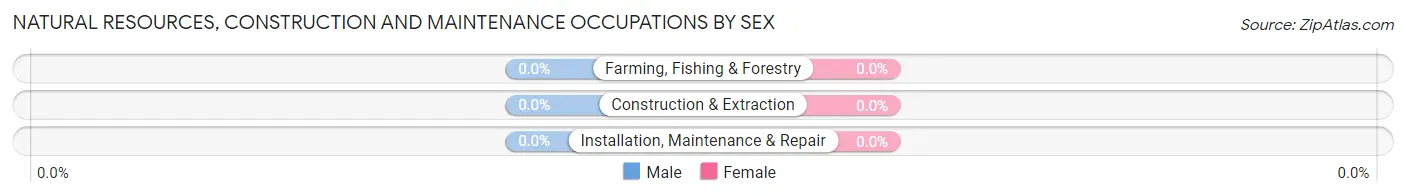
| Occupation | Male | Female |
| Farming, Fishing & Forestry | 0 (0.0%) | 0 (0.0%) |
| Construction & Extraction | 0 (0.0%) | 0 (0.0%) |
| Installation, Maintenance & Repair | 0 (0.0%) | 0 (0.0%) |
| Total (Category) | 0 (0.0%) | 0 (0.0%) |
| Total (Overall) | 48 (58.5%) | 34 (41.5%) |
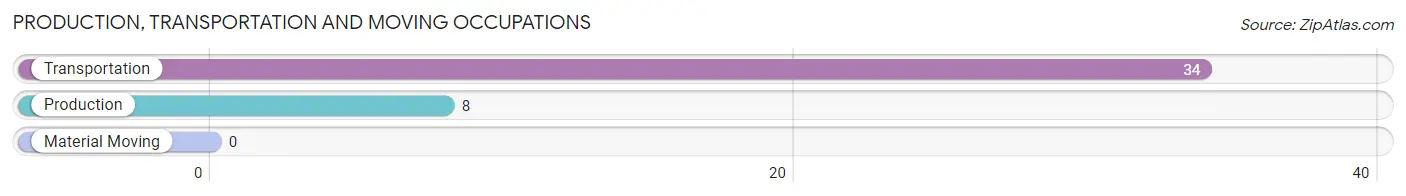
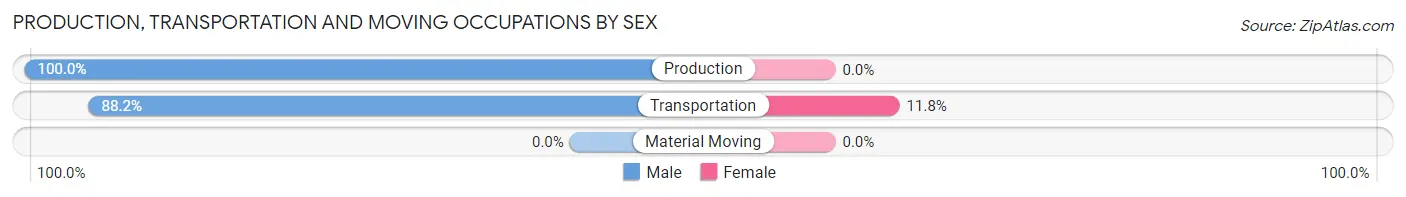
Production, Transportation and Moving Occupations
The most common Production, Transportation and Moving occupations in Troy are Transportation (34 | 41.5%), and Production (8 | 9.8%).
Production, Transportation and Moving Occupations by Sex
| Occupation | Male | Female |
| Production | 8 (100.0%) | 0 (0.0%) |
| Transportation | 30 (88.2%) | 4 (11.8%) |
| Material Moving | 0 (0.0%) | 0 (0.0%) |
| Total (Category) | 38 (90.5%) | 4 (9.5%) |
| Total (Overall) | 48 (58.5%) | 34 (41.5%) |
Employment Industries by Sex in Troy
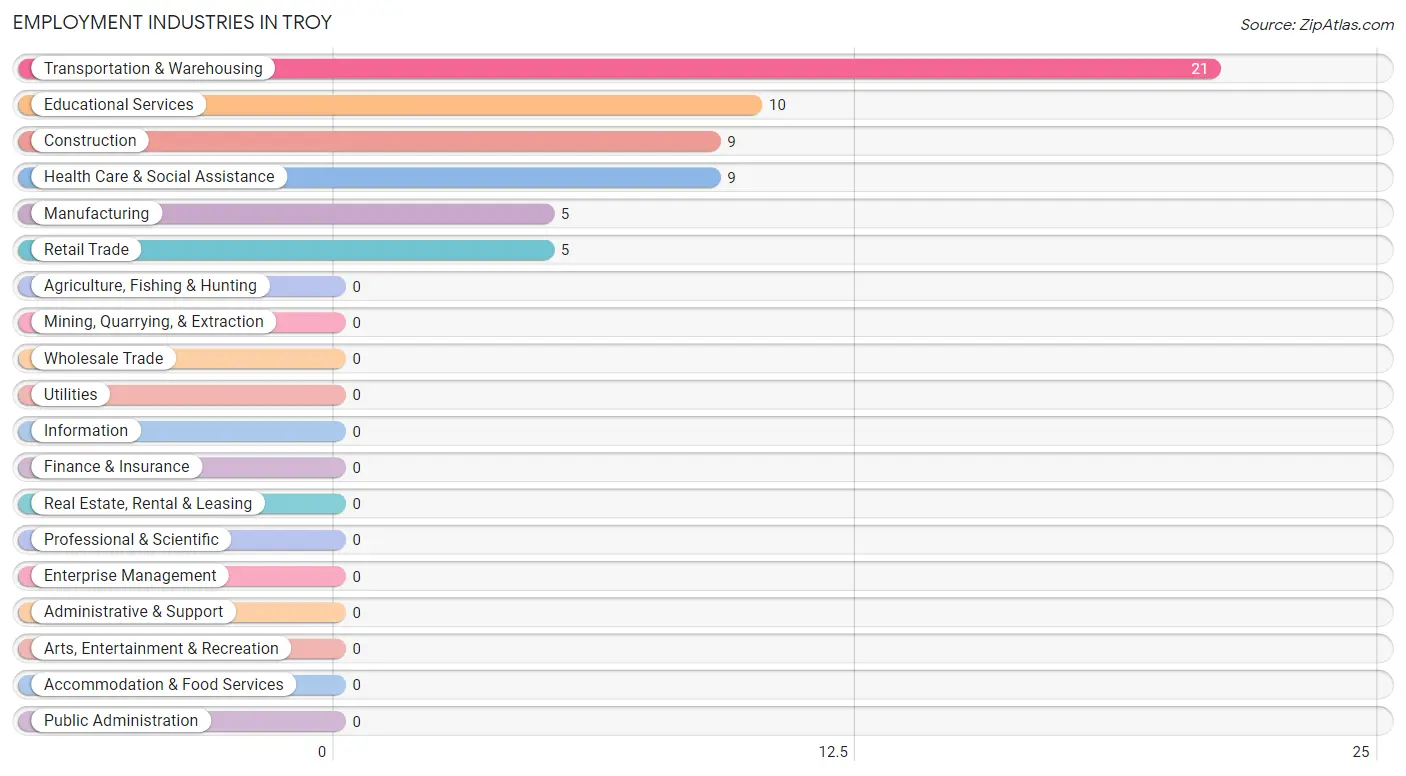
Employment Industries in Troy
The major employment industries in Troy include Transportation & Warehousing (21 | 25.6%), Educational Services (10 | 12.2%), Construction (9 | 11.0%), Health Care & Social Assistance (9 | 11.0%), and Manufacturing (5 | 6.1%).
Employment Industries by Sex in Troy
The Troy industries that see more men than women are Construction (100.0%), Manufacturing (100.0%), and Retail Trade (100.0%), whereas the industries that tend to have a higher number of women are Educational Services (100.0%), and Health Care & Social Assistance (44.4%).
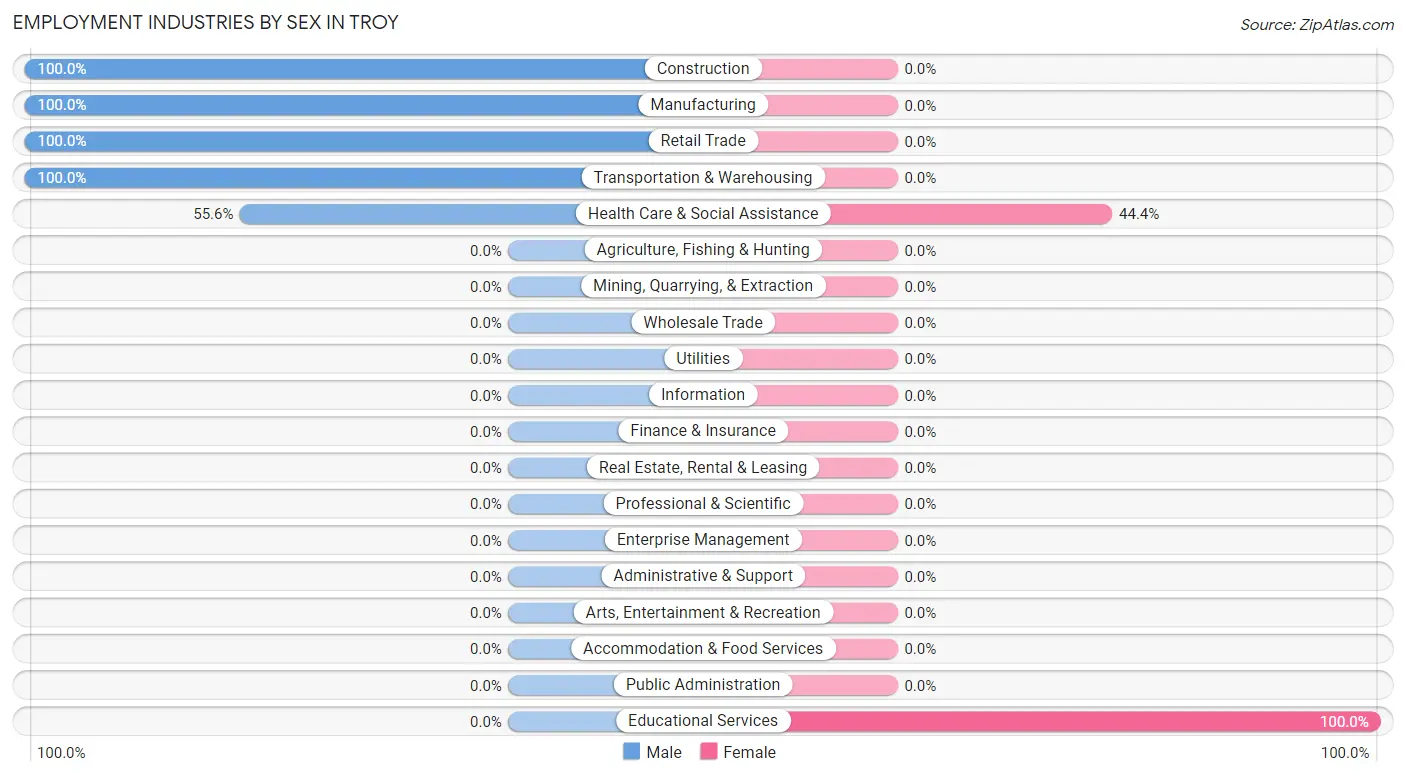
| Industry | Male | Female |
| Agriculture, Fishing & Hunting | 0 (0.0%) | 0 (0.0%) |
| Mining, Quarrying, & Extraction | 0 (0.0%) | 0 (0.0%) |
| Construction | 9 (100.0%) | 0 (0.0%) |
| Manufacturing | 5 (100.0%) | 0 (0.0%) |
| Wholesale Trade | 0 (0.0%) | 0 (0.0%) |
| Retail Trade | 5 (100.0%) | 0 (0.0%) |
| Transportation & Warehousing | 21 (100.0%) | 0 (0.0%) |
| Utilities | 0 (0.0%) | 0 (0.0%) |
| Information | 0 (0.0%) | 0 (0.0%) |
| Finance & Insurance | 0 (0.0%) | 0 (0.0%) |
| Real Estate, Rental & Leasing | 0 (0.0%) | 0 (0.0%) |
| Professional & Scientific | 0 (0.0%) | 0 (0.0%) |
| Enterprise Management | 0 (0.0%) | 0 (0.0%) |
| Administrative & Support | 0 (0.0%) | 0 (0.0%) |
| Educational Services | 0 (0.0%) | 10 (100.0%) |
| Health Care & Social Assistance | 5 (55.6%) | 4 (44.4%) |
| Arts, Entertainment & Recreation | 0 (0.0%) | 0 (0.0%) |
| Accommodation & Food Services | 0 (0.0%) | 0 (0.0%) |
| Public Administration | 0 (0.0%) | 0 (0.0%) |
| Total | 48 (58.5%) | 34 (41.5%) |
Education in Troy
School Enrollment in Troy
| School Level | # Students | % Students |
| Nursery / Preschool | 0 | 0.0% |
| Kindergarten | 0 | 0.0% |
| Elementary School | 0 | 0.0% |
| Middle School | 0 | 0.0% |
| High School | 0 | 0.0% |
| College / Undergraduate | 0 | 0.0% |
| Graduate / Professional | 0 | 0.0% |
| Total | 0 | 0.0% |
School Enrollment by Age by Funding Source in Troy
| Age Bracket | Public School | Private School |
| 3 to 4 Year Olds | 0 (0.0%) | 0 (0.0%) |
| 5 to 9 Year Old | 0 (0.0%) | 0 (0.0%) |
| 10 to 14 Year Olds | 0 (0.0%) | 0 (0.0%) |
| 15 to 17 Year Olds | 0 (0.0%) | 0 (0.0%) |
| 18 to 19 Year Olds | 0 (0.0%) | 0 (0.0%) |
| 20 to 24 Year Olds | 0 (0.0%) | 0 (0.0%) |
| 25 to 34 Year Olds | 0 (0.0%) | 0 (0.0%) |
| 35 Years and over | 0 (0.0%) | 0 (0.0%) |
| Total | 0 (0.0%) | 0 (0.0%) |
Educational Attainment by Field of Study in Troy
| Field of Study | # Graduates | % Graduates |
| Computers & Mathematics | 0 | 0.0% |
| Bio, Nature & Agricultural | 0 | 0.0% |
| Physical & Health Sciences | 0 | 0.0% |
| Psychology | 0 | 0.0% |
| Social Sciences | 0 | 0.0% |
| Engineering | 0 | 0.0% |
| Multidisciplinary Studies | 0 | 0.0% |
| Science & Technology | 0 | 0.0% |
| Business | 0 | 0.0% |
| Education | 0 | 0.0% |
| Literature & Languages | 0 | 0.0% |
| Liberal Arts & History | 0 | 0.0% |
| Visual & Performing Arts | 0 | 0.0% |
| Communications | 0 | 0.0% |
| Arts & Humanities | 0 | 0.0% |
| Total | 0 | 0.0% |
Transportation & Commute in Troy
Vehicle Availability by Sex in Troy
The most prevalent vehicle ownership categories in Troy are males with 2 vehicles (35, accounting for 72.9%) and females with 2 vehicles (20, making up 102.9%).
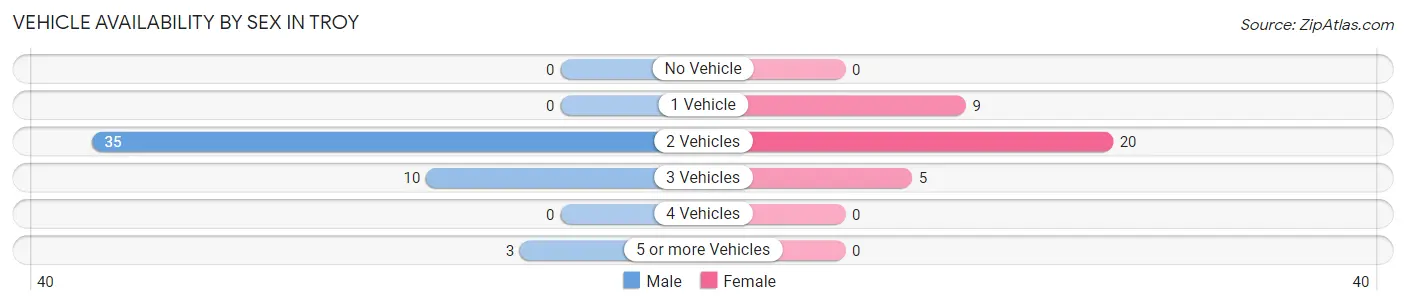
| Vehicles Available | Male | Female |
| No Vehicle | 0 (0.0%) | 0 (0.0%) |
| 1 Vehicle | 0 (0.0%) | 9 (26.5%) |
| 2 Vehicles | 35 (72.9%) | 20 (58.8%) |
| 3 Vehicles | 10 (20.8%) | 5 (14.7%) |
| 4 Vehicles | 0 (0.0%) | 0 (0.0%) |
| 5 or more Vehicles | 3 (6.2%) | 0 (0.0%) |
| Total | 48 (100.0%) | 34 (100.0%) |
Commute Time in Troy
The most frequently occuring commute durations in Troy are 10 to 14 minutes (39 commuters, 47.6%), 15 to 19 minutes (16 commuters, 19.5%), and 30 to 34 minutes (14 commuters, 17.1%).
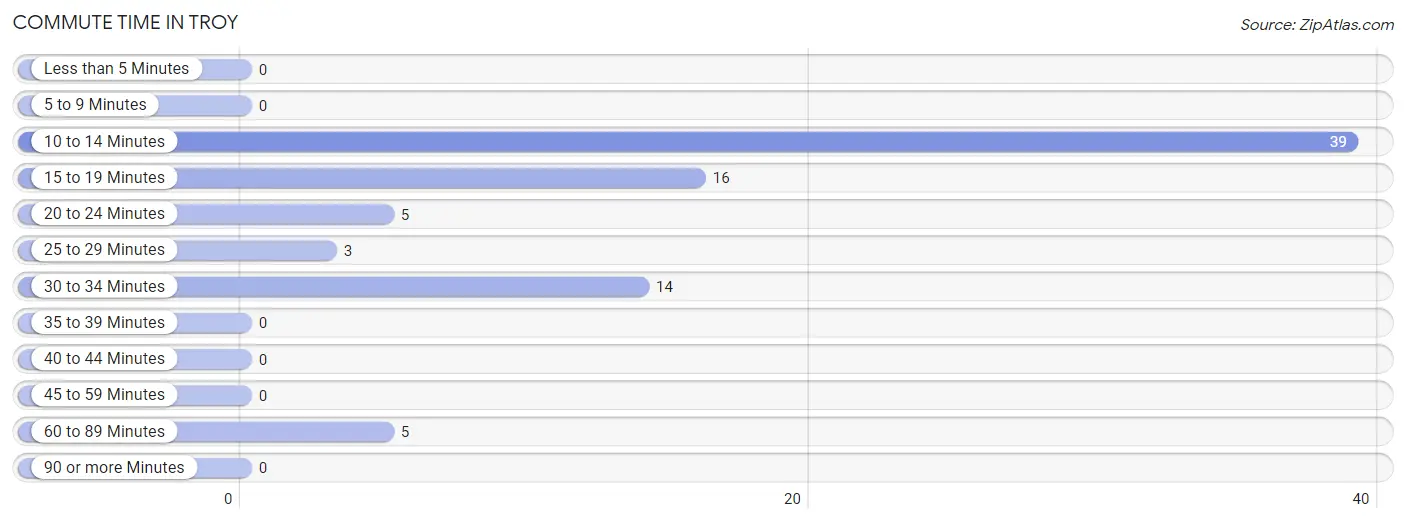
| Commute Time | # Commuters | % Commuters |
| Less than 5 Minutes | 0 | 0.0% |
| 5 to 9 Minutes | 0 | 0.0% |
| 10 to 14 Minutes | 39 | 47.6% |
| 15 to 19 Minutes | 16 | 19.5% |
| 20 to 24 Minutes | 5 | 6.1% |
| 25 to 29 Minutes | 3 | 3.7% |
| 30 to 34 Minutes | 14 | 17.1% |
| 35 to 39 Minutes | 0 | 0.0% |
| 40 to 44 Minutes | 0 | 0.0% |
| 45 to 59 Minutes | 0 | 0.0% |
| 60 to 89 Minutes | 5 | 6.1% |
| 90 or more Minutes | 0 | 0.0% |
Commute Time by Sex in Troy
The most common commute times in Troy are 10 to 14 minutes (35 commuters, 72.9%) for males and 15 to 19 minutes (16 commuters, 47.1%) for females.
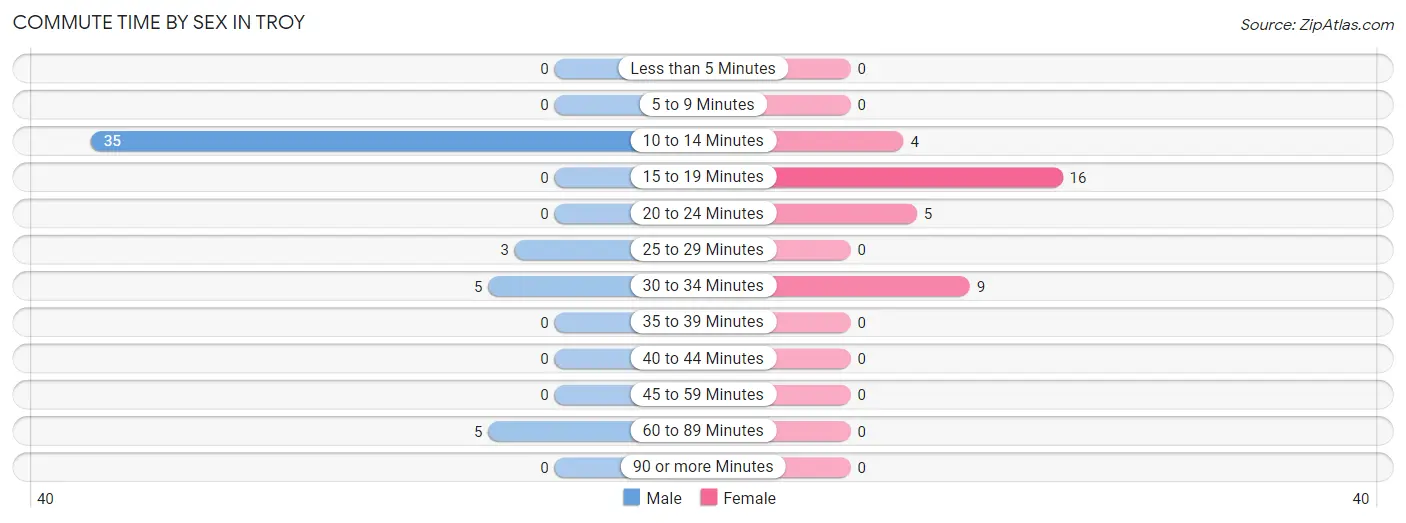
| Commute Time | Male | Female |
| Less than 5 Minutes | 0 (0.0%) | 0 (0.0%) |
| 5 to 9 Minutes | 0 (0.0%) | 0 (0.0%) |
| 10 to 14 Minutes | 35 (72.9%) | 4 (11.8%) |
| 15 to 19 Minutes | 0 (0.0%) | 16 (47.1%) |
| 20 to 24 Minutes | 0 (0.0%) | 5 (14.7%) |
| 25 to 29 Minutes | 3 (6.2%) | 0 (0.0%) |
| 30 to 34 Minutes | 5 (10.4%) | 9 (26.5%) |
| 35 to 39 Minutes | 0 (0.0%) | 0 (0.0%) |
| 40 to 44 Minutes | 0 (0.0%) | 0 (0.0%) |
| 45 to 59 Minutes | 0 (0.0%) | 0 (0.0%) |
| 60 to 89 Minutes | 5 (10.4%) | 0 (0.0%) |
| 90 or more Minutes | 0 (0.0%) | 0 (0.0%) |
Time of Departure to Work by Sex in Troy
The most frequent times of departure to work in Troy are 12:00 PM to 3:59 PM (21, 43.8%) for males and 7:00 AM to 7:29 AM (18, 52.9%) for females.
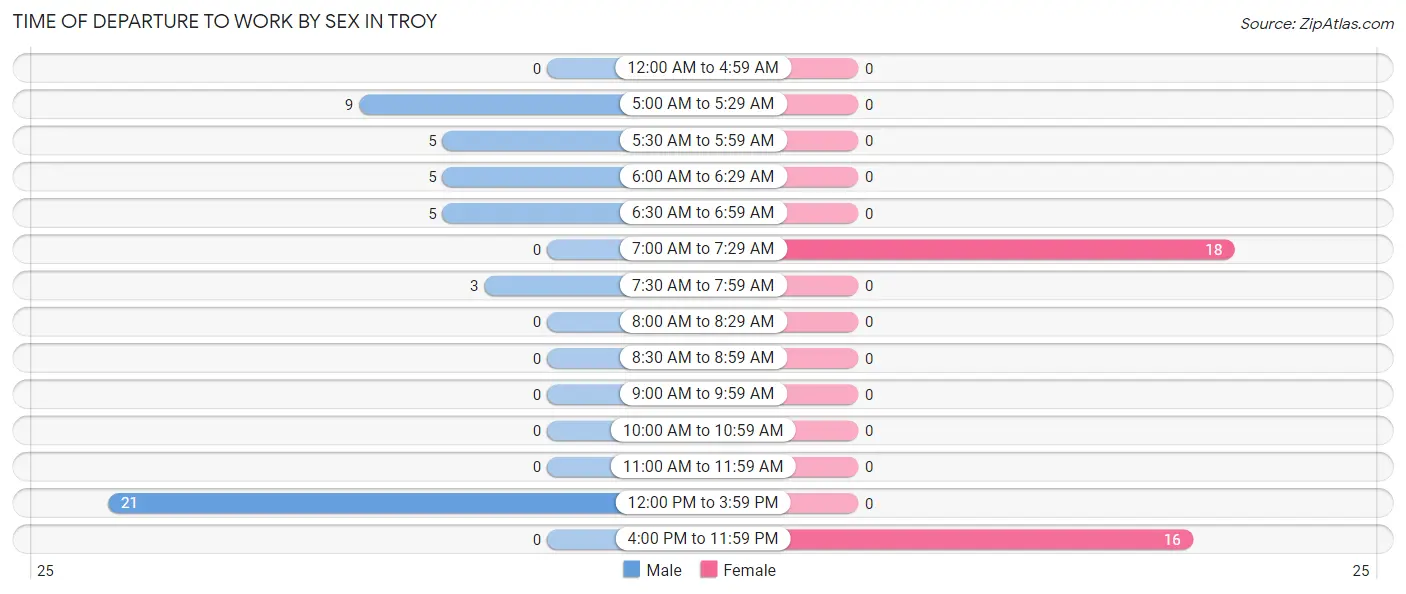
| Time of Departure | Male | Female |
| 12:00 AM to 4:59 AM | 0 (0.0%) | 0 (0.0%) |
| 5:00 AM to 5:29 AM | 9 (18.8%) | 0 (0.0%) |
| 5:30 AM to 5:59 AM | 5 (10.4%) | 0 (0.0%) |
| 6:00 AM to 6:29 AM | 5 (10.4%) | 0 (0.0%) |
| 6:30 AM to 6:59 AM | 5 (10.4%) | 0 (0.0%) |
| 7:00 AM to 7:29 AM | 0 (0.0%) | 18 (52.9%) |
| 7:30 AM to 7:59 AM | 3 (6.2%) | 0 (0.0%) |
| 8:00 AM to 8:29 AM | 0 (0.0%) | 0 (0.0%) |
| 8:30 AM to 8:59 AM | 0 (0.0%) | 0 (0.0%) |
| 9:00 AM to 9:59 AM | 0 (0.0%) | 0 (0.0%) |
| 10:00 AM to 10:59 AM | 0 (0.0%) | 0 (0.0%) |
| 11:00 AM to 11:59 AM | 0 (0.0%) | 0 (0.0%) |
| 12:00 PM to 3:59 PM | 21 (43.8%) | 0 (0.0%) |
| 4:00 PM to 11:59 PM | 0 (0.0%) | 16 (47.1%) |
| Total | 48 (100.0%) | 34 (100.0%) |
Housing Occupancy in Troy
Occupancy by Ownership in Troy
Of the total 68 dwellings in Troy, owner-occupied units account for 68 (100.0%), while renter-occupied units make up 0 (0.0%).
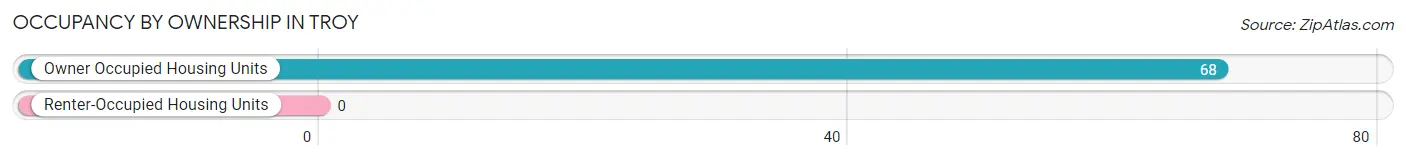
| Occupancy | # Housing Units | % Housing Units |
| Owner Occupied Housing Units | 68 | 100.0% |
| Renter-Occupied Housing Units | 0 | 0.0% |
| Total Occupied Housing Units | 68 | 100.0% |
Occupancy by Household Size in Troy
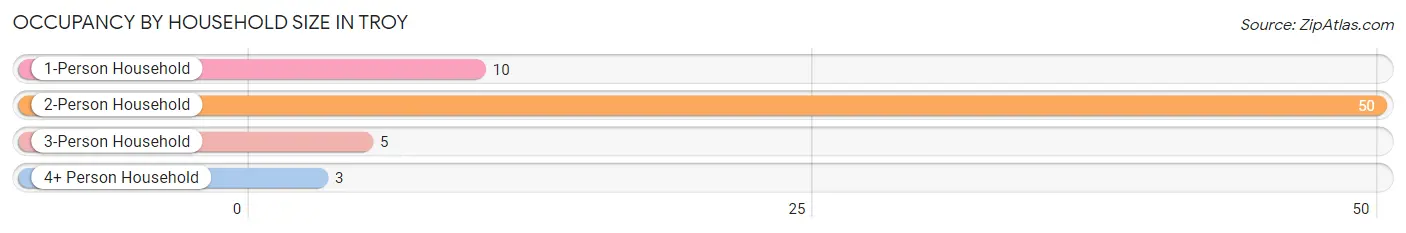
| Household Size | # Housing Units | % Housing Units |
| 1-Person Household | 10 | 14.7% |
| 2-Person Household | 50 | 73.5% |
| 3-Person Household | 5 | 7.3% |
| 4+ Person Household | 3 | 4.4% |
| Total Housing Units | 68 | 100.0% |
Occupancy by Ownership by Household Size in Troy
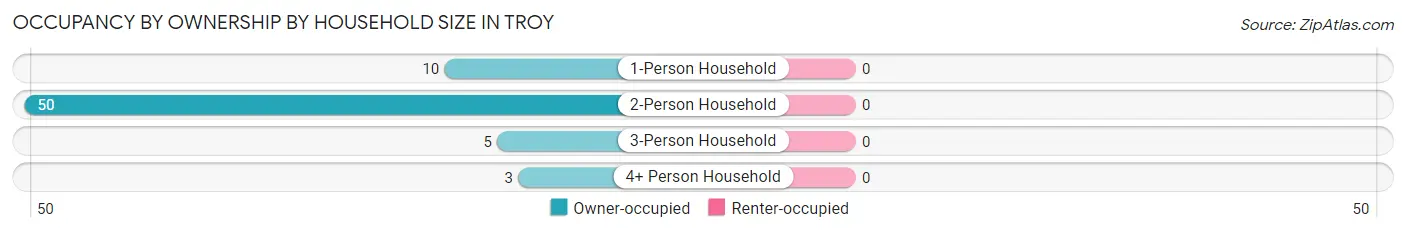
| Household Size | Owner-occupied | Renter-occupied |
| 1-Person Household | 10 (100.0%) | 0 (0.0%) |
| 2-Person Household | 50 (100.0%) | 0 (0.0%) |
| 3-Person Household | 5 (100.0%) | 0 (0.0%) |
| 4+ Person Household | 3 (100.0%) | 0 (0.0%) |
| Total Housing Units | 68 (100.0%) | 0 (0.0%) |
Occupancy by Educational Attainment in Troy
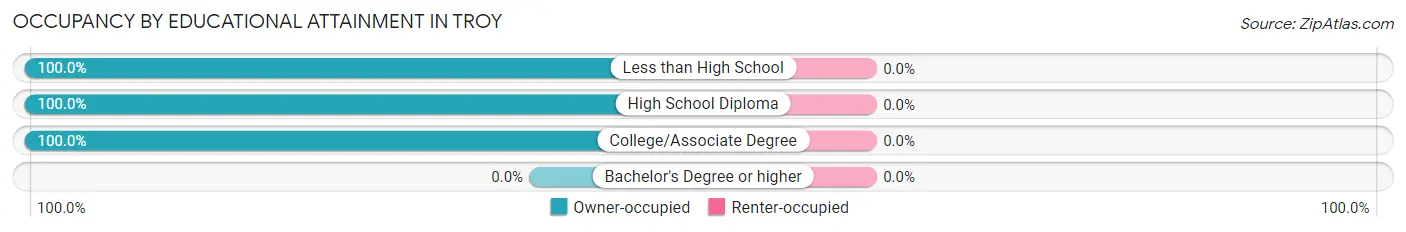
| Household Size | Owner-occupied | Renter-occupied |
| Less than High School | 1 (100.0%) | 0 (0.0%) |
| High School Diploma | 46 (100.0%) | 0 (0.0%) |
| College/Associate Degree | 21 (100.0%) | 0 (0.0%) |
| Bachelor's Degree or higher | 0 (0.0%) | 0 (0.0%) |
Occupancy by Age of Householder in Troy
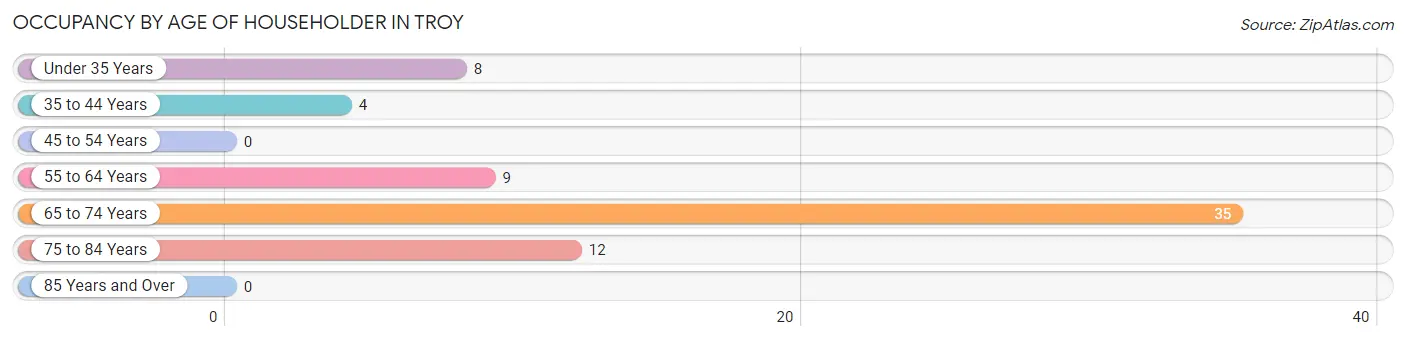
| Age Bracket | # Households | % Households |
| Under 35 Years | 8 | 11.8% |
| 35 to 44 Years | 4 | 5.9% |
| 45 to 54 Years | 0 | 0.0% |
| 55 to 64 Years | 9 | 13.2% |
| 65 to 74 Years | 35 | 51.5% |
| 75 to 84 Years | 12 | 17.6% |
| 85 Years and Over | 0 | 0.0% |
| Total | 68 | 100.0% |
Housing Finances in Troy
Median Income by Occupancy in Troy
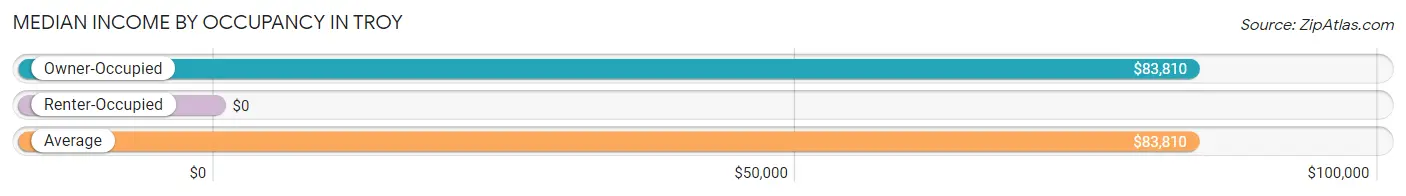
| Occupancy Type | # Households | Median Income |
| Owner-Occupied | 68 (100.0%) | $83,810 |
| Renter-Occupied | 0 (0.0%) | $0 |
| Average | 68 (100.0%) | $83,810 |
Occupancy by Householder Income Bracket in Troy
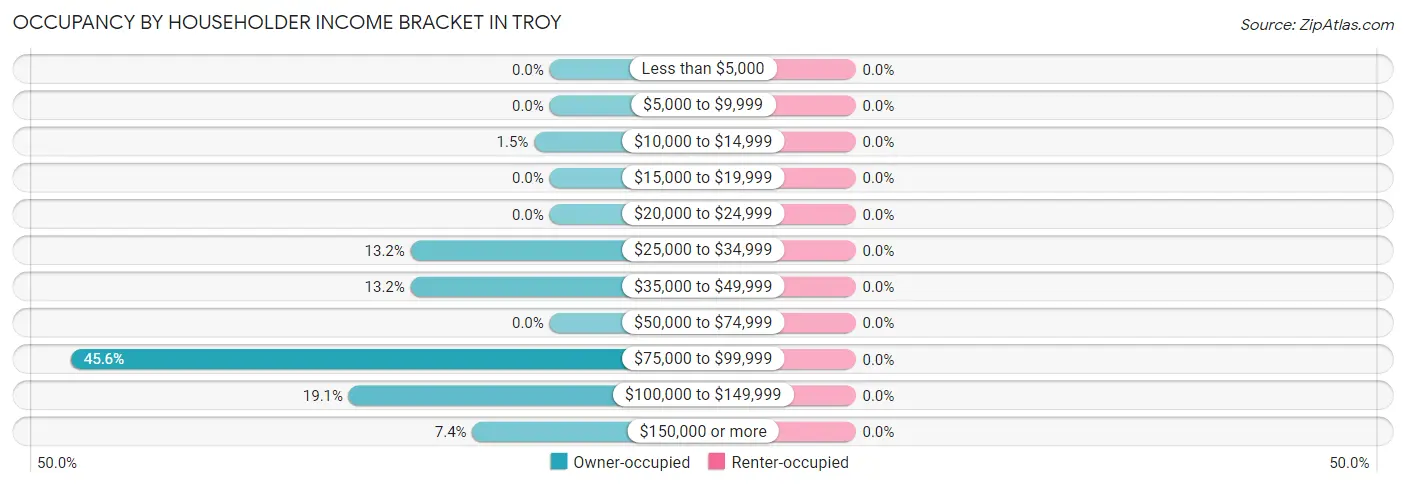
| Income Bracket | Owner-occupied | Renter-occupied |
| Less than $5,000 | 0 (0.0%) | 0 (0.0%) |
| $5,000 to $9,999 | 0 (0.0%) | 0 (0.0%) |
| $10,000 to $14,999 | 1 (1.5%) | 0 (0.0%) |
| $15,000 to $19,999 | 0 (0.0%) | 0 (0.0%) |
| $20,000 to $24,999 | 0 (0.0%) | 0 (0.0%) |
| $25,000 to $34,999 | 9 (13.2%) | 0 (0.0%) |
| $35,000 to $49,999 | 9 (13.2%) | 0 (0.0%) |
| $50,000 to $74,999 | 0 (0.0%) | 0 (0.0%) |
| $75,000 to $99,999 | 31 (45.6%) | 0 (0.0%) |
| $100,000 to $149,999 | 13 (19.1%) | 0 (0.0%) |
| $150,000 or more | 5 (7.3%) | 0 (0.0%) |
| Total | 68 (100.0%) | 0 (0.0%) |
Monthly Housing Cost Tiers in Troy
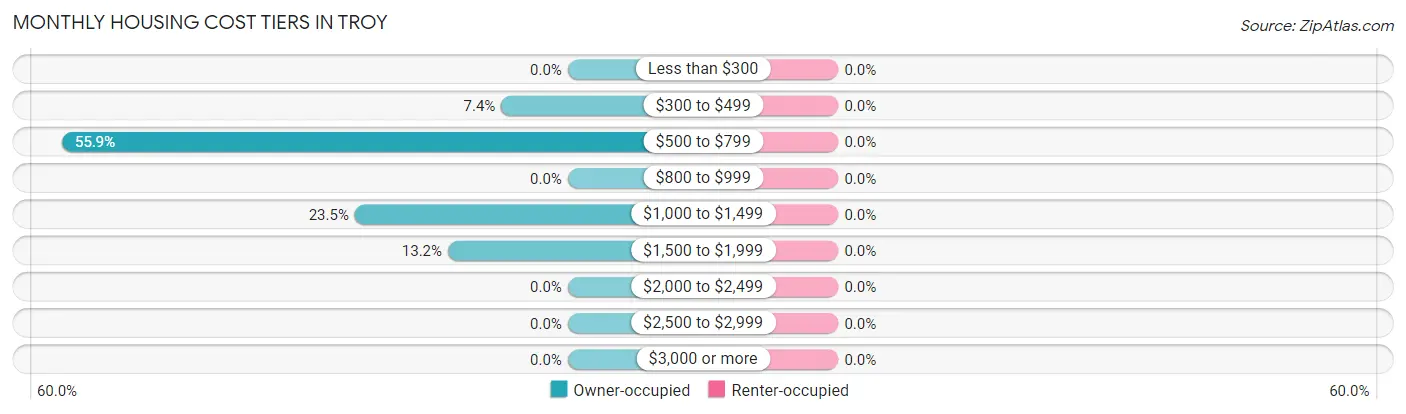
| Monthly Cost | Owner-occupied | Renter-occupied |
| Less than $300 | 0 (0.0%) | 0 (0.0%) |
| $300 to $499 | 5 (7.3%) | 0 (0.0%) |
| $500 to $799 | 38 (55.9%) | 0 (0.0%) |
| $800 to $999 | 0 (0.0%) | 0 (0.0%) |
| $1,000 to $1,499 | 16 (23.5%) | 0 (0.0%) |
| $1,500 to $1,999 | 9 (13.2%) | 0 (0.0%) |
| $2,000 to $2,499 | 0 (0.0%) | 0 (0.0%) |
| $2,500 to $2,999 | 0 (0.0%) | 0 (0.0%) |
| $3,000 or more | 0 (0.0%) | 0 (0.0%) |
| Total | 68 (100.0%) | 0 (0.0%) |
Physical Housing Characteristics in Troy
Housing Structures in Troy
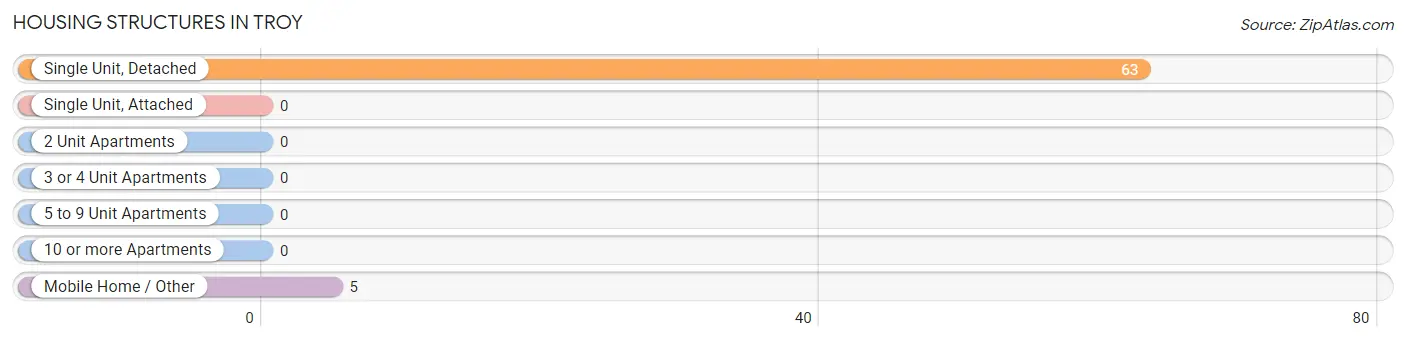
| Structure Type | # Housing Units | % Housing Units |
| Single Unit, Detached | 63 | 92.6% |
| Single Unit, Attached | 0 | 0.0% |
| 2 Unit Apartments | 0 | 0.0% |
| 3 or 4 Unit Apartments | 0 | 0.0% |
| 5 to 9 Unit Apartments | 0 | 0.0% |
| 10 or more Apartments | 0 | 0.0% |
| Mobile Home / Other | 5 | 7.3% |
| Total | 68 | 100.0% |
Housing Structures by Occupancy in Troy
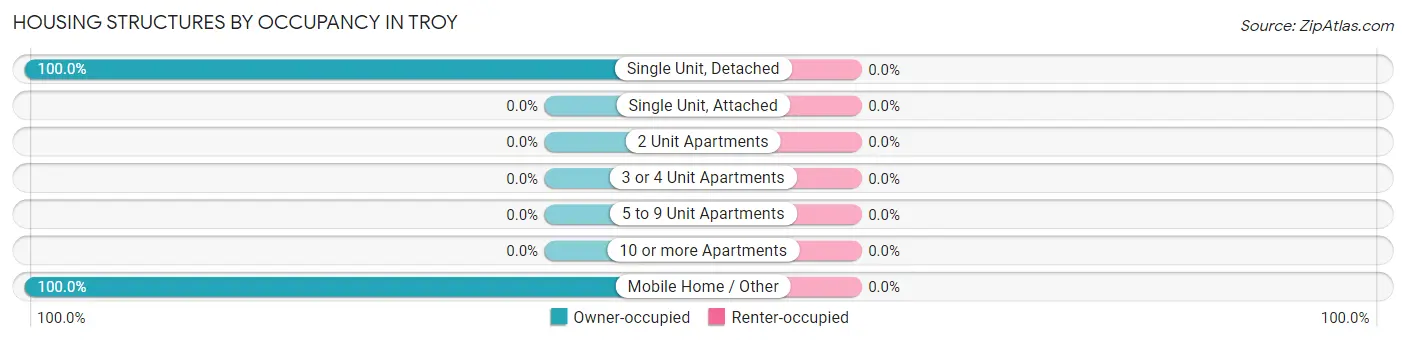
| Structure Type | Owner-occupied | Renter-occupied |
| Single Unit, Detached | 63 (100.0%) | 0 (0.0%) |
| Single Unit, Attached | 0 (0.0%) | 0 (0.0%) |
| 2 Unit Apartments | 0 (0.0%) | 0 (0.0%) |
| 3 or 4 Unit Apartments | 0 (0.0%) | 0 (0.0%) |
| 5 to 9 Unit Apartments | 0 (0.0%) | 0 (0.0%) |
| 10 or more Apartments | 0 (0.0%) | 0 (0.0%) |
| Mobile Home / Other | 5 (100.0%) | 0 (0.0%) |
| Total | 68 (100.0%) | 0 (0.0%) |
Housing Structures by Number of Rooms in Troy
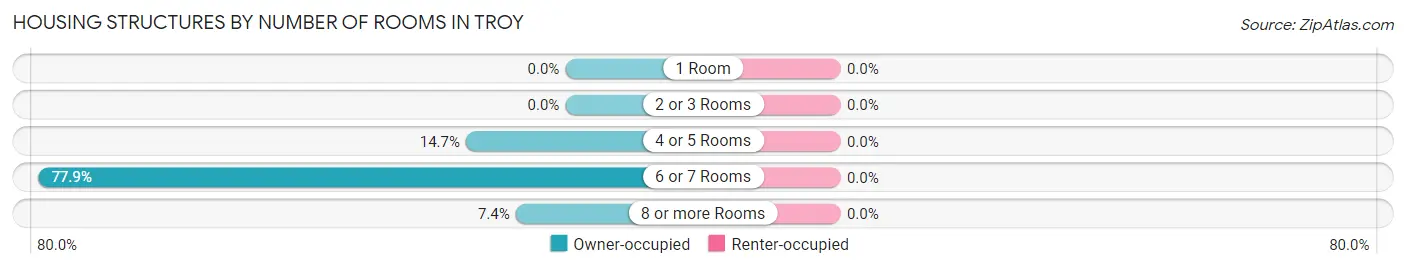
| Number of Rooms | Owner-occupied | Renter-occupied |
| 1 Room | 0 (0.0%) | 0 (0.0%) |
| 2 or 3 Rooms | 0 (0.0%) | 0 (0.0%) |
| 4 or 5 Rooms | 10 (14.7%) | 0 (0.0%) |
| 6 or 7 Rooms | 53 (77.9%) | 0 (0.0%) |
| 8 or more Rooms | 5 (7.3%) | 0 (0.0%) |
| Total | 68 (100.0%) | 0 (0.0%) |
Housing Structure by Heating Type in Troy
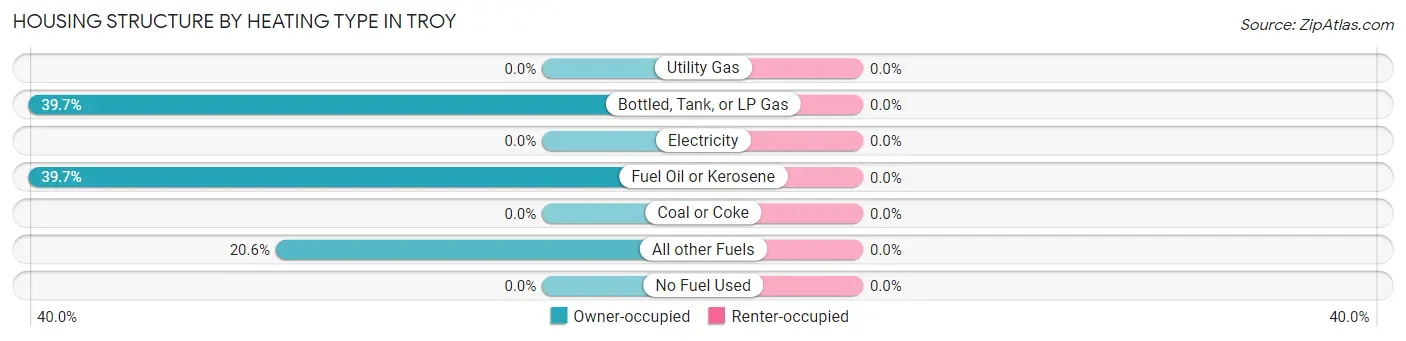
| Heating Type | Owner-occupied | Renter-occupied |
| Utility Gas | 0 (0.0%) | 0 (0.0%) |
| Bottled, Tank, or LP Gas | 27 (39.7%) | 0 (0.0%) |
| Electricity | 0 (0.0%) | 0 (0.0%) |
| Fuel Oil or Kerosene | 27 (39.7%) | 0 (0.0%) |
| Coal or Coke | 0 (0.0%) | 0 (0.0%) |
| All other Fuels | 14 (20.6%) | 0 (0.0%) |
| No Fuel Used | 0 (0.0%) | 0 (0.0%) |
| Total | 68 (100.0%) | 0 (0.0%) |
Household Vehicle Usage in Troy
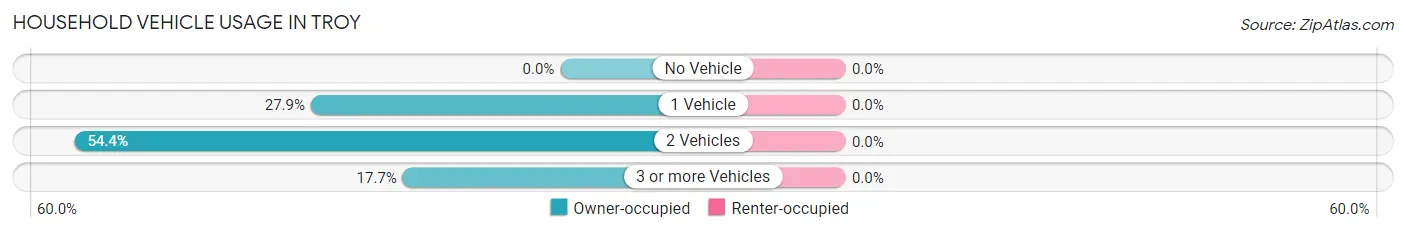
| Vehicles per Household | Owner-occupied | Renter-occupied |
| No Vehicle | 0 (0.0%) | 0 (0.0%) |
| 1 Vehicle | 19 (27.9%) | 0 (0.0%) |
| 2 Vehicles | 37 (54.4%) | 0 (0.0%) |
| 3 or more Vehicles | 12 (17.6%) | 0 (0.0%) |
| Total | 68 (100.0%) | 0 (0.0%) |
Real Estate & Mortgages in Troy
Real Estate and Mortgage Overview in Troy
| Characteristic | Without Mortgage | With Mortgage |
| Housing Units | 43 | 25 |
| Median Property Value | $140,900 | $196,900 |
| Median Household Income | $83,869 | $5 |
| Monthly Housing Costs | $550 | $0 |
| Real Estate Taxes | $2,471 | $0 |
Property Value by Mortgage Status in Troy
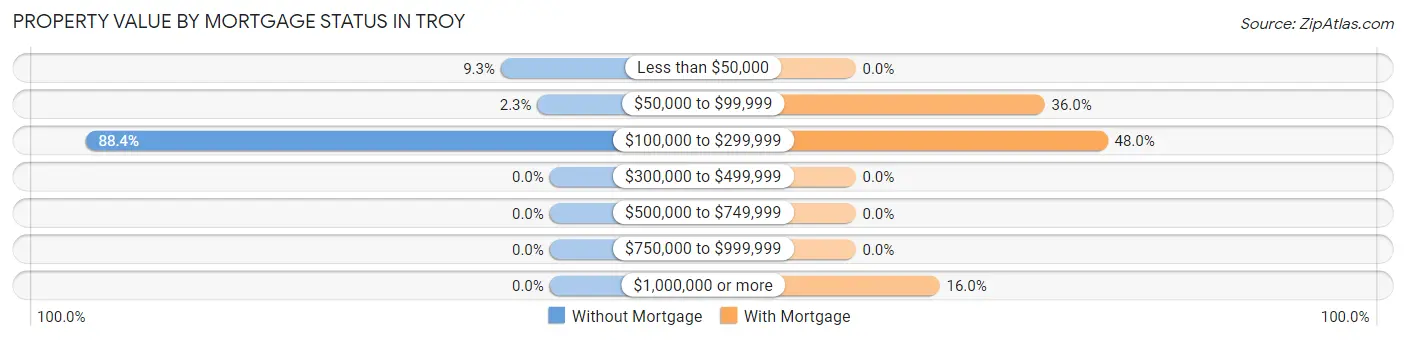
| Property Value | Without Mortgage | With Mortgage |
| Less than $50,000 | 4 (9.3%) | 0 (0.0%) |
| $50,000 to $99,999 | 1 (2.3%) | 9 (36.0%) |
| $100,000 to $299,999 | 38 (88.4%) | 12 (48.0%) |
| $300,000 to $499,999 | 0 (0.0%) | 0 (0.0%) |
| $500,000 to $749,999 | 0 (0.0%) | 0 (0.0%) |
| $750,000 to $999,999 | 0 (0.0%) | 0 (0.0%) |
| $1,000,000 or more | 0 (0.0%) | 4 (16.0%) |
| Total | 43 (100.0%) | 25 (100.0%) |
Household Income by Mortgage Status in Troy
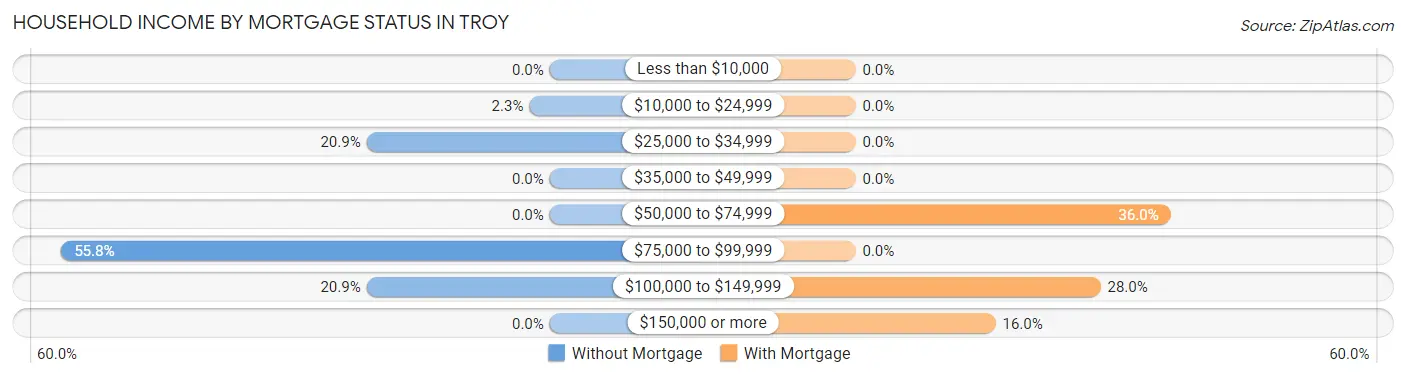
| Household Income | Without Mortgage | With Mortgage |
| Less than $10,000 | 0 (0.0%) | 0 (0.0%) |
| $10,000 to $24,999 | 1 (2.3%) | 0 (0.0%) |
| $25,000 to $34,999 | 9 (20.9%) | 0 (0.0%) |
| $35,000 to $49,999 | 0 (0.0%) | 0 (0.0%) |
| $50,000 to $74,999 | 0 (0.0%) | 9 (36.0%) |
| $75,000 to $99,999 | 24 (55.8%) | 0 (0.0%) |
| $100,000 to $149,999 | 9 (20.9%) | 7 (28.0%) |
| $150,000 or more | 0 (0.0%) | 4 (16.0%) |
| Total | 43 (100.0%) | 25 (100.0%) |
Property Value to Household Income Ratio in Troy
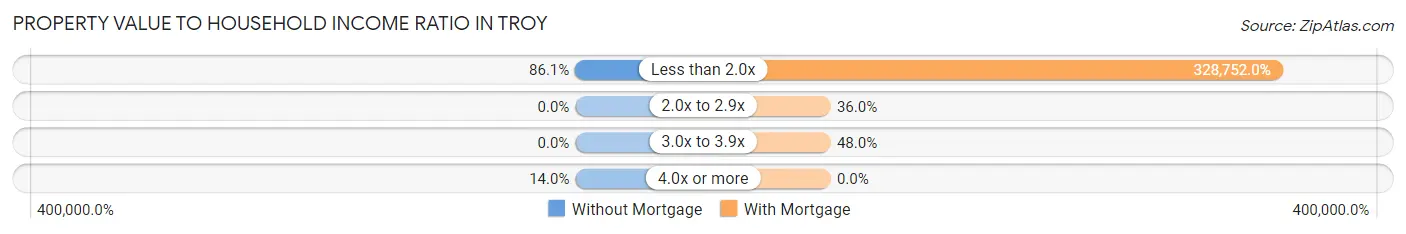
| Value-to-Income Ratio | Without Mortgage | With Mortgage |
| Less than 2.0x | 37 (86.1%) | 82,188 (328,752.0%) |
| 2.0x to 2.9x | 0 (0.0%) | 9 (36.0%) |
| 3.0x to 3.9x | 0 (0.0%) | 12 (48.0%) |
| 4.0x or more | 6 (14.0%) | 0 (0.0%) |
| Total | 43 (100.0%) | 25 (100.0%) |
Real Estate Taxes by Mortgage Status in Troy
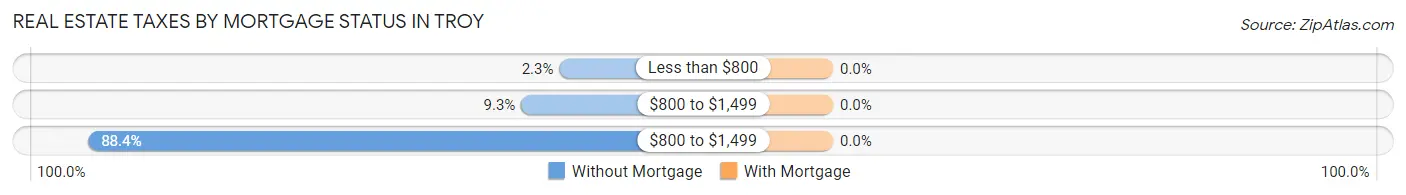
| Property Taxes | Without Mortgage | With Mortgage |
| Less than $800 | 1 (2.3%) | 0 (0.0%) |
| $800 to $1,499 | 4 (9.3%) | 0 (0.0%) |
| $800 to $1,499 | 38 (88.4%) | 0 (0.0%) |
| Total | 43 (100.0%) | 25 (100.0%) |
Health & Disability in Troy
Health Insurance Coverage by Age in Troy
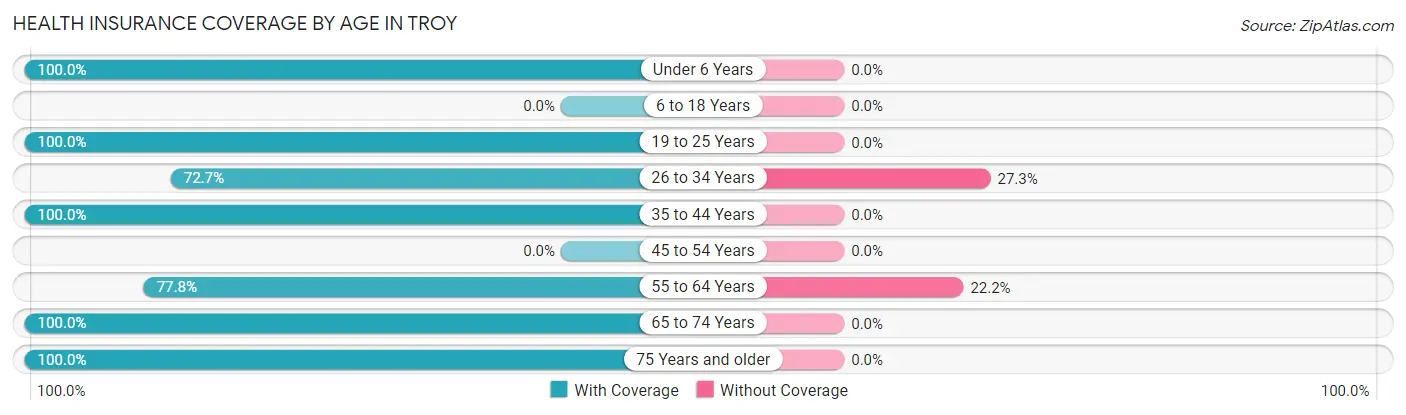
| Age Bracket | With Coverage | Without Coverage |
| Under 6 Years | 7 (100.0%) | 0 (0.0%) |
| 6 to 18 Years | 0 (0.0%) | 0 (0.0%) |
| 19 to 25 Years | 10 (100.0%) | 0 (0.0%) |
| 26 to 34 Years | 8 (72.7%) | 3 (27.3%) |
| 35 to 44 Years | 4 (100.0%) | 0 (0.0%) |
| 45 to 54 Years | 0 (0.0%) | 0 (0.0%) |
| 55 to 64 Years | 14 (77.8%) | 4 (22.2%) |
| 65 to 74 Years | 71 (100.0%) | 0 (0.0%) |
| 75 Years and older | 16 (100.0%) | 0 (0.0%) |
| Total | 130 (94.9%) | 7 (5.1%) |
Health Insurance Coverage by Citizenship Status in Troy
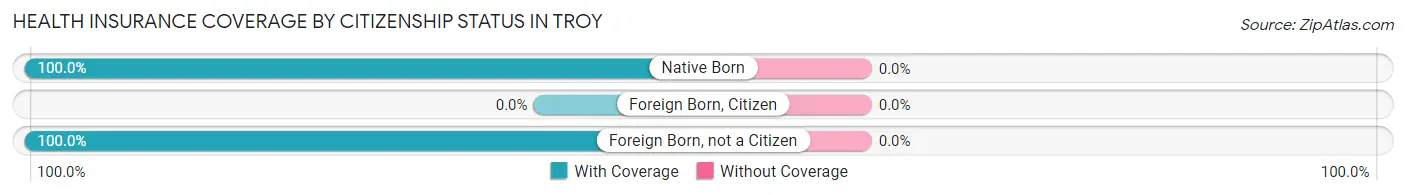
| Citizenship Status | With Coverage | Without Coverage |
| Native Born | 7 (100.0%) | 0 (0.0%) |
| Foreign Born, Citizen | 0 (0.0%) | 0 (0.0%) |
| Foreign Born, not a Citizen | 10 (100.0%) | 0 (0.0%) |
Health Insurance Coverage by Household Income in Troy
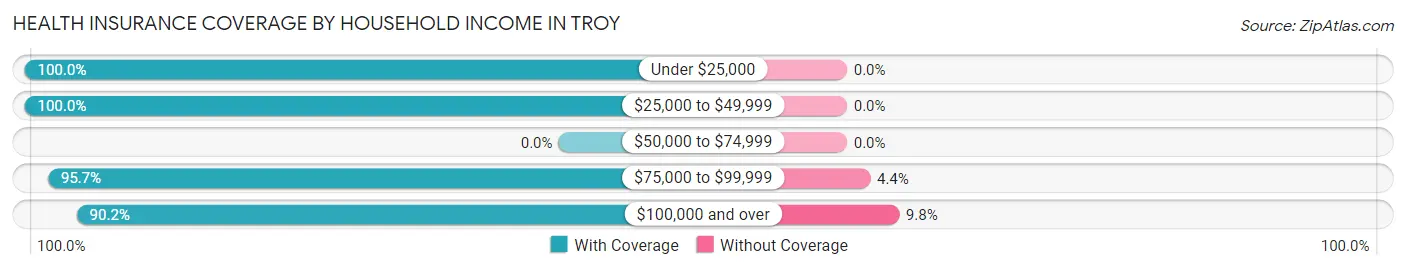
| Household Income | With Coverage | Without Coverage |
| Under $25,000 | 1 (100.0%) | 0 (0.0%) |
| $25,000 to $49,999 | 26 (100.0%) | 0 (0.0%) |
| $50,000 to $74,999 | 0 (0.0%) | 0 (0.0%) |
| $75,000 to $99,999 | 66 (95.7%) | 3 (4.3%) |
| $100,000 and over | 37 (90.2%) | 4 (9.8%) |
Public vs Private Health Insurance Coverage by Age in Troy
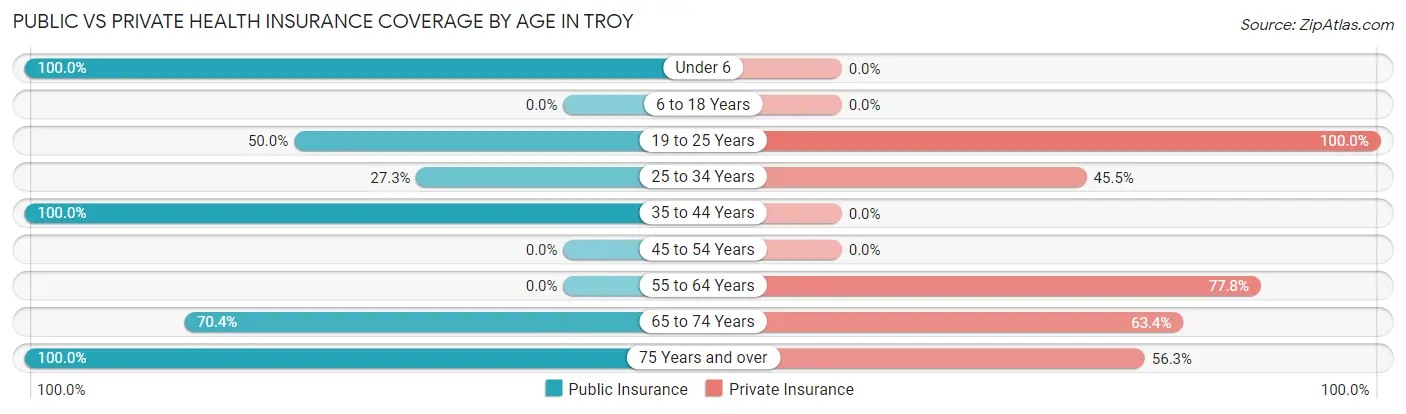
| Age Bracket | Public Insurance | Private Insurance |
| Under 6 | 7 (100.0%) | 0 (0.0%) |
| 6 to 18 Years | 0 (0.0%) | 0 (0.0%) |
| 19 to 25 Years | 5 (50.0%) | 10 (100.0%) |
| 25 to 34 Years | 3 (27.3%) | 5 (45.5%) |
| 35 to 44 Years | 4 (100.0%) | 0 (0.0%) |
| 45 to 54 Years | 0 (0.0%) | 0 (0.0%) |
| 55 to 64 Years | 0 (0.0%) | 14 (77.8%) |
| 65 to 74 Years | 50 (70.4%) | 45 (63.4%) |
| 75 Years and over | 16 (100.0%) | 9 (56.2%) |
| Total | 85 (62.0%) | 83 (60.6%) |
Disability Status by Sex by Age in Troy
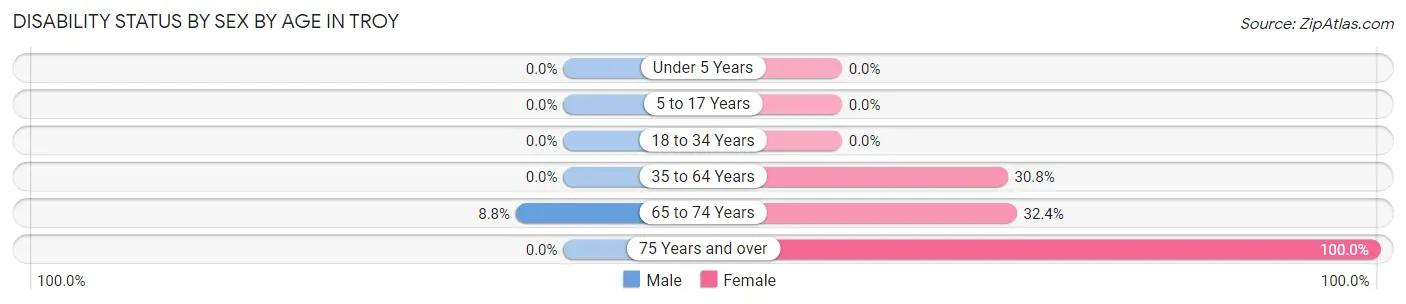
| Age Bracket | Male | Female |
| Under 5 Years | 0 (0.0%) | 0 (0.0%) |
| 5 to 17 Years | 0 (0.0%) | 0 (0.0%) |
| 18 to 34 Years | 0 (0.0%) | 0 (0.0%) |
| 35 to 64 Years | 0 (0.0%) | 4 (30.8%) |
| 65 to 74 Years | 3 (8.8%) | 12 (32.4%) |
| 75 Years and over | 0 (0.0%) | 3 (100.0%) |
Disability Class by Sex by Age in Troy
Disability Class: Hearing Difficulty
| Age Bracket | Male | Female |
| Under 5 Years | 0 (0.0%) | 0 (0.0%) |
| 5 to 17 Years | 0 (0.0%) | 0 (0.0%) |
| 18 to 34 Years | 0 (0.0%) | 0 (0.0%) |
| 35 to 64 Years | 0 (0.0%) | 0 (0.0%) |
| 65 to 74 Years | 0 (0.0%) | 0 (0.0%) |
| 75 Years and over | 0 (0.0%) | 0 (0.0%) |
Disability Class: Vision Difficulty
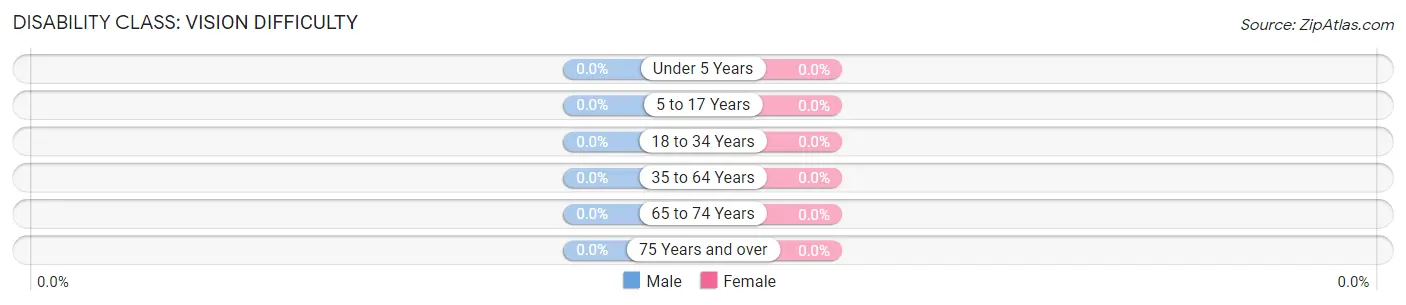
| Age Bracket | Male | Female |
| Under 5 Years | 0 (0.0%) | 0 (0.0%) |
| 5 to 17 Years | 0 (0.0%) | 0 (0.0%) |
| 18 to 34 Years | 0 (0.0%) | 0 (0.0%) |
| 35 to 64 Years | 0 (0.0%) | 0 (0.0%) |
| 65 to 74 Years | 0 (0.0%) | 0 (0.0%) |
| 75 Years and over | 0 (0.0%) | 0 (0.0%) |
Disability Class: Cognitive Difficulty
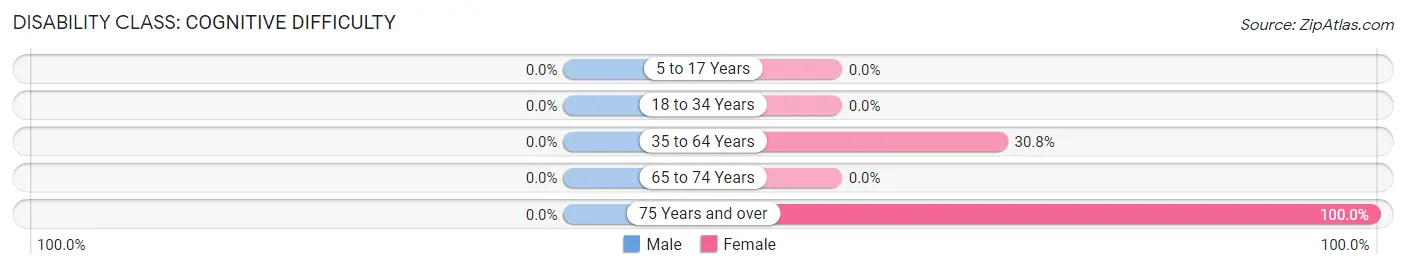
| Age Bracket | Male | Female |
| 5 to 17 Years | 0 (0.0%) | 0 (0.0%) |
| 18 to 34 Years | 0 (0.0%) | 0 (0.0%) |
| 35 to 64 Years | 0 (0.0%) | 4 (30.8%) |
| 65 to 74 Years | 0 (0.0%) | 0 (0.0%) |
| 75 Years and over | 0 (0.0%) | 3 (100.0%) |
Disability Class: Ambulatory Difficulty
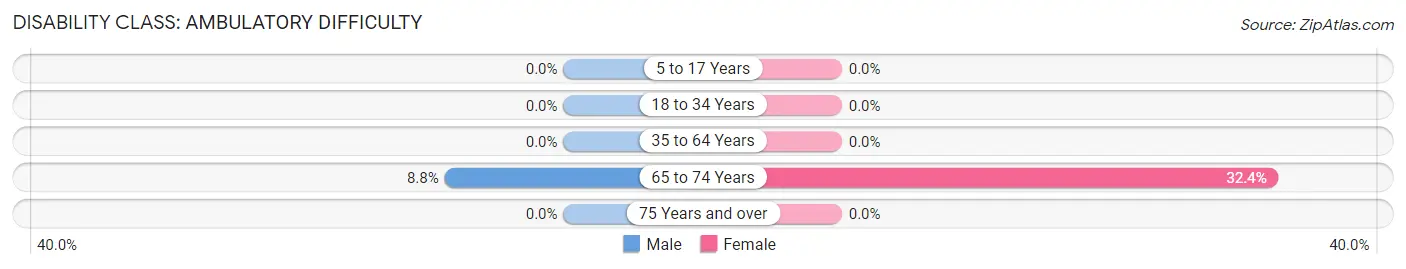
| Age Bracket | Male | Female |
| 5 to 17 Years | 0 (0.0%) | 0 (0.0%) |
| 18 to 34 Years | 0 (0.0%) | 0 (0.0%) |
| 35 to 64 Years | 0 (0.0%) | 0 (0.0%) |
| 65 to 74 Years | 3 (8.8%) | 12 (32.4%) |
| 75 Years and over | 0 (0.0%) | 0 (0.0%) |
Disability Class: Self-Care Difficulty
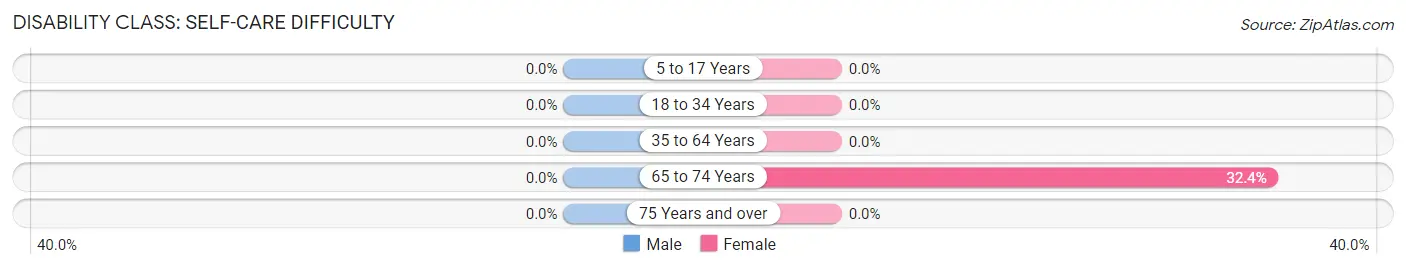
| Age Bracket | Male | Female |
| 5 to 17 Years | 0 (0.0%) | 0 (0.0%) |
| 18 to 34 Years | 0 (0.0%) | 0 (0.0%) |
| 35 to 64 Years | 0 (0.0%) | 0 (0.0%) |
| 65 to 74 Years | 0 (0.0%) | 12 (32.4%) |
| 75 Years and over | 0 (0.0%) | 0 (0.0%) |
Technology Access in Troy
Computing Device Access in Troy
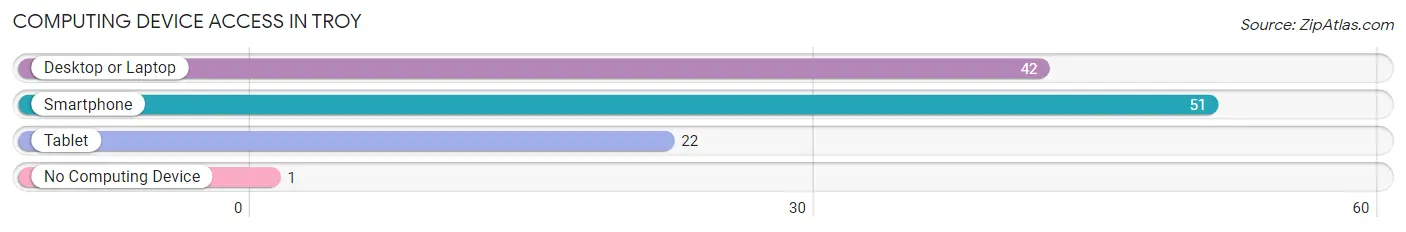
| Device Type | # Households | % Households |
| Desktop or Laptop | 42 | 61.8% |
| Smartphone | 51 | 75.0% |
| Tablet | 22 | 32.4% |
| No Computing Device | 1 | 1.5% |
| Total | 68 | 100.0% |
Internet Access in Troy
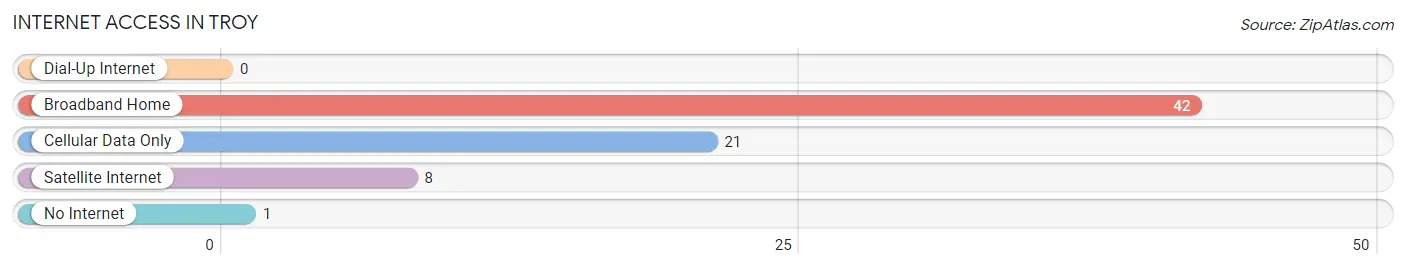
| Internet Type | # Households | % Households |
| Dial-Up Internet | 0 | 0.0% |
| Broadband Home | 42 | 61.8% |
| Cellular Data Only | 21 | 30.9% |
| Satellite Internet | 8 | 11.8% |
| No Internet | 1 | 1.5% |
| Total | 68 | 100.0% |
Troy Summary
Troy is a small town located in the state of Vermont, in the United States of America. It is situated in the northwest corner of the state, in the county of Orleans. The town has a population of 1,845 people, according to the 2010 census.
Geography
Troy is located in the northwest corner of Vermont, in the county of Orleans. It is bordered by the towns of Jay, Westfield, Lowell, and Coventry. The town is situated in the Green Mountains, and is surrounded by the White River, which flows through the town. The town is located at an elevation of 1,400 feet above sea level.
The town has a total area of 24.2 square miles, of which 24.1 square miles is land and 0.1 square miles is water. The town is mostly forested, with some open fields and meadows. The town is home to several small lakes, including Lake Elmore, Lake Eden, and Lake Memphremagog.
History
Troy was first settled in 1790 by settlers from Massachusetts. The town was named after the city of Troy, New York. The town was incorporated in 1793.
In the early 19th century, Troy was a center of the lumber industry. The town was home to several sawmills and gristmills, which provided lumber and grain to the surrounding area. The town was also home to several small farms, which provided food for the local population.
In the late 19th century, Troy became a popular tourist destination. The town was home to several resorts, which attracted visitors from all over the country. The town was also home to several small factories, which produced a variety of goods.
Economy
Troy is a small, rural town, and the economy is largely based on agriculture and tourism. The town is home to several small farms, which produce a variety of crops, including corn, hay, and vegetables. The town is also home to several small businesses, which provide goods and services to the local population.
The town is also home to several tourist attractions, including the Troy Historical Society Museum, the Troy Country Club, and the Troy Ski Area. The town is also home to several small restaurants and shops, which provide goods and services to the local population.
Demographics
According to the 2010 census, the population of Troy was 1,845 people. The racial makeup of the town was 97.3% White, 0.3% African American, 0.2% Native American, 0.2% Asian, 0.1% Pacific Islander, 0.7% from other races, and 1.2% from two or more races. Hispanic or Latino of any race were 1.7% of the population.
The median income for a household in the town was $41,250, and the median income for a family was $50,000. The per capita income for the town was $20,945. About 8.3% of families and 11.2% of the population were below the poverty line, including 14.2% of those under age 18 and 8.3% of those age 65 or over.
Common Questions
What is Per Capita Income in Troy?
Per Capita income in Troy is $41,725.
What is the Median Family Income in Troy?
Median Family Income in Troy is $84,107.
What is the Median Household income in Troy?
Median Household Income in Troy is $83,810.
What is Inequality or Gini Index in Troy?
Inequality or Gini Index in Troy is 0.23.
What is the Total Population of Troy?
Total Population of Troy is 137.
What is the Total Male Population of Troy?
Total Male Population of Troy is 73.
What is the Total Female Population of Troy?
Total Female Population of Troy is 64.
What is the Ratio of Males per 100 Females in Troy?
There are 114.06 Males per 100 Females in Troy.
What is the Ratio of Females per 100 Males in Troy?
There are 87.67 Females per 100 Males in Troy.
What is the Median Population Age in Troy?
Median Population Age in Troy is 66.3 Years.
What is the Average Family Size in Troy
Average Family Size in Troy is 2.1 People.
What is the Average Household Size in Troy
Average Household Size in Troy is 2.0 People.
How Large is the Labor Force in Troy?
There are 82 People in the Labor Forcein in Troy.
What is the Percentage of People in the Labor Force in Troy?
63.1% of People are in the Labor Force in Troy.