Pittsford, VT Map & Demographics
Pittsford Map
Pittsford Overview
$33,434
PER CAPITA INCOME
$37,760
AVG HOUSEHOLD INCOME
0.38
INEQUALITY / GINI INDEX
583
TOTAL POPULATION
251
MALE POPULATION
332
FEMALE POPULATION
75.60
MALES / 100 FEMALES
132.27
FEMALES / 100 MALES
60.7
MEDIAN AGE
2.6
AVG FAMILY SIZE
1.6
AVG HOUSEHOLD SIZE
266
LABOR FORCE [ PEOPLE ]
48.7%
PERCENT IN LABOR FORCE
9.0%
UNEMPLOYMENT RATE
Pittsford Zip Codes
Pittsford Area Codes
Income in Pittsford
Income Overview in Pittsford
| Characteristic | Number | Measure |
| Per Capita Income | 583 | $33,434 |
| Median Family Income | 121 | $0 |
| Mean Family Income | 121 | $81,307 |
| Median Household Income | 355 | $37,760 |
| Mean Household Income | 355 | $52,522 |
| Income Deficit | 121 | $0 |
| Wage / Income Gap (%) | 583 | 0.00% |
| Wage / Income Gap ($) | 583 | 100.00¢ per $1 |
| Gini / Inequality Index | 583 | 0.38 |
Earnings by Sex in Pittsford
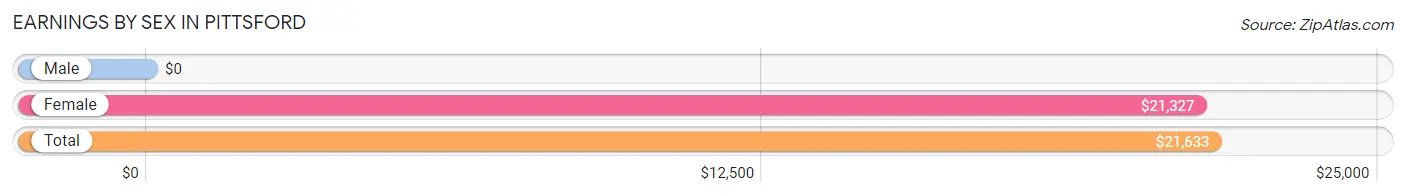
| Sex | Number | Average Earnings |
| Male | 104 (43.0%) | $0 |
| Female | 138 (57.0%) | $21,327 |
| Total | 242 (100.0%) | $21,633 |
Earnings by Sex by Income Bracket in Pittsford
The most common earnings brackets in Pittsford are $10,000 to $12,499 for men (25 | 24.0%) and $20,000 to $22,499 for women (49 | 35.5%).
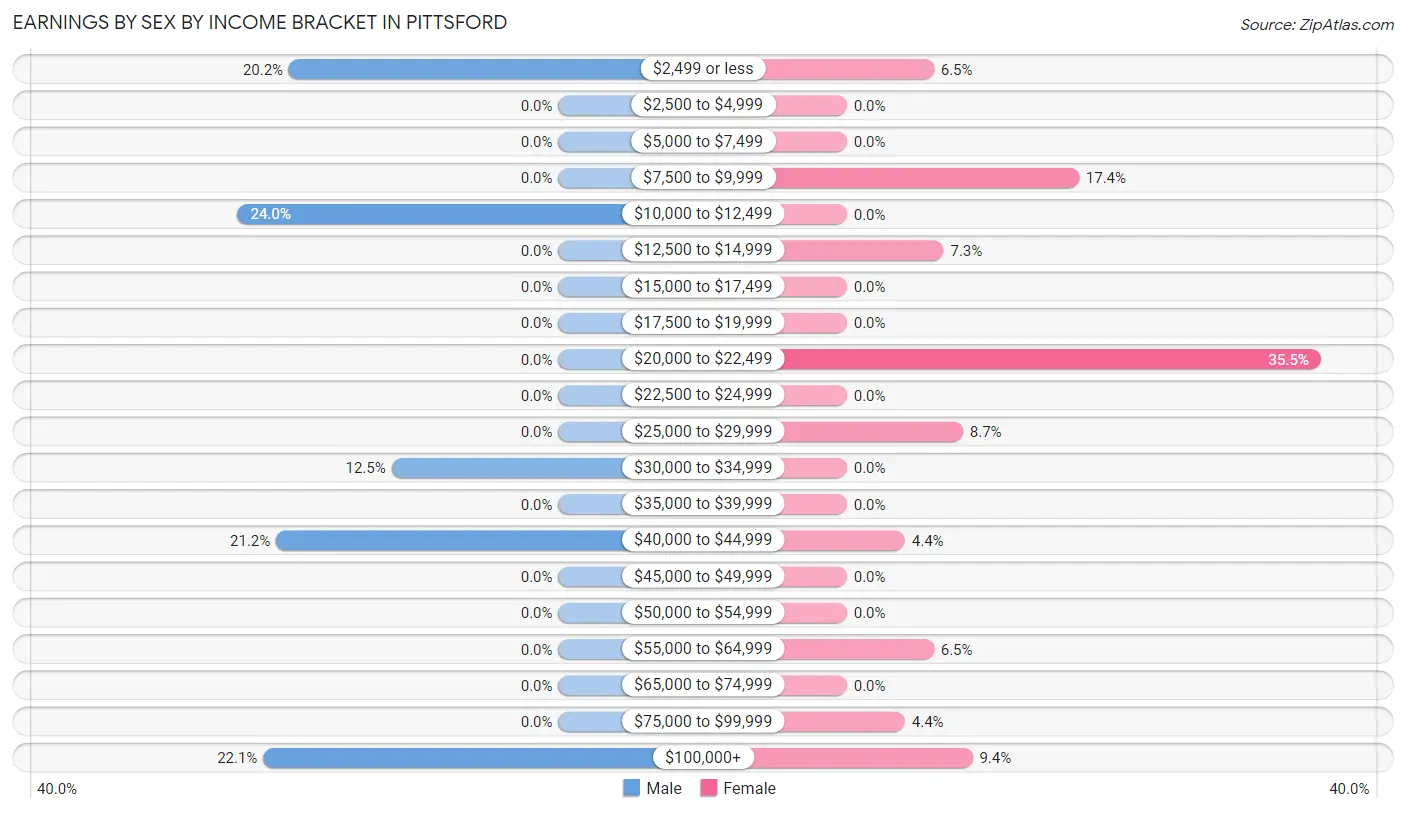
| Income | Male | Female |
| $2,499 or less | 21 (20.2%) | 9 (6.5%) |
| $2,500 to $4,999 | 0 (0.0%) | 0 (0.0%) |
| $5,000 to $7,499 | 0 (0.0%) | 0 (0.0%) |
| $7,500 to $9,999 | 0 (0.0%) | 24 (17.4%) |
| $10,000 to $12,499 | 25 (24.0%) | 0 (0.0%) |
| $12,500 to $14,999 | 0 (0.0%) | 10 (7.2%) |
| $15,000 to $17,499 | 0 (0.0%) | 0 (0.0%) |
| $17,500 to $19,999 | 0 (0.0%) | 0 (0.0%) |
| $20,000 to $22,499 | 0 (0.0%) | 49 (35.5%) |
| $22,500 to $24,999 | 0 (0.0%) | 0 (0.0%) |
| $25,000 to $29,999 | 0 (0.0%) | 12 (8.7%) |
| $30,000 to $34,999 | 13 (12.5%) | 0 (0.0%) |
| $35,000 to $39,999 | 0 (0.0%) | 0 (0.0%) |
| $40,000 to $44,999 | 22 (21.1%) | 6 (4.3%) |
| $45,000 to $49,999 | 0 (0.0%) | 0 (0.0%) |
| $50,000 to $54,999 | 0 (0.0%) | 0 (0.0%) |
| $55,000 to $64,999 | 0 (0.0%) | 9 (6.5%) |
| $65,000 to $74,999 | 0 (0.0%) | 0 (0.0%) |
| $75,000 to $99,999 | 0 (0.0%) | 6 (4.3%) |
| $100,000+ | 23 (22.1%) | 13 (9.4%) |
| Total | 104 (100.0%) | 138 (100.0%) |
Earnings by Sex by Educational Attainment in Pittsford
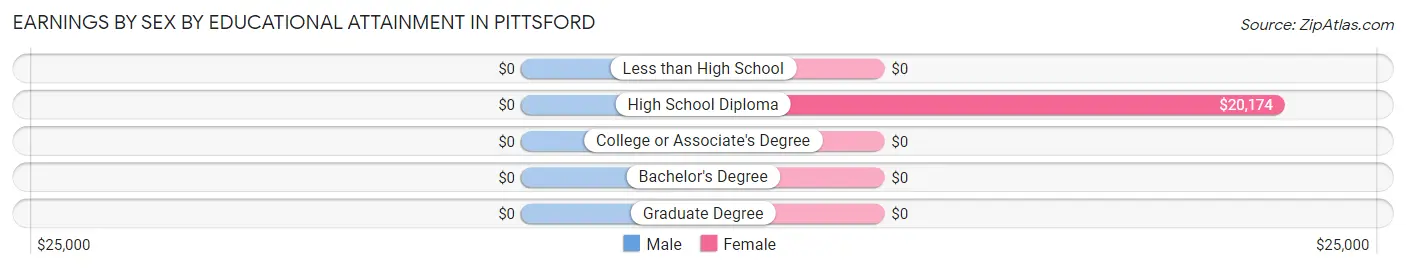
| Educational Attainment | Male Income | Female Income |
| Less than High School | - | - |
| High School Diploma | - | - |
| College or Associate's Degree | - | - |
| Bachelor's Degree | - | - |
| Graduate Degree | - | - |
| Total | - | - |
Family Income in Pittsford
Family Income Brackets in Pittsford
According to the Pittsford family income data, there are 45 families falling into the $50,000 to $74,999 income range, which is the most common income bracket and makes up 37.2% of all families.
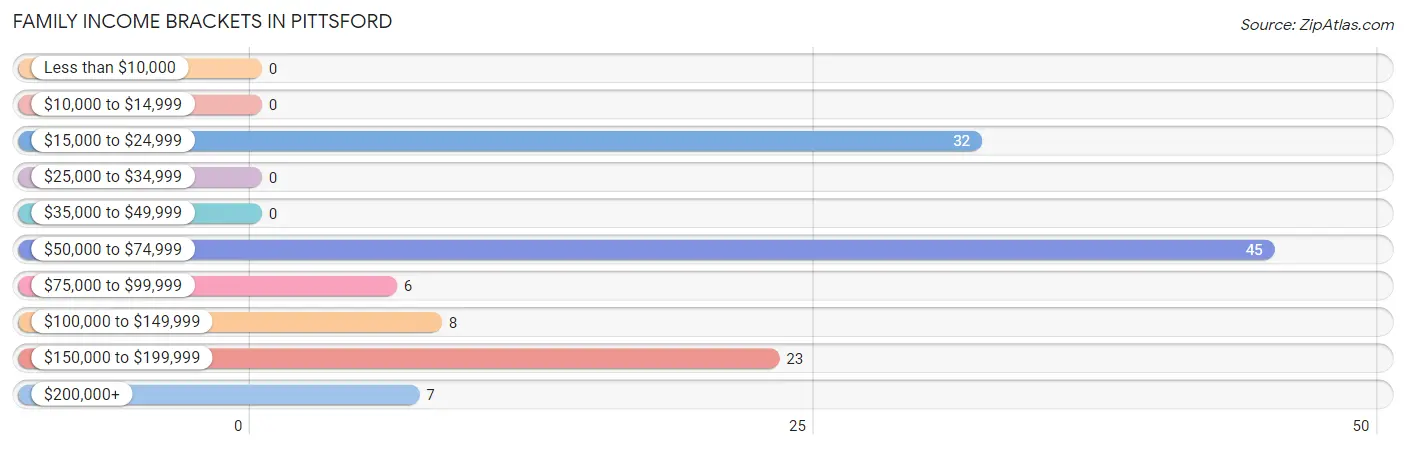
| Income Bracket | # Families | % Families |
| Less than $10,000 | 0 | 0.0% |
| $10,000 to $14,999 | 0 | 0.0% |
| $15,000 to $24,999 | 32 | 26.4% |
| $25,000 to $34,999 | 0 | 0.0% |
| $35,000 to $49,999 | 0 | 0.0% |
| $50,000 to $74,999 | 45 | 37.2% |
| $75,000 to $99,999 | 6 | 5.0% |
| $100,000 to $149,999 | 8 | 6.6% |
| $150,000 to $199,999 | 23 | 19.0% |
| $200,000+ | 7 | 5.8% |
Family Income by Famaliy Size in Pittsford
3-person families (31 | 25.6%) account for the highest median family income in Pittsford with $153,750 per family, while 3-person families (31 | 25.6%) have the highest median income of $51,250 per family member.
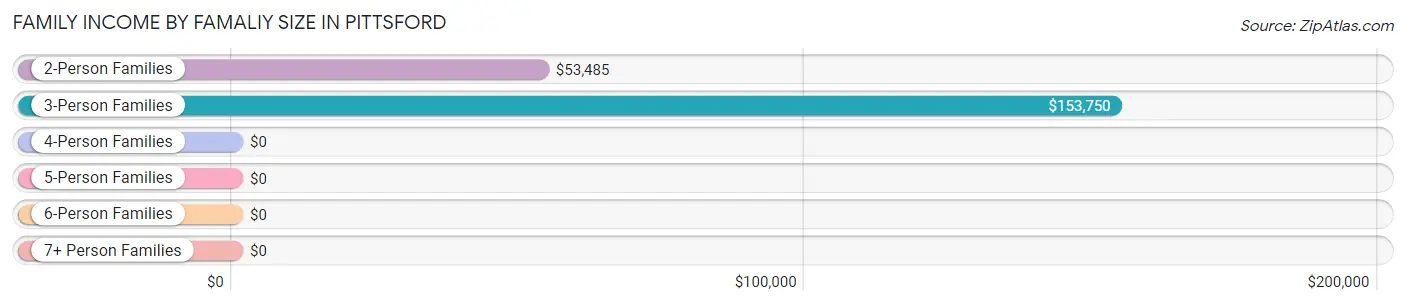
| Income Bracket | # Families | Median Income |
| 2-Person Families | 90 (74.4%) | $53,485 |
| 3-Person Families | 31 (25.6%) | $153,750 |
| 4-Person Families | 0 (0.0%) | $0 |
| 5-Person Families | 0 (0.0%) | $0 |
| 6-Person Families | 0 (0.0%) | $0 |
| 7+ Person Families | 0 (0.0%) | $0 |
| Total | 121 (100.0%) | $0 |
Family Income by Number of Earners in Pittsford
| Number of Earners | # Families | Median Income |
| No Earners | 41 (33.9%) | $0 |
| 1 Earner | 15 (12.4%) | $0 |
| 2 Earners | 65 (53.7%) | $0 |
| 3+ Earners | 0 (0.0%) | $0 |
| Total | 121 (100.0%) | $0 |
Household Income in Pittsford
Household Income Brackets in Pittsford
With 90 households falling in the category, the $35,000 to $49,999 income range is the most frequent in Pittsford, accounting for 25.4% of all households.
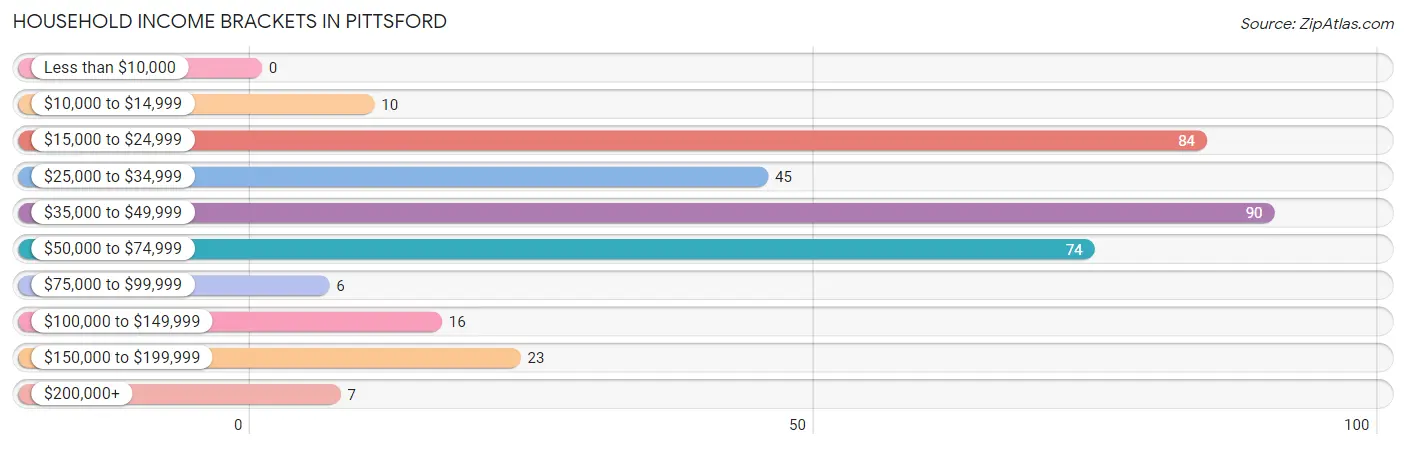
| Income Bracket | # Households | % Households |
| Less than $10,000 | 0 | 0.0% |
| $10,000 to $14,999 | 10 | 2.8% |
| $15,000 to $24,999 | 84 | 23.7% |
| $25,000 to $34,999 | 45 | 12.7% |
| $35,000 to $49,999 | 90 | 25.4% |
| $50,000 to $74,999 | 74 | 20.8% |
| $75,000 to $99,999 | 6 | 1.7% |
| $100,000 to $149,999 | 16 | 4.5% |
| $150,000 to $199,999 | 23 | 6.5% |
| $200,000+ | 7 | 2.0% |
Household Income by Householder Age in Pittsford
The median household income in Pittsford is $37,760, with the highest median household income of $35,799 found in the 65+ years age bracket for the primary householder. A total of 231 households (65.1%) fall into this category.
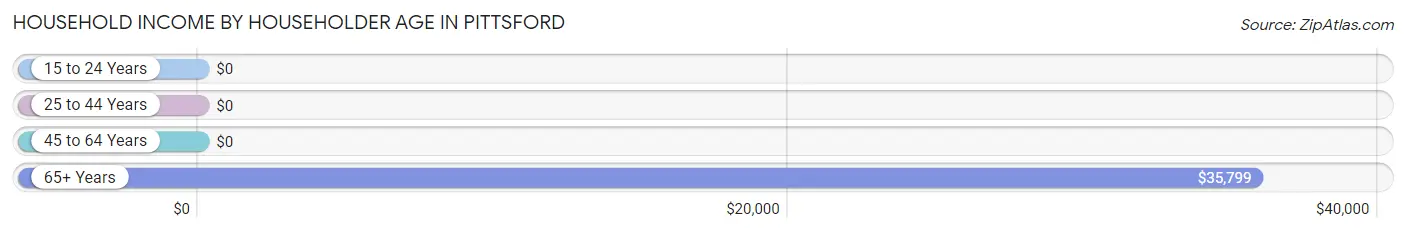
| Income Bracket | # Households | Median Income |
| 15 to 24 Years | 0 (0.0%) | $0 |
| 25 to 44 Years | 55 (15.5%) | $0 |
| 45 to 64 Years | 69 (19.4%) | $0 |
| 65+ Years | 231 (65.1%) | $35,799 |
| Total | 355 (100.0%) | $37,760 |
Poverty in Pittsford
Income Below Poverty by Sex and Age in Pittsford
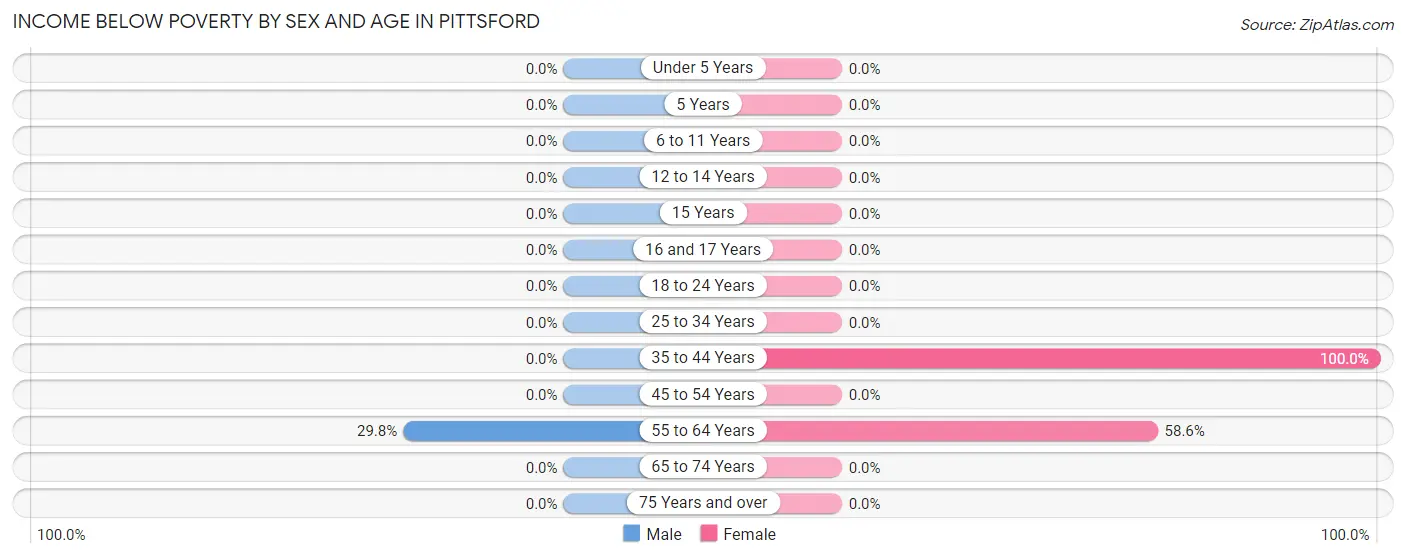
With 10.0% poverty level for males and 21.4% for females among the residents of Pittsford, 55 to 64 year old males and 35 to 44 year old females are the most vulnerable to poverty, with 25 males (29.8%) and 37 females (100.0%) in their respective age groups living below the poverty level.
| Age Bracket | Male | Female |
| Under 5 Years | 0 (0.0%) | 0 (0.0%) |
| 5 Years | 0 (0.0%) | 0 (0.0%) |
| 6 to 11 Years | 0 (0.0%) | 0 (0.0%) |
| 12 to 14 Years | 0 (0.0%) | 0 (0.0%) |
| 15 Years | 0 (0.0%) | 0 (0.0%) |
| 16 and 17 Years | 0 (0.0%) | 0 (0.0%) |
| 18 to 24 Years | 0 (0.0%) | 0 (0.0%) |
| 25 to 34 Years | 0 (0.0%) | 0 (0.0%) |
| 35 to 44 Years | 0 (0.0%) | 37 (100.0%) |
| 45 to 54 Years | 0 (0.0%) | 0 (0.0%) |
| 55 to 64 Years | 25 (29.8%) | 34 (58.6%) |
| 65 to 74 Years | 0 (0.0%) | 0 (0.0%) |
| 75 Years and over | 0 (0.0%) | 0 (0.0%) |
| Total | 25 (10.0%) | 71 (21.4%) |
Income Above Poverty by Sex and Age in Pittsford
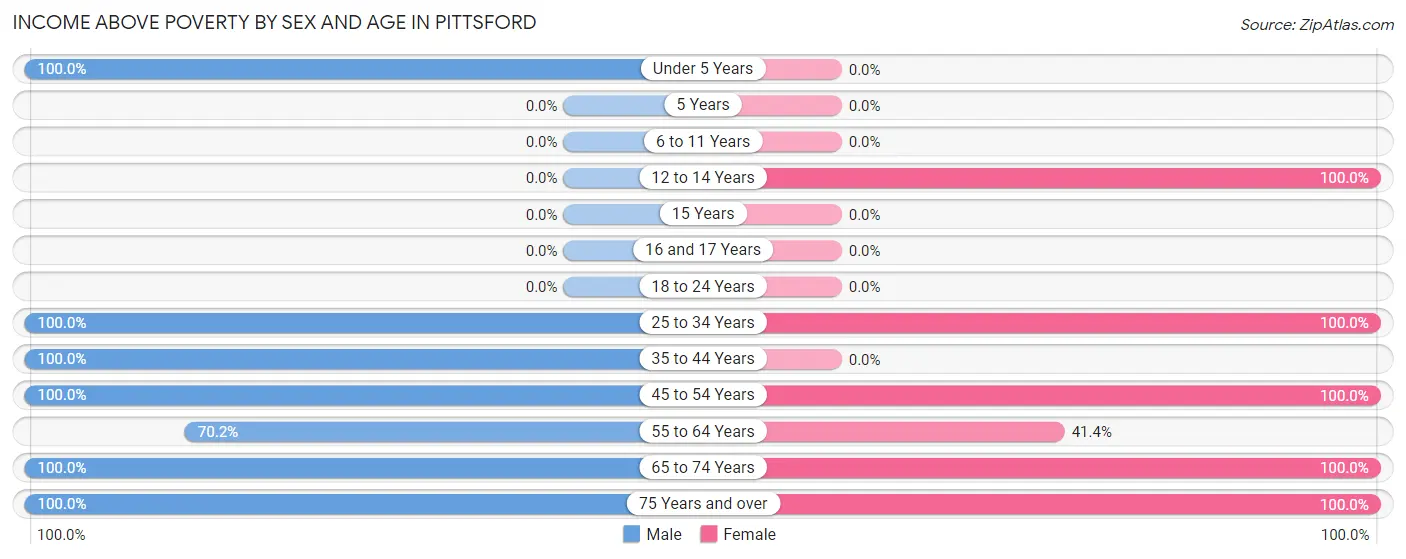
According to the poverty statistics in Pittsford, males aged under 5 years and females aged 12 to 14 years are the age groups that are most secure financially, with 100.0% of males and 100.0% of females in these age groups living above the poverty line.
| Age Bracket | Male | Female |
| Under 5 Years | 15 (100.0%) | 0 (0.0%) |
| 5 Years | 0 (0.0%) | 0 (0.0%) |
| 6 to 11 Years | 0 (0.0%) | 0 (0.0%) |
| 12 to 14 Years | 0 (0.0%) | 22 (100.0%) |
| 15 Years | 0 (0.0%) | 0 (0.0%) |
| 16 and 17 Years | 0 (0.0%) | 0 (0.0%) |
| 18 to 24 Years | 0 (0.0%) | 0 (0.0%) |
| 25 to 34 Years | 15 (100.0%) | 26 (100.0%) |
| 35 to 44 Years | 40 (100.0%) | 0 (0.0%) |
| 45 to 54 Years | 14 (100.0%) | 9 (100.0%) |
| 55 to 64 Years | 59 (70.2%) | 24 (41.4%) |
| 65 to 74 Years | 57 (100.0%) | 109 (100.0%) |
| 75 Years and over | 26 (100.0%) | 71 (100.0%) |
| Total | 226 (90.0%) | 261 (78.6%) |
Income Below Poverty Among Married-Couple Families in Pittsford
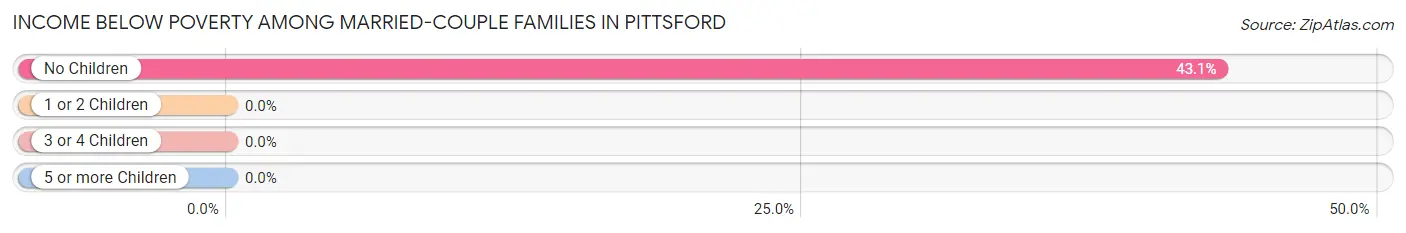
The poverty statistics for married-couple families in Pittsford show that 34.3% or 25 of the total 73 families live below the poverty line. Families with no children have the highest poverty rate of 43.1%, comprising of 25 families. On the other hand, families with 1 or 2 children have the lowest poverty rate of 0.0%, which includes 0 families.
| Children | Above Poverty | Below Poverty |
| No Children | 33 (56.9%) | 25 (43.1%) |
| 1 or 2 Children | 15 (100.0%) | 0 (0.0%) |
| 3 or 4 Children | 0 (0.0%) | 0 (0.0%) |
| 5 or more Children | 0 (0.0%) | 0 (0.0%) |
| Total | 48 (65.7%) | 25 (34.3%) |
Income Below Poverty Among Single-Parent Households in Pittsford
| Children | Single Father | Single Mother |
| No Children | 0 (0.0%) | 0 (0.0%) |
| 1 or 2 Children | 0 (0.0%) | 0 (0.0%) |
| 3 or 4 Children | 0 (0.0%) | 0 (0.0%) |
| 5 or more Children | 0 (0.0%) | 0 (0.0%) |
| Total | 0 (0.0%) | 0 (0.0%) |
Income Below Poverty Among Married-Couple vs Single-Parent Households in Pittsford
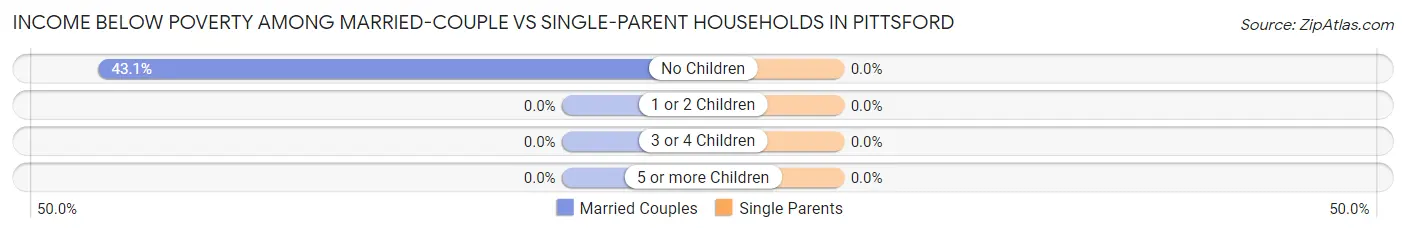
| Children | Married-Couple Families | Single-Parent Households |
| No Children | 25 (43.1%) | 0 (0.0%) |
| 1 or 2 Children | 0 (0.0%) | 0 (0.0%) |
| 3 or 4 Children | 0 (0.0%) | 0 (0.0%) |
| 5 or more Children | 0 (0.0%) | 0 (0.0%) |
| Total | 25 (34.3%) | 0 (0.0%) |
Race in Pittsford
The most populous races in Pittsford are , and White / Caucasian (583 | 100.0%).
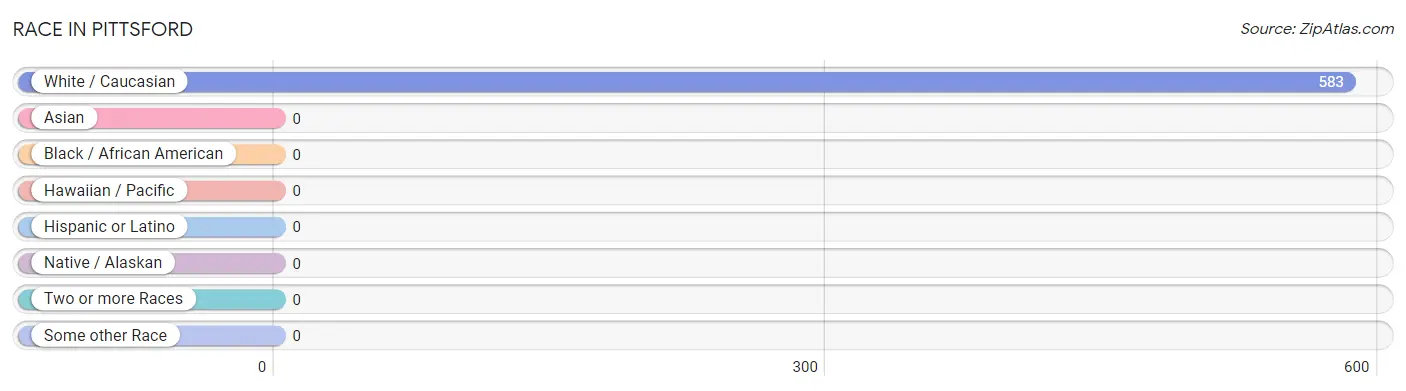
| Race | # Population | % Population |
| Asian | 0 | 0.0% |
| Black / African American | 0 | 0.0% |
| Hawaiian / Pacific | 0 | 0.0% |
| Hispanic or Latino | 0 | 0.0% |
| Native / Alaskan | 0 | 0.0% |
| White / Caucasian | 583 | 100.0% |
| Two or more Races | 0 | 0.0% |
| Some other Race | 0 | 0.0% |
| Total | 583 | 100.0% |
Ancestry in Pittsford
The most populous ancestries reported in Pittsford are French (116 | 19.9%), Irish (78 | 13.4%), English (65 | 11.2%), German (65 | 11.2%), and American (62 | 10.6%), together accounting for 66.2% of all Pittsford residents.
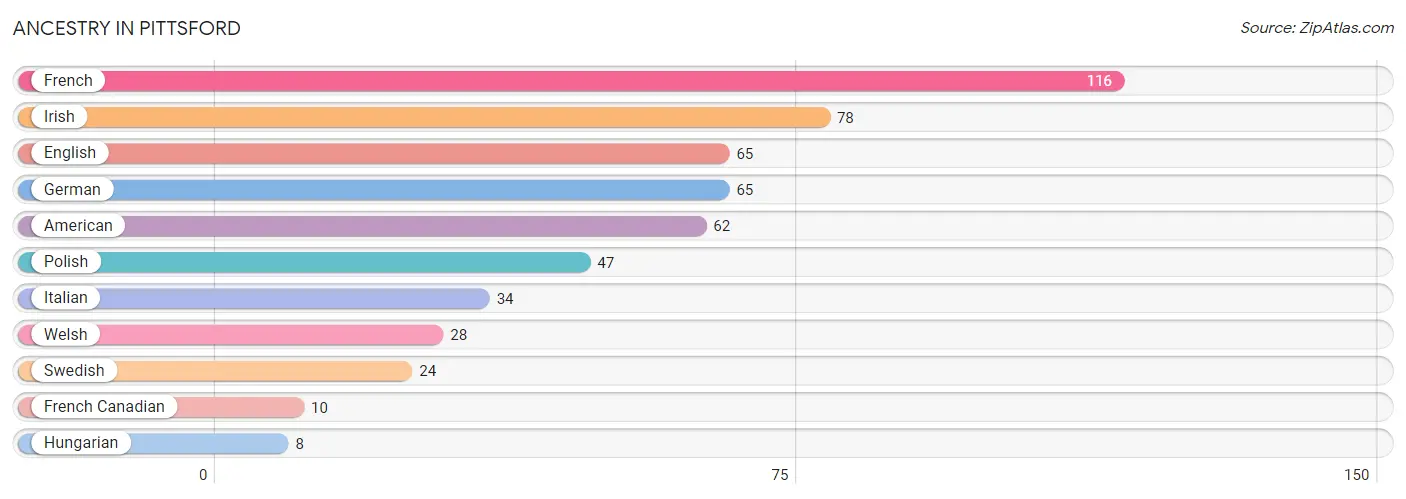
| Ancestry | # Population | % Population |
| American | 62 | 10.6% |
| English | 65 | 11.2% |
| French | 116 | 19.9% |
| French Canadian | 10 | 1.7% |
| German | 65 | 11.2% |
| Hungarian | 8 | 1.4% |
| Irish | 78 | 13.4% |
| Italian | 34 | 5.8% |
| Polish | 47 | 8.1% |
| Swedish | 24 | 4.1% |
| Welsh | 28 | 4.8% | View All 11 Rows |
Immigrants in Pittsford

| Immigration Origin | # Population | % Population | View All 0 Rows |
Sex and Age in Pittsford
Sex and Age in Pittsford
The most populous age groups in Pittsford are 55 to 59 Years (77 | 30.7%) for men and 65 to 69 Years (63 | 19.0%) for women.
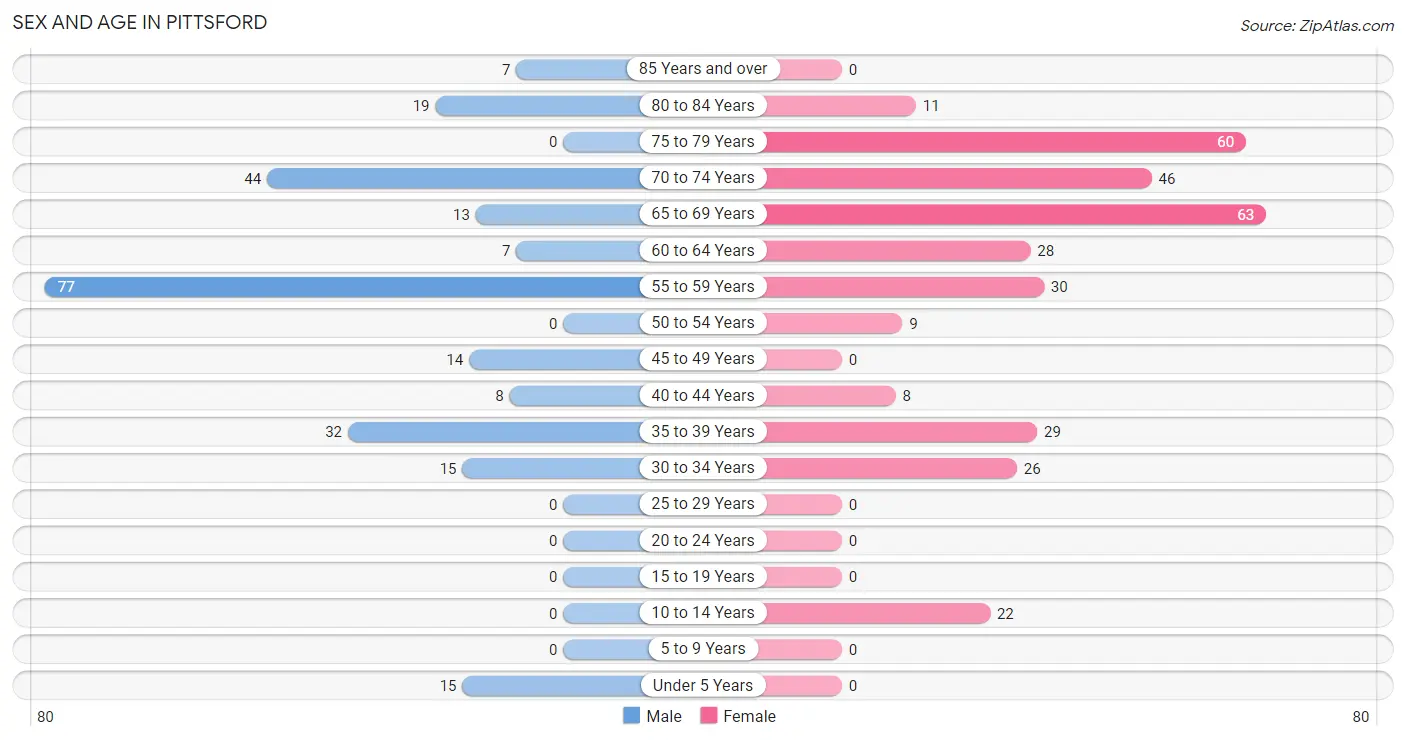
| Age Bracket | Male | Female |
| Under 5 Years | 15 (6.0%) | 0 (0.0%) |
| 5 to 9 Years | 0 (0.0%) | 0 (0.0%) |
| 10 to 14 Years | 0 (0.0%) | 22 (6.6%) |
| 15 to 19 Years | 0 (0.0%) | 0 (0.0%) |
| 20 to 24 Years | 0 (0.0%) | 0 (0.0%) |
| 25 to 29 Years | 0 (0.0%) | 0 (0.0%) |
| 30 to 34 Years | 15 (6.0%) | 26 (7.8%) |
| 35 to 39 Years | 32 (12.8%) | 29 (8.7%) |
| 40 to 44 Years | 8 (3.2%) | 8 (2.4%) |
| 45 to 49 Years | 14 (5.6%) | 0 (0.0%) |
| 50 to 54 Years | 0 (0.0%) | 9 (2.7%) |
| 55 to 59 Years | 77 (30.7%) | 30 (9.0%) |
| 60 to 64 Years | 7 (2.8%) | 28 (8.4%) |
| 65 to 69 Years | 13 (5.2%) | 63 (19.0%) |
| 70 to 74 Years | 44 (17.5%) | 46 (13.9%) |
| 75 to 79 Years | 0 (0.0%) | 60 (18.1%) |
| 80 to 84 Years | 19 (7.6%) | 11 (3.3%) |
| 85 Years and over | 7 (2.8%) | 0 (0.0%) |
| Total | 251 (100.0%) | 332 (100.0%) |
Families and Households in Pittsford
Median Family Size in Pittsford
The median family size in Pittsford is 2.58 persons per family, with single male/father families (15 | 12.4%) accounting for the largest median family size of 3.33 persons per family. On the other hand, single female/mother families (33 | 27.3%) represent the smallest median family size with 2.36 persons per family.
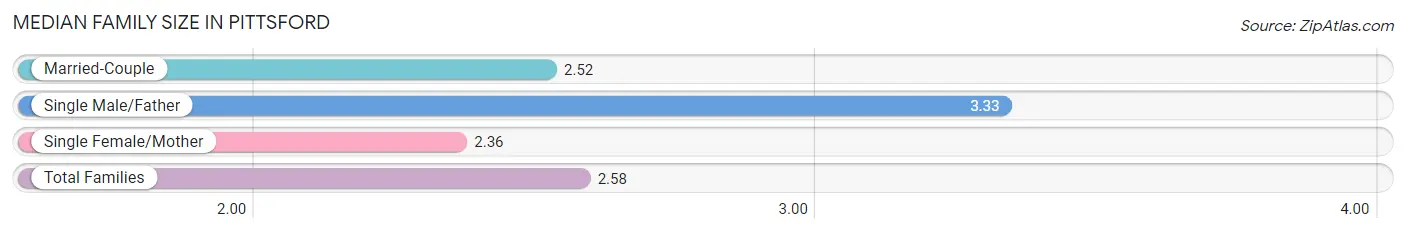
| Family Type | # Families | Family Size |
| Married-Couple | 73 (60.3%) | 2.52 |
| Single Male/Father | 15 (12.4%) | 3.33 |
| Single Female/Mother | 33 (27.3%) | 2.36 |
| Total Families | 121 (100.0%) | 2.58 |
Median Household Size in Pittsford
The median household size in Pittsford is 1.64 persons per household, with single male/father households (15 | 4.2%) accounting for the largest median household size of 3.87 persons per household. non-family households (234 | 65.9%) represent the smallest median household size with 1.12 persons per household.
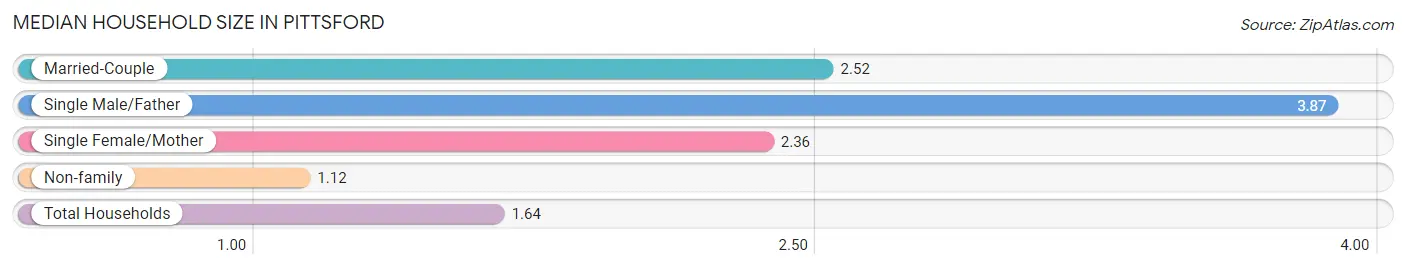
| Household Type | # Households | Household Size |
| Married-Couple | 73 (20.6%) | 2.52 |
| Single Male/Father | 15 (4.2%) | 3.87 |
| Single Female/Mother | 33 (9.3%) | 2.36 |
| Non-family | 234 (65.9%) | 1.12 |
| Total Households | 355 (100.0%) | 1.64 |
Household Size by Marriage Status in Pittsford
Out of a total of 355 households in Pittsford, 121 (34.1%) are family households, while 234 (65.9%) are nonfamily households. The most numerous type of family households are 2-person households, comprising 90, and the most common type of nonfamily households are 1-person households, comprising 210.
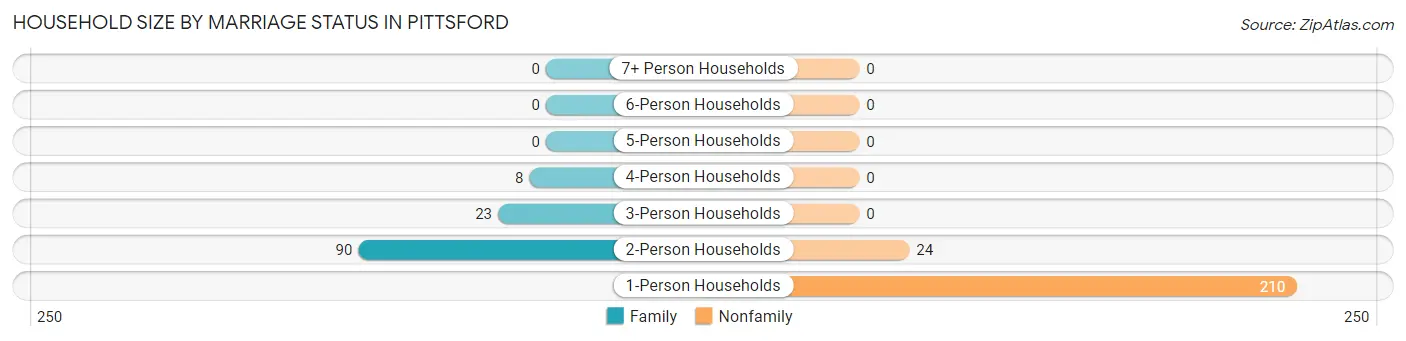
| Household Size | Family Households | Nonfamily Households |
| 1-Person Households | - | 210 (59.2%) |
| 2-Person Households | 90 (25.4%) | 24 (6.8%) |
| 3-Person Households | 23 (6.5%) | 0 (0.0%) |
| 4-Person Households | 8 (2.2%) | 0 (0.0%) |
| 5-Person Households | 0 (0.0%) | 0 (0.0%) |
| 6-Person Households | 0 (0.0%) | 0 (0.0%) |
| 7+ Person Households | 0 (0.0%) | 0 (0.0%) |
| Total | 121 (34.1%) | 234 (65.9%) |
Female Fertility in Pittsford
Fertility by Age in Pittsford
| Age Bracket | Women with Births | Births / 1,000 Women |
| 15 to 19 years | 0 (0.0%) | 0.0 |
| 20 to 34 years | 0 (0.0%) | 0.0 |
| 35 to 50 years | 0 (0.0%) | 0.0 |
| Total | 0 (0.0%) | 0.0 |
Fertility by Age by Marriage Status in Pittsford
| Age Bracket | Married | Unmarried |
| 15 to 19 years | 0 (0.0%) | 0 (0.0%) |
| 20 to 34 years | 0 (0.0%) | 0 (0.0%) |
| 35 to 50 years | 0 (0.0%) | 0 (0.0%) |
| Total | 0 (0.0%) | 0 (0.0%) |
Fertility by Education in Pittsford
| Educational Attainment | Women with Births | Births / 1,000 Women |
| Less than High School | 0 (0.0%) | 0.0 |
| High School Diploma | 0 (0.0%) | 0.0 |
| College or Associate's Degree | 0 (0.0%) | 0.0 |
| Bachelor's Degree | 0 (0.0%) | 0.0 |
| Graduate Degree | 0 (0.0%) | 0.0 |
| Total | 0 (0.0%) | 0.0 |
Fertility by Education by Marriage Status in Pittsford
| Educational Attainment | Married | Unmarried |
| Less than High School | 0 (0.0%) | 0 (0.0%) |
| High School Diploma | 0 (0.0%) | 0 (0.0%) |
| College or Associate's Degree | 0 (0.0%) | 0 (0.0%) |
| Bachelor's Degree | 0 (0.0%) | 0 (0.0%) |
| Graduate Degree | 0 (0.0%) | 0 (0.0%) |
| Total | 0 (0.0%) | 0 (0.0%) |
Employment Characteristics in Pittsford
Employment by Class of Employer in Pittsford
Among the 229 employed individuals in Pittsford, private company employees (148 | 64.6%), self-employed (incorporated) (49 | 21.4%), and local government employees (26 | 11.4%) make up the most common classes of employment.
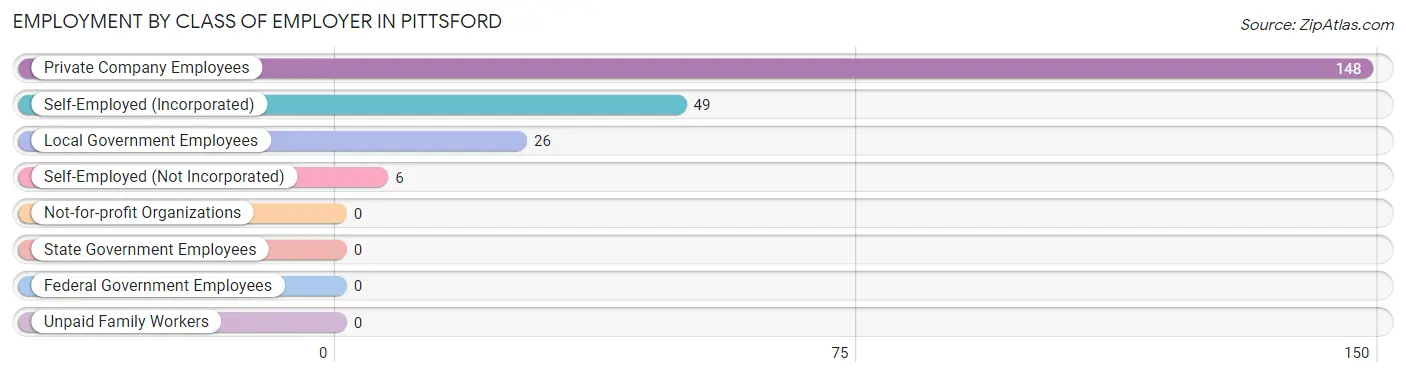
| Employer Class | # Employees | % Employees |
| Private Company Employees | 148 | 64.6% |
| Self-Employed (Incorporated) | 49 | 21.4% |
| Self-Employed (Not Incorporated) | 6 | 2.6% |
| Not-for-profit Organizations | 0 | 0.0% |
| Local Government Employees | 26 | 11.4% |
| State Government Employees | 0 | 0.0% |
| Federal Government Employees | 0 | 0.0% |
| Unpaid Family Workers | 0 | 0.0% |
| Total | 229 | 100.0% |
Employment Status by Age in Pittsford
According to the labor force statistics for Pittsford, out of the total population over 16 years of age (546), 48.7% or 266 individuals are in the labor force, with 9.0% or 24 of them unemployed. The age group with the highest labor force participation rate is 30 to 34 years, with 100.0% or 41 individuals in the labor force. Within the labor force, the 35 to 44 years age range has the highest percentage of unemployed individuals, with 60.0% or 24 of them being unemployed.
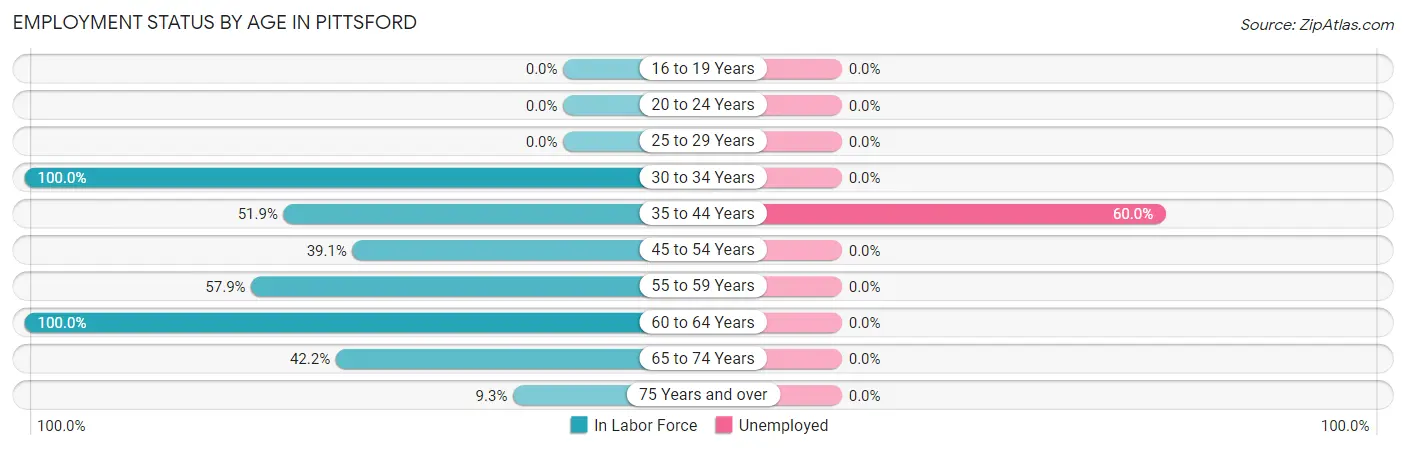
| Age Bracket | In Labor Force | Unemployed |
| 16 to 19 Years | 0 (0.0%) | 0 (0.0%) |
| 20 to 24 Years | 0 (0.0%) | 0 (0.0%) |
| 25 to 29 Years | 0 (0.0%) | 0 (0.0%) |
| 30 to 34 Years | 41 (100.0%) | 0 (0.0%) |
| 35 to 44 Years | 40 (51.9%) | 24 (60.0%) |
| 45 to 54 Years | 9 (39.1%) | 0 (0.0%) |
| 55 to 59 Years | 62 (57.9%) | 0 (0.0%) |
| 60 to 64 Years | 35 (100.0%) | 0 (0.0%) |
| 65 to 74 Years | 70 (42.2%) | 0 (0.0%) |
| 75 Years and over | 9 (9.3%) | 0 (0.0%) |
| Total | 266 (48.7%) | 24 (9.0%) |
Employment Status by Educational Attainment in Pittsford
According to labor force statistics for Pittsford, 66.1% of individuals (187) out of the total population between 25 and 64 years of age (283) are in the labor force, with 12.8% or 24 of them being unemployed. The group with the highest labor force participation rate are those with the educational attainment of less than high school, with 100.0% or 13 individuals in the labor force. Within the labor force, individuals with high school diploma education have the highest percentage of unemployment, with 25.3% or 24 of them being unemployed.
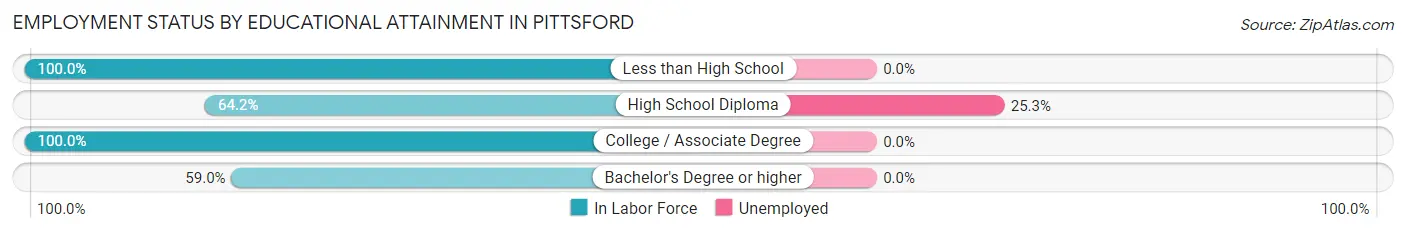
| Educational Attainment | In Labor Force | Unemployed |
| Less than High School | 13 (100.0%) | 0 (0.0%) |
| High School Diploma | 95 (64.2%) | 37 (25.3%) |
| College / Associate Degree | 17 (100.0%) | 0 (0.0%) |
| Bachelor's Degree or higher | 62 (59.0%) | 0 (0.0%) |
| Total | 187 (66.1%) | 36 (12.8%) |
Employment Occupations by Sex in Pittsford
Management, Business, Science and Arts Occupations
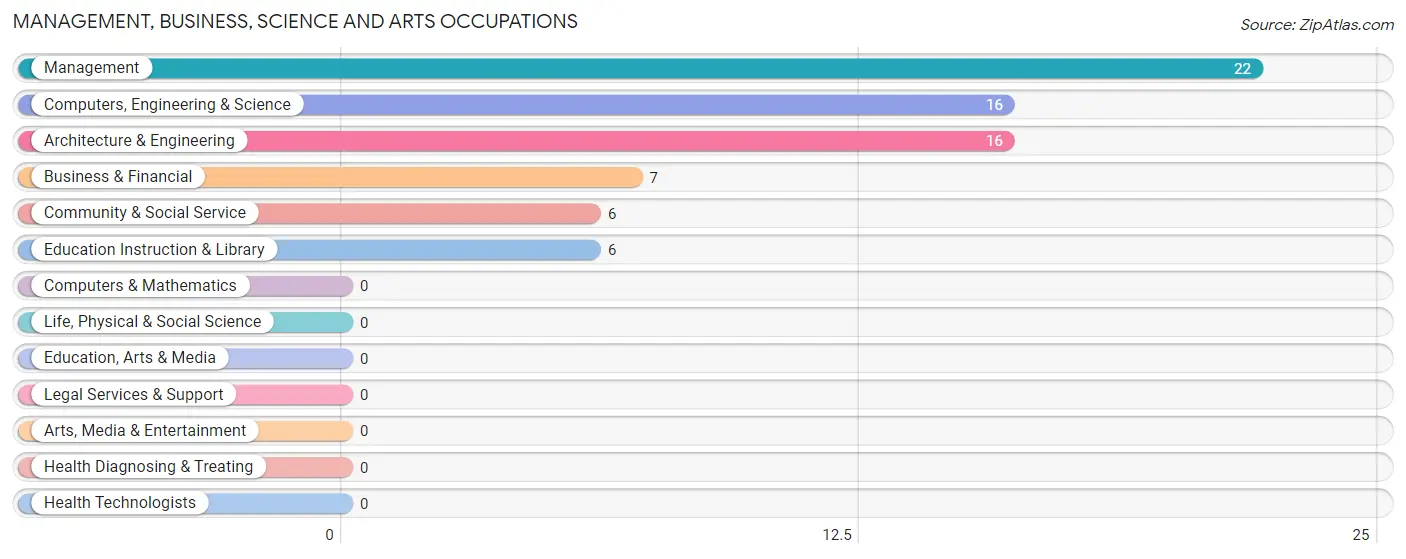
The most common Management, Business, Science and Arts occupations in Pittsford are Management (22 | 9.1%), Computers, Engineering & Science (16 | 6.6%), Architecture & Engineering (16 | 6.6%), Business & Financial (7 | 2.9%), and Community & Social Service (6 | 2.5%).
Management, Business, Science and Arts Occupations by Sex
Within the Management, Business, Science and Arts occupations in Pittsford, the most male-oriented occupations are Business & Financial (100.0%), Computers, Engineering & Science (100.0%), and Architecture & Engineering (100.0%), while the most female-oriented occupations are Management (100.0%), Community & Social Service (100.0%), and Education Instruction & Library (100.0%).
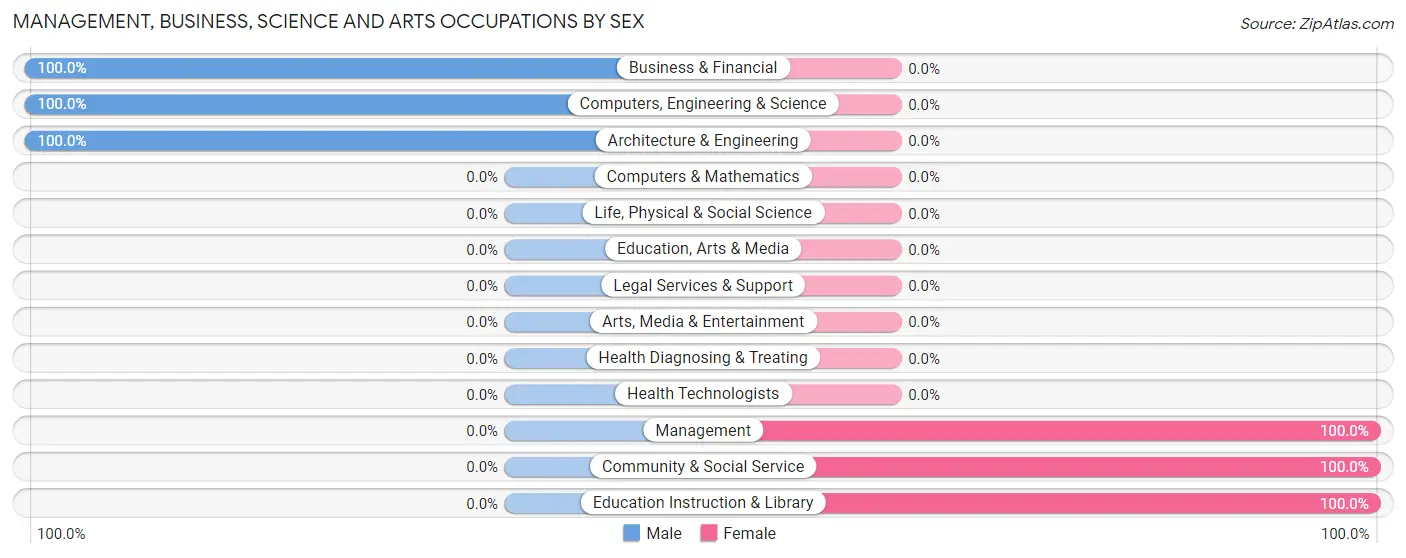
| Occupation | Male | Female |
| Management | 0 (0.0%) | 22 (100.0%) |
| Business & Financial | 7 (100.0%) | 0 (0.0%) |
| Computers, Engineering & Science | 16 (100.0%) | 0 (0.0%) |
| Computers & Mathematics | 0 (0.0%) | 0 (0.0%) |
| Architecture & Engineering | 16 (100.0%) | 0 (0.0%) |
| Life, Physical & Social Science | 0 (0.0%) | 0 (0.0%) |
| Community & Social Service | 0 (0.0%) | 6 (100.0%) |
| Education, Arts & Media | 0 (0.0%) | 0 (0.0%) |
| Legal Services & Support | 0 (0.0%) | 0 (0.0%) |
| Education Instruction & Library | 0 (0.0%) | 6 (100.0%) |
| Arts, Media & Entertainment | 0 (0.0%) | 0 (0.0%) |
| Health Diagnosing & Treating | 0 (0.0%) | 0 (0.0%) |
| Health Technologists | 0 (0.0%) | 0 (0.0%) |
| Total (Category) | 23 (45.1%) | 28 (54.9%) |
| Total (Overall) | 104 (43.0%) | 138 (57.0%) |
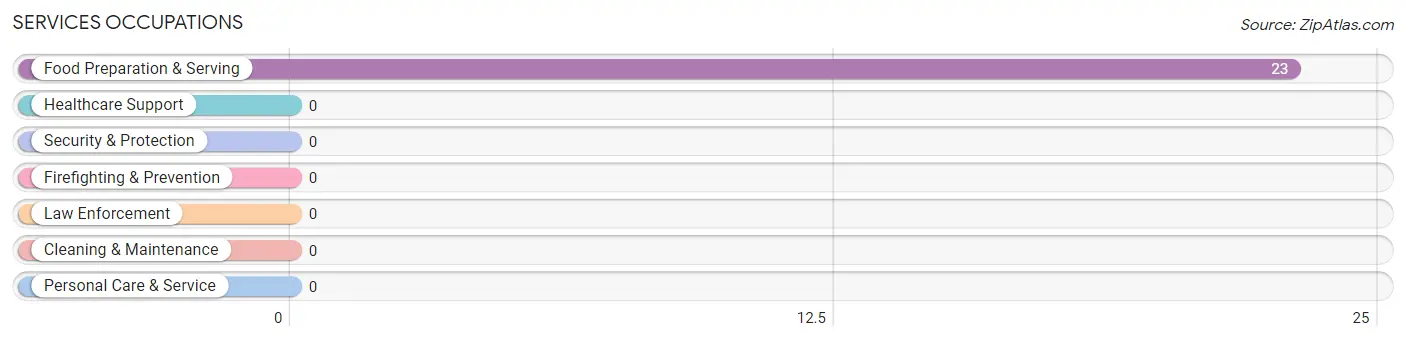
Services Occupations
The most common Services occupations in Pittsford are , and Food Preparation & Serving (23 | 9.5%).
Services Occupations by Sex
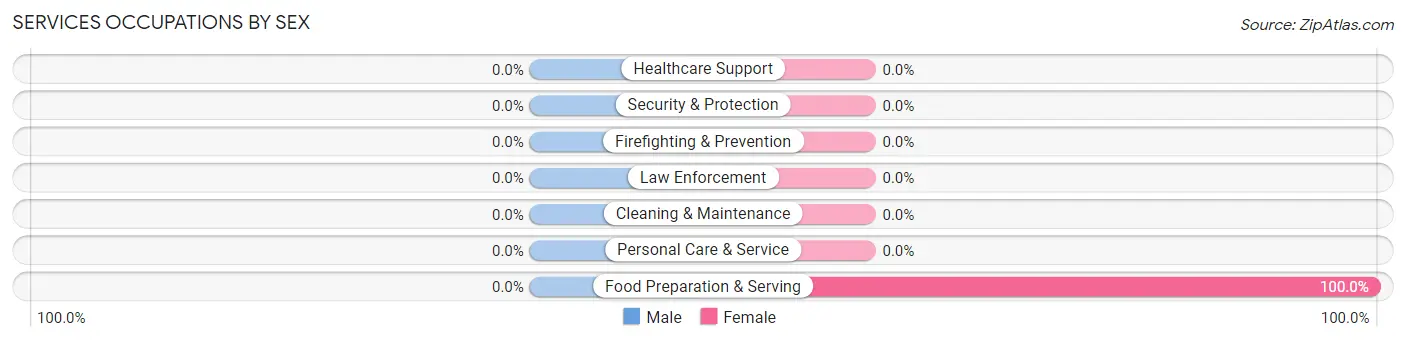
| Occupation | Male | Female |
| Healthcare Support | 0 (0.0%) | 0 (0.0%) |
| Security & Protection | 0 (0.0%) | 0 (0.0%) |
| Firefighting & Prevention | 0 (0.0%) | 0 (0.0%) |
| Law Enforcement | 0 (0.0%) | 0 (0.0%) |
| Food Preparation & Serving | 0 (0.0%) | 23 (100.0%) |
| Cleaning & Maintenance | 0 (0.0%) | 0 (0.0%) |
| Personal Care & Service | 0 (0.0%) | 0 (0.0%) |
| Total (Category) | 0 (0.0%) | 23 (100.0%) |
| Total (Overall) | 104 (43.0%) | 138 (57.0%) |
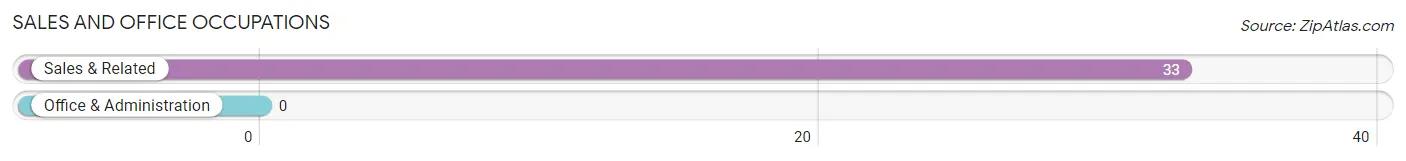
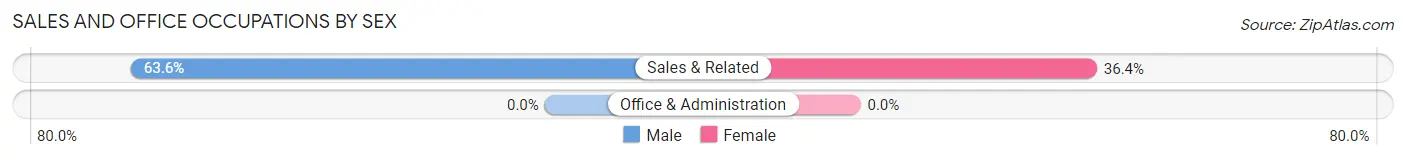
Sales and Office Occupations
The most common Sales and Office occupations in Pittsford are , and Sales & Related (33 | 13.6%).
Sales and Office Occupations by Sex
| Occupation | Male | Female |
| Sales & Related | 21 (63.6%) | 12 (36.4%) |
| Office & Administration | 0 (0.0%) | 0 (0.0%) |
| Total (Category) | 21 (63.6%) | 12 (36.4%) |
| Total (Overall) | 104 (43.0%) | 138 (57.0%) |
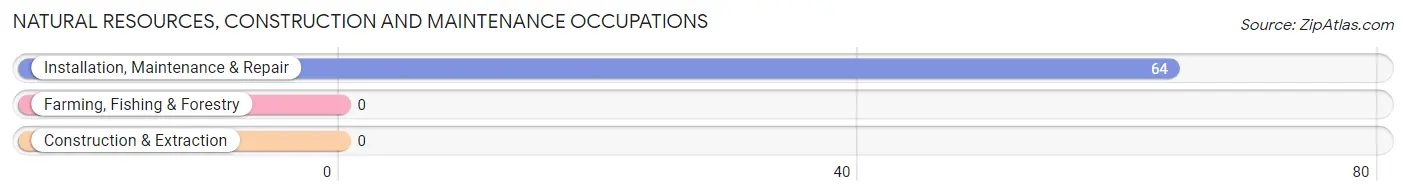
Natural Resources, Construction and Maintenance Occupations
The most common Natural Resources, Construction and Maintenance occupations in Pittsford are , and Installation, Maintenance & Repair (64 | 26.5%).
Natural Resources, Construction and Maintenance Occupations by Sex
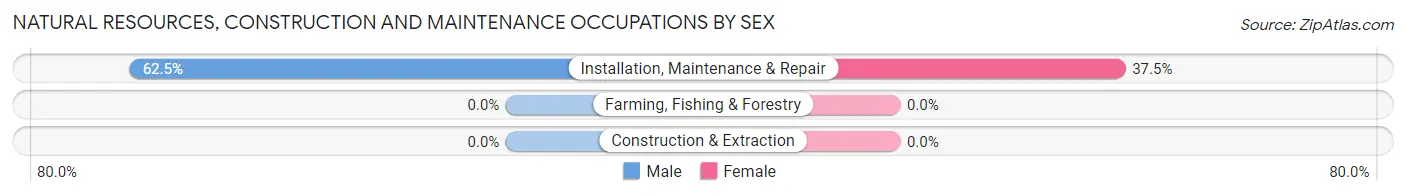
| Occupation | Male | Female |
| Farming, Fishing & Forestry | 0 (0.0%) | 0 (0.0%) |
| Construction & Extraction | 0 (0.0%) | 0 (0.0%) |
| Installation, Maintenance & Repair | 40 (62.5%) | 24 (37.5%) |
| Total (Category) | 40 (62.5%) | 24 (37.5%) |
| Total (Overall) | 104 (43.0%) | 138 (57.0%) |
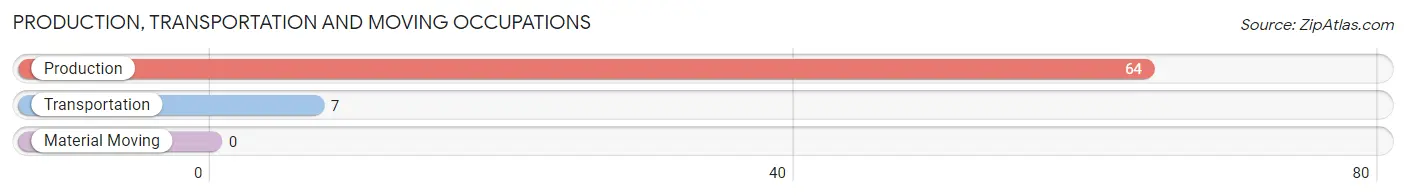
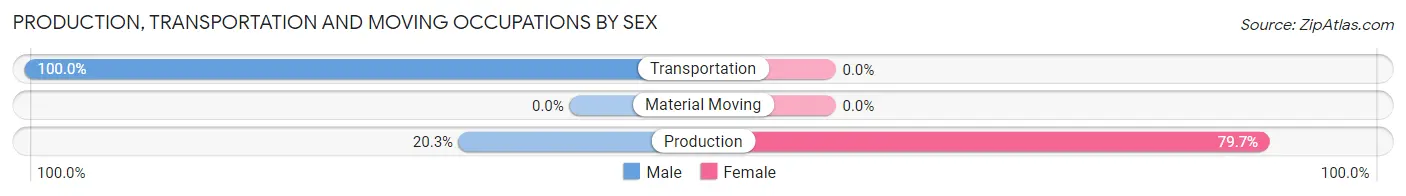
Production, Transportation and Moving Occupations
The most common Production, Transportation and Moving occupations in Pittsford are Production (64 | 26.5%), and Transportation (7 | 2.9%).
Production, Transportation and Moving Occupations by Sex
| Occupation | Male | Female |
| Production | 13 (20.3%) | 51 (79.7%) |
| Transportation | 7 (100.0%) | 0 (0.0%) |
| Material Moving | 0 (0.0%) | 0 (0.0%) |
| Total (Category) | 20 (28.2%) | 51 (71.8%) |
| Total (Overall) | 104 (43.0%) | 138 (57.0%) |
Employment Industries by Sex in Pittsford
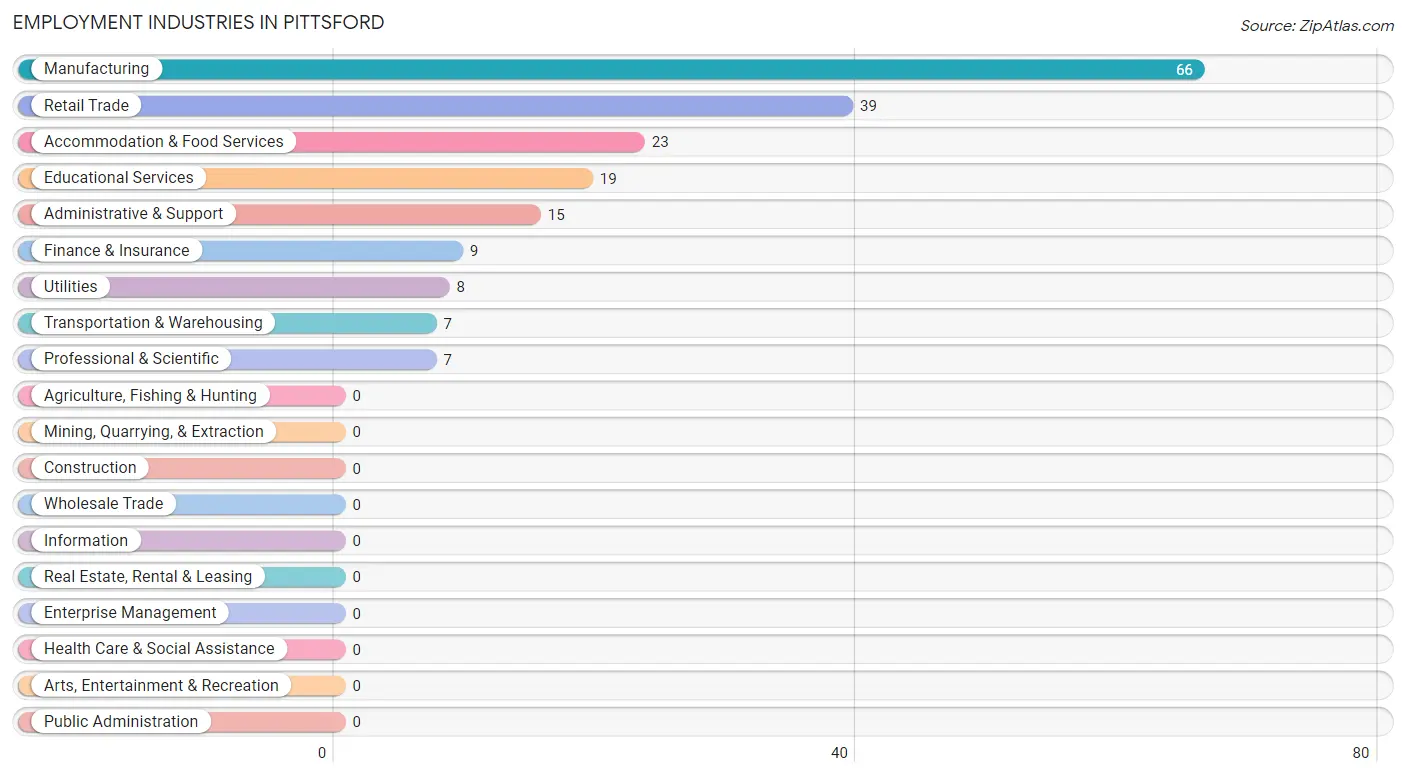
Employment Industries in Pittsford
The major employment industries in Pittsford include Manufacturing (66 | 27.3%), Retail Trade (39 | 16.1%), Accommodation & Food Services (23 | 9.5%), Educational Services (19 | 7.9%), and Administrative & Support (15 | 6.2%).
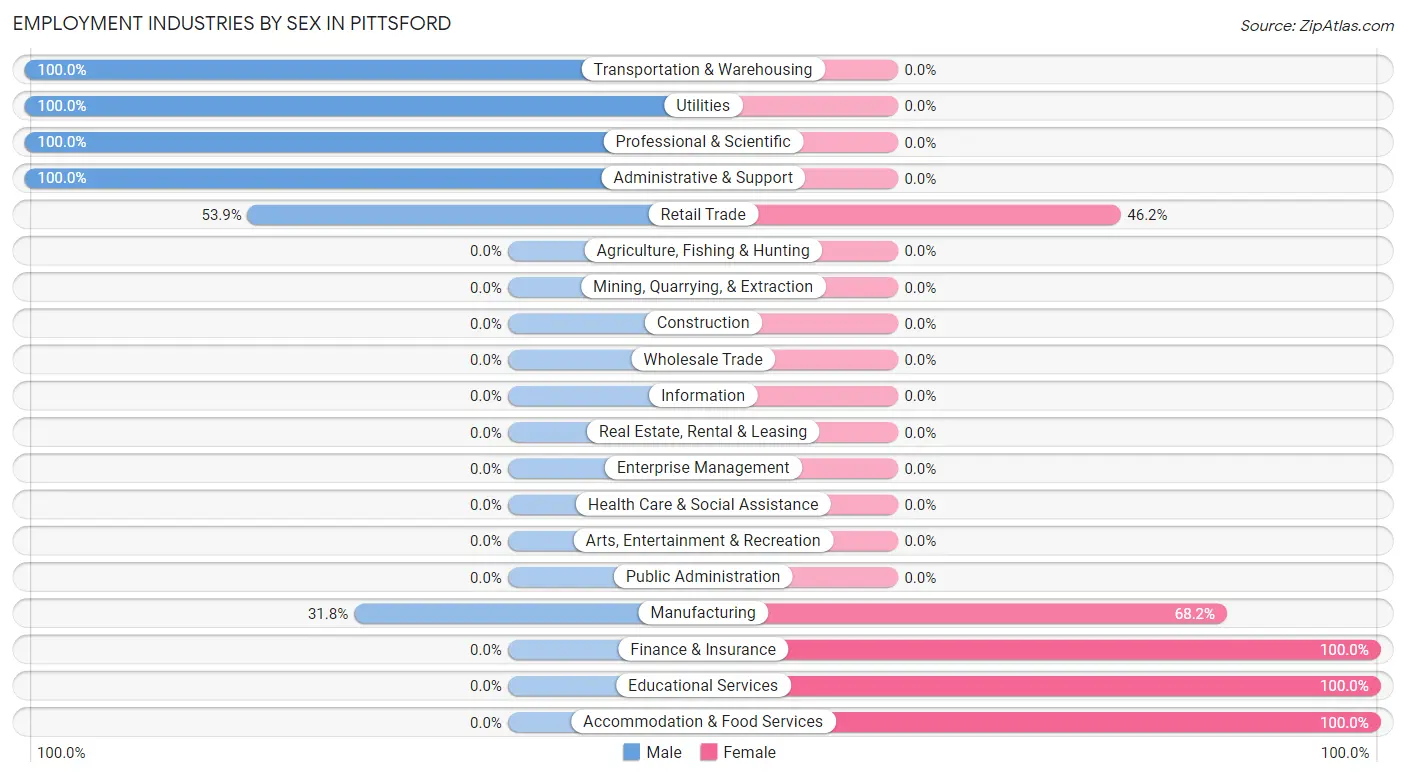
Employment Industries by Sex in Pittsford
The Pittsford industries that see more men than women are Transportation & Warehousing (100.0%), Utilities (100.0%), and Professional & Scientific (100.0%), whereas the industries that tend to have a higher number of women are Finance & Insurance (100.0%), Educational Services (100.0%), and Accommodation & Food Services (100.0%).
| Industry | Male | Female |
| Agriculture, Fishing & Hunting | 0 (0.0%) | 0 (0.0%) |
| Mining, Quarrying, & Extraction | 0 (0.0%) | 0 (0.0%) |
| Construction | 0 (0.0%) | 0 (0.0%) |
| Manufacturing | 21 (31.8%) | 45 (68.2%) |
| Wholesale Trade | 0 (0.0%) | 0 (0.0%) |
| Retail Trade | 21 (53.8%) | 18 (46.2%) |
| Transportation & Warehousing | 7 (100.0%) | 0 (0.0%) |
| Utilities | 8 (100.0%) | 0 (0.0%) |
| Information | 0 (0.0%) | 0 (0.0%) |
| Finance & Insurance | 0 (0.0%) | 9 (100.0%) |
| Real Estate, Rental & Leasing | 0 (0.0%) | 0 (0.0%) |
| Professional & Scientific | 7 (100.0%) | 0 (0.0%) |
| Enterprise Management | 0 (0.0%) | 0 (0.0%) |
| Administrative & Support | 15 (100.0%) | 0 (0.0%) |
| Educational Services | 0 (0.0%) | 19 (100.0%) |
| Health Care & Social Assistance | 0 (0.0%) | 0 (0.0%) |
| Arts, Entertainment & Recreation | 0 (0.0%) | 0 (0.0%) |
| Accommodation & Food Services | 0 (0.0%) | 23 (100.0%) |
| Public Administration | 0 (0.0%) | 0 (0.0%) |
| Total | 104 (43.0%) | 138 (57.0%) |
Education in Pittsford
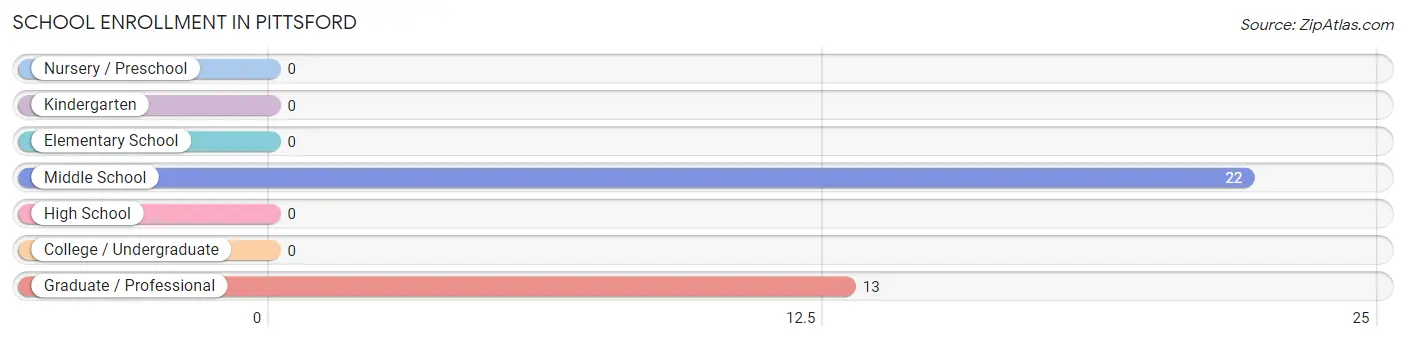
School Enrollment in Pittsford
The most common levels of schooling among the 35 students in Pittsford are middle school (22 | 62.9%), and graduate / professional (13 | 37.1%).
| School Level | # Students | % Students |
| Nursery / Preschool | 0 | 0.0% |
| Kindergarten | 0 | 0.0% |
| Elementary School | 0 | 0.0% |
| Middle School | 22 | 62.9% |
| High School | 0 | 0.0% |
| College / Undergraduate | 0 | 0.0% |
| Graduate / Professional | 13 | 37.1% |
| Total | 35 | 100.0% |
School Enrollment by Age by Funding Source in Pittsford
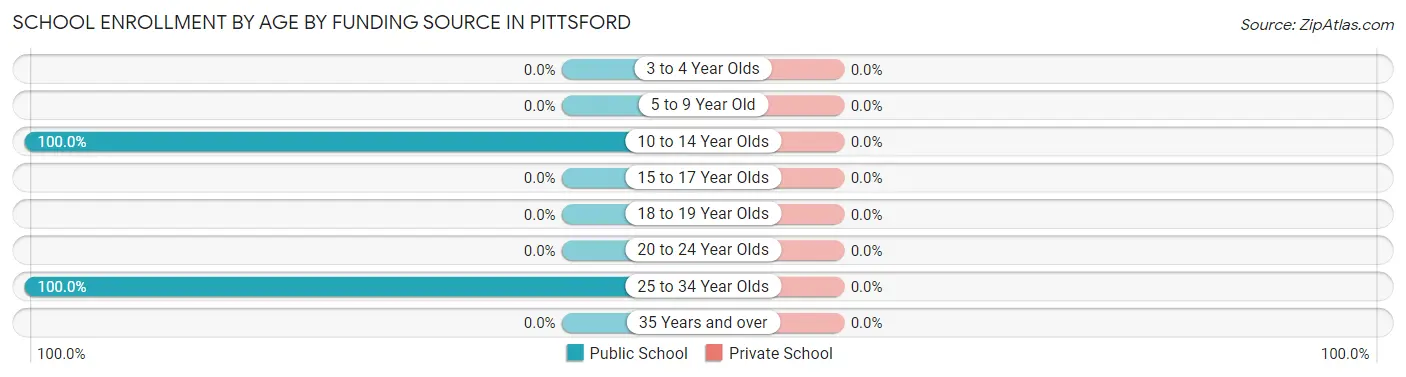
| Age Bracket | Public School | Private School |
| 3 to 4 Year Olds | 0 (0.0%) | 0 (0.0%) |
| 5 to 9 Year Old | 0 (0.0%) | 0 (0.0%) |
| 10 to 14 Year Olds | 22 (100.0%) | 0 (0.0%) |
| 15 to 17 Year Olds | 0 (0.0%) | 0 (0.0%) |
| 18 to 19 Year Olds | 0 (0.0%) | 0 (0.0%) |
| 20 to 24 Year Olds | 0 (0.0%) | 0 (0.0%) |
| 25 to 34 Year Olds | 13 (100.0%) | 0 (0.0%) |
| 35 Years and over | 0 (0.0%) | 0 (0.0%) |
| Total | 35 (100.0%) | 0 (0.0%) |
Educational Attainment by Field of Study in Pittsford
Psychology (42 | 24.6%), business (33 | 19.3%), education (30 | 17.5%), engineering (19 | 11.1%), and arts & humanities (15 | 8.8%) are the most common fields of study among 171 individuals in Pittsford who have obtained a bachelor's degree or higher.
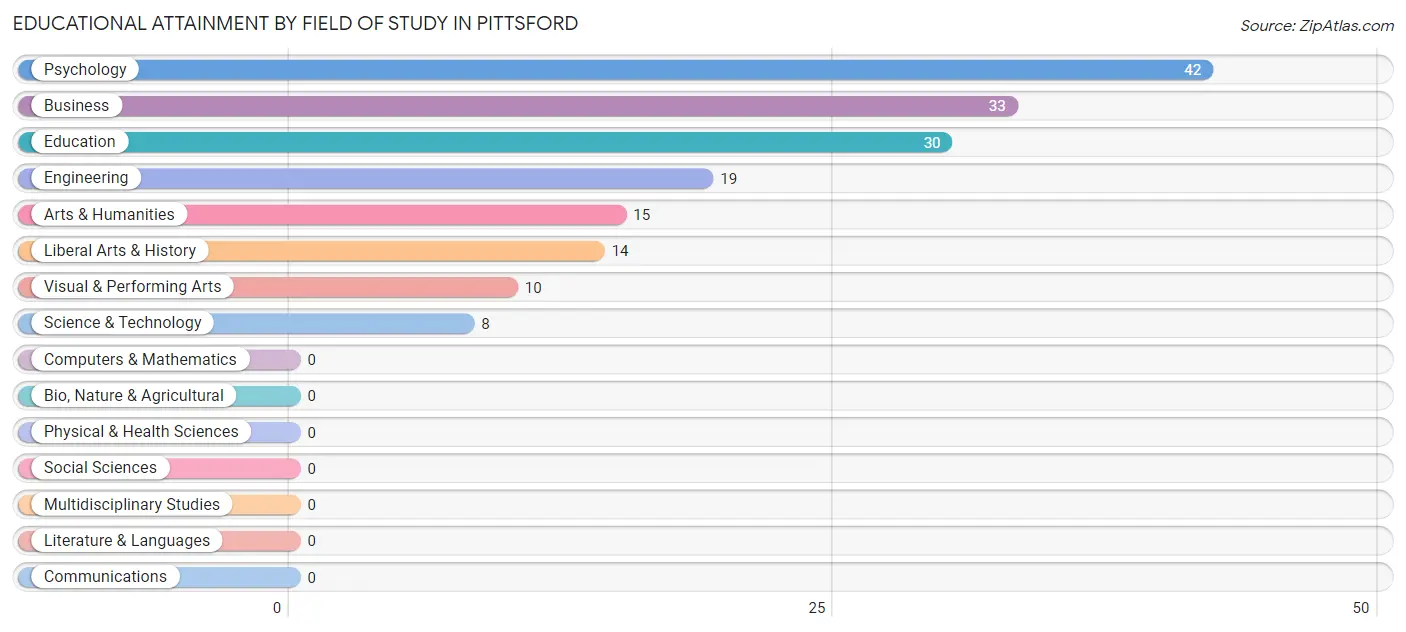
| Field of Study | # Graduates | % Graduates |
| Computers & Mathematics | 0 | 0.0% |
| Bio, Nature & Agricultural | 0 | 0.0% |
| Physical & Health Sciences | 0 | 0.0% |
| Psychology | 42 | 24.6% |
| Social Sciences | 0 | 0.0% |
| Engineering | 19 | 11.1% |
| Multidisciplinary Studies | 0 | 0.0% |
| Science & Technology | 8 | 4.7% |
| Business | 33 | 19.3% |
| Education | 30 | 17.5% |
| Literature & Languages | 0 | 0.0% |
| Liberal Arts & History | 14 | 8.2% |
| Visual & Performing Arts | 10 | 5.9% |
| Communications | 0 | 0.0% |
| Arts & Humanities | 15 | 8.8% |
| Total | 171 | 100.0% |
Transportation & Commute in Pittsford
Vehicle Availability by Sex in Pittsford
The most prevalent vehicle ownership categories in Pittsford are males with 2 vehicles (75, accounting for 82.4%) and females with 2 vehicles (70, making up 54.3%).
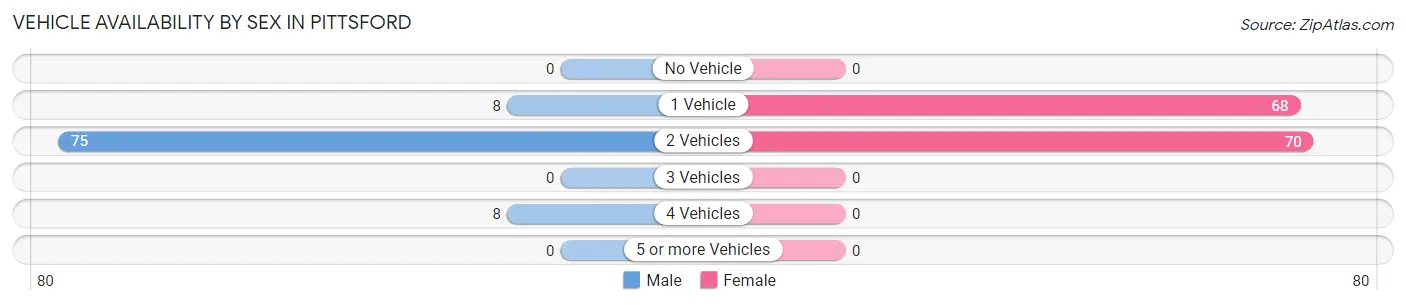
| Vehicles Available | Male | Female |
| No Vehicle | 0 (0.0%) | 0 (0.0%) |
| 1 Vehicle | 8 (8.8%) | 68 (49.3%) |
| 2 Vehicles | 75 (82.4%) | 70 (50.7%) |
| 3 Vehicles | 0 (0.0%) | 0 (0.0%) |
| 4 Vehicles | 8 (8.8%) | 0 (0.0%) |
| 5 or more Vehicles | 0 (0.0%) | 0 (0.0%) |
| Total | 91 (100.0%) | 138 (100.0%) |
Commute Time in Pittsford
The most frequently occuring commute durations in Pittsford are 5 to 9 minutes (41 commuters, 22.8%), 20 to 24 minutes (36 commuters, 20.0%), and 15 to 19 minutes (30 commuters, 16.7%).
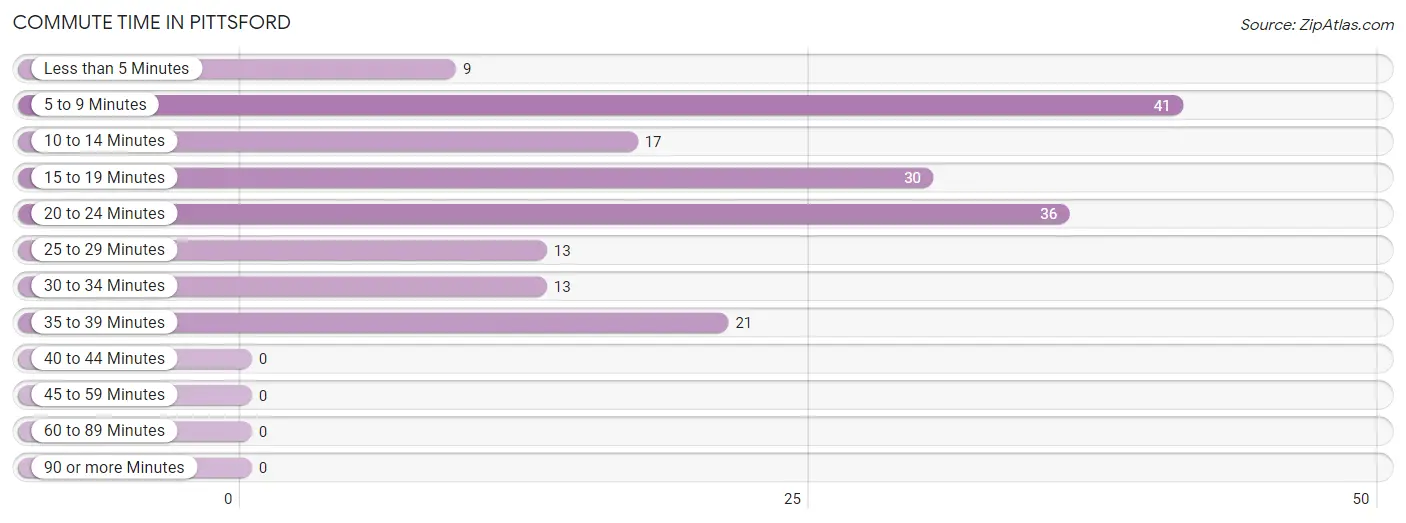
| Commute Time | # Commuters | % Commuters |
| Less than 5 Minutes | 9 | 5.0% |
| 5 to 9 Minutes | 41 | 22.8% |
| 10 to 14 Minutes | 17 | 9.4% |
| 15 to 19 Minutes | 30 | 16.7% |
| 20 to 24 Minutes | 36 | 20.0% |
| 25 to 29 Minutes | 13 | 7.2% |
| 30 to 34 Minutes | 13 | 7.2% |
| 35 to 39 Minutes | 21 | 11.7% |
| 40 to 44 Minutes | 0 | 0.0% |
| 45 to 59 Minutes | 0 | 0.0% |
| 60 to 89 Minutes | 0 | 0.0% |
| 90 or more Minutes | 0 | 0.0% |
Commute Time by Sex in Pittsford
The most common commute times in Pittsford are 5 to 9 minutes (29 commuters, 43.9%) for males and 20 to 24 minutes (36 commuters, 31.6%) for females.
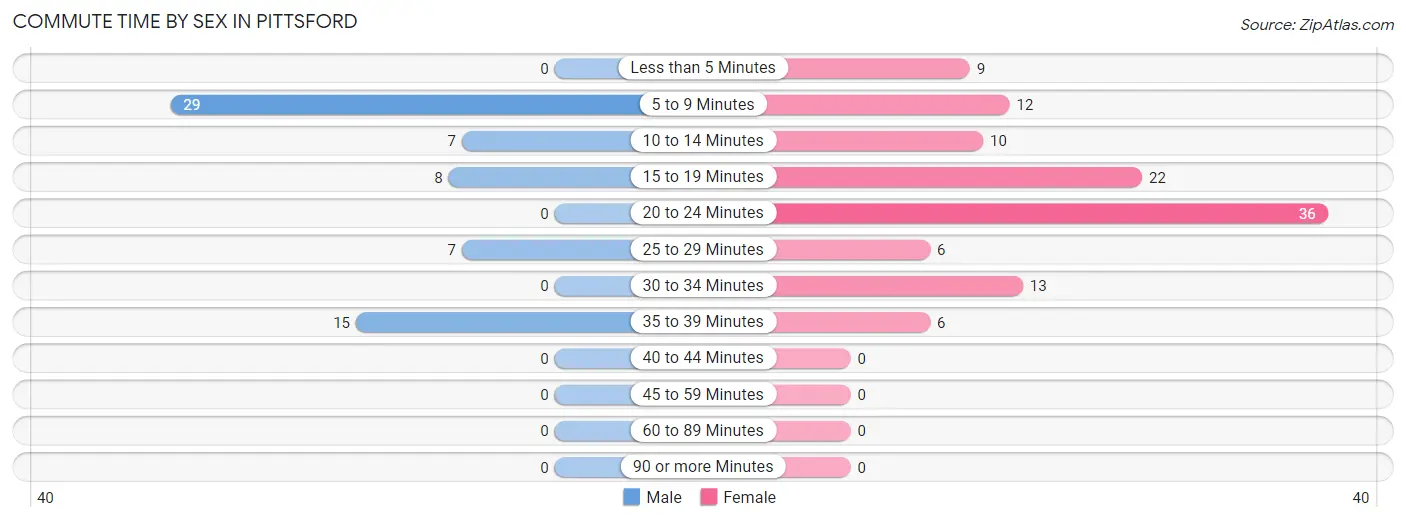
| Commute Time | Male | Female |
| Less than 5 Minutes | 0 (0.0%) | 9 (7.9%) |
| 5 to 9 Minutes | 29 (43.9%) | 12 (10.5%) |
| 10 to 14 Minutes | 7 (10.6%) | 10 (8.8%) |
| 15 to 19 Minutes | 8 (12.1%) | 22 (19.3%) |
| 20 to 24 Minutes | 0 (0.0%) | 36 (31.6%) |
| 25 to 29 Minutes | 7 (10.6%) | 6 (5.3%) |
| 30 to 34 Minutes | 0 (0.0%) | 13 (11.4%) |
| 35 to 39 Minutes | 15 (22.7%) | 6 (5.3%) |
| 40 to 44 Minutes | 0 (0.0%) | 0 (0.0%) |
| 45 to 59 Minutes | 0 (0.0%) | 0 (0.0%) |
| 60 to 89 Minutes | 0 (0.0%) | 0 (0.0%) |
| 90 or more Minutes | 0 (0.0%) | 0 (0.0%) |
Time of Departure to Work by Sex in Pittsford
The most frequent times of departure to work in Pittsford are 12:00 PM to 3:59 PM (21, 31.8%) for males and 7:00 AM to 7:29 AM (42, 36.8%) for females.
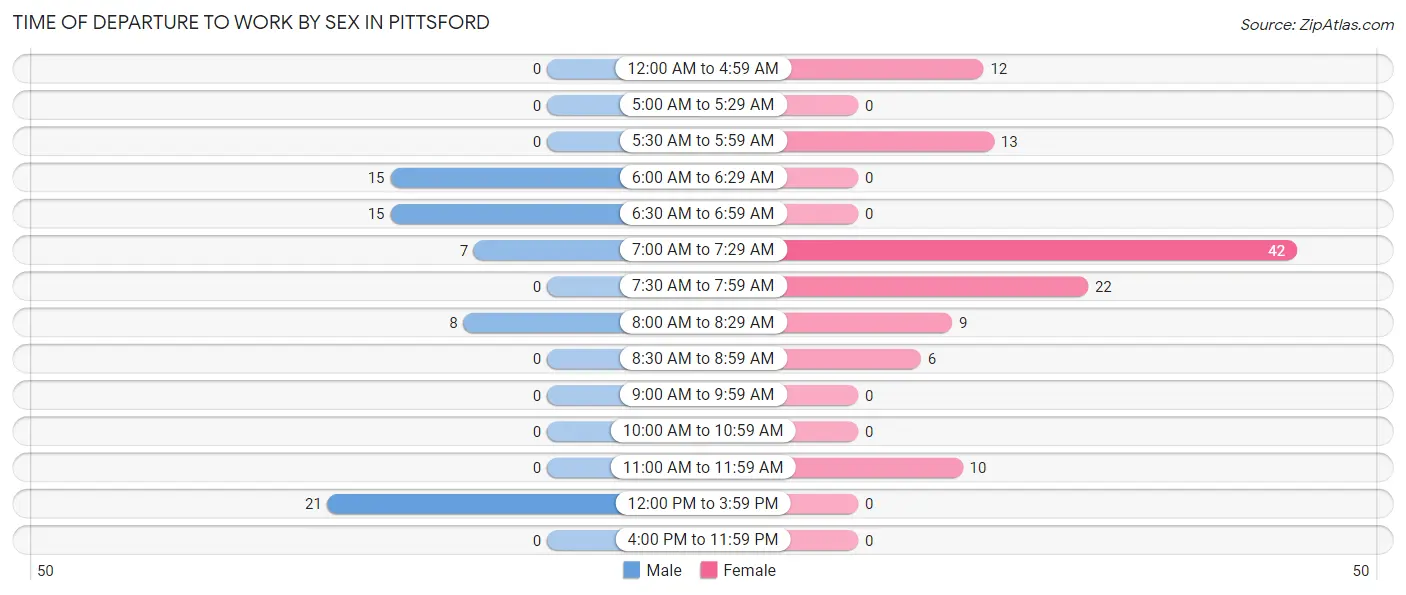
| Time of Departure | Male | Female |
| 12:00 AM to 4:59 AM | 0 (0.0%) | 12 (10.5%) |
| 5:00 AM to 5:29 AM | 0 (0.0%) | 0 (0.0%) |
| 5:30 AM to 5:59 AM | 0 (0.0%) | 13 (11.4%) |
| 6:00 AM to 6:29 AM | 15 (22.7%) | 0 (0.0%) |
| 6:30 AM to 6:59 AM | 15 (22.7%) | 0 (0.0%) |
| 7:00 AM to 7:29 AM | 7 (10.6%) | 42 (36.8%) |
| 7:30 AM to 7:59 AM | 0 (0.0%) | 22 (19.3%) |
| 8:00 AM to 8:29 AM | 8 (12.1%) | 9 (7.9%) |
| 8:30 AM to 8:59 AM | 0 (0.0%) | 6 (5.3%) |
| 9:00 AM to 9:59 AM | 0 (0.0%) | 0 (0.0%) |
| 10:00 AM to 10:59 AM | 0 (0.0%) | 0 (0.0%) |
| 11:00 AM to 11:59 AM | 0 (0.0%) | 10 (8.8%) |
| 12:00 PM to 3:59 PM | 21 (31.8%) | 0 (0.0%) |
| 4:00 PM to 11:59 PM | 0 (0.0%) | 0 (0.0%) |
| Total | 66 (100.0%) | 114 (100.0%) |
Housing Occupancy in Pittsford
Occupancy by Ownership in Pittsford
Of the total 355 dwellings in Pittsford, owner-occupied units account for 313 (88.2%), while renter-occupied units make up 42 (11.8%).
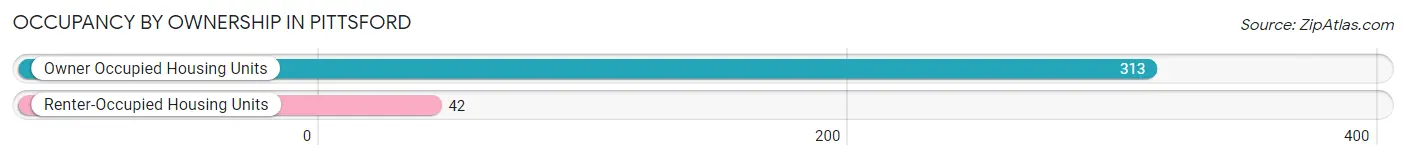
| Occupancy | # Housing Units | % Housing Units |
| Owner Occupied Housing Units | 313 | 88.2% |
| Renter-Occupied Housing Units | 42 | 11.8% |
| Total Occupied Housing Units | 355 | 100.0% |
Occupancy by Household Size in Pittsford
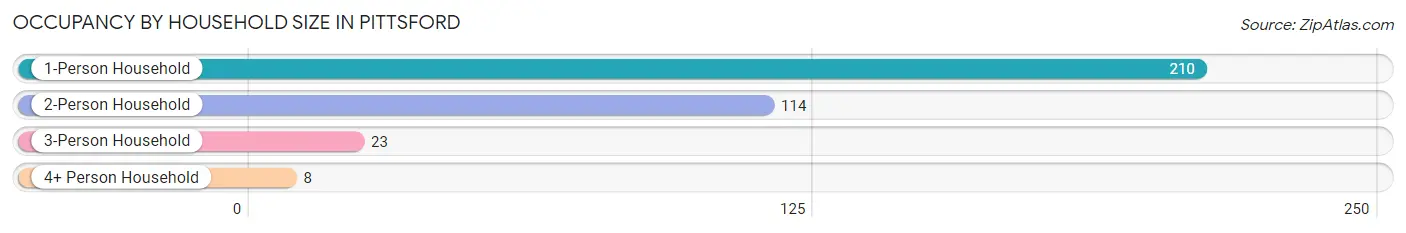
| Household Size | # Housing Units | % Housing Units |
| 1-Person Household | 210 | 59.2% |
| 2-Person Household | 114 | 32.1% |
| 3-Person Household | 23 | 6.5% |
| 4+ Person Household | 8 | 2.2% |
| Total Housing Units | 355 | 100.0% |
Occupancy by Ownership by Household Size in Pittsford
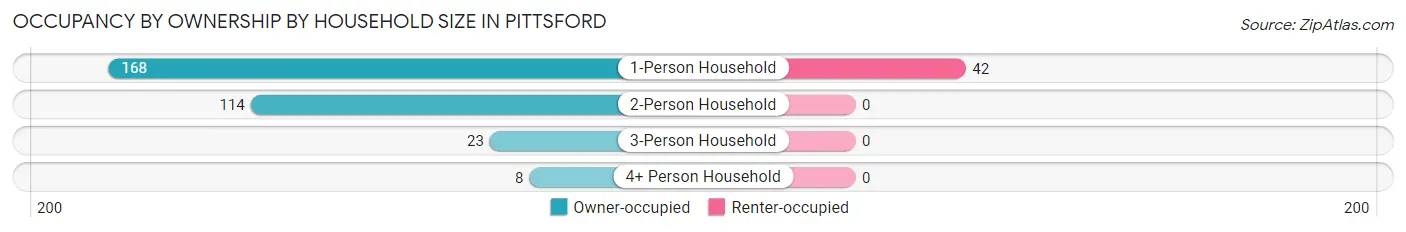
| Household Size | Owner-occupied | Renter-occupied |
| 1-Person Household | 168 (80.0%) | 42 (20.0%) |
| 2-Person Household | 114 (100.0%) | 0 (0.0%) |
| 3-Person Household | 23 (100.0%) | 0 (0.0%) |
| 4+ Person Household | 8 (100.0%) | 0 (0.0%) |
| Total Housing Units | 313 (88.2%) | 42 (11.8%) |
Occupancy by Educational Attainment in Pittsford
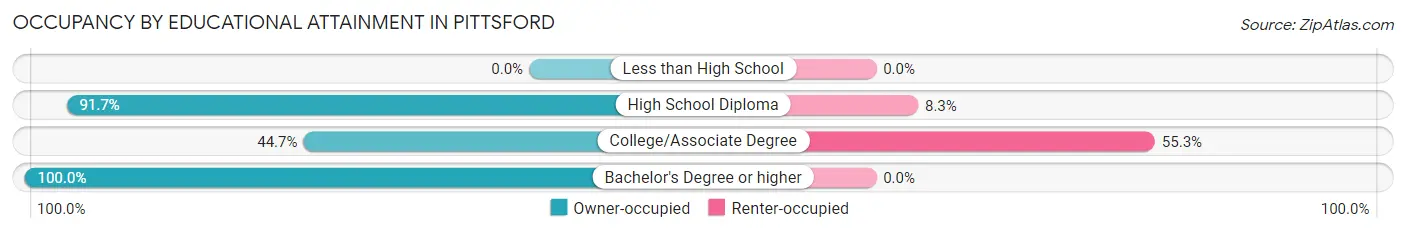
| Household Size | Owner-occupied | Renter-occupied |
| Less than High School | 0 (0.0%) | 0 (0.0%) |
| High School Diploma | 232 (91.7%) | 21 (8.3%) |
| College/Associate Degree | 17 (44.7%) | 21 (55.3%) |
| Bachelor's Degree or higher | 64 (100.0%) | 0 (0.0%) |
Occupancy by Age of Householder in Pittsford
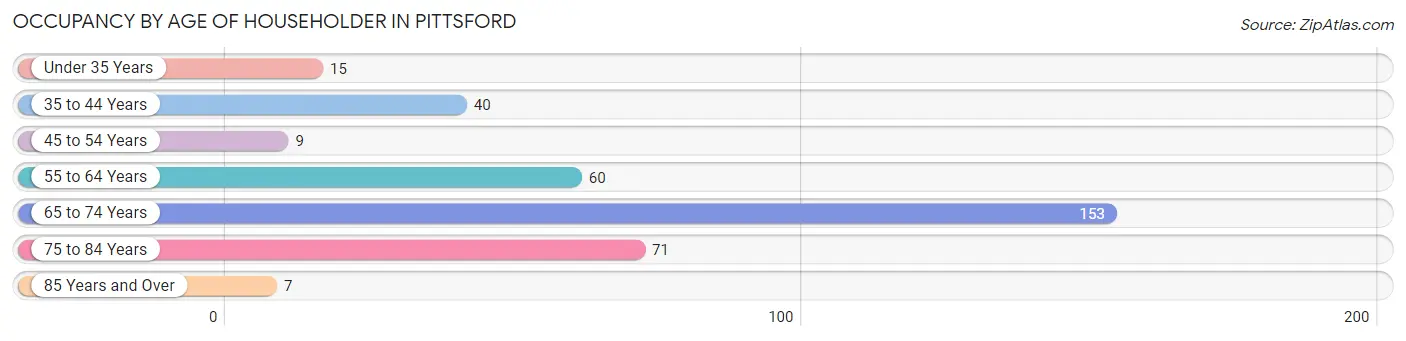
| Age Bracket | # Households | % Households |
| Under 35 Years | 15 | 4.2% |
| 35 to 44 Years | 40 | 11.3% |
| 45 to 54 Years | 9 | 2.5% |
| 55 to 64 Years | 60 | 16.9% |
| 65 to 74 Years | 153 | 43.1% |
| 75 to 84 Years | 71 | 20.0% |
| 85 Years and Over | 7 | 2.0% |
| Total | 355 | 100.0% |
Housing Finances in Pittsford
Median Income by Occupancy in Pittsford
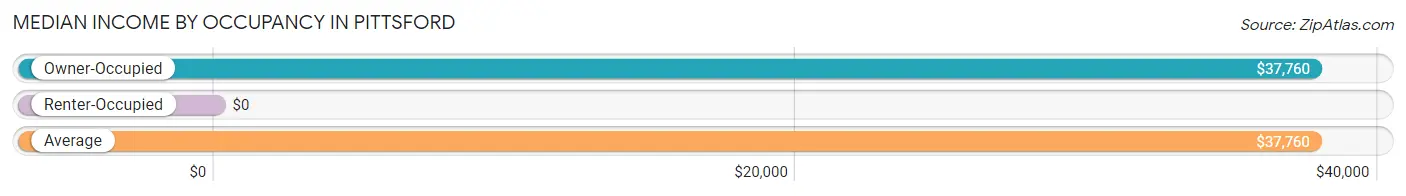
| Occupancy Type | # Households | Median Income |
| Owner-Occupied | 313 (88.2%) | $37,760 |
| Renter-Occupied | 42 (11.8%) | $0 |
| Average | 355 (100.0%) | $37,760 |
Occupancy by Householder Income Bracket in Pittsford
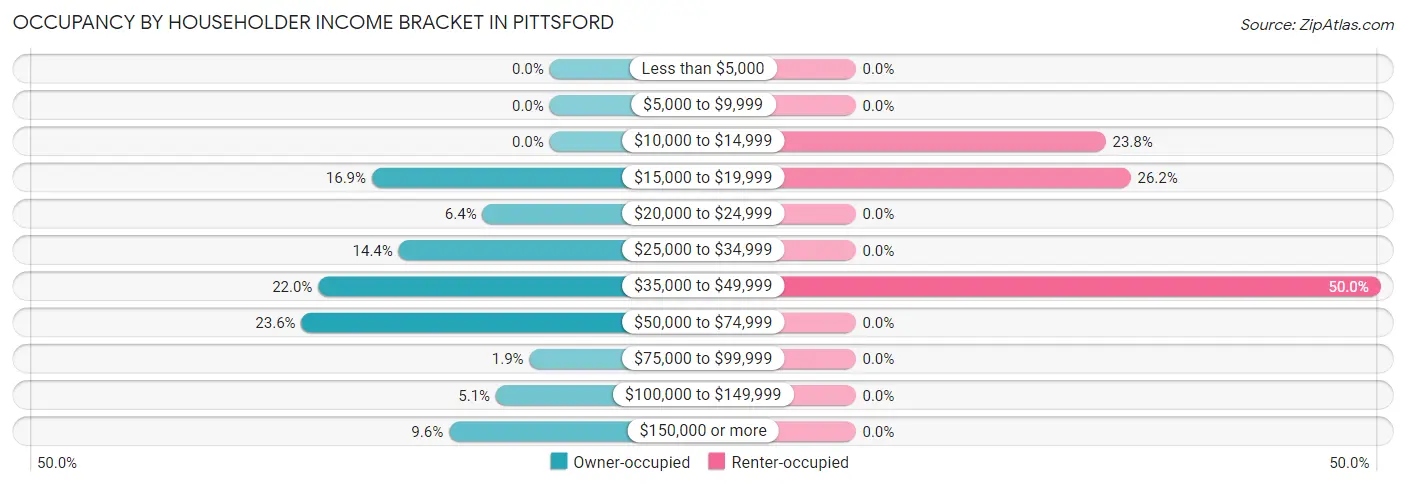
| Income Bracket | Owner-occupied | Renter-occupied |
| Less than $5,000 | 0 (0.0%) | 0 (0.0%) |
| $5,000 to $9,999 | 0 (0.0%) | 0 (0.0%) |
| $10,000 to $14,999 | 0 (0.0%) | 10 (23.8%) |
| $15,000 to $19,999 | 53 (16.9%) | 11 (26.2%) |
| $20,000 to $24,999 | 20 (6.4%) | 0 (0.0%) |
| $25,000 to $34,999 | 45 (14.4%) | 0 (0.0%) |
| $35,000 to $49,999 | 69 (22.0%) | 21 (50.0%) |
| $50,000 to $74,999 | 74 (23.6%) | 0 (0.0%) |
| $75,000 to $99,999 | 6 (1.9%) | 0 (0.0%) |
| $100,000 to $149,999 | 16 (5.1%) | 0 (0.0%) |
| $150,000 or more | 30 (9.6%) | 0 (0.0%) |
| Total | 313 (100.0%) | 42 (100.0%) |
Monthly Housing Cost Tiers in Pittsford
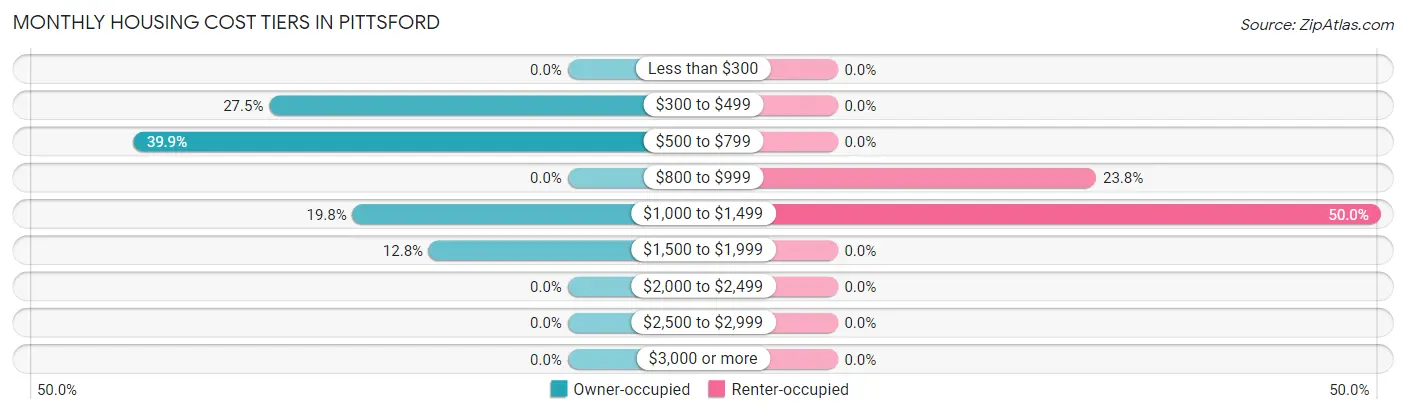
| Monthly Cost | Owner-occupied | Renter-occupied |
| Less than $300 | 0 (0.0%) | 0 (0.0%) |
| $300 to $499 | 86 (27.5%) | 0 (0.0%) |
| $500 to $799 | 125 (39.9%) | 0 (0.0%) |
| $800 to $999 | 0 (0.0%) | 10 (23.8%) |
| $1,000 to $1,499 | 62 (19.8%) | 21 (50.0%) |
| $1,500 to $1,999 | 40 (12.8%) | 0 (0.0%) |
| $2,000 to $2,499 | 0 (0.0%) | 0 (0.0%) |
| $2,500 to $2,999 | 0 (0.0%) | 0 (0.0%) |
| $3,000 or more | 0 (0.0%) | 0 (0.0%) |
| Total | 313 (100.0%) | 42 (100.0%) |
Physical Housing Characteristics in Pittsford
Housing Structures in Pittsford
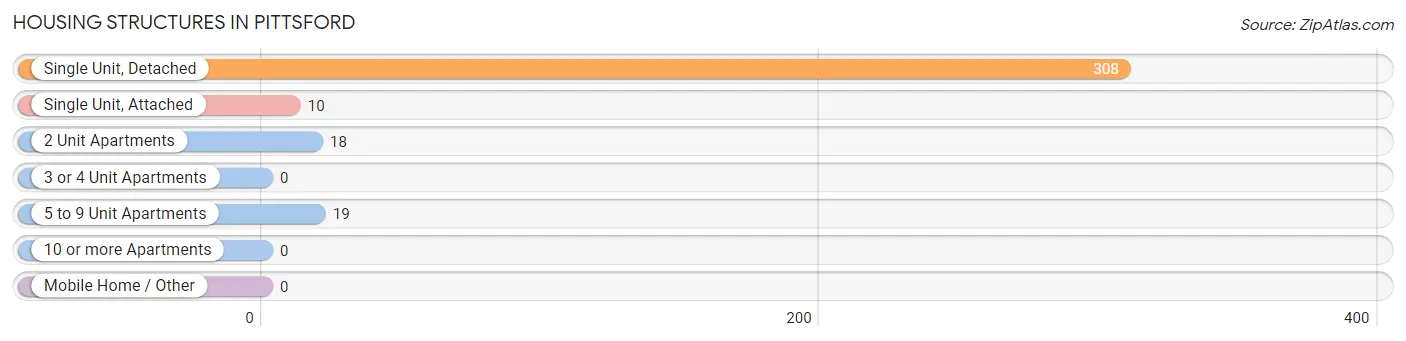
| Structure Type | # Housing Units | % Housing Units |
| Single Unit, Detached | 308 | 86.8% |
| Single Unit, Attached | 10 | 2.8% |
| 2 Unit Apartments | 18 | 5.1% |
| 3 or 4 Unit Apartments | 0 | 0.0% |
| 5 to 9 Unit Apartments | 19 | 5.3% |
| 10 or more Apartments | 0 | 0.0% |
| Mobile Home / Other | 0 | 0.0% |
| Total | 355 | 100.0% |
Housing Structures by Occupancy in Pittsford
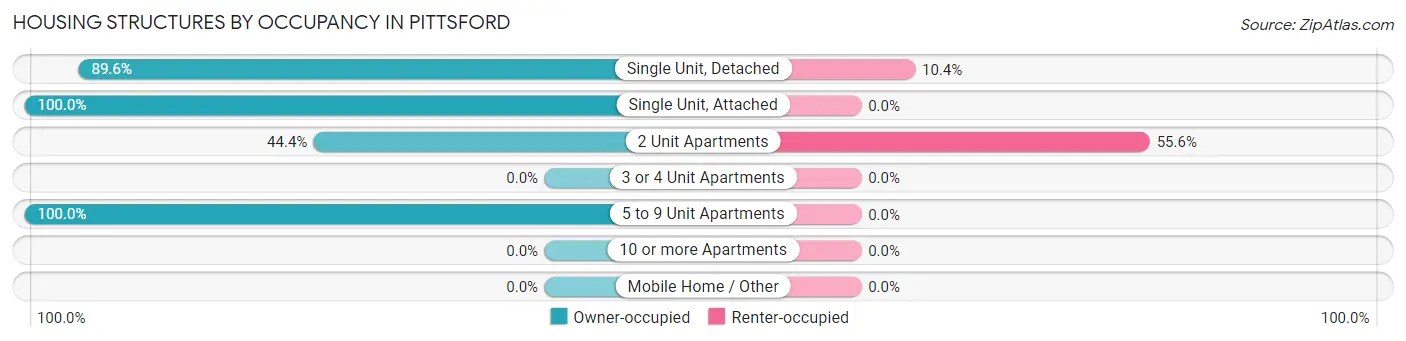
| Structure Type | Owner-occupied | Renter-occupied |
| Single Unit, Detached | 276 (89.6%) | 32 (10.4%) |
| Single Unit, Attached | 10 (100.0%) | 0 (0.0%) |
| 2 Unit Apartments | 8 (44.4%) | 10 (55.6%) |
| 3 or 4 Unit Apartments | 0 (0.0%) | 0 (0.0%) |
| 5 to 9 Unit Apartments | 19 (100.0%) | 0 (0.0%) |
| 10 or more Apartments | 0 (0.0%) | 0 (0.0%) |
| Mobile Home / Other | 0 (0.0%) | 0 (0.0%) |
| Total | 313 (88.2%) | 42 (11.8%) |
Housing Structures by Number of Rooms in Pittsford
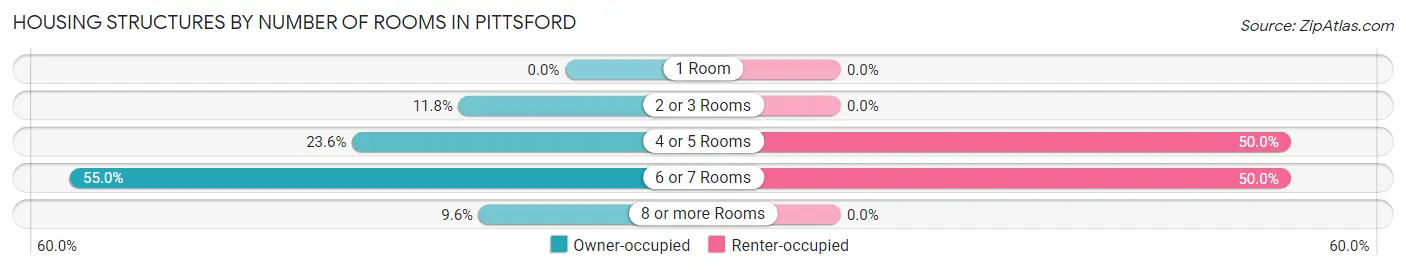
| Number of Rooms | Owner-occupied | Renter-occupied |
| 1 Room | 0 (0.0%) | 0 (0.0%) |
| 2 or 3 Rooms | 37 (11.8%) | 0 (0.0%) |
| 4 or 5 Rooms | 74 (23.6%) | 21 (50.0%) |
| 6 or 7 Rooms | 172 (54.9%) | 21 (50.0%) |
| 8 or more Rooms | 30 (9.6%) | 0 (0.0%) |
| Total | 313 (100.0%) | 42 (100.0%) |
Housing Structure by Heating Type in Pittsford
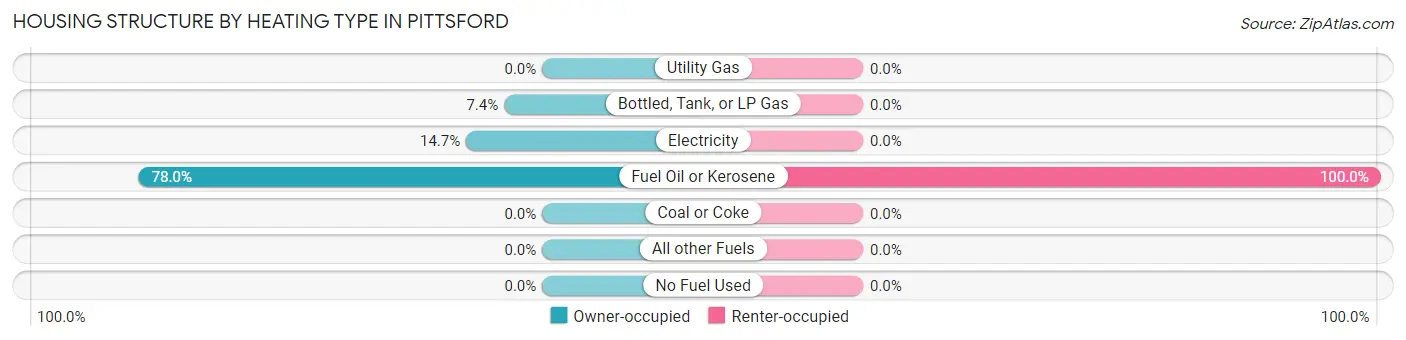
| Heating Type | Owner-occupied | Renter-occupied |
| Utility Gas | 0 (0.0%) | 0 (0.0%) |
| Bottled, Tank, or LP Gas | 23 (7.3%) | 0 (0.0%) |
| Electricity | 46 (14.7%) | 0 (0.0%) |
| Fuel Oil or Kerosene | 244 (78.0%) | 42 (100.0%) |
| Coal or Coke | 0 (0.0%) | 0 (0.0%) |
| All other Fuels | 0 (0.0%) | 0 (0.0%) |
| No Fuel Used | 0 (0.0%) | 0 (0.0%) |
| Total | 313 (100.0%) | 42 (100.0%) |
Household Vehicle Usage in Pittsford
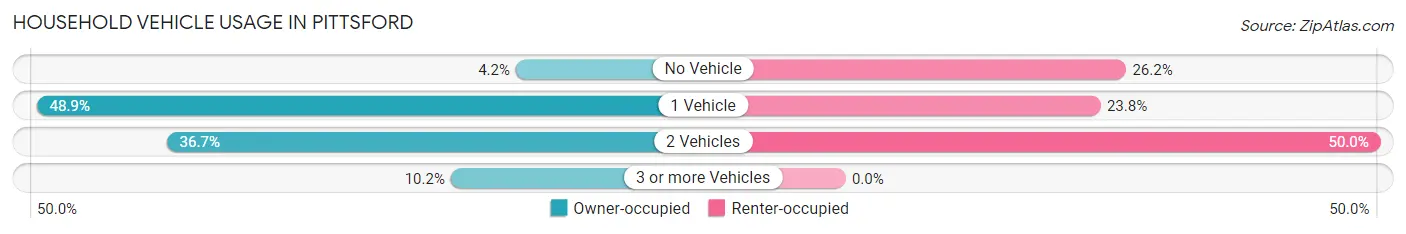
| Vehicles per Household | Owner-occupied | Renter-occupied |
| No Vehicle | 13 (4.2%) | 11 (26.2%) |
| 1 Vehicle | 153 (48.9%) | 10 (23.8%) |
| 2 Vehicles | 115 (36.7%) | 21 (50.0%) |
| 3 or more Vehicles | 32 (10.2%) | 0 (0.0%) |
| Total | 313 (100.0%) | 42 (100.0%) |
Real Estate & Mortgages in Pittsford
Real Estate and Mortgage Overview in Pittsford
| Characteristic | Without Mortgage | With Mortgage |
| Housing Units | 218 | 95 |
| Median Property Value | $133,700 | $176,600 |
| Median Household Income | $36,111 | $23 |
| Monthly Housing Costs | $543 | $0 |
| Real Estate Taxes | $1,911 | $0 |
Property Value by Mortgage Status in Pittsford
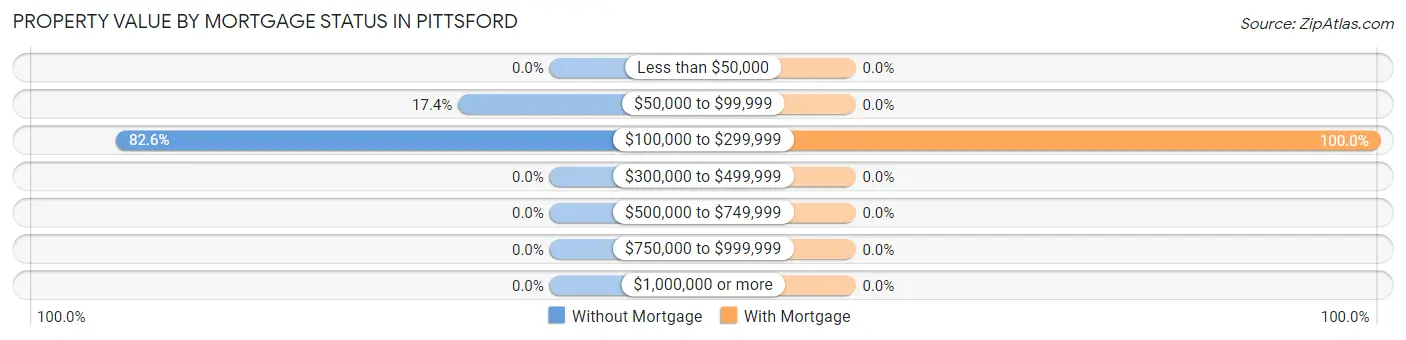
| Property Value | Without Mortgage | With Mortgage |
| Less than $50,000 | 0 (0.0%) | 0 (0.0%) |
| $50,000 to $99,999 | 38 (17.4%) | 0 (0.0%) |
| $100,000 to $299,999 | 180 (82.6%) | 95 (100.0%) |
| $300,000 to $499,999 | 0 (0.0%) | 0 (0.0%) |
| $500,000 to $749,999 | 0 (0.0%) | 0 (0.0%) |
| $750,000 to $999,999 | 0 (0.0%) | 0 (0.0%) |
| $1,000,000 or more | 0 (0.0%) | 0 (0.0%) |
| Total | 218 (100.0%) | 95 (100.0%) |
Household Income by Mortgage Status in Pittsford
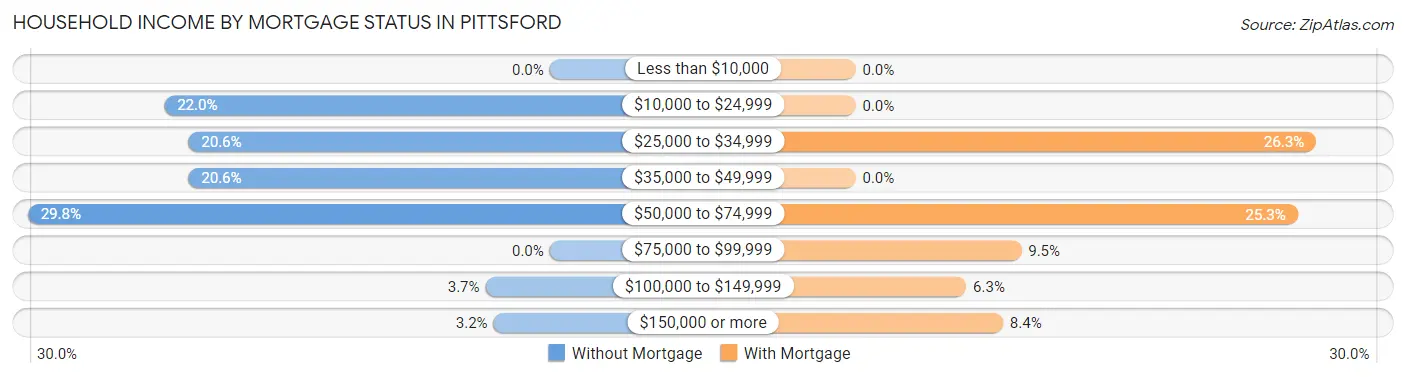
| Household Income | Without Mortgage | With Mortgage |
| Less than $10,000 | 0 (0.0%) | 0 (0.0%) |
| $10,000 to $24,999 | 48 (22.0%) | 0 (0.0%) |
| $25,000 to $34,999 | 45 (20.6%) | 25 (26.3%) |
| $35,000 to $49,999 | 45 (20.6%) | 0 (0.0%) |
| $50,000 to $74,999 | 65 (29.8%) | 24 (25.3%) |
| $75,000 to $99,999 | 0 (0.0%) | 9 (9.5%) |
| $100,000 to $149,999 | 8 (3.7%) | 6 (6.3%) |
| $150,000 or more | 7 (3.2%) | 8 (8.4%) |
| Total | 218 (100.0%) | 95 (100.0%) |
Property Value to Household Income Ratio in Pittsford
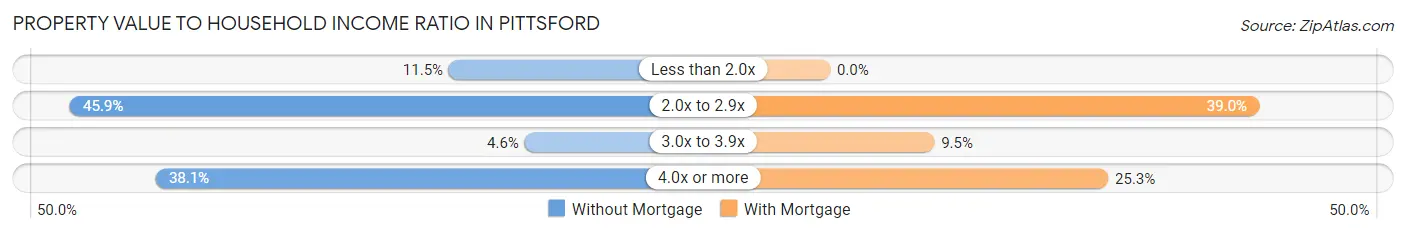
| Value-to-Income Ratio | Without Mortgage | With Mortgage |
| Less than 2.0x | 25 (11.5%) | 0 (0.0%) |
| 2.0x to 2.9x | 100 (45.9%) | 37 (39.0%) |
| 3.0x to 3.9x | 10 (4.6%) | 9 (9.5%) |
| 4.0x or more | 83 (38.1%) | 24 (25.3%) |
| Total | 218 (100.0%) | 95 (100.0%) |
Real Estate Taxes by Mortgage Status in Pittsford
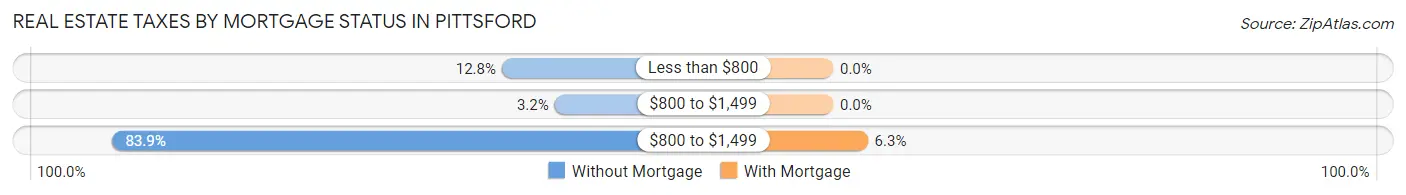
| Property Taxes | Without Mortgage | With Mortgage |
| Less than $800 | 28 (12.8%) | 0 (0.0%) |
| $800 to $1,499 | 7 (3.2%) | 0 (0.0%) |
| $800 to $1,499 | 183 (83.9%) | 6 (6.3%) |
| Total | 218 (100.0%) | 95 (100.0%) |
Health & Disability in Pittsford
Health Insurance Coverage by Age in Pittsford
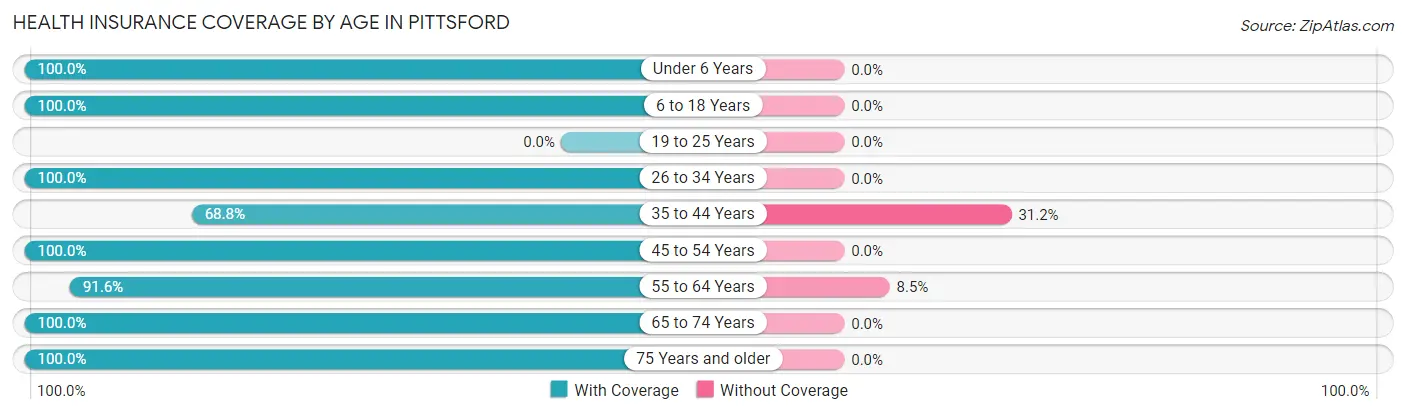
| Age Bracket | With Coverage | Without Coverage |
| Under 6 Years | 15 (100.0%) | 0 (0.0%) |
| 6 to 18 Years | 22 (100.0%) | 0 (0.0%) |
| 19 to 25 Years | 0 (0.0%) | 0 (0.0%) |
| 26 to 34 Years | 41 (100.0%) | 0 (0.0%) |
| 35 to 44 Years | 53 (68.8%) | 24 (31.2%) |
| 45 to 54 Years | 23 (100.0%) | 0 (0.0%) |
| 55 to 64 Years | 130 (91.5%) | 12 (8.5%) |
| 65 to 74 Years | 166 (100.0%) | 0 (0.0%) |
| 75 Years and older | 97 (100.0%) | 0 (0.0%) |
| Total | 547 (93.8%) | 36 (6.2%) |
Health Insurance Coverage by Citizenship Status in Pittsford
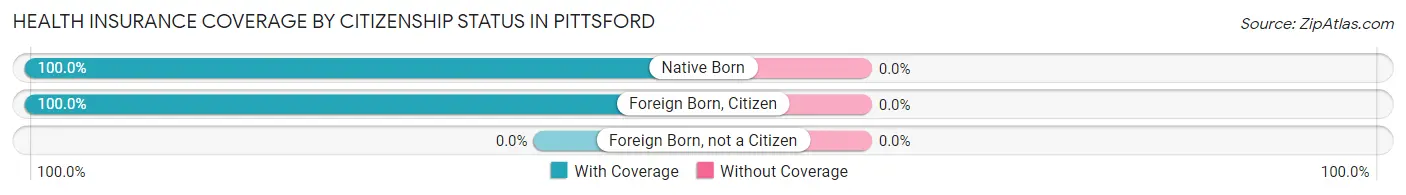
| Citizenship Status | With Coverage | Without Coverage |
| Native Born | 15 (100.0%) | 0 (0.0%) |
| Foreign Born, Citizen | 22 (100.0%) | 0 (0.0%) |
| Foreign Born, not a Citizen | 0 (0.0%) | 0 (0.0%) |
Health Insurance Coverage by Household Income in Pittsford
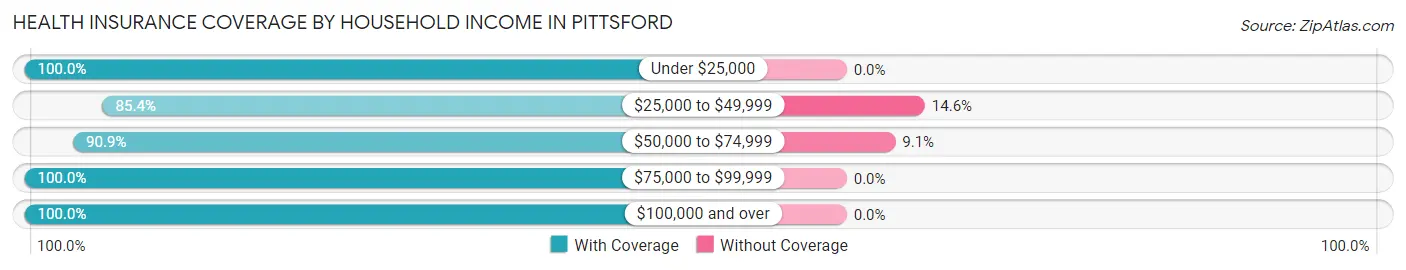
| Household Income | With Coverage | Without Coverage |
| Under $25,000 | 131 (100.0%) | 0 (0.0%) |
| $25,000 to $49,999 | 140 (85.4%) | 24 (14.6%) |
| $50,000 to $74,999 | 120 (90.9%) | 12 (9.1%) |
| $75,000 to $99,999 | 13 (100.0%) | 0 (0.0%) |
| $100,000 and over | 143 (100.0%) | 0 (0.0%) |
Public vs Private Health Insurance Coverage by Age in Pittsford
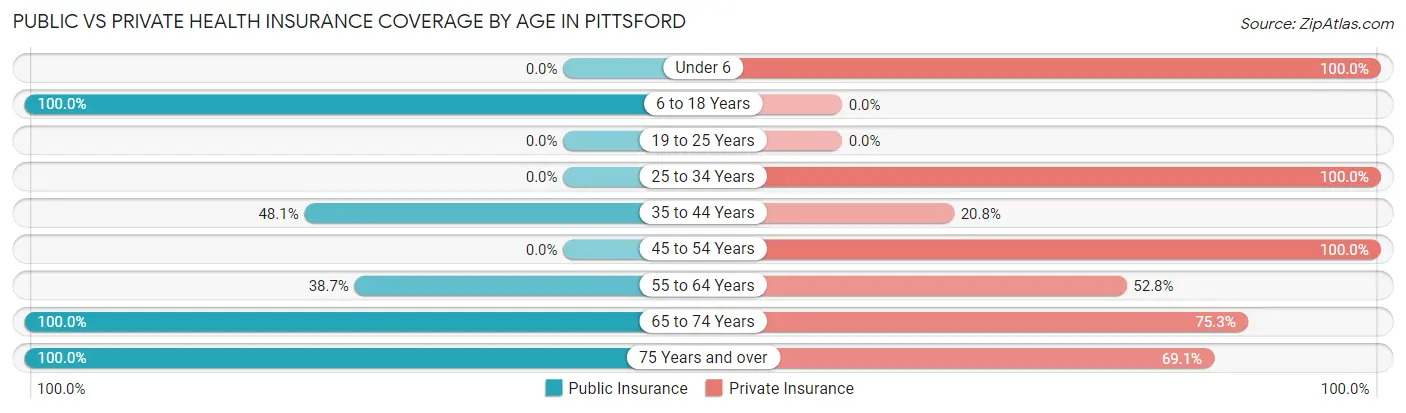
| Age Bracket | Public Insurance | Private Insurance |
| Under 6 | 0 (0.0%) | 15 (100.0%) |
| 6 to 18 Years | 22 (100.0%) | 0 (0.0%) |
| 19 to 25 Years | 0 (0.0%) | 0 (0.0%) |
| 25 to 34 Years | 0 (0.0%) | 41 (100.0%) |
| 35 to 44 Years | 37 (48.0%) | 16 (20.8%) |
| 45 to 54 Years | 0 (0.0%) | 23 (100.0%) |
| 55 to 64 Years | 55 (38.7%) | 75 (52.8%) |
| 65 to 74 Years | 166 (100.0%) | 125 (75.3%) |
| 75 Years and over | 97 (100.0%) | 67 (69.1%) |
| Total | 377 (64.7%) | 362 (62.1%) |
Disability Status by Sex by Age in Pittsford
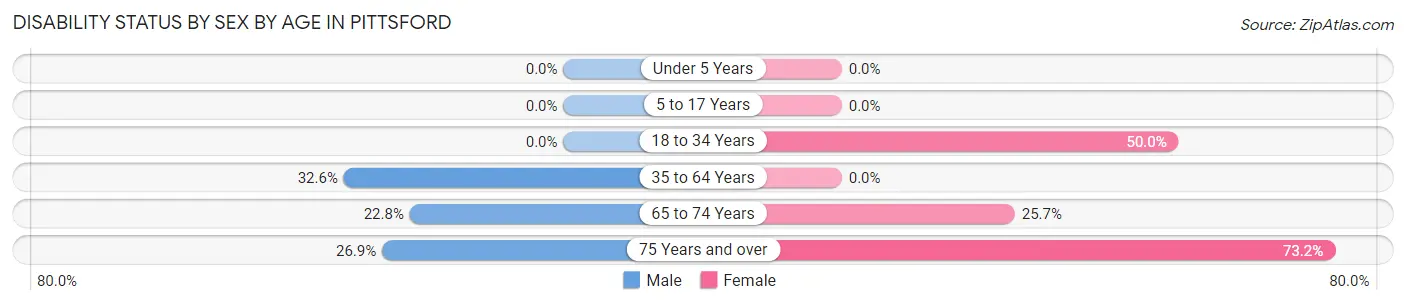
| Age Bracket | Male | Female |
| Under 5 Years | 0 (0.0%) | 0 (0.0%) |
| 5 to 17 Years | 0 (0.0%) | 0 (0.0%) |
| 18 to 34 Years | 0 (0.0%) | 13 (50.0%) |
| 35 to 64 Years | 45 (32.6%) | 0 (0.0%) |
| 65 to 74 Years | 13 (22.8%) | 28 (25.7%) |
| 75 Years and over | 7 (26.9%) | 52 (73.2%) |
Disability Class by Sex by Age in Pittsford
Disability Class: Hearing Difficulty
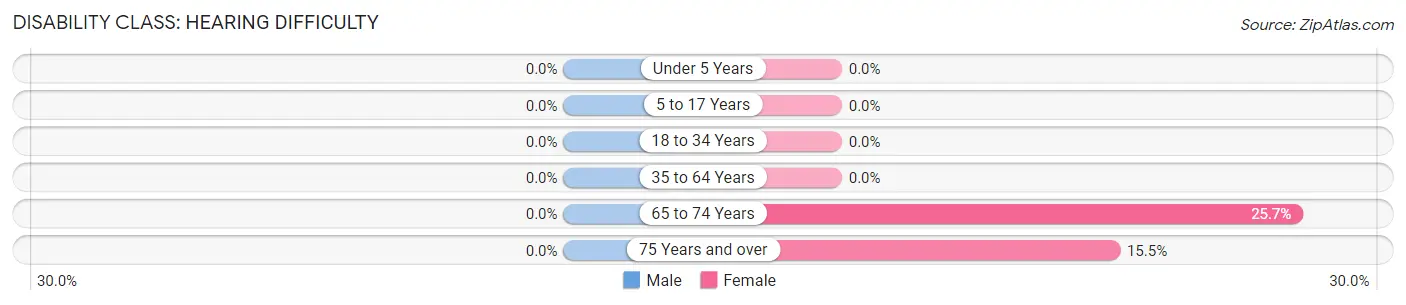
| Age Bracket | Male | Female |
| Under 5 Years | 0 (0.0%) | 0 (0.0%) |
| 5 to 17 Years | 0 (0.0%) | 0 (0.0%) |
| 18 to 34 Years | 0 (0.0%) | 0 (0.0%) |
| 35 to 64 Years | 0 (0.0%) | 0 (0.0%) |
| 65 to 74 Years | 0 (0.0%) | 28 (25.7%) |
| 75 Years and over | 0 (0.0%) | 11 (15.5%) |
Disability Class: Vision Difficulty
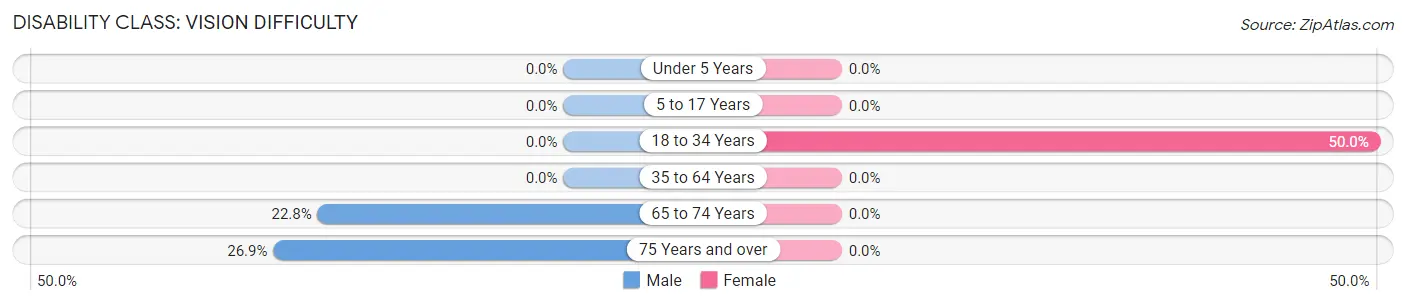
| Age Bracket | Male | Female |
| Under 5 Years | 0 (0.0%) | 0 (0.0%) |
| 5 to 17 Years | 0 (0.0%) | 0 (0.0%) |
| 18 to 34 Years | 0 (0.0%) | 13 (50.0%) |
| 35 to 64 Years | 0 (0.0%) | 0 (0.0%) |
| 65 to 74 Years | 13 (22.8%) | 0 (0.0%) |
| 75 Years and over | 7 (26.9%) | 0 (0.0%) |
Disability Class: Cognitive Difficulty
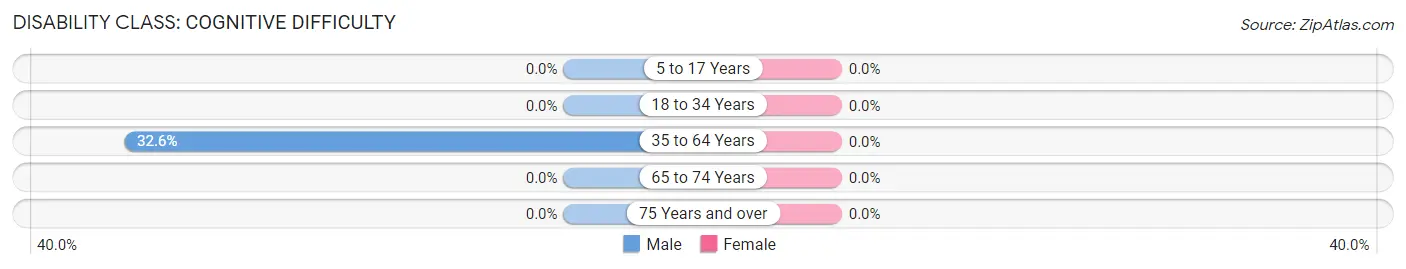
| Age Bracket | Male | Female |
| 5 to 17 Years | 0 (0.0%) | 0 (0.0%) |
| 18 to 34 Years | 0 (0.0%) | 0 (0.0%) |
| 35 to 64 Years | 45 (32.6%) | 0 (0.0%) |
| 65 to 74 Years | 0 (0.0%) | 0 (0.0%) |
| 75 Years and over | 0 (0.0%) | 0 (0.0%) |
Disability Class: Ambulatory Difficulty
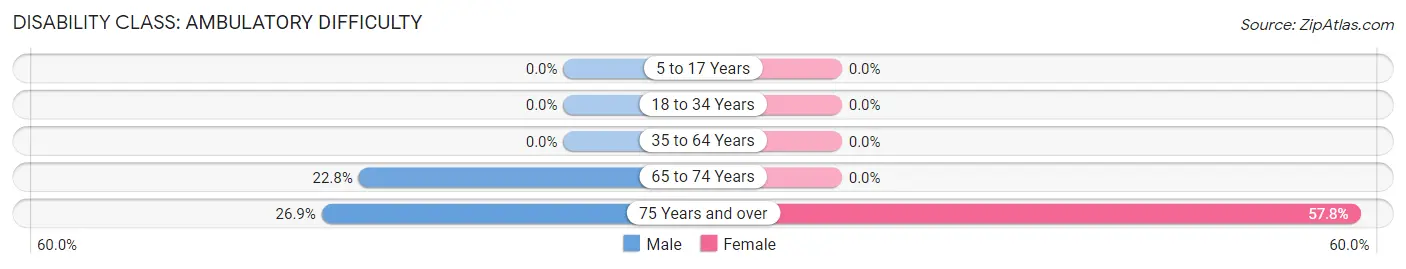
| Age Bracket | Male | Female |
| 5 to 17 Years | 0 (0.0%) | 0 (0.0%) |
| 18 to 34 Years | 0 (0.0%) | 0 (0.0%) |
| 35 to 64 Years | 0 (0.0%) | 0 (0.0%) |
| 65 to 74 Years | 13 (22.8%) | 0 (0.0%) |
| 75 Years and over | 7 (26.9%) | 41 (57.8%) |
Disability Class: Self-Care Difficulty
| Age Bracket | Male | Female |
| 5 to 17 Years | 0 (0.0%) | 0 (0.0%) |
| 18 to 34 Years | 0 (0.0%) | 0 (0.0%) |
| 35 to 64 Years | 0 (0.0%) | 0 (0.0%) |
| 65 to 74 Years | 0 (0.0%) | 0 (0.0%) |
| 75 Years and over | 0 (0.0%) | 0 (0.0%) |
Technology Access in Pittsford
Computing Device Access in Pittsford
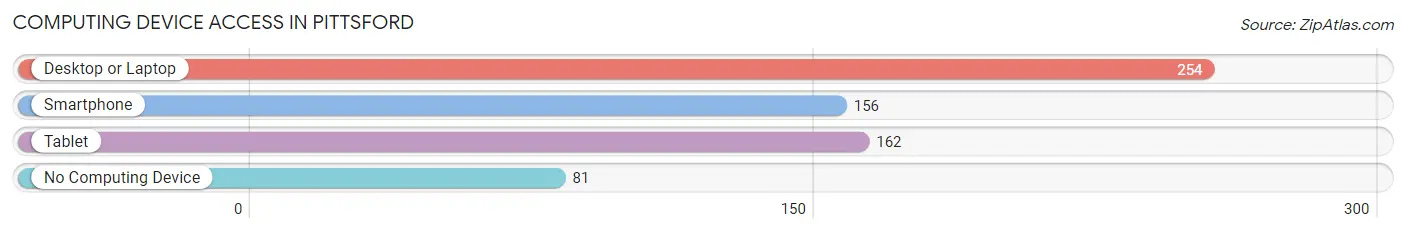
| Device Type | # Households | % Households |
| Desktop or Laptop | 254 | 71.6% |
| Smartphone | 156 | 43.9% |
| Tablet | 162 | 45.6% |
| No Computing Device | 81 | 22.8% |
| Total | 355 | 100.0% |
Internet Access in Pittsford
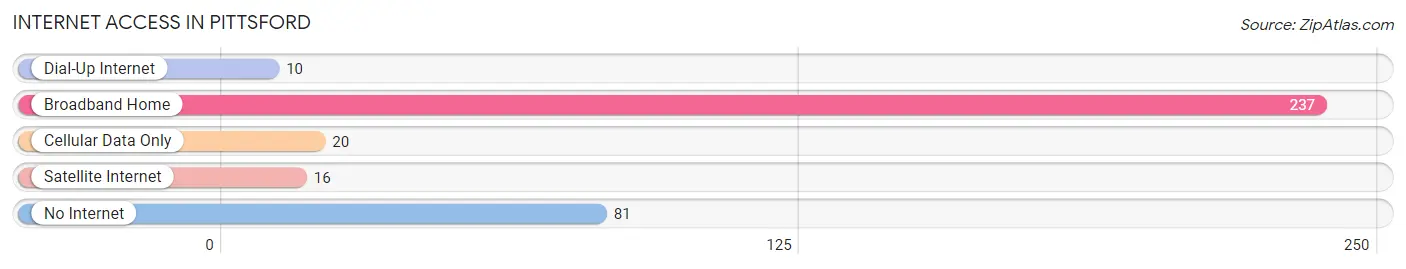
| Internet Type | # Households | % Households |
| Dial-Up Internet | 10 | 2.8% |
| Broadband Home | 237 | 66.8% |
| Cellular Data Only | 20 | 5.6% |
| Satellite Internet | 16 | 4.5% |
| No Internet | 81 | 22.8% |
| Total | 355 | 100.0% |
Pittsford Summary
Pittsford, Vermont is a small town located in Rutland County in the state of Vermont. It is situated in the Green Mountains and is bordered by the towns of Chittenden, Brandon, and Mendon. The town has a population of 1,717 people, according to the 2010 census.
History
Pittsford was first settled in 1780 by a group of settlers from Pittsfield, Massachusetts. The town was named after the Massachusetts town, and was incorporated in 1781. The town was originally an agricultural community, with the main crops being wheat, corn, and potatoes. In the 19th century, the town was home to several mills, including a sawmill, gristmill, and a woolen mill.
Geography
Pittsford is located in the Green Mountains of Vermont. The town is situated in the Taconic Mountains, which are part of the Appalachian Mountains. The town is bordered by the towns of Chittenden, Brandon, and Mendon. The town is located in the Otter Creek Valley, and is home to several small streams and ponds. The highest point in the town is the summit of Mount Horrid, which has an elevation of 2,890 feet.
Economy
The economy of Pittsford is largely based on agriculture and tourism. The town is home to several small farms, which produce a variety of crops, including corn, wheat, and potatoes. The town is also home to several small businesses, including a general store, a hardware store, and a restaurant. The town is also home to several bed and breakfasts, which attract tourists from all over the world.
Demographics
According to the 2010 census, the population of Pittsford was 1,717 people. The population is predominantly white, with 95.3% of the population being white. The median household income in the town is $50,938, and the median age is 44.7 years. The town has a low unemployment rate of 3.2%.
Conclusion
Pittsford, Vermont is a small town located in the Green Mountains of Vermont. The town has a population of 1,717 people, and is predominantly white. The town is home to several small businesses and farms, and is a popular tourist destination. The town has a low unemployment rate and a median household income of $50,938. Pittsford is a small town with a rich history and a bright future.
Common Questions
What is Per Capita Income in Pittsford?
Per Capita income in Pittsford is $33,434.
What is the Median Household income in Pittsford?
Median Household Income in Pittsford is $37,760.
What is Inequality or Gini Index in Pittsford?
Inequality or Gini Index in Pittsford is 0.38.
What is the Total Population of Pittsford?
Total Population of Pittsford is 583.
What is the Total Male Population of Pittsford?
Total Male Population of Pittsford is 251.
What is the Total Female Population of Pittsford?
Total Female Population of Pittsford is 332.
What is the Ratio of Males per 100 Females in Pittsford?
There are 75.60 Males per 100 Females in Pittsford.
What is the Ratio of Females per 100 Males in Pittsford?
There are 132.27 Females per 100 Males in Pittsford.
What is the Median Population Age in Pittsford?
Median Population Age in Pittsford is 60.7 Years.
What is the Average Family Size in Pittsford
Average Family Size in Pittsford is 2.6 People.
What is the Average Household Size in Pittsford
Average Household Size in Pittsford is 1.6 People.
How Large is the Labor Force in Pittsford?
There are 266 People in the Labor Forcein in Pittsford.
What is the Percentage of People in the Labor Force in Pittsford?
48.7% of People are in the Labor Force in Pittsford.
What is the Unemployment Rate in Pittsford?
Unemployment Rate in Pittsford is 9.0%.