Lyndonville, VT Map & Demographics
Lyndonville Map
Lyndonville Overview
$27,370
PER CAPITA INCOME
$63,822
AVG FAMILY INCOME
$54,688
AVG HOUSEHOLD INCOME
0.9%
WAGE / INCOME GAP [ % ]
99.1¢/ $1
WAGE / INCOME GAP [ $ ]
0.39
INEQUALITY / GINI INDEX
1,143
TOTAL POPULATION
550
MALE POPULATION
593
FEMALE POPULATION
92.75
MALES / 100 FEMALES
107.82
FEMALES / 100 MALES
36.4
MEDIAN AGE
3.1
AVG FAMILY SIZE
2.1
AVG HOUSEHOLD SIZE
674
LABOR FORCE [ PEOPLE ]
70.8%
PERCENT IN LABOR FORCE
2.8%
UNEMPLOYMENT RATE
Lyndonville Zip Codes
Lyndonville Area Codes
Income in Lyndonville
Income Overview in Lyndonville
Per Capita Income in Lyndonville is $27,370, while median incomes of families and households are $63,822 and $54,688 respectively.
| Characteristic | Number | Measure |
| Per Capita Income | 1,143 | $27,370 |
| Median Family Income | 217 | $63,822 |
| Mean Family Income | 217 | $64,077 |
| Median Household Income | 537 | $54,688 |
| Mean Household Income | 537 | $58,716 |
| Income Deficit | 217 | $0 |
| Wage / Income Gap (%) | 1,143 | 0.93% |
| Wage / Income Gap ($) | 1,143 | 99.07¢ per $1 |
| Gini / Inequality Index | 1,143 | 0.39 |
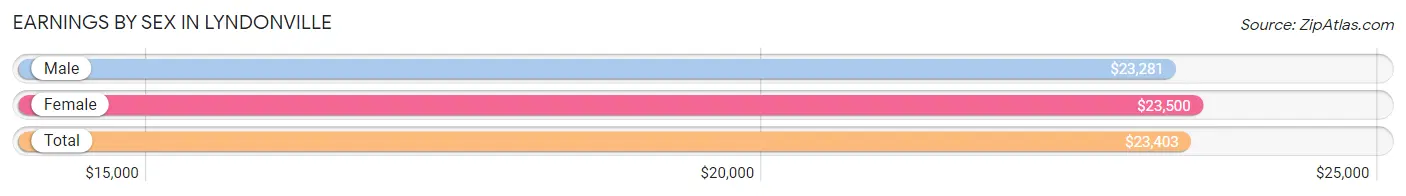
Earnings by Sex in Lyndonville
Average Earnings in Lyndonville are $23,403, $23,281 for men and $23,500 for women, a difference of 0.9%.
| Sex | Number | Average Earnings |
| Male | 363 (52.4%) | $23,281 |
| Female | 330 (47.6%) | $23,500 |
| Total | 693 (100.0%) | $23,403 |
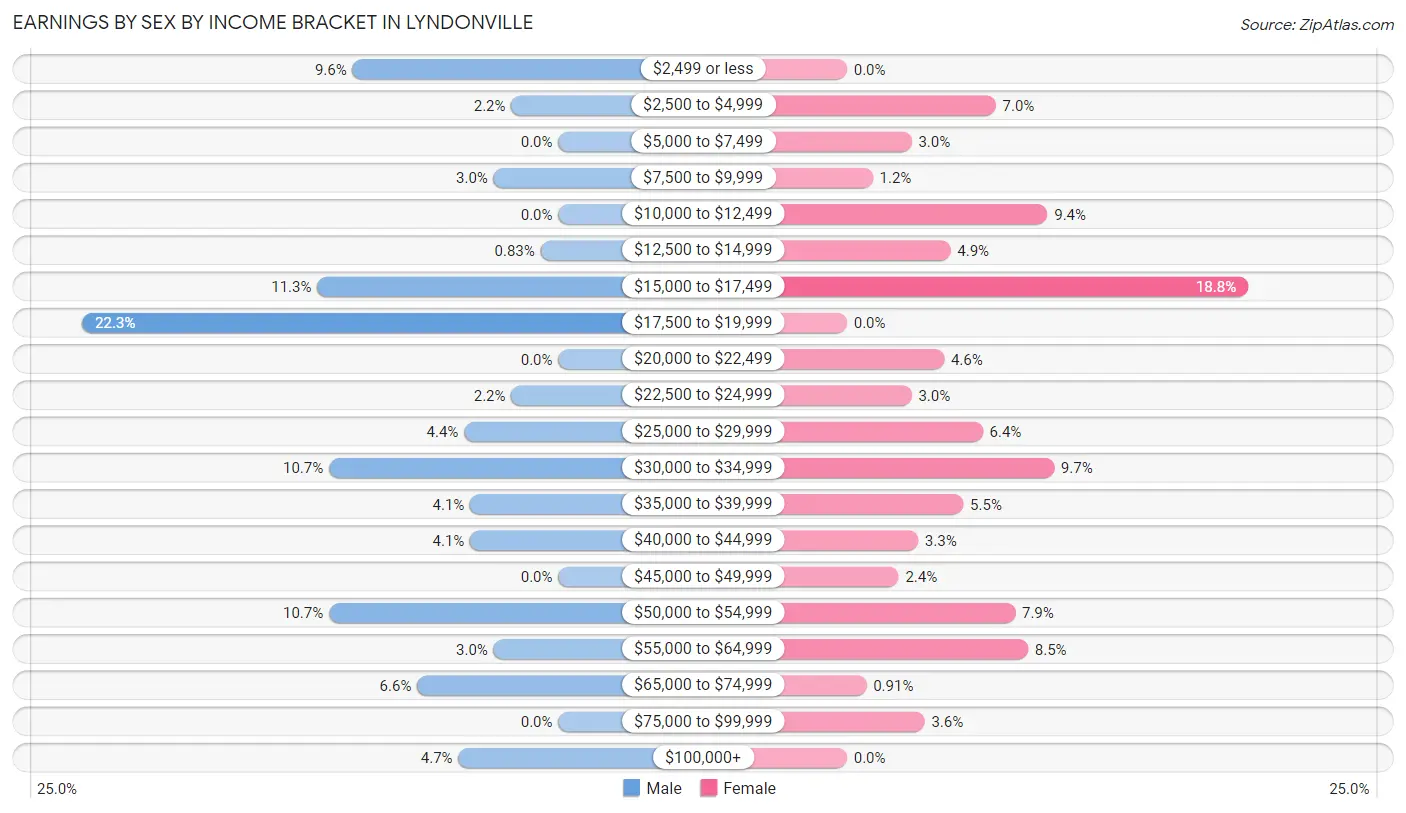
Earnings by Sex by Income Bracket in Lyndonville
The most common earnings brackets in Lyndonville are $17,500 to $19,999 for men (81 | 22.3%) and $15,000 to $17,499 for women (62 | 18.8%).
| Income | Male | Female |
| $2,499 or less | 35 (9.6%) | 0 (0.0%) |
| $2,500 to $4,999 | 8 (2.2%) | 23 (7.0%) |
| $5,000 to $7,499 | 0 (0.0%) | 10 (3.0%) |
| $7,500 to $9,999 | 11 (3.0%) | 4 (1.2%) |
| $10,000 to $12,499 | 0 (0.0%) | 31 (9.4%) |
| $12,500 to $14,999 | 3 (0.8%) | 16 (4.9%) |
| $15,000 to $17,499 | 41 (11.3%) | 62 (18.8%) |
| $17,500 to $19,999 | 81 (22.3%) | 0 (0.0%) |
| $20,000 to $22,499 | 0 (0.0%) | 15 (4.5%) |
| $22,500 to $24,999 | 8 (2.2%) | 10 (3.0%) |
| $25,000 to $29,999 | 16 (4.4%) | 21 (6.4%) |
| $30,000 to $34,999 | 39 (10.7%) | 32 (9.7%) |
| $35,000 to $39,999 | 15 (4.1%) | 18 (5.4%) |
| $40,000 to $44,999 | 15 (4.1%) | 11 (3.3%) |
| $45,000 to $49,999 | 0 (0.0%) | 8 (2.4%) |
| $50,000 to $54,999 | 39 (10.7%) | 26 (7.9%) |
| $55,000 to $64,999 | 11 (3.0%) | 28 (8.5%) |
| $65,000 to $74,999 | 24 (6.6%) | 3 (0.9%) |
| $75,000 to $99,999 | 0 (0.0%) | 12 (3.6%) |
| $100,000+ | 17 (4.7%) | 0 (0.0%) |
| Total | 363 (100.0%) | 330 (100.0%) |
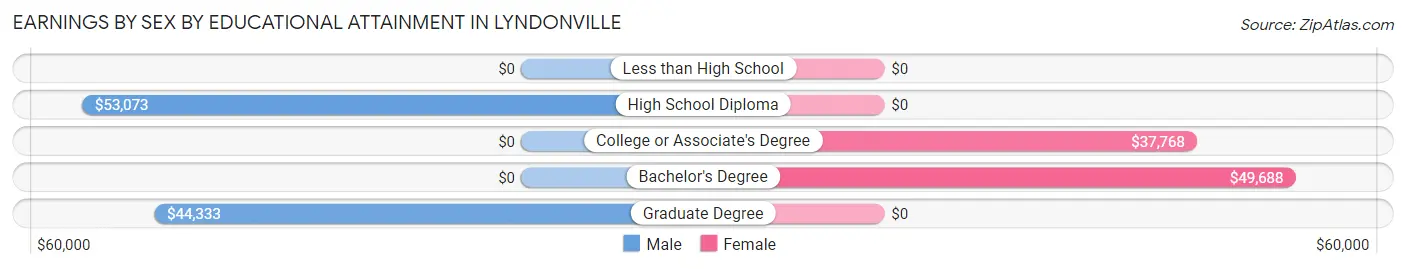
Earnings by Sex by Educational Attainment in Lyndonville
Average earnings in Lyndonville are $29,453 for men and $30,508 for women, a difference of 3.5%. Men with an educational attainment of high school diploma enjoy the highest average annual earnings of $53,073, while those with graduate degree education earn the least with $44,333. Women with an educational attainment of bachelor's degree earn the most with the average annual earnings of $49,688, while those with college or associate's degree education have the smallest earnings of $37,768.
| Educational Attainment | Male Income | Female Income |
| Less than High School | - | - |
| High School Diploma | $53,073 | $0 |
| College or Associate's Degree | - | - |
| Bachelor's Degree | - | - |
| Graduate Degree | $44,333 | $0 |
| Total | $29,453 | $30,508 |
Family Income in Lyndonville
Family Income Brackets in Lyndonville
According to the Lyndonville family income data, there are 101 families falling into the $50,000 to $74,999 income range, which is the most common income bracket and makes up 46.5% of all families.
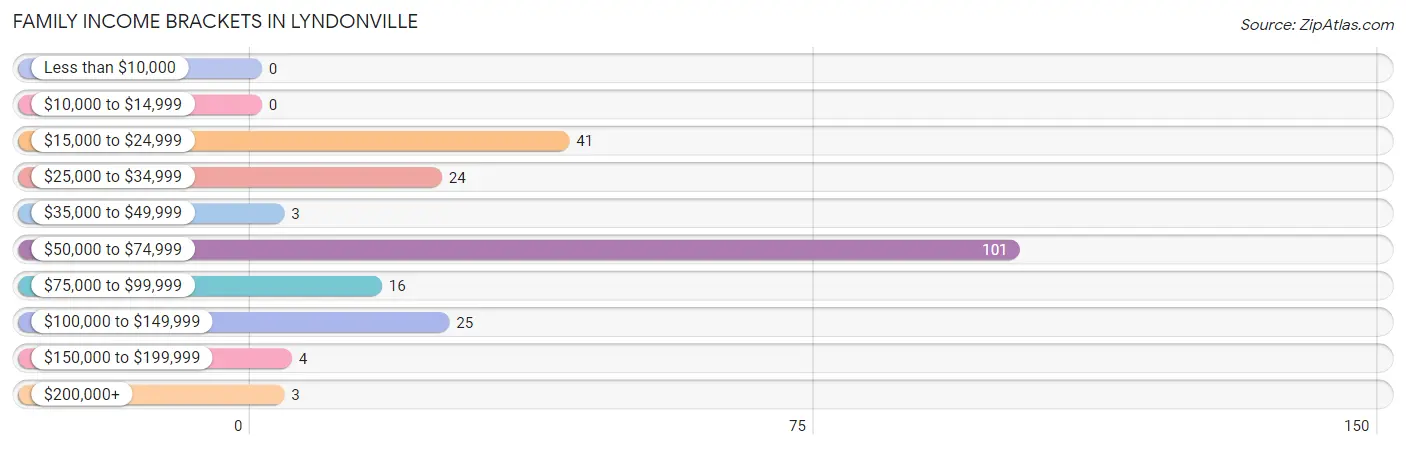
| Income Bracket | # Families | % Families |
| Less than $10,000 | 0 | 0.0% |
| $10,000 to $14,999 | 0 | 0.0% |
| $15,000 to $24,999 | 41 | 18.9% |
| $25,000 to $34,999 | 24 | 11.1% |
| $35,000 to $49,999 | 3 | 1.4% |
| $50,000 to $74,999 | 101 | 46.5% |
| $75,000 to $99,999 | 16 | 7.4% |
| $100,000 to $149,999 | 25 | 11.5% |
| $150,000 to $199,999 | 4 | 1.8% |
| $200,000+ | 3 | 1.4% |
Family Income by Famaliy Size in Lyndonville
4-person families (8 | 3.7%) account for the highest median family income in Lyndonville with $166,875 per family, while 4-person families (8 | 3.7%) have the highest median income of $41,719 per family member.
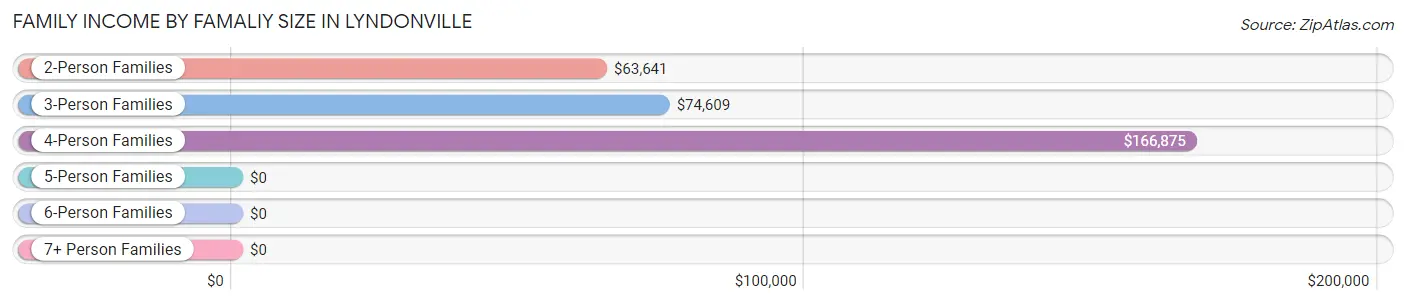
| Income Bracket | # Families | Median Income |
| 2-Person Families | 99 (45.6%) | $63,641 |
| 3-Person Families | 53 (24.4%) | $74,609 |
| 4-Person Families | 8 (3.7%) | $166,875 |
| 5-Person Families | 0 (0.0%) | $0 |
| 6-Person Families | 57 (26.3%) | $0 |
| 7+ Person Families | 0 (0.0%) | $0 |
| Total | 217 (100.0%) | $63,822 |
Family Income by Number of Earners in Lyndonville
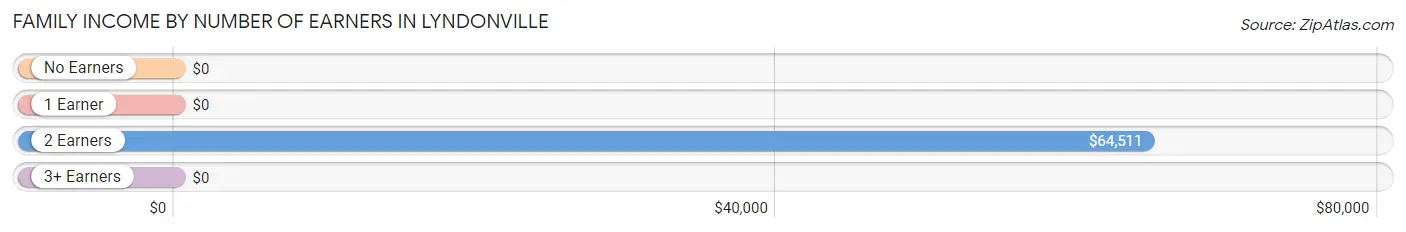
| Number of Earners | # Families | Median Income |
| No Earners | 18 (8.3%) | $0 |
| 1 Earner | 63 (29.0%) | $0 |
| 2 Earners | 131 (60.4%) | $64,511 |
| 3+ Earners | 5 (2.3%) | $0 |
| Total | 217 (100.0%) | $63,822 |
Household Income in Lyndonville
Household Income Brackets in Lyndonville
With 150 households falling in the category, the $50,000 to $74,999 income range is the most frequent in Lyndonville, accounting for 27.9% of all households. In contrast, only 6 households (1.1%) fall into the $200,000+ income bracket, making it the least populous group.
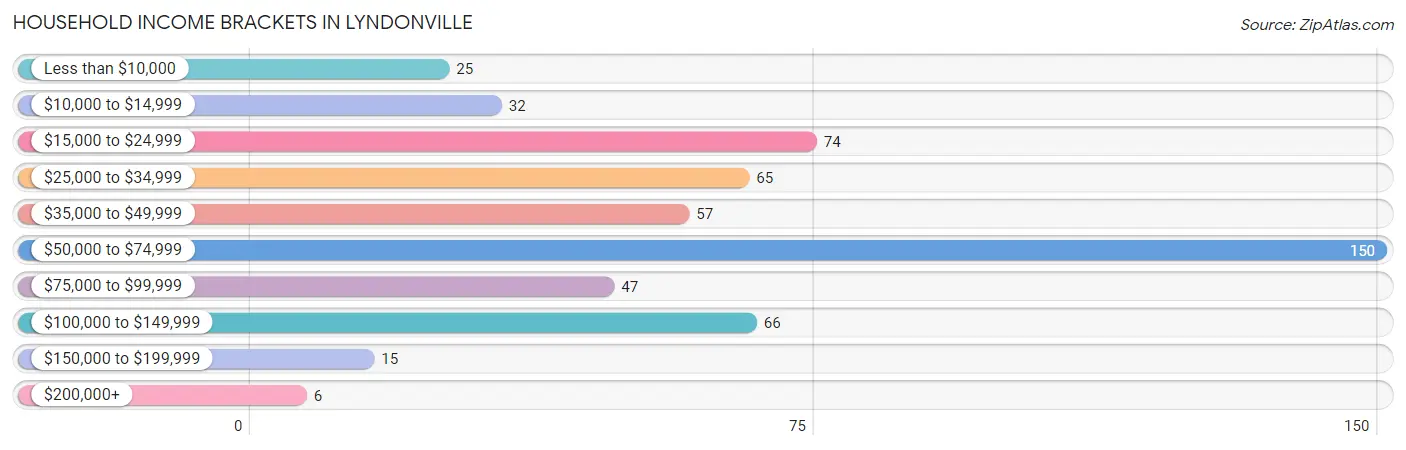
| Income Bracket | # Households | % Households |
| Less than $10,000 | 25 | 4.7% |
| $10,000 to $14,999 | 32 | 6.0% |
| $15,000 to $24,999 | 74 | 13.8% |
| $25,000 to $34,999 | 65 | 12.1% |
| $35,000 to $49,999 | 57 | 10.6% |
| $50,000 to $74,999 | 150 | 27.9% |
| $75,000 to $99,999 | 47 | 8.8% |
| $100,000 to $149,999 | 66 | 12.3% |
| $150,000 to $199,999 | 15 | 2.8% |
| $200,000+ | 6 | 1.1% |
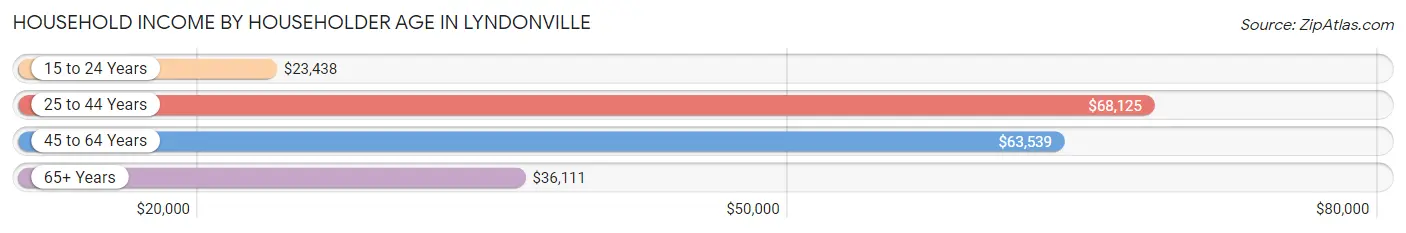
Household Income by Householder Age in Lyndonville
The median household income in Lyndonville is $54,688, with the highest median household income of $68,125 found in the 25 to 44 years age bracket for the primary householder. A total of 150 households (27.9%) fall into this category. Meanwhile, the 15 to 24 years age bracket for the primary householder has the lowest median household income of $23,438, with 59 households (11.0%) in this group.
| Income Bracket | # Households | Median Income |
| 15 to 24 Years | 59 (11.0%) | $23,438 |
| 25 to 44 Years | 150 (27.9%) | $68,125 |
| 45 to 64 Years | 186 (34.6%) | $63,539 |
| 65+ Years | 142 (26.4%) | $36,111 |
| Total | 537 (100.0%) | $54,688 |
Poverty in Lyndonville
Income Below Poverty by Sex and Age in Lyndonville
With 20.4% poverty level for males and 28.2% for females among the residents of Lyndonville, 6 to 11 year old males and 18 to 24 year old females are the most vulnerable to poverty, with 50 males (67.6%) and 49 females (67.1%) in their respective age groups living below the poverty level.
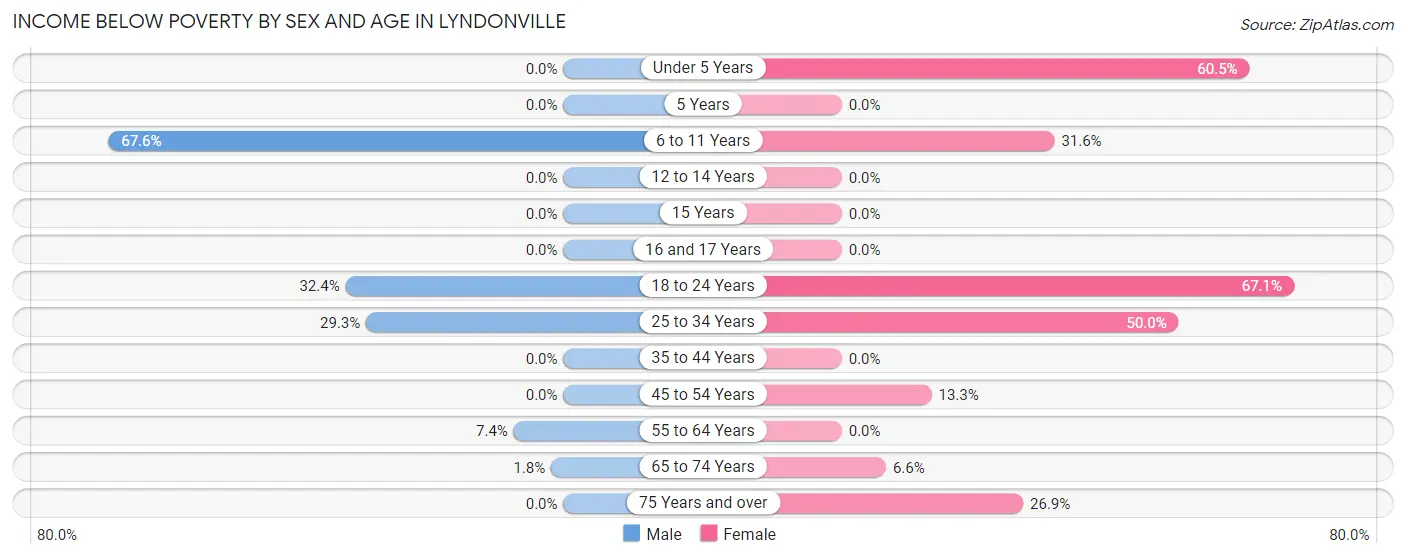
| Age Bracket | Male | Female |
| Under 5 Years | 0 (0.0%) | 23 (60.5%) |
| 5 Years | 0 (0.0%) | 0 (0.0%) |
| 6 to 11 Years | 50 (67.6%) | 18 (31.6%) |
| 12 to 14 Years | 0 (0.0%) | 0 (0.0%) |
| 15 Years | 0 (0.0%) | 0 (0.0%) |
| 16 and 17 Years | 0 (0.0%) | 0 (0.0%) |
| 18 to 24 Years | 11 (32.4%) | 49 (67.1%) |
| 25 to 34 Years | 41 (29.3%) | 55 (50.0%) |
| 35 to 44 Years | 0 (0.0%) | 0 (0.0%) |
| 45 to 54 Years | 0 (0.0%) | 4 (13.3%) |
| 55 to 64 Years | 9 (7.4%) | 0 (0.0%) |
| 65 to 74 Years | 1 (1.8%) | 4 (6.6%) |
| 75 Years and over | 0 (0.0%) | 14 (26.9%) |
| Total | 112 (20.4%) | 167 (28.2%) |
Income Above Poverty by Sex and Age in Lyndonville
According to the poverty statistics in Lyndonville, males aged under 5 years and females aged 16 and 17 years are the age groups that are most secure financially, with 100.0% of males and 100.0% of females in these age groups living above the poverty line.
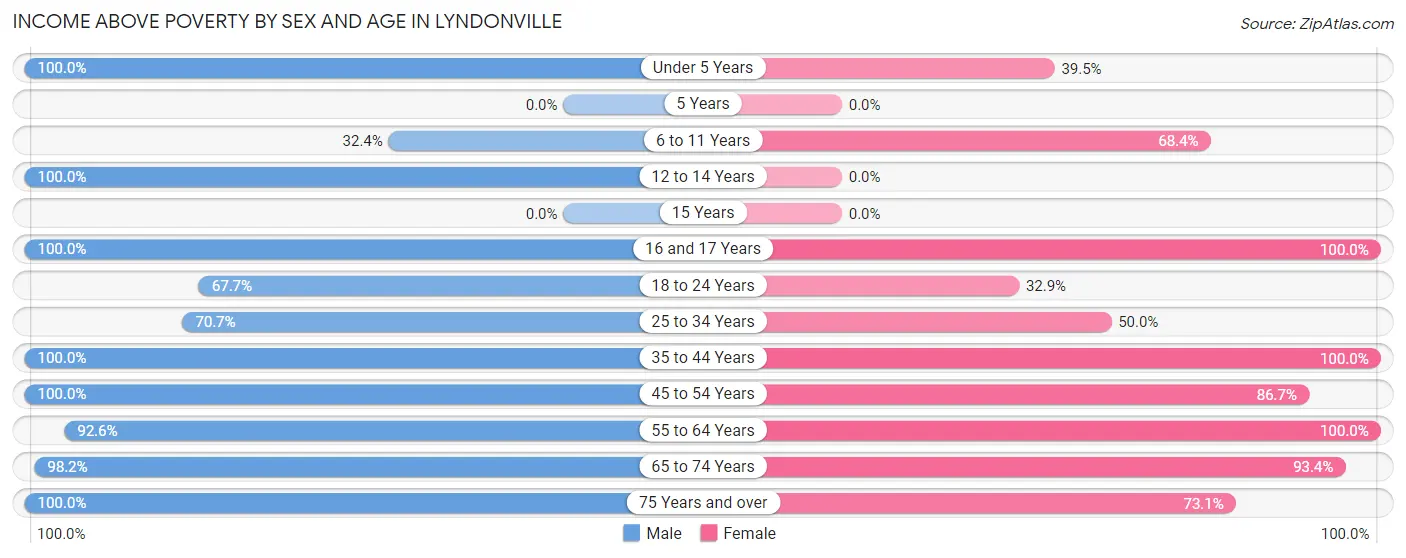
| Age Bracket | Male | Female |
| Under 5 Years | 19 (100.0%) | 15 (39.5%) |
| 5 Years | 0 (0.0%) | 0 (0.0%) |
| 6 to 11 Years | 24 (32.4%) | 39 (68.4%) |
| 12 to 14 Years | 3 (100.0%) | 0 (0.0%) |
| 15 Years | 0 (0.0%) | 0 (0.0%) |
| 16 and 17 Years | 14 (100.0%) | 5 (100.0%) |
| 18 to 24 Years | 23 (67.6%) | 24 (32.9%) |
| 25 to 34 Years | 99 (70.7%) | 55 (50.0%) |
| 35 to 44 Years | 63 (100.0%) | 47 (100.0%) |
| 45 to 54 Years | 16 (100.0%) | 26 (86.7%) |
| 55 to 64 Years | 113 (92.6%) | 120 (100.0%) |
| 65 to 74 Years | 54 (98.2%) | 57 (93.4%) |
| 75 Years and over | 10 (100.0%) | 38 (73.1%) |
| Total | 438 (79.6%) | 426 (71.8%) |
Income Below Poverty Among Married-Couple Families in Lyndonville
The poverty statistics for married-couple families in Lyndonville show that 20.5% or 41 of the total 200 families live below the poverty line. Families with 3 or 4 children have the highest poverty rate of 71.9%, comprising of 41 families. On the other hand, families with no children have the lowest poverty rate of 0.0%, which includes 0 families.
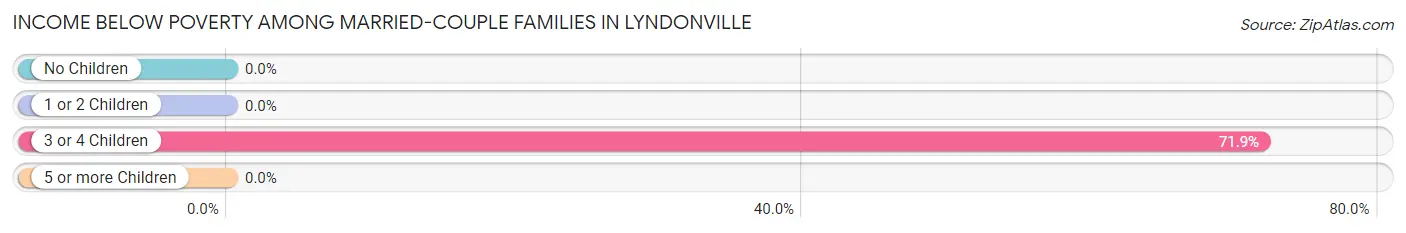
| Children | Above Poverty | Below Poverty |
| No Children | 121 (100.0%) | 0 (0.0%) |
| 1 or 2 Children | 22 (100.0%) | 0 (0.0%) |
| 3 or 4 Children | 16 (28.1%) | 41 (71.9%) |
| 5 or more Children | 0 (0.0%) | 0 (0.0%) |
| Total | 159 (79.5%) | 41 (20.5%) |
Income Below Poverty Among Single-Parent Households in Lyndonville
| Children | Single Father | Single Mother |
| No Children | 0 (0.0%) | 0 (0.0%) |
| 1 or 2 Children | 0 (0.0%) | 0 (0.0%) |
| 3 or 4 Children | 0 (0.0%) | 0 (0.0%) |
| 5 or more Children | 0 (0.0%) | 0 (0.0%) |
| Total | 0 (0.0%) | 0 (0.0%) |
Income Below Poverty Among Married-Couple vs Single-Parent Households in Lyndonville
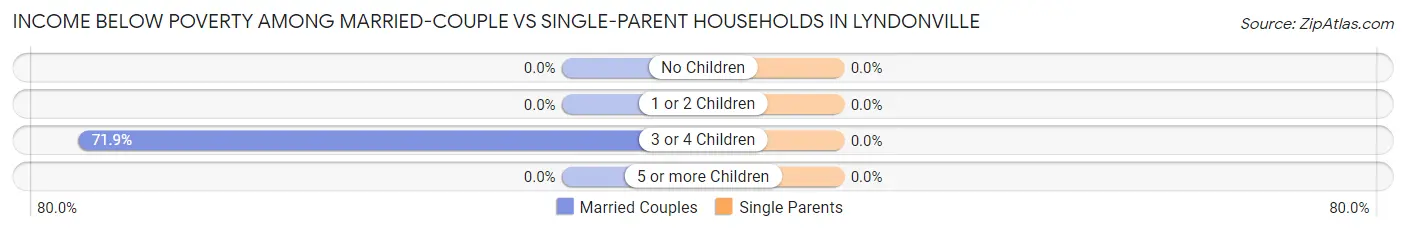
| Children | Married-Couple Families | Single-Parent Households |
| No Children | 0 (0.0%) | 0 (0.0%) |
| 1 or 2 Children | 0 (0.0%) | 0 (0.0%) |
| 3 or 4 Children | 41 (71.9%) | 0 (0.0%) |
| 5 or more Children | 0 (0.0%) | 0 (0.0%) |
| Total | 41 (20.5%) | 0 (0.0%) |
Race in Lyndonville
The most populous races in Lyndonville are White / Caucasian (963 | 84.3%), Two or more Races (98 | 8.6%), and Hispanic or Latino (77 | 6.7%).
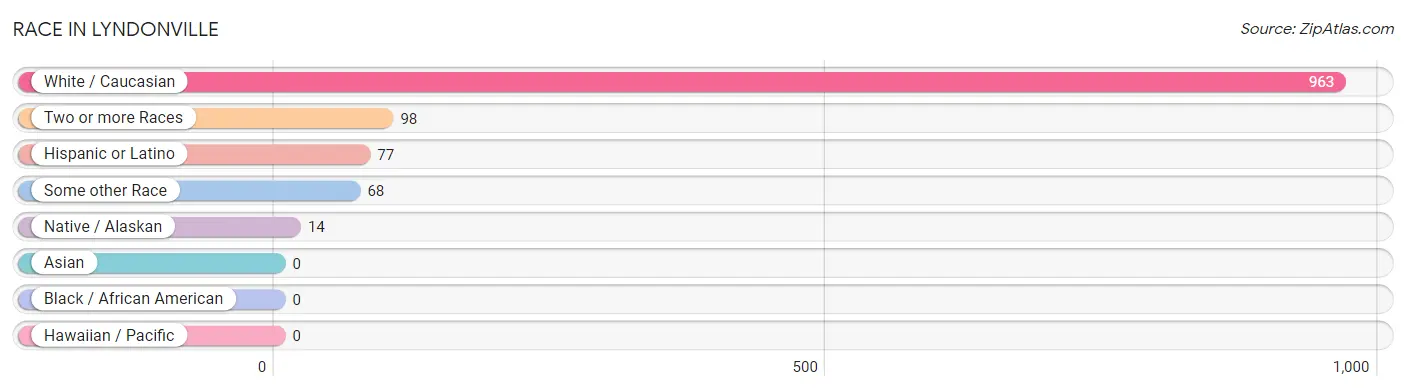
| Race | # Population | % Population |
| Asian | 0 | 0.0% |
| Black / African American | 0 | 0.0% |
| Hawaiian / Pacific | 0 | 0.0% |
| Hispanic or Latino | 77 | 6.7% |
| Native / Alaskan | 14 | 1.2% |
| White / Caucasian | 963 | 84.3% |
| Two or more Races | 98 | 8.6% |
| Some other Race | 68 | 5.9% |
| Total | 1,143 | 100.0% |
Ancestry in Lyndonville
The most populous ancestries reported in Lyndonville are French (175 | 15.3%), Irish (147 | 12.9%), English (132 | 11.6%), Mexican (56 | 4.9%), and Scottish (39 | 3.4%), together accounting for 48.0% of all Lyndonville residents.
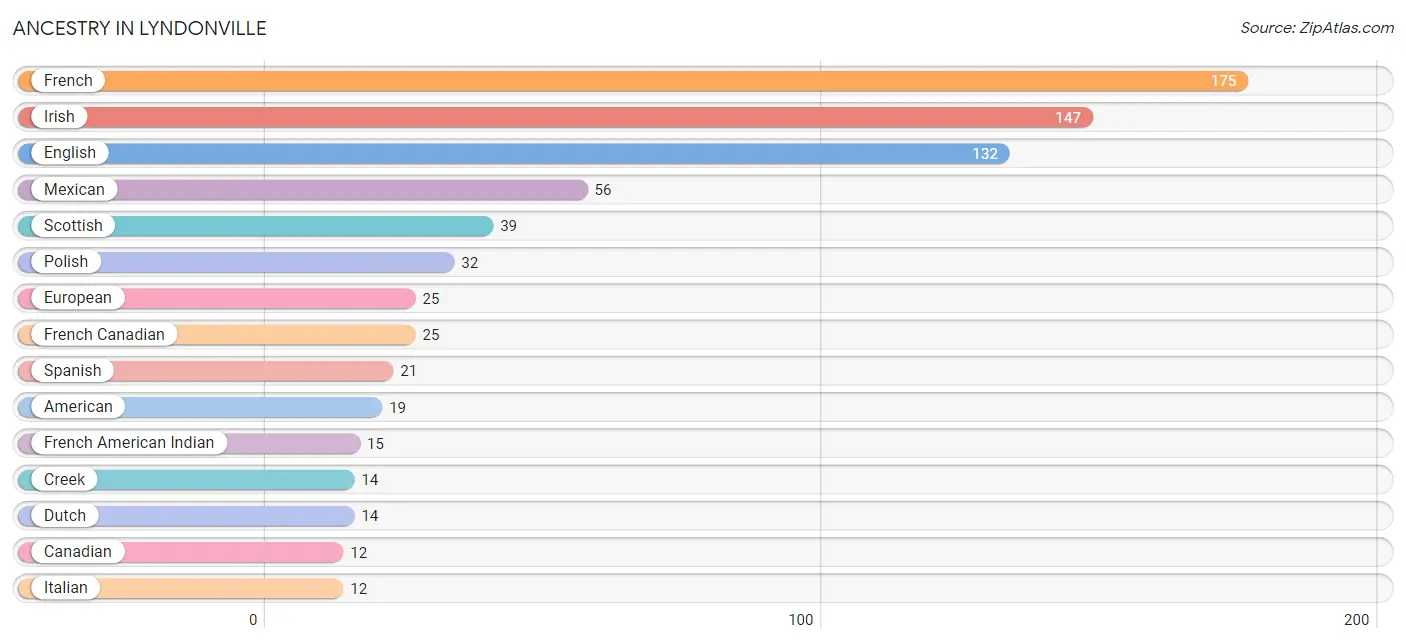
| Ancestry | # Population | % Population |
| American | 19 | 1.7% |
| Canadian | 12 | 1.1% |
| Creek | 14 | 1.2% |
| Danish | 3 | 0.3% |
| Dutch | 14 | 1.2% |
| English | 132 | 11.6% |
| European | 25 | 2.2% |
| French | 175 | 15.3% |
| French American Indian | 15 | 1.3% |
| French Canadian | 25 | 2.2% |
| German | 10 | 0.9% |
| Irish | 147 | 12.9% |
| Italian | 12 | 1.1% |
| Mexican | 56 | 4.9% |
| Polish | 32 | 2.8% |
| Scotch-Irish | 4 | 0.4% |
| Scottish | 39 | 3.4% |
| Spanish | 21 | 1.8% |
| Swedish | 10 | 0.9% | View All 19 Rows |
Immigrants in Lyndonville

| Immigration Origin | # Population | % Population | View All 0 Rows |
Sex and Age in Lyndonville
Sex and Age in Lyndonville
The most populous age groups in Lyndonville are 55 to 59 Years (89 | 16.2%) for men and 55 to 59 Years (100 | 16.9%) for women.
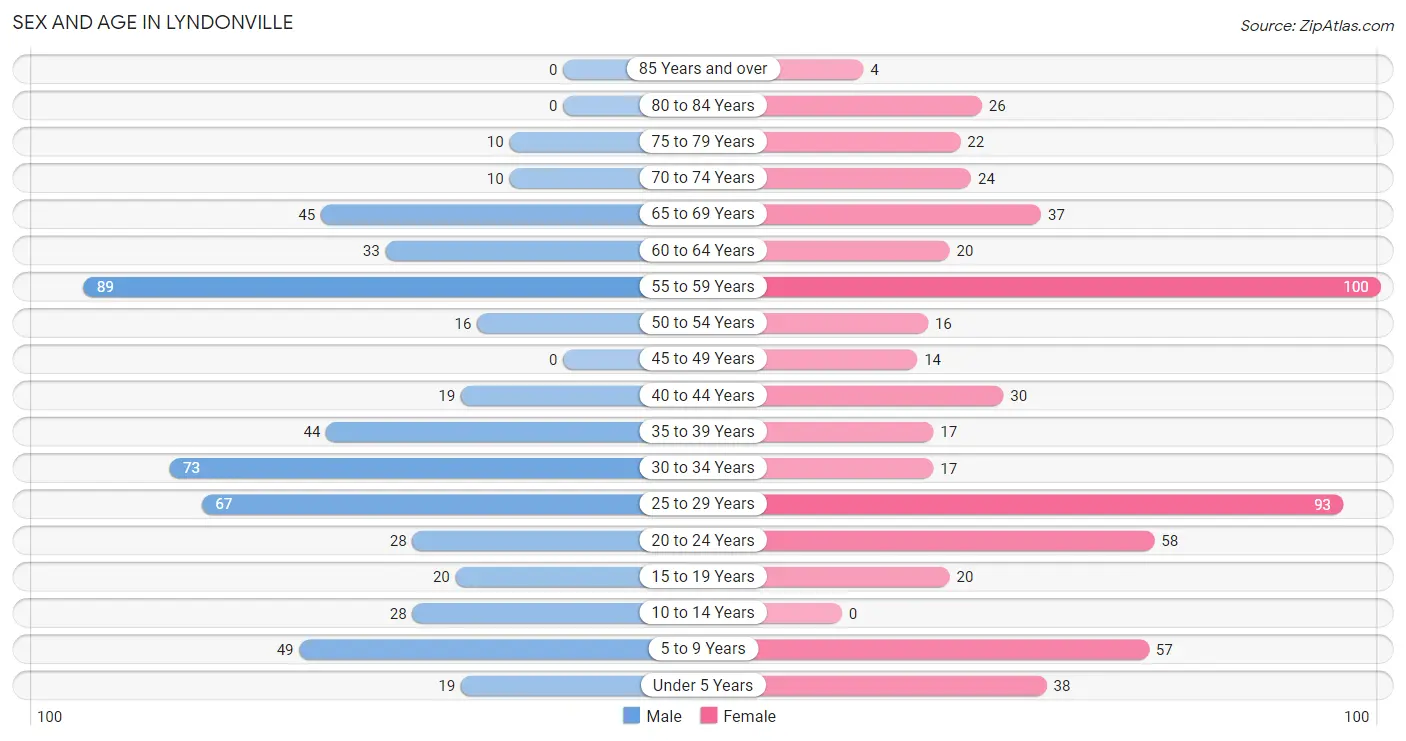
| Age Bracket | Male | Female |
| Under 5 Years | 19 (3.5%) | 38 (6.4%) |
| 5 to 9 Years | 49 (8.9%) | 57 (9.6%) |
| 10 to 14 Years | 28 (5.1%) | 0 (0.0%) |
| 15 to 19 Years | 20 (3.6%) | 20 (3.4%) |
| 20 to 24 Years | 28 (5.1%) | 58 (9.8%) |
| 25 to 29 Years | 67 (12.2%) | 93 (15.7%) |
| 30 to 34 Years | 73 (13.3%) | 17 (2.9%) |
| 35 to 39 Years | 44 (8.0%) | 17 (2.9%) |
| 40 to 44 Years | 19 (3.5%) | 30 (5.1%) |
| 45 to 49 Years | 0 (0.0%) | 14 (2.4%) |
| 50 to 54 Years | 16 (2.9%) | 16 (2.7%) |
| 55 to 59 Years | 89 (16.2%) | 100 (16.9%) |
| 60 to 64 Years | 33 (6.0%) | 20 (3.4%) |
| 65 to 69 Years | 45 (8.2%) | 37 (6.2%) |
| 70 to 74 Years | 10 (1.8%) | 24 (4.1%) |
| 75 to 79 Years | 10 (1.8%) | 22 (3.7%) |
| 80 to 84 Years | 0 (0.0%) | 26 (4.4%) |
| 85 Years and over | 0 (0.0%) | 4 (0.7%) |
| Total | 550 (100.0%) | 593 (100.0%) |
Families and Households in Lyndonville
Median Family Size in Lyndonville
The median family size in Lyndonville is 3.06 persons per family, with single female/mother families (13 | 6.0%) accounting for the largest median family size of 3.92 persons per family. On the other hand, single male/father families (4 | 1.8%) represent the smallest median family size with 2.00 persons per family.
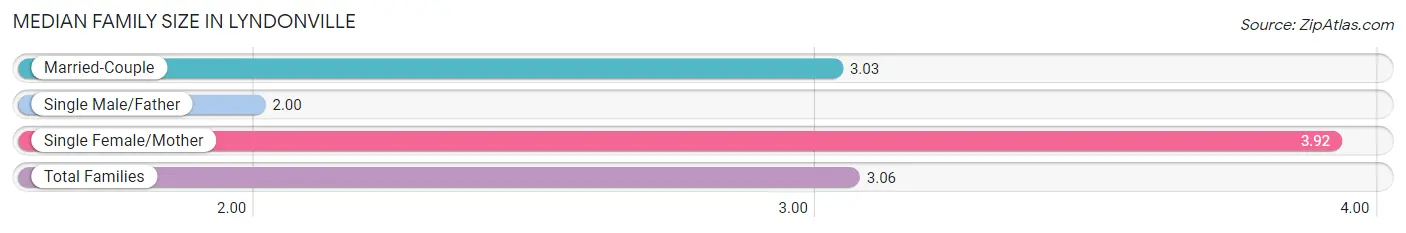
| Family Type | # Families | Family Size |
| Married-Couple | 200 (92.2%) | 3.03 |
| Single Male/Father | 4 (1.8%) | 2.00 |
| Single Female/Mother | 13 (6.0%) | 3.92 |
| Total Families | 217 (100.0%) | 3.06 |
Median Household Size in Lyndonville
The median household size in Lyndonville is 2.13 persons per household, with single female/mother households (13 | 2.4%) accounting for the largest median household size of 3.92 persons per household. non-family households (320 | 59.6%) represent the smallest median household size with 1.49 persons per household.
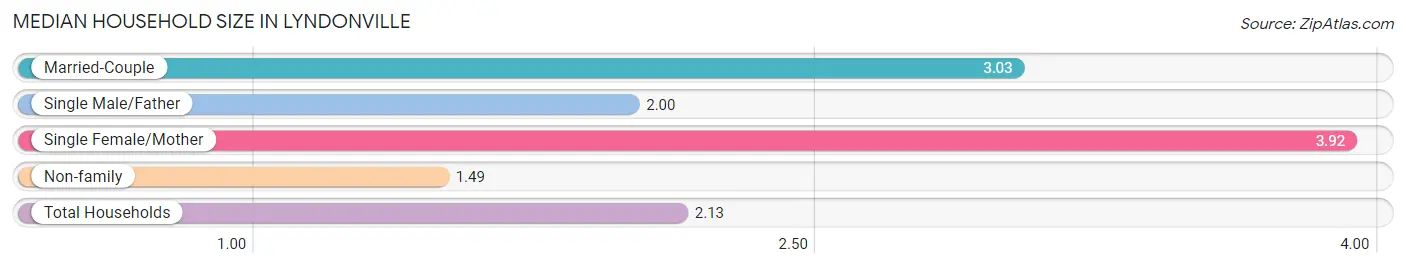
| Household Type | # Households | Household Size |
| Married-Couple | 200 (37.2%) | 3.03 |
| Single Male/Father | 4 (0.7%) | 2.00 |
| Single Female/Mother | 13 (2.4%) | 3.92 |
| Non-family | 320 (59.6%) | 1.49 |
| Total Households | 537 (100.0%) | 2.13 |
Household Size by Marriage Status in Lyndonville
Out of a total of 537 households in Lyndonville, 217 (40.4%) are family households, while 320 (59.6%) are nonfamily households. The most numerous type of family households are 2-person households, comprising 99, and the most common type of nonfamily households are 1-person households, comprising 200.
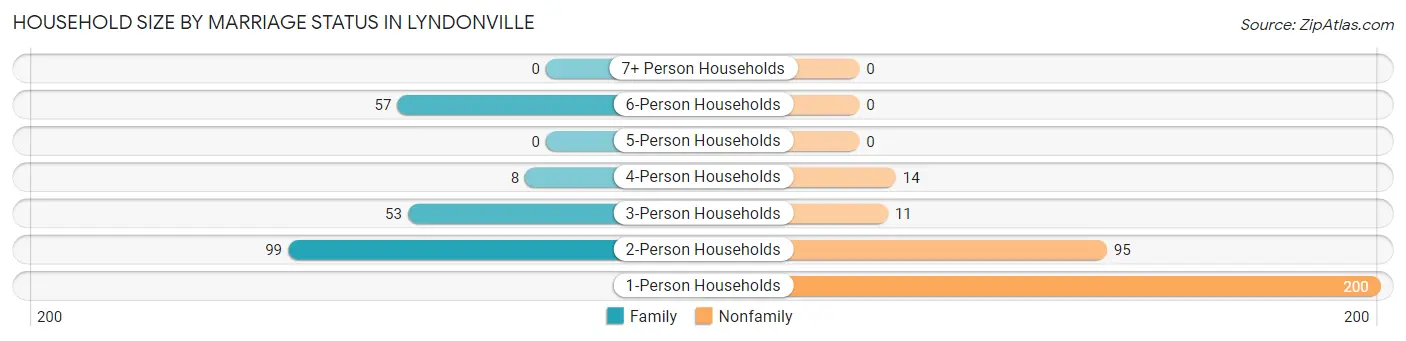
| Household Size | Family Households | Nonfamily Households |
| 1-Person Households | - | 200 (37.2%) |
| 2-Person Households | 99 (18.4%) | 95 (17.7%) |
| 3-Person Households | 53 (9.9%) | 11 (2.1%) |
| 4-Person Households | 8 (1.5%) | 14 (2.6%) |
| 5-Person Households | 0 (0.0%) | 0 (0.0%) |
| 6-Person Households | 57 (10.6%) | 0 (0.0%) |
| 7+ Person Households | 0 (0.0%) | 0 (0.0%) |
| Total | 217 (40.4%) | 320 (59.6%) |
Female Fertility in Lyndonville
Fertility by Age in Lyndonville
| Age Bracket | Women with Births | Births / 1,000 Women |
| 15 to 19 years | 0 (0.0%) | 0.0 |
| 20 to 34 years | 0 (0.0%) | 0.0 |
| 35 to 50 years | 0 (0.0%) | 0.0 |
| Total | 0 (0.0%) | 0.0 |
Fertility by Age by Marriage Status in Lyndonville
| Age Bracket | Married | Unmarried |
| 15 to 19 years | 0 (0.0%) | 0 (0.0%) |
| 20 to 34 years | 0 (0.0%) | 0 (0.0%) |
| 35 to 50 years | 0 (0.0%) | 0 (0.0%) |
| Total | 0 (0.0%) | 0 (0.0%) |
Fertility by Education in Lyndonville
| Educational Attainment | Women with Births | Births / 1,000 Women |
| Less than High School | 0 (0.0%) | 0.0 |
| High School Diploma | 0 (0.0%) | 0.0 |
| College or Associate's Degree | 0 (0.0%) | 0.0 |
| Bachelor's Degree | 0 (0.0%) | 0.0 |
| Graduate Degree | 0 (0.0%) | 0.0 |
| Total | 0 (0.0%) | 0.0 |
Fertility by Education by Marriage Status in Lyndonville
| Educational Attainment | Married | Unmarried |
| Less than High School | 0 (0.0%) | 0 (0.0%) |
| High School Diploma | 0 (0.0%) | 0 (0.0%) |
| College or Associate's Degree | 0 (0.0%) | 0 (0.0%) |
| Bachelor's Degree | 0 (0.0%) | 0 (0.0%) |
| Graduate Degree | 0 (0.0%) | 0 (0.0%) |
| Total | 0 (0.0%) | 0 (0.0%) |
Employment Characteristics in Lyndonville
Employment by Class of Employer in Lyndonville
Among the 648 employed individuals in Lyndonville, private company employees (307 | 47.4%), self-employed (not incorporated) (143 | 22.1%), and not-for-profit organizations (103 | 15.9%) make up the most common classes of employment.
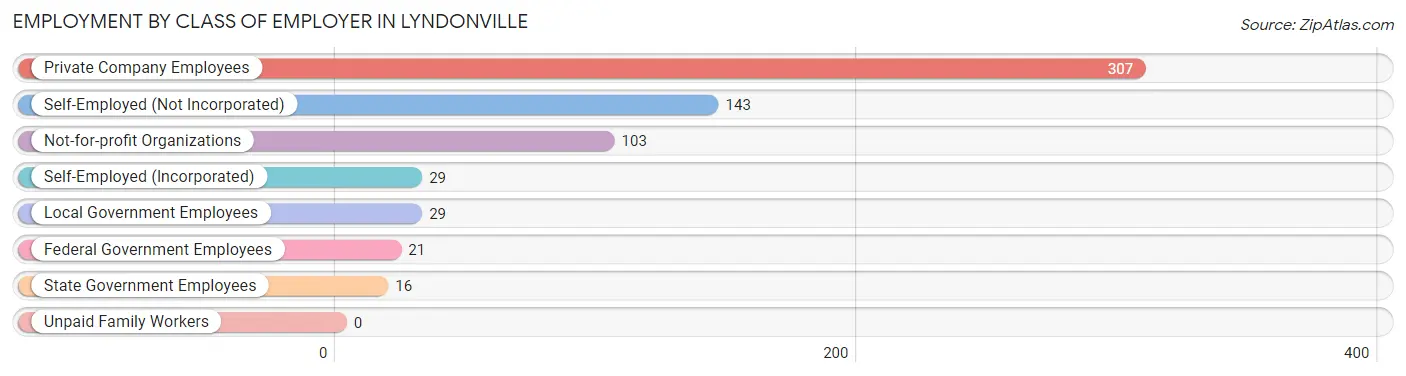
| Employer Class | # Employees | % Employees |
| Private Company Employees | 307 | 47.4% |
| Self-Employed (Incorporated) | 29 | 4.5% |
| Self-Employed (Not Incorporated) | 143 | 22.1% |
| Not-for-profit Organizations | 103 | 15.9% |
| Local Government Employees | 29 | 4.5% |
| State Government Employees | 16 | 2.5% |
| Federal Government Employees | 21 | 3.2% |
| Unpaid Family Workers | 0 | 0.0% |
| Total | 648 | 100.0% |
Employment Status by Age in Lyndonville
According to the labor force statistics for Lyndonville, out of the total population over 16 years of age (952), 70.8% or 674 individuals are in the labor force, with 2.8% or 19 of them unemployed. The age group with the highest labor force participation rate is 20 to 24 years, with 100.0% or 86 individuals in the labor force. Within the labor force, the 65 to 74 years age range has the highest percentage of unemployed individuals, with 19.4% or 7 of them being unemployed.
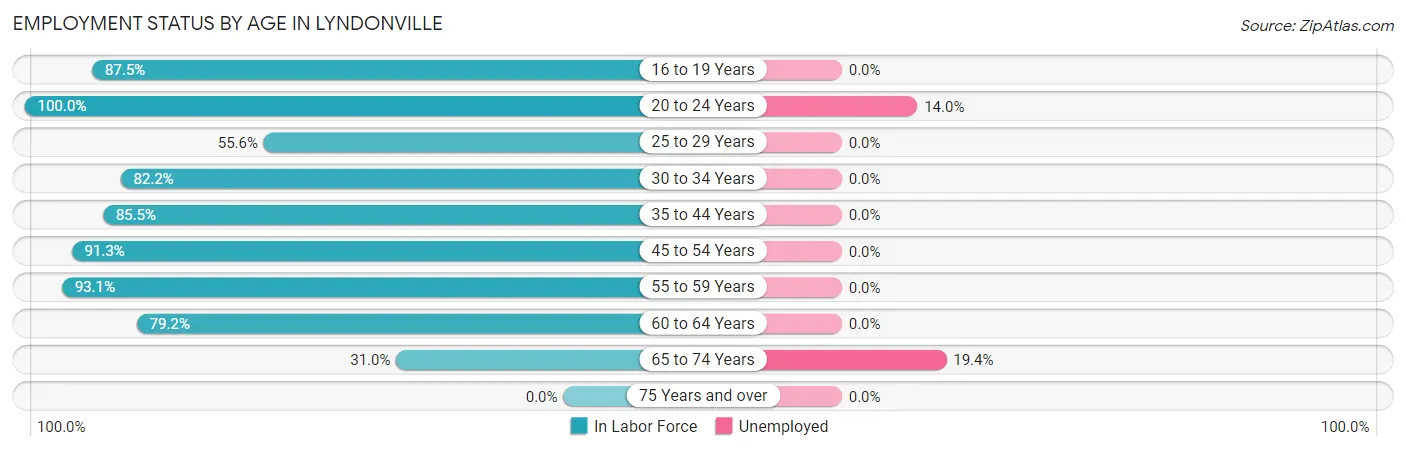
| Age Bracket | In Labor Force | Unemployed |
| 16 to 19 Years | 35 (87.5%) | 0 (0.0%) |
| 20 to 24 Years | 86 (100.0%) | 12 (14.0%) |
| 25 to 29 Years | 89 (55.6%) | 0 (0.0%) |
| 30 to 34 Years | 74 (82.2%) | 0 (0.0%) |
| 35 to 44 Years | 94 (85.5%) | 0 (0.0%) |
| 45 to 54 Years | 42 (91.3%) | 0 (0.0%) |
| 55 to 59 Years | 176 (93.1%) | 0 (0.0%) |
| 60 to 64 Years | 42 (79.2%) | 0 (0.0%) |
| 65 to 74 Years | 36 (31.0%) | 7 (19.4%) |
| 75 Years and over | 0 (0.0%) | 0 (0.0%) |
| Total | 674 (70.8%) | 19 (2.8%) |
Employment Status by Educational Attainment in Lyndonville
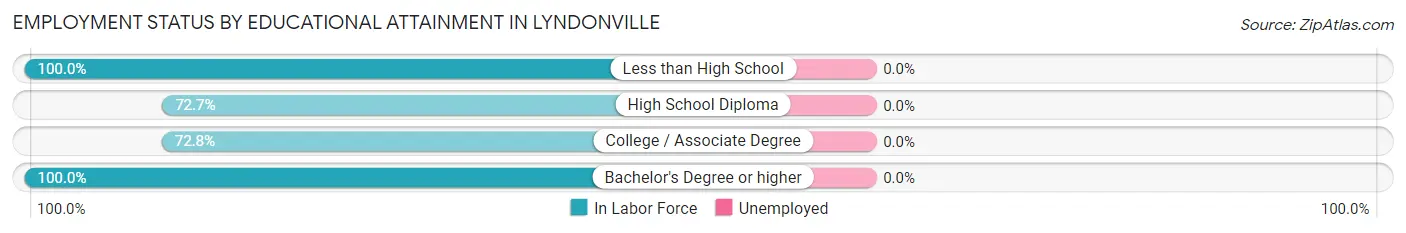
| Educational Attainment | In Labor Force | Unemployed |
| Less than High School | 46 (100.0%) | 0 (0.0%) |
| High School Diploma | 168 (72.7%) | 0 (0.0%) |
| College / Associate Degree | 182 (72.8%) | 0 (0.0%) |
| Bachelor's Degree or higher | 121 (100.0%) | 0 (0.0%) |
| Total | 517 (79.8%) | 0 (0.0%) |
Employment Occupations by Sex in Lyndonville
Management, Business, Science and Arts Occupations
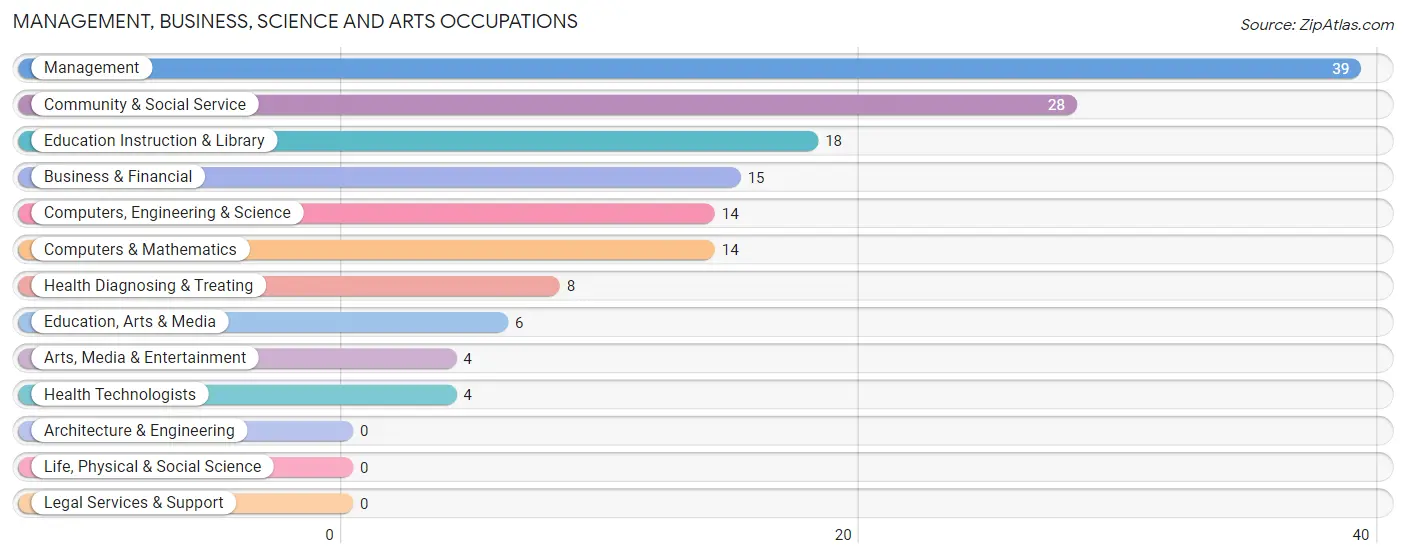
The most common Management, Business, Science and Arts occupations in Lyndonville are Management (39 | 5.9%), Community & Social Service (28 | 4.3%), Education Instruction & Library (18 | 2.8%), Business & Financial (15 | 2.3%), and Computers, Engineering & Science (14 | 2.1%).
Management, Business, Science and Arts Occupations by Sex
Within the Management, Business, Science and Arts occupations in Lyndonville, the most male-oriented occupations are Business & Financial (100.0%), Arts, Media & Entertainment (100.0%), and Computers, Engineering & Science (78.6%), while the most female-oriented occupations are Education, Arts & Media (100.0%), Education Instruction & Library (100.0%), and Health Diagnosing & Treating (100.0%).
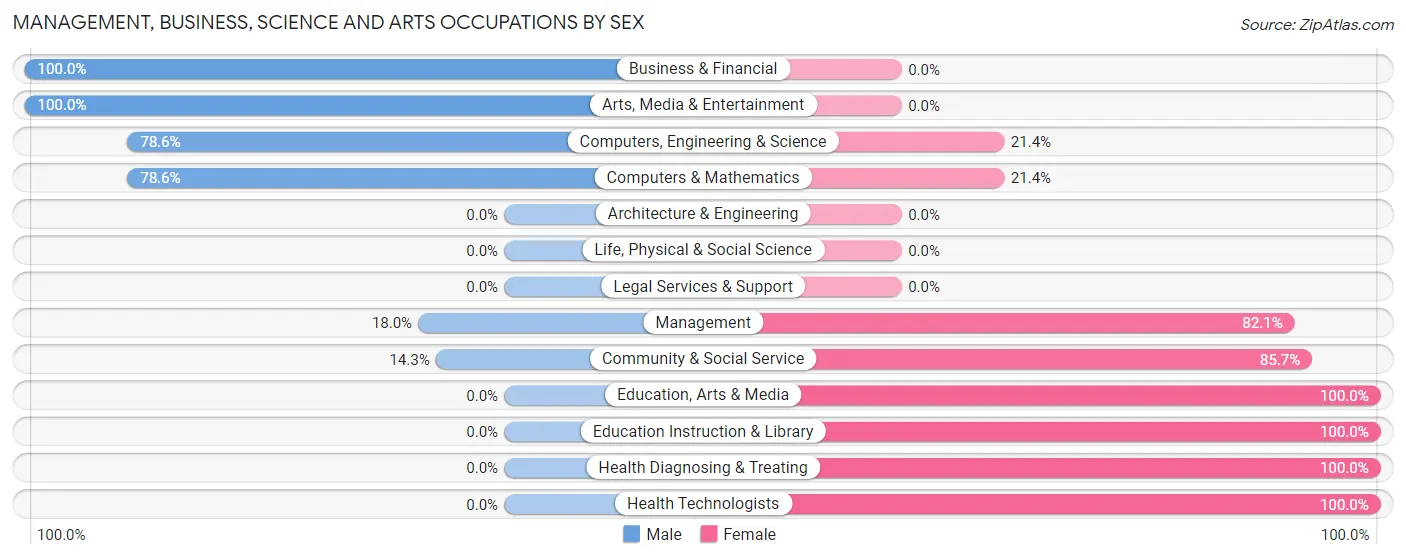
| Occupation | Male | Female |
| Management | 7 (17.9%) | 32 (82.1%) |
| Business & Financial | 15 (100.0%) | 0 (0.0%) |
| Computers, Engineering & Science | 11 (78.6%) | 3 (21.4%) |
| Computers & Mathematics | 11 (78.6%) | 3 (21.4%) |
| Architecture & Engineering | 0 (0.0%) | 0 (0.0%) |
| Life, Physical & Social Science | 0 (0.0%) | 0 (0.0%) |
| Community & Social Service | 4 (14.3%) | 24 (85.7%) |
| Education, Arts & Media | 0 (0.0%) | 6 (100.0%) |
| Legal Services & Support | 0 (0.0%) | 0 (0.0%) |
| Education Instruction & Library | 0 (0.0%) | 18 (100.0%) |
| Arts, Media & Entertainment | 4 (100.0%) | 0 (0.0%) |
| Health Diagnosing & Treating | 0 (0.0%) | 8 (100.0%) |
| Health Technologists | 0 (0.0%) | 4 (100.0%) |
| Total (Category) | 37 (35.6%) | 67 (64.4%) |
| Total (Overall) | 333 (50.8%) | 322 (49.2%) |
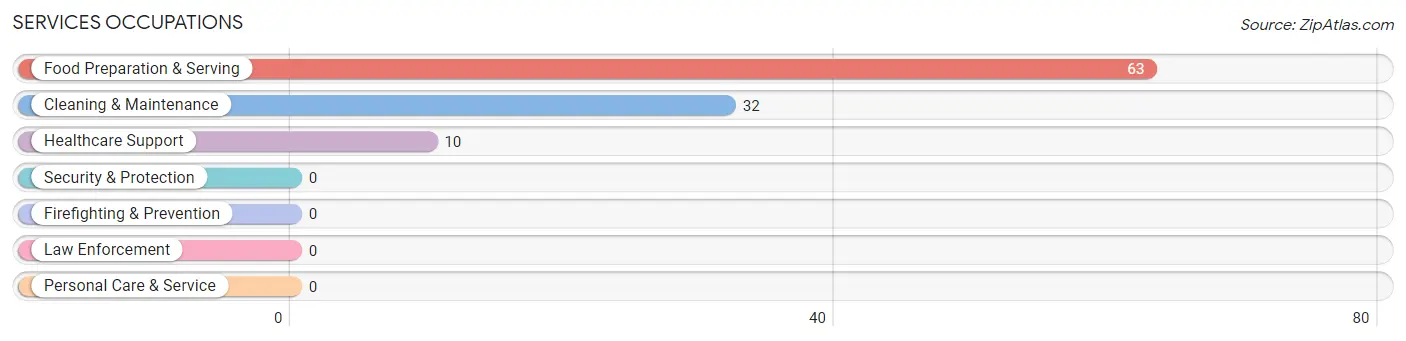
Services Occupations
The most common Services occupations in Lyndonville are Food Preparation & Serving (63 | 9.6%), Cleaning & Maintenance (32 | 4.9%), and Healthcare Support (10 | 1.5%).
Services Occupations by Sex
Within the Services occupations in Lyndonville, the most male-oriented occupations are Cleaning & Maintenance (87.5%), and Food Preparation & Serving (47.6%), while the most female-oriented occupations are Healthcare Support (100.0%), Food Preparation & Serving (52.4%), and Cleaning & Maintenance (12.5%).
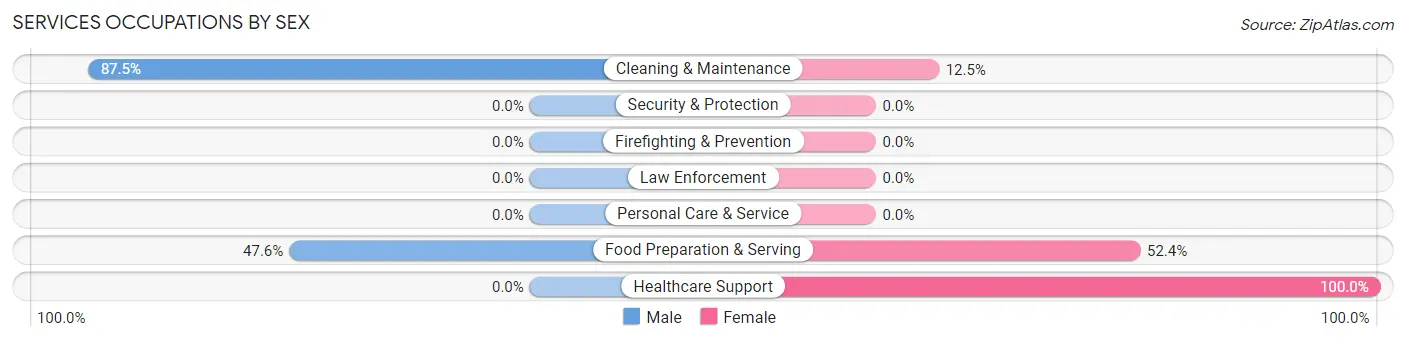
| Occupation | Male | Female |
| Healthcare Support | 0 (0.0%) | 10 (100.0%) |
| Security & Protection | 0 (0.0%) | 0 (0.0%) |
| Firefighting & Prevention | 0 (0.0%) | 0 (0.0%) |
| Law Enforcement | 0 (0.0%) | 0 (0.0%) |
| Food Preparation & Serving | 30 (47.6%) | 33 (52.4%) |
| Cleaning & Maintenance | 28 (87.5%) | 4 (12.5%) |
| Personal Care & Service | 0 (0.0%) | 0 (0.0%) |
| Total (Category) | 58 (55.2%) | 47 (44.8%) |
| Total (Overall) | 333 (50.8%) | 322 (49.2%) |
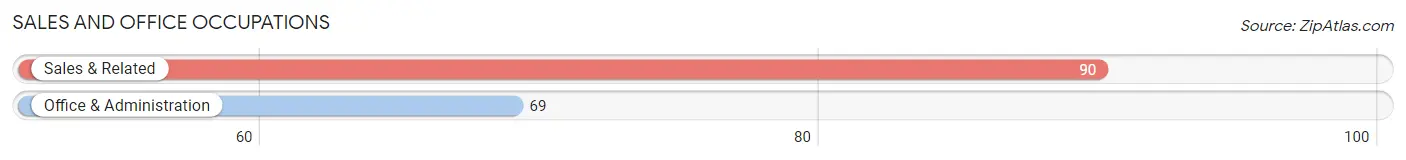
Sales and Office Occupations
The most common Sales and Office occupations in Lyndonville are Sales & Related (90 | 13.7%), and Office & Administration (69 | 10.5%).
Sales and Office Occupations by Sex
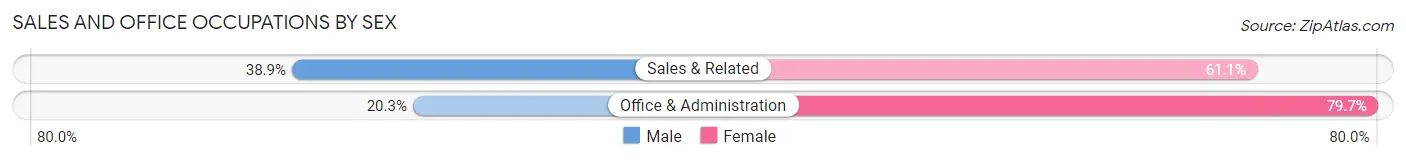
| Occupation | Male | Female |
| Sales & Related | 35 (38.9%) | 55 (61.1%) |
| Office & Administration | 14 (20.3%) | 55 (79.7%) |
| Total (Category) | 49 (30.8%) | 110 (69.2%) |
| Total (Overall) | 333 (50.8%) | 322 (49.2%) |
Natural Resources, Construction and Maintenance Occupations
The most common Natural Resources, Construction and Maintenance occupations in Lyndonville are Construction & Extraction (142 | 21.7%), Installation, Maintenance & Repair (15 | 2.3%), and Farming, Fishing & Forestry (5 | 0.8%).
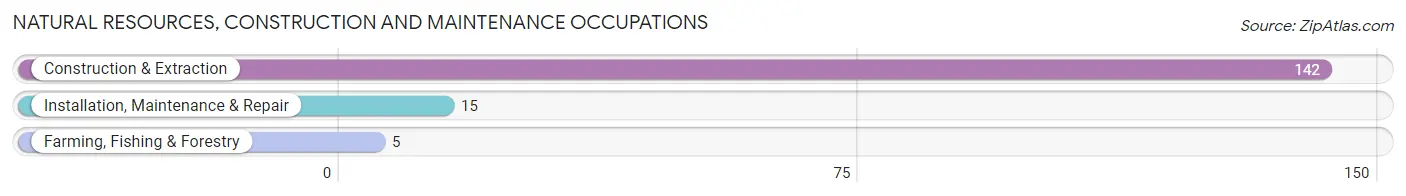
Natural Resources, Construction and Maintenance Occupations by Sex

| Occupation | Male | Female |
| Farming, Fishing & Forestry | 5 (100.0%) | 0 (0.0%) |
| Construction & Extraction | 69 (48.6%) | 73 (51.4%) |
| Installation, Maintenance & Repair | 15 (100.0%) | 0 (0.0%) |
| Total (Category) | 89 (54.9%) | 73 (45.1%) |
| Total (Overall) | 333 (50.8%) | 322 (49.2%) |
Production, Transportation and Moving Occupations
The most common Production, Transportation and Moving occupations in Lyndonville are Material Moving (59 | 9.0%), Production (49 | 7.5%), and Transportation (17 | 2.6%).
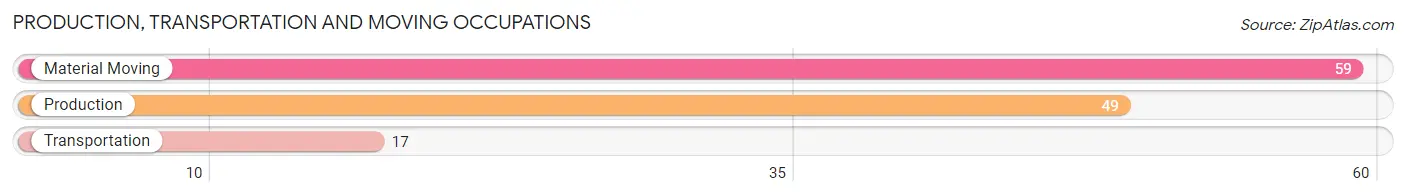
Production, Transportation and Moving Occupations by Sex
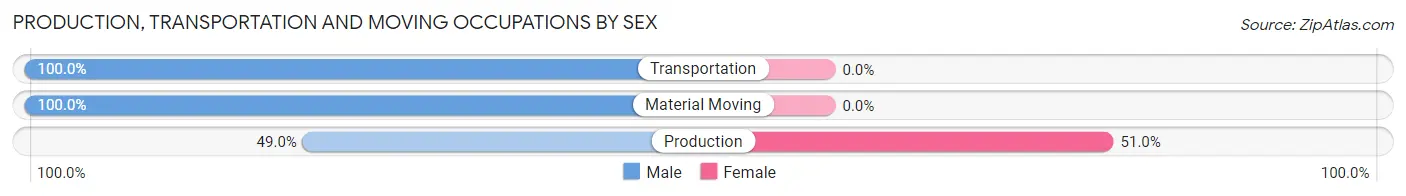
| Occupation | Male | Female |
| Production | 24 (49.0%) | 25 (51.0%) |
| Transportation | 17 (100.0%) | 0 (0.0%) |
| Material Moving | 59 (100.0%) | 0 (0.0%) |
| Total (Category) | 100 (80.0%) | 25 (20.0%) |
| Total (Overall) | 333 (50.8%) | 322 (49.2%) |
Employment Industries by Sex in Lyndonville
Employment Industries in Lyndonville
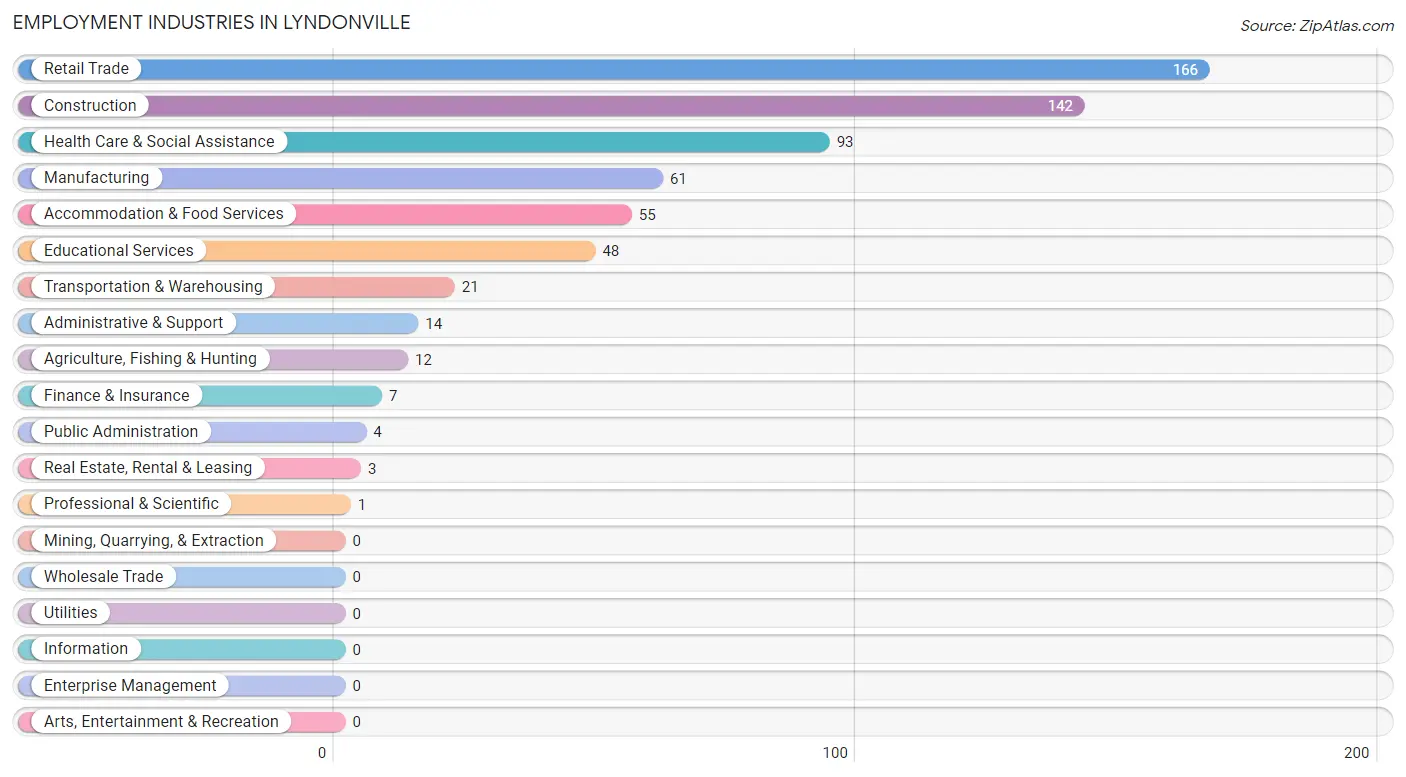
The major employment industries in Lyndonville include Retail Trade (166 | 25.3%), Construction (142 | 21.7%), Health Care & Social Assistance (93 | 14.2%), Manufacturing (61 | 9.3%), and Accommodation & Food Services (55 | 8.4%).
Employment Industries by Sex in Lyndonville
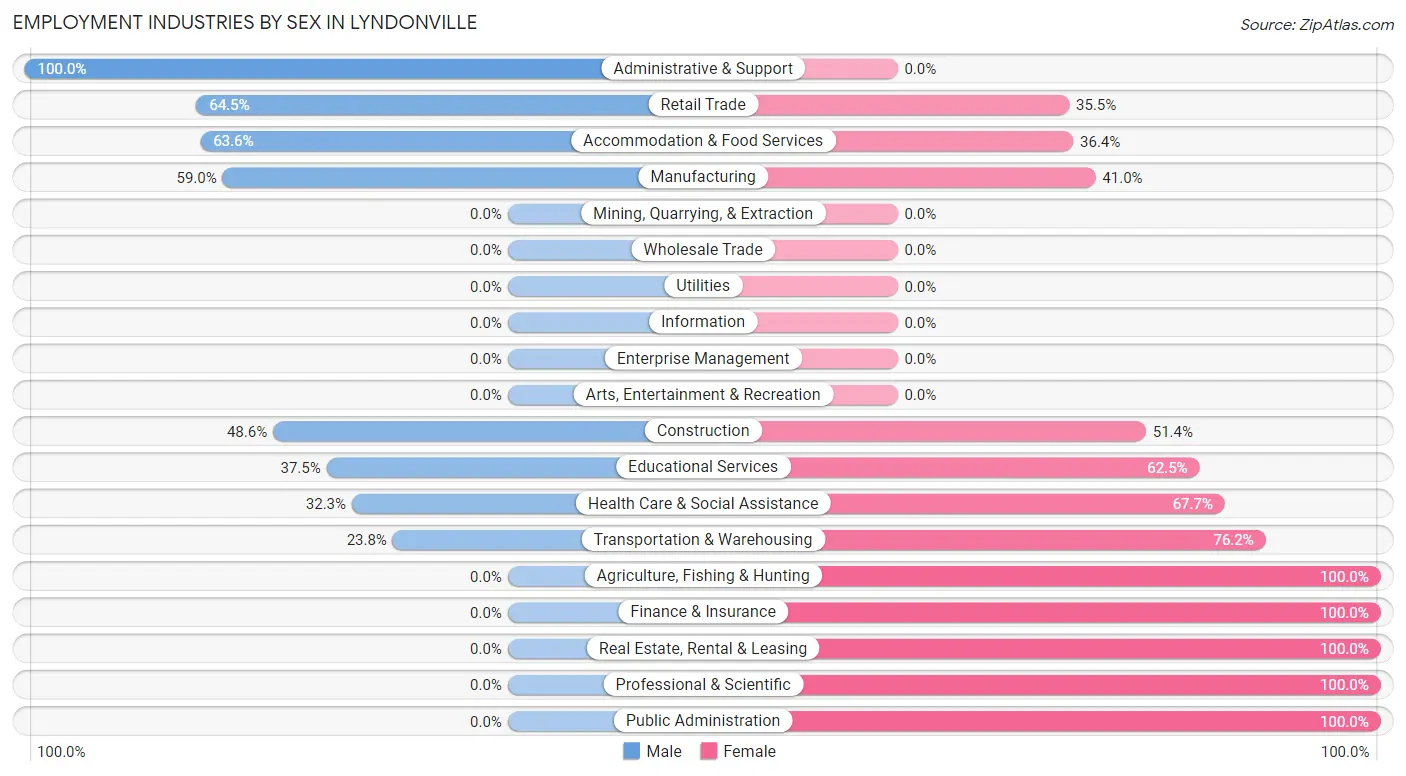
The Lyndonville industries that see more men than women are Administrative & Support (100.0%), Retail Trade (64.5%), and Accommodation & Food Services (63.6%), whereas the industries that tend to have a higher number of women are Agriculture, Fishing & Hunting (100.0%), Finance & Insurance (100.0%), and Real Estate, Rental & Leasing (100.0%).
| Industry | Male | Female |
| Agriculture, Fishing & Hunting | 0 (0.0%) | 12 (100.0%) |
| Mining, Quarrying, & Extraction | 0 (0.0%) | 0 (0.0%) |
| Construction | 69 (48.6%) | 73 (51.4%) |
| Manufacturing | 36 (59.0%) | 25 (41.0%) |
| Wholesale Trade | 0 (0.0%) | 0 (0.0%) |
| Retail Trade | 107 (64.5%) | 59 (35.5%) |
| Transportation & Warehousing | 5 (23.8%) | 16 (76.2%) |
| Utilities | 0 (0.0%) | 0 (0.0%) |
| Information | 0 (0.0%) | 0 (0.0%) |
| Finance & Insurance | 0 (0.0%) | 7 (100.0%) |
| Real Estate, Rental & Leasing | 0 (0.0%) | 3 (100.0%) |
| Professional & Scientific | 0 (0.0%) | 1 (100.0%) |
| Enterprise Management | 0 (0.0%) | 0 (0.0%) |
| Administrative & Support | 14 (100.0%) | 0 (0.0%) |
| Educational Services | 18 (37.5%) | 30 (62.5%) |
| Health Care & Social Assistance | 30 (32.3%) | 63 (67.7%) |
| Arts, Entertainment & Recreation | 0 (0.0%) | 0 (0.0%) |
| Accommodation & Food Services | 35 (63.6%) | 20 (36.4%) |
| Public Administration | 0 (0.0%) | 4 (100.0%) |
| Total | 333 (50.8%) | 322 (49.2%) |
Education in Lyndonville
School Enrollment in Lyndonville
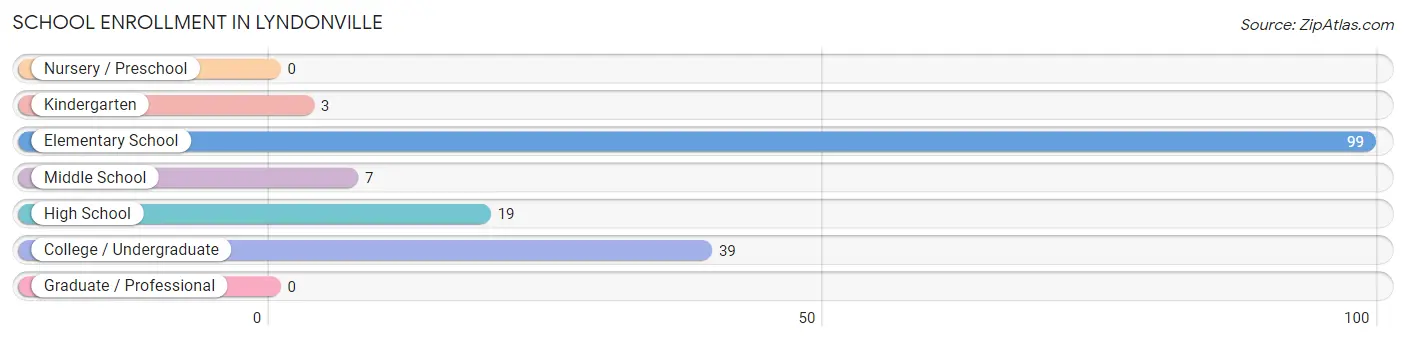
The most common levels of schooling among the 167 students in Lyndonville are elementary school (99 | 59.3%), college / undergraduate (39 | 23.4%), and high school (19 | 11.4%).
| School Level | # Students | % Students |
| Nursery / Preschool | 0 | 0.0% |
| Kindergarten | 3 | 1.8% |
| Elementary School | 99 | 59.3% |
| Middle School | 7 | 4.2% |
| High School | 19 | 11.4% |
| College / Undergraduate | 39 | 23.4% |
| Graduate / Professional | 0 | 0.0% |
| Total | 167 | 100.0% |
School Enrollment by Age by Funding Source in Lyndonville
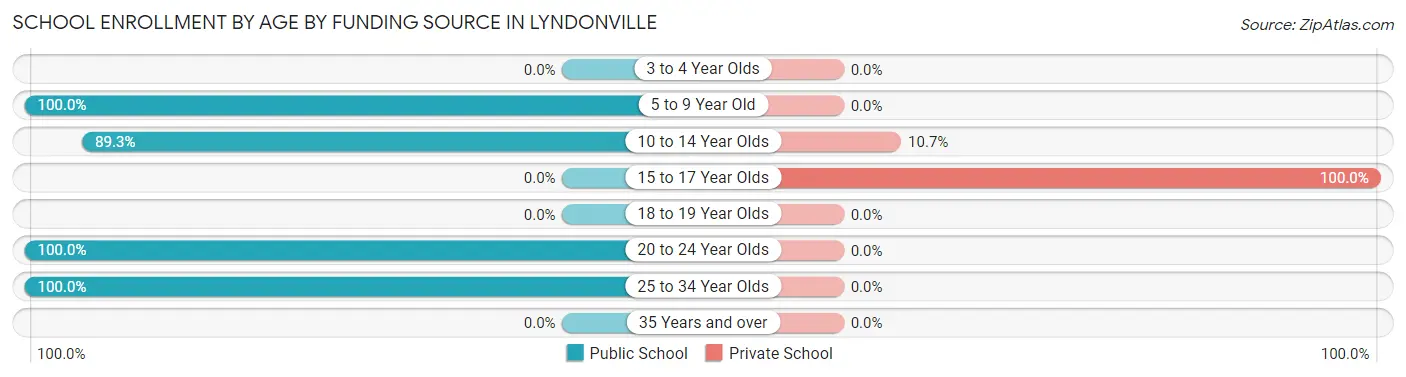
Out of a total of 167 students who are enrolled in schools in Lyndonville, 22 (13.2%) attend a private institution, while the remaining 145 (86.8%) are enrolled in public schools. The age group of 15 to 17 year olds has the highest likelihood of being enrolled in private schools, with 19 (100.0% in the age bracket) enrolled. Conversely, the age group of 5 to 9 year old has the lowest likelihood of being enrolled in a private school, with 81 (100.0% in the age bracket) attending a public institution.
| Age Bracket | Public School | Private School |
| 3 to 4 Year Olds | 0 (0.0%) | 0 (0.0%) |
| 5 to 9 Year Old | 81 (100.0%) | 0 (0.0%) |
| 10 to 14 Year Olds | 25 (89.3%) | 3 (10.7%) |
| 15 to 17 Year Olds | 0 (0.0%) | 19 (100.0%) |
| 18 to 19 Year Olds | 0 (0.0%) | 0 (0.0%) |
| 20 to 24 Year Olds | 23 (100.0%) | 0 (0.0%) |
| 25 to 34 Year Olds | 16 (100.0%) | 0 (0.0%) |
| 35 Years and over | 0 (0.0%) | 0 (0.0%) |
| Total | 145 (86.8%) | 22 (13.2%) |
Educational Attainment by Field of Study in Lyndonville
Business (52 | 24.6%), science & technology (22 | 10.4%), arts & humanities (22 | 10.4%), physical & health sciences (20 | 9.5%), and education (19 | 9.0%) are the most common fields of study among 211 individuals in Lyndonville who have obtained a bachelor's degree or higher.
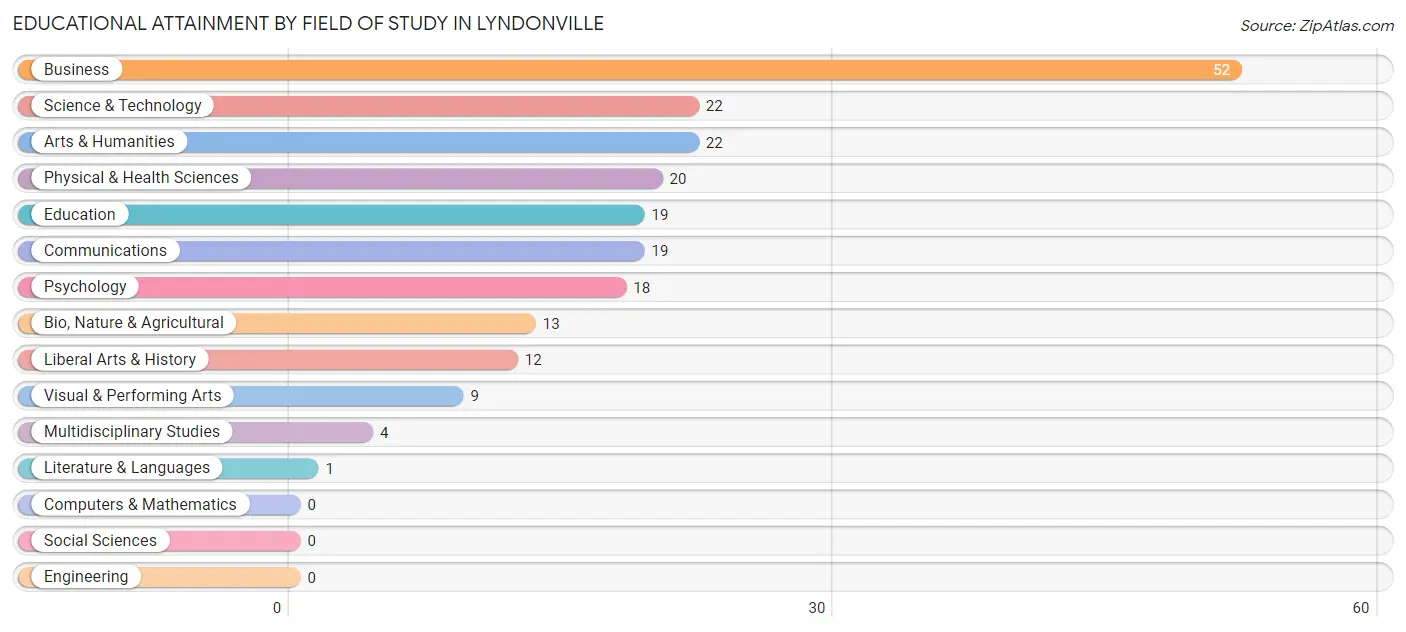
| Field of Study | # Graduates | % Graduates |
| Computers & Mathematics | 0 | 0.0% |
| Bio, Nature & Agricultural | 13 | 6.2% |
| Physical & Health Sciences | 20 | 9.5% |
| Psychology | 18 | 8.5% |
| Social Sciences | 0 | 0.0% |
| Engineering | 0 | 0.0% |
| Multidisciplinary Studies | 4 | 1.9% |
| Science & Technology | 22 | 10.4% |
| Business | 52 | 24.6% |
| Education | 19 | 9.0% |
| Literature & Languages | 1 | 0.5% |
| Liberal Arts & History | 12 | 5.7% |
| Visual & Performing Arts | 9 | 4.3% |
| Communications | 19 | 9.0% |
| Arts & Humanities | 22 | 10.4% |
| Total | 211 | 100.0% |
Transportation & Commute in Lyndonville
Vehicle Availability by Sex in Lyndonville
The most prevalent vehicle ownership categories in Lyndonville are males with 1 vehicle (115, accounting for 34.5%) and females with 1 vehicle (187, making up 36.5%).
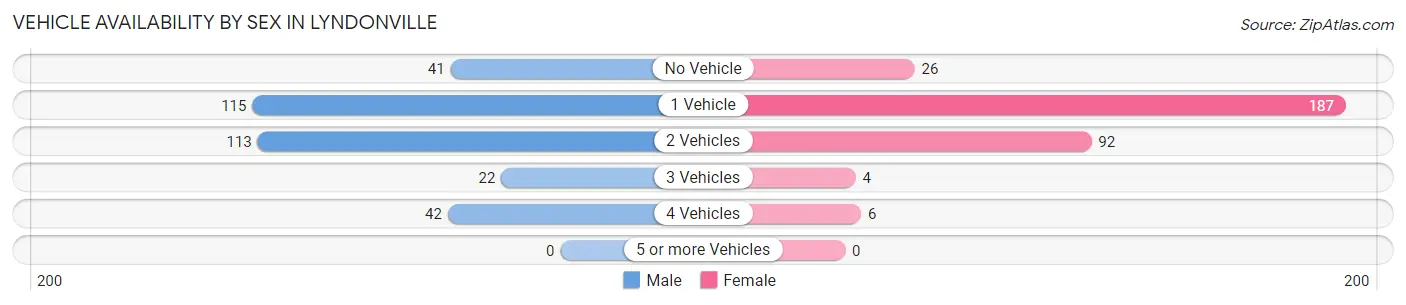
| Vehicles Available | Male | Female |
| No Vehicle | 41 (12.3%) | 26 (8.3%) |
| 1 Vehicle | 115 (34.5%) | 187 (59.4%) |
| 2 Vehicles | 113 (33.9%) | 92 (29.2%) |
| 3 Vehicles | 22 (6.6%) | 4 (1.3%) |
| 4 Vehicles | 42 (12.6%) | 6 (1.9%) |
| 5 or more Vehicles | 0 (0.0%) | 0 (0.0%) |
| Total | 333 (100.0%) | 315 (100.0%) |
Commute Time in Lyndonville
The most frequently occuring commute durations in Lyndonville are less than 5 minutes (240 commuters, 39.1%), 15 to 19 minutes (92 commuters, 15.0%), and 5 to 9 minutes (55 commuters, 9.0%).
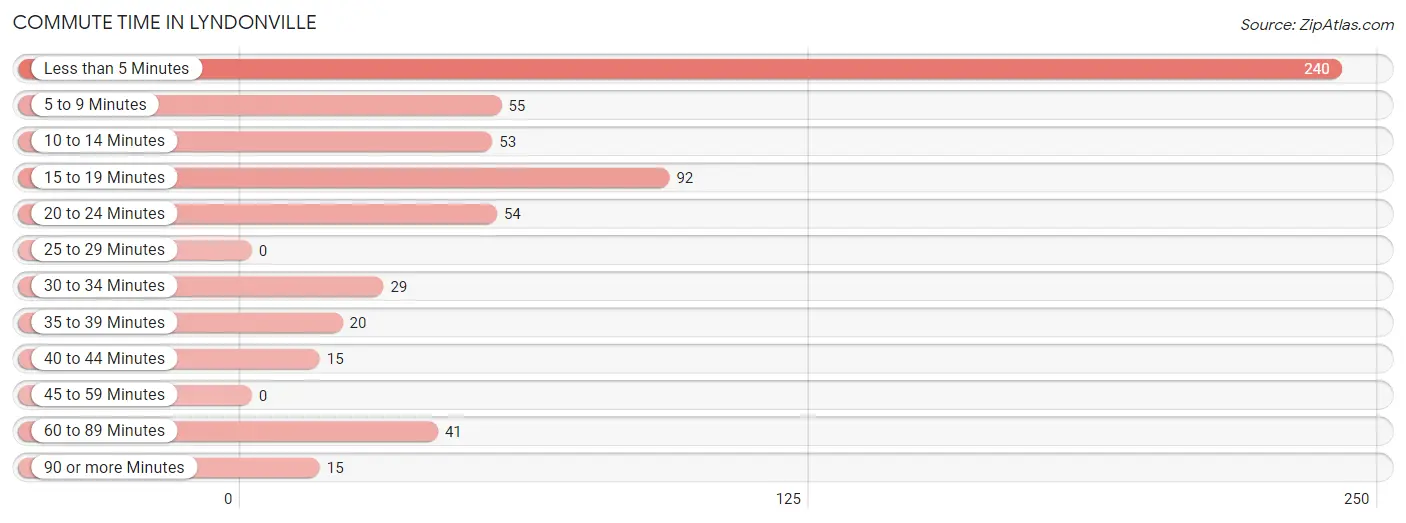
| Commute Time | # Commuters | % Commuters |
| Less than 5 Minutes | 240 | 39.1% |
| 5 to 9 Minutes | 55 | 9.0% |
| 10 to 14 Minutes | 53 | 8.6% |
| 15 to 19 Minutes | 92 | 15.0% |
| 20 to 24 Minutes | 54 | 8.8% |
| 25 to 29 Minutes | 0 | 0.0% |
| 30 to 34 Minutes | 29 | 4.7% |
| 35 to 39 Minutes | 20 | 3.3% |
| 40 to 44 Minutes | 15 | 2.4% |
| 45 to 59 Minutes | 0 | 0.0% |
| 60 to 89 Minutes | 41 | 6.7% |
| 90 or more Minutes | 15 | 2.4% |
Commute Time by Sex in Lyndonville
The most common commute times in Lyndonville are less than 5 minutes (155 commuters, 46.6%) for males and less than 5 minutes (85 commuters, 30.2%) for females.
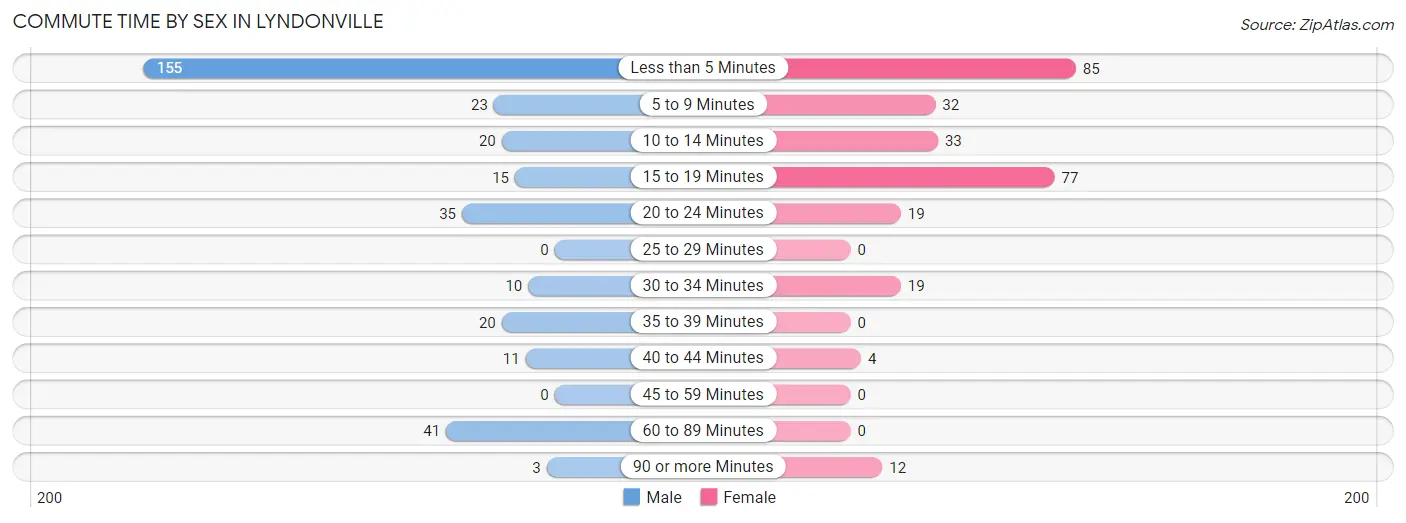
| Commute Time | Male | Female |
| Less than 5 Minutes | 155 (46.6%) | 85 (30.2%) |
| 5 to 9 Minutes | 23 (6.9%) | 32 (11.4%) |
| 10 to 14 Minutes | 20 (6.0%) | 33 (11.7%) |
| 15 to 19 Minutes | 15 (4.5%) | 77 (27.4%) |
| 20 to 24 Minutes | 35 (10.5%) | 19 (6.8%) |
| 25 to 29 Minutes | 0 (0.0%) | 0 (0.0%) |
| 30 to 34 Minutes | 10 (3.0%) | 19 (6.8%) |
| 35 to 39 Minutes | 20 (6.0%) | 0 (0.0%) |
| 40 to 44 Minutes | 11 (3.3%) | 4 (1.4%) |
| 45 to 59 Minutes | 0 (0.0%) | 0 (0.0%) |
| 60 to 89 Minutes | 41 (12.3%) | 0 (0.0%) |
| 90 or more Minutes | 3 (0.9%) | 12 (4.3%) |
Time of Departure to Work by Sex in Lyndonville
The most frequent times of departure to work in Lyndonville are 7:00 AM to 7:29 AM (108, 32.4%) for males and 8:00 AM to 8:29 AM (58, 20.6%) for females.
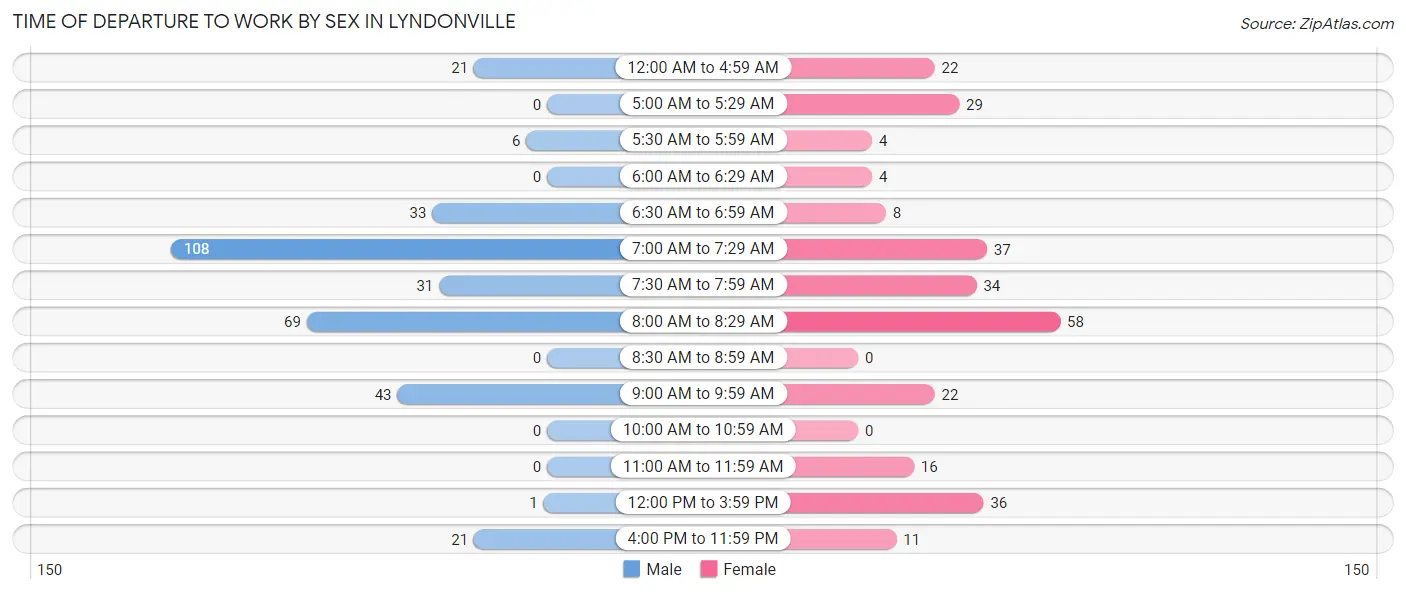
| Time of Departure | Male | Female |
| 12:00 AM to 4:59 AM | 21 (6.3%) | 22 (7.8%) |
| 5:00 AM to 5:29 AM | 0 (0.0%) | 29 (10.3%) |
| 5:30 AM to 5:59 AM | 6 (1.8%) | 4 (1.4%) |
| 6:00 AM to 6:29 AM | 0 (0.0%) | 4 (1.4%) |
| 6:30 AM to 6:59 AM | 33 (9.9%) | 8 (2.9%) |
| 7:00 AM to 7:29 AM | 108 (32.4%) | 37 (13.2%) |
| 7:30 AM to 7:59 AM | 31 (9.3%) | 34 (12.1%) |
| 8:00 AM to 8:29 AM | 69 (20.7%) | 58 (20.6%) |
| 8:30 AM to 8:59 AM | 0 (0.0%) | 0 (0.0%) |
| 9:00 AM to 9:59 AM | 43 (12.9%) | 22 (7.8%) |
| 10:00 AM to 10:59 AM | 0 (0.0%) | 0 (0.0%) |
| 11:00 AM to 11:59 AM | 0 (0.0%) | 16 (5.7%) |
| 12:00 PM to 3:59 PM | 1 (0.3%) | 36 (12.8%) |
| 4:00 PM to 11:59 PM | 21 (6.3%) | 11 (3.9%) |
| Total | 333 (100.0%) | 281 (100.0%) |
Housing Occupancy in Lyndonville
Occupancy by Ownership in Lyndonville
Of the total 537 dwellings in Lyndonville, owner-occupied units account for 267 (49.7%), while renter-occupied units make up 270 (50.3%).
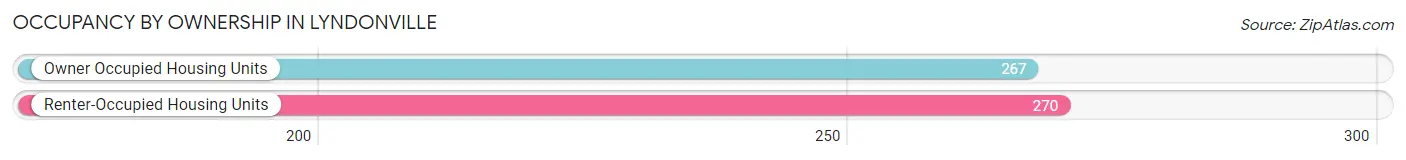
| Occupancy | # Housing Units | % Housing Units |
| Owner Occupied Housing Units | 267 | 49.7% |
| Renter-Occupied Housing Units | 270 | 50.3% |
| Total Occupied Housing Units | 537 | 100.0% |
Occupancy by Household Size in Lyndonville
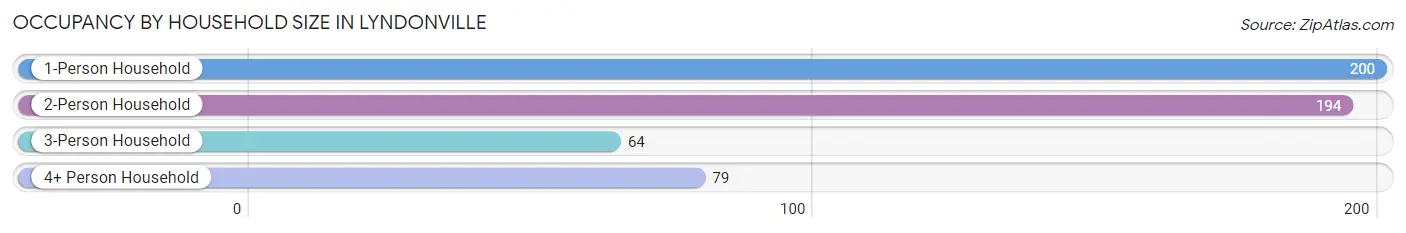
| Household Size | # Housing Units | % Housing Units |
| 1-Person Household | 200 | 37.2% |
| 2-Person Household | 194 | 36.1% |
| 3-Person Household | 64 | 11.9% |
| 4+ Person Household | 79 | 14.7% |
| Total Housing Units | 537 | 100.0% |
Occupancy by Ownership by Household Size in Lyndonville
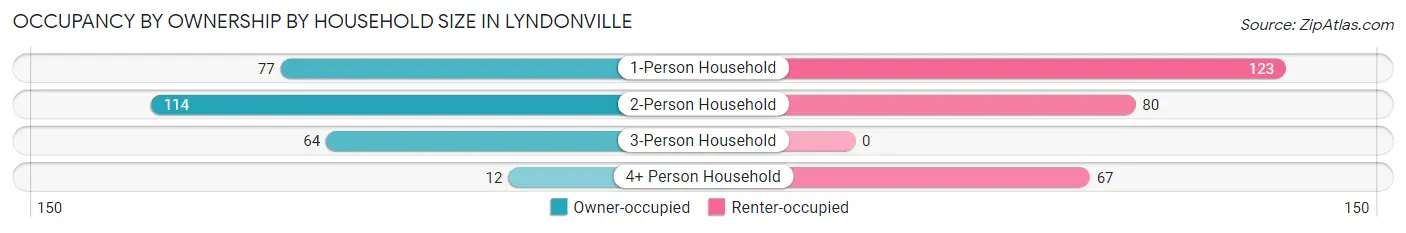
| Household Size | Owner-occupied | Renter-occupied |
| 1-Person Household | 77 (38.5%) | 123 (61.5%) |
| 2-Person Household | 114 (58.8%) | 80 (41.2%) |
| 3-Person Household | 64 (100.0%) | 0 (0.0%) |
| 4+ Person Household | 12 (15.2%) | 67 (84.8%) |
| Total Housing Units | 267 (49.7%) | 270 (50.3%) |
Occupancy by Educational Attainment in Lyndonville
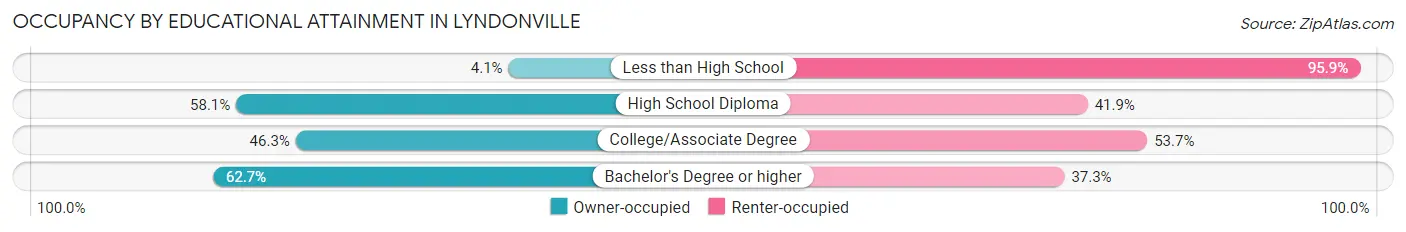
| Household Size | Owner-occupied | Renter-occupied |
| Less than High School | 2 (4.1%) | 47 (95.9%) |
| High School Diploma | 72 (58.1%) | 52 (41.9%) |
| College/Associate Degree | 99 (46.3%) | 115 (53.7%) |
| Bachelor's Degree or higher | 94 (62.7%) | 56 (37.3%) |
Occupancy by Age of Householder in Lyndonville
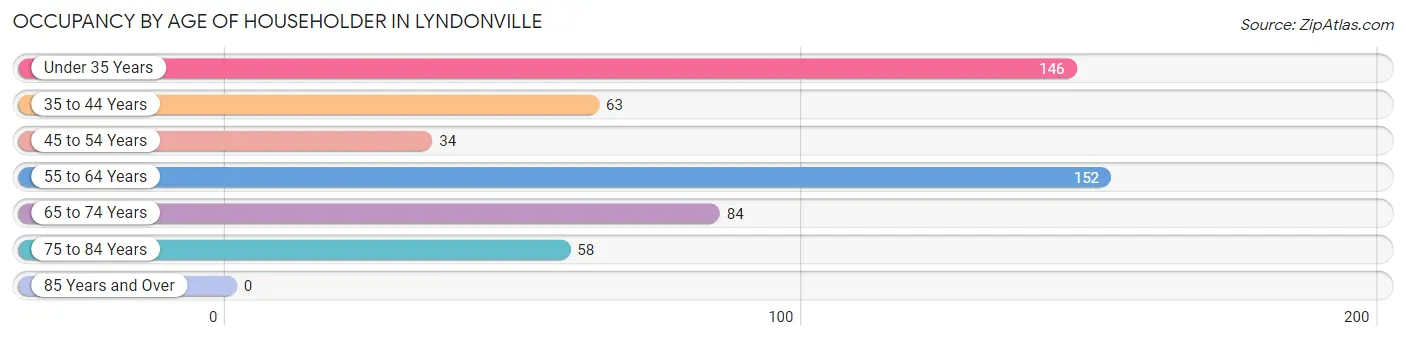
| Age Bracket | # Households | % Households |
| Under 35 Years | 146 | 27.2% |
| 35 to 44 Years | 63 | 11.7% |
| 45 to 54 Years | 34 | 6.3% |
| 55 to 64 Years | 152 | 28.3% |
| 65 to 74 Years | 84 | 15.6% |
| 75 to 84 Years | 58 | 10.8% |
| 85 Years and Over | 0 | 0.0% |
| Total | 537 | 100.0% |
Housing Finances in Lyndonville
Median Income by Occupancy in Lyndonville
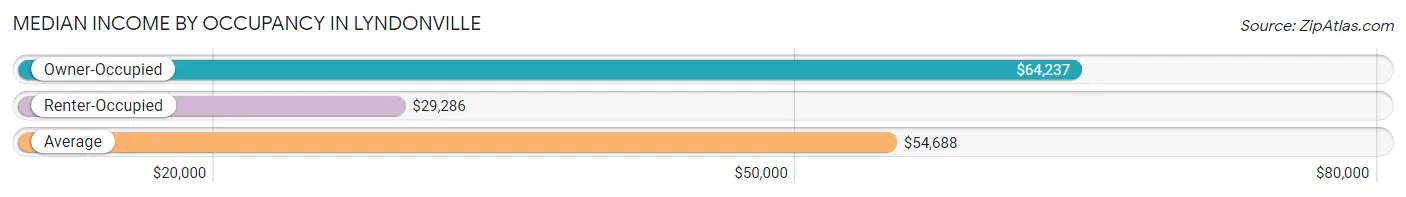
| Occupancy Type | # Households | Median Income |
| Owner-Occupied | 267 (49.7%) | $64,237 |
| Renter-Occupied | 270 (50.3%) | $29,286 |
| Average | 537 (100.0%) | $54,688 |
Occupancy by Householder Income Bracket in Lyndonville
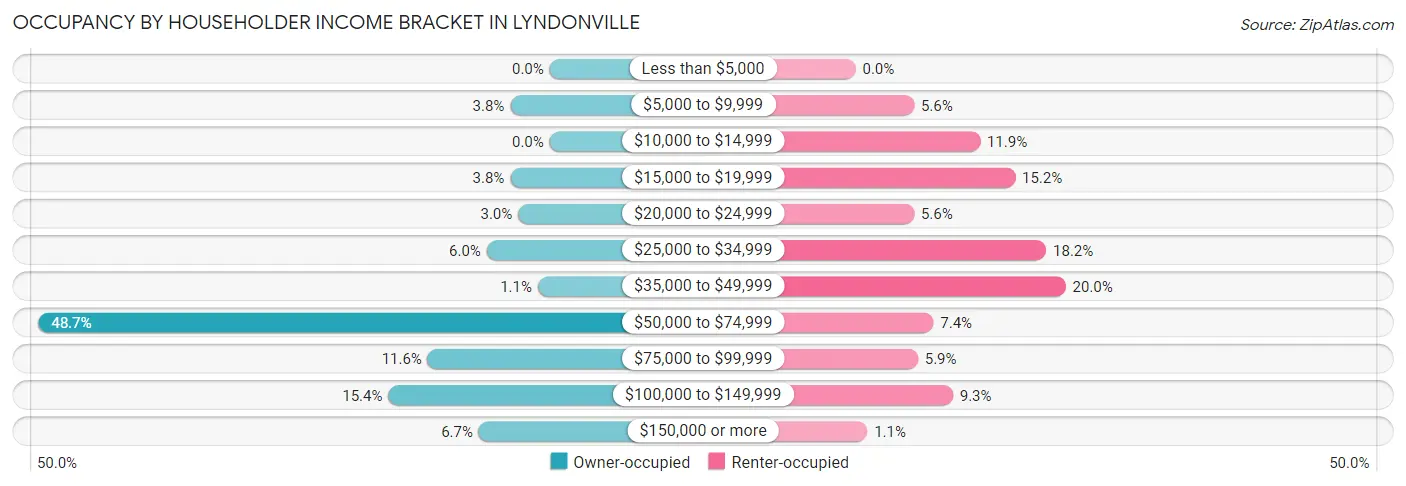
| Income Bracket | Owner-occupied | Renter-occupied |
| Less than $5,000 | 0 (0.0%) | 0 (0.0%) |
| $5,000 to $9,999 | 10 (3.7%) | 15 (5.6%) |
| $10,000 to $14,999 | 0 (0.0%) | 32 (11.8%) |
| $15,000 to $19,999 | 10 (3.7%) | 41 (15.2%) |
| $20,000 to $24,999 | 8 (3.0%) | 15 (5.6%) |
| $25,000 to $34,999 | 16 (6.0%) | 49 (18.1%) |
| $35,000 to $49,999 | 3 (1.1%) | 54 (20.0%) |
| $50,000 to $74,999 | 130 (48.7%) | 20 (7.4%) |
| $75,000 to $99,999 | 31 (11.6%) | 16 (5.9%) |
| $100,000 to $149,999 | 41 (15.4%) | 25 (9.3%) |
| $150,000 or more | 18 (6.7%) | 3 (1.1%) |
| Total | 267 (100.0%) | 270 (100.0%) |
Monthly Housing Cost Tiers in Lyndonville
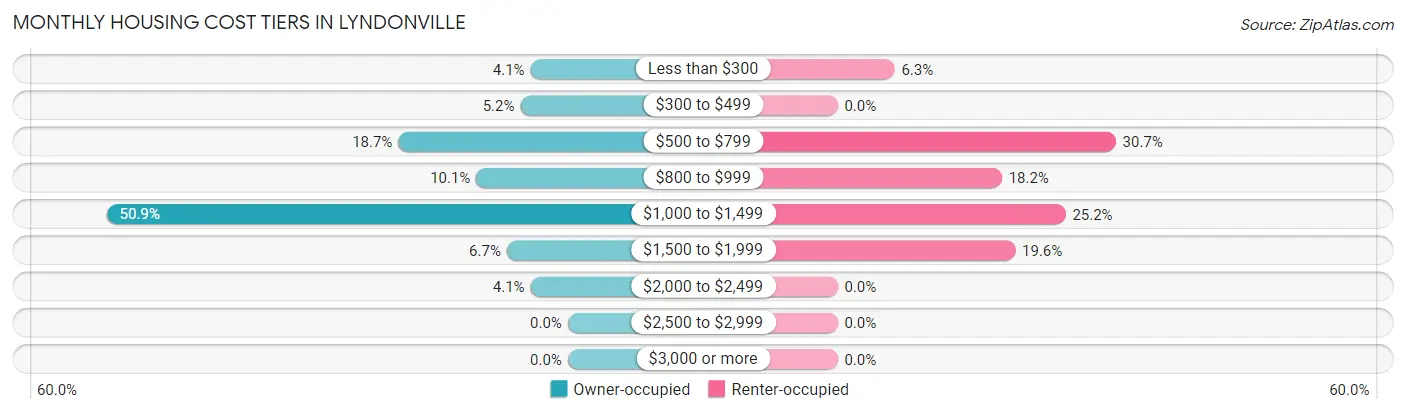
| Monthly Cost | Owner-occupied | Renter-occupied |
| Less than $300 | 11 (4.1%) | 17 (6.3%) |
| $300 to $499 | 14 (5.2%) | 0 (0.0%) |
| $500 to $799 | 50 (18.7%) | 83 (30.7%) |
| $800 to $999 | 27 (10.1%) | 49 (18.1%) |
| $1,000 to $1,499 | 136 (50.9%) | 68 (25.2%) |
| $1,500 to $1,999 | 18 (6.7%) | 53 (19.6%) |
| $2,000 to $2,499 | 11 (4.1%) | 0 (0.0%) |
| $2,500 to $2,999 | 0 (0.0%) | 0 (0.0%) |
| $3,000 or more | 0 (0.0%) | 0 (0.0%) |
| Total | 267 (100.0%) | 270 (100.0%) |
Physical Housing Characteristics in Lyndonville
Housing Structures in Lyndonville
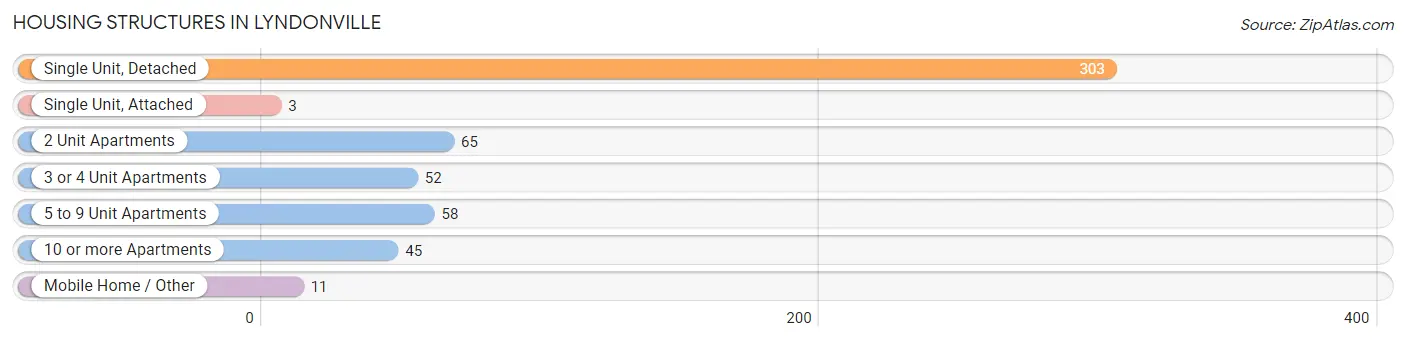
| Structure Type | # Housing Units | % Housing Units |
| Single Unit, Detached | 303 | 56.4% |
| Single Unit, Attached | 3 | 0.6% |
| 2 Unit Apartments | 65 | 12.1% |
| 3 or 4 Unit Apartments | 52 | 9.7% |
| 5 to 9 Unit Apartments | 58 | 10.8% |
| 10 or more Apartments | 45 | 8.4% |
| Mobile Home / Other | 11 | 2.1% |
| Total | 537 | 100.0% |
Housing Structures by Occupancy in Lyndonville
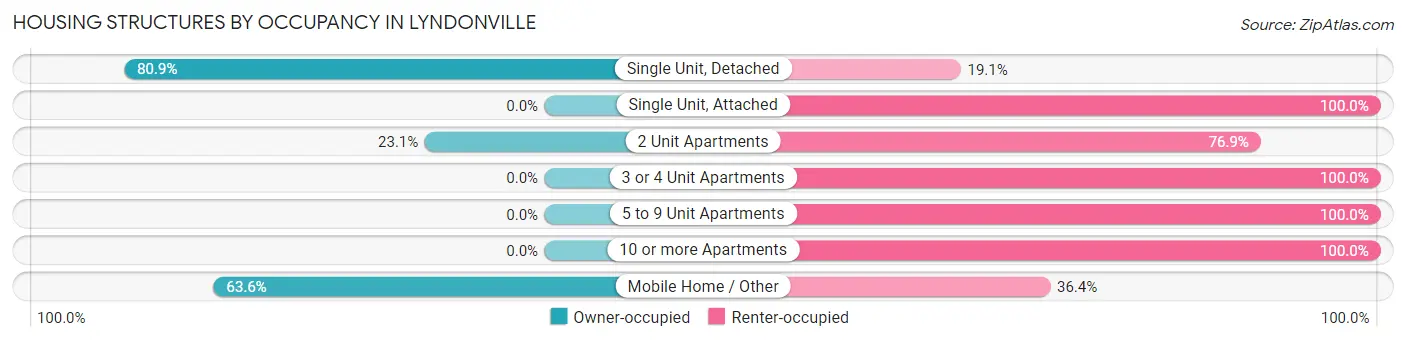
| Structure Type | Owner-occupied | Renter-occupied |
| Single Unit, Detached | 245 (80.9%) | 58 (19.1%) |
| Single Unit, Attached | 0 (0.0%) | 3 (100.0%) |
| 2 Unit Apartments | 15 (23.1%) | 50 (76.9%) |
| 3 or 4 Unit Apartments | 0 (0.0%) | 52 (100.0%) |
| 5 to 9 Unit Apartments | 0 (0.0%) | 58 (100.0%) |
| 10 or more Apartments | 0 (0.0%) | 45 (100.0%) |
| Mobile Home / Other | 7 (63.6%) | 4 (36.4%) |
| Total | 267 (49.7%) | 270 (50.3%) |
Housing Structures by Number of Rooms in Lyndonville
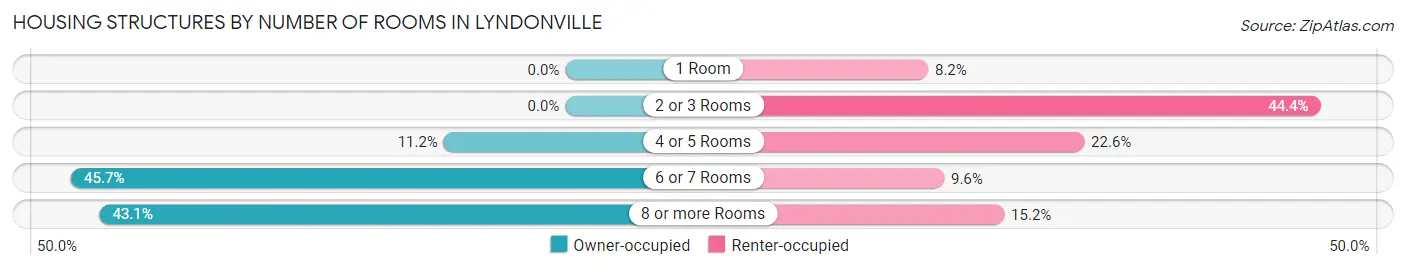
| Number of Rooms | Owner-occupied | Renter-occupied |
| 1 Room | 0 (0.0%) | 22 (8.2%) |
| 2 or 3 Rooms | 0 (0.0%) | 120 (44.4%) |
| 4 or 5 Rooms | 30 (11.2%) | 61 (22.6%) |
| 6 or 7 Rooms | 122 (45.7%) | 26 (9.6%) |
| 8 or more Rooms | 115 (43.1%) | 41 (15.2%) |
| Total | 267 (100.0%) | 270 (100.0%) |
Housing Structure by Heating Type in Lyndonville
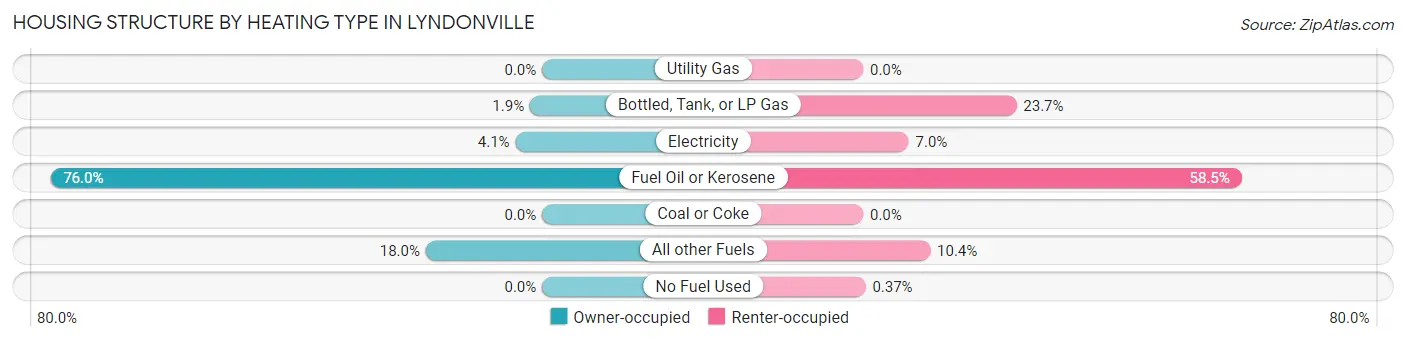
| Heating Type | Owner-occupied | Renter-occupied |
| Utility Gas | 0 (0.0%) | 0 (0.0%) |
| Bottled, Tank, or LP Gas | 5 (1.9%) | 64 (23.7%) |
| Electricity | 11 (4.1%) | 19 (7.0%) |
| Fuel Oil or Kerosene | 203 (76.0%) | 158 (58.5%) |
| Coal or Coke | 0 (0.0%) | 0 (0.0%) |
| All other Fuels | 48 (18.0%) | 28 (10.4%) |
| No Fuel Used | 0 (0.0%) | 1 (0.4%) |
| Total | 267 (100.0%) | 270 (100.0%) |
Household Vehicle Usage in Lyndonville
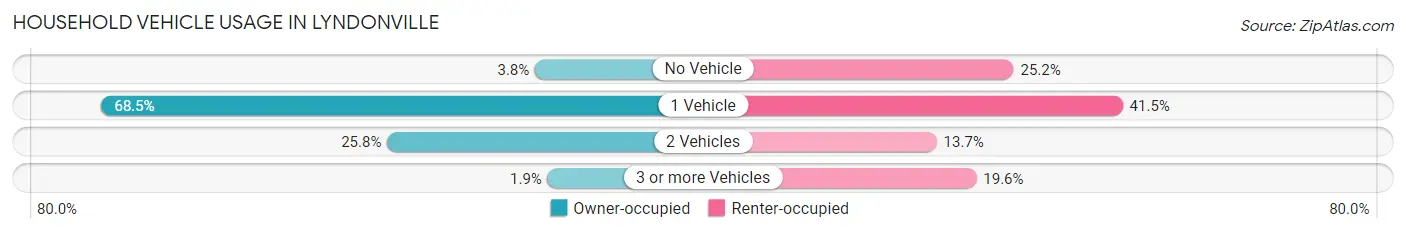
| Vehicles per Household | Owner-occupied | Renter-occupied |
| No Vehicle | 10 (3.7%) | 68 (25.2%) |
| 1 Vehicle | 183 (68.5%) | 112 (41.5%) |
| 2 Vehicles | 69 (25.8%) | 37 (13.7%) |
| 3 or more Vehicles | 5 (1.9%) | 53 (19.6%) |
| Total | 267 (100.0%) | 270 (100.0%) |
Real Estate & Mortgages in Lyndonville
Real Estate and Mortgage Overview in Lyndonville
| Characteristic | Without Mortgage | With Mortgage |
| Housing Units | 140 | 127 |
| Median Property Value | $311,400 | $147,100 |
| Median Household Income | $64,022 | $18 |
| Monthly Housing Costs | $990 | $0 |
| Real Estate Taxes | $5,332 | $0 |
Property Value by Mortgage Status in Lyndonville
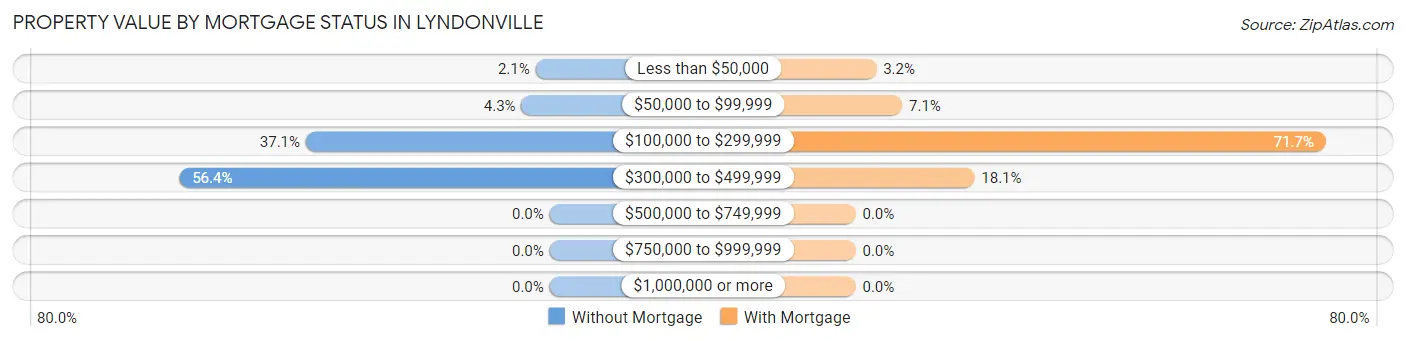
| Property Value | Without Mortgage | With Mortgage |
| Less than $50,000 | 3 (2.1%) | 4 (3.2%) |
| $50,000 to $99,999 | 6 (4.3%) | 9 (7.1%) |
| $100,000 to $299,999 | 52 (37.1%) | 91 (71.7%) |
| $300,000 to $499,999 | 79 (56.4%) | 23 (18.1%) |
| $500,000 to $749,999 | 0 (0.0%) | 0 (0.0%) |
| $750,000 to $999,999 | 0 (0.0%) | 0 (0.0%) |
| $1,000,000 or more | 0 (0.0%) | 0 (0.0%) |
| Total | 140 (100.0%) | 127 (100.0%) |
Household Income by Mortgage Status in Lyndonville
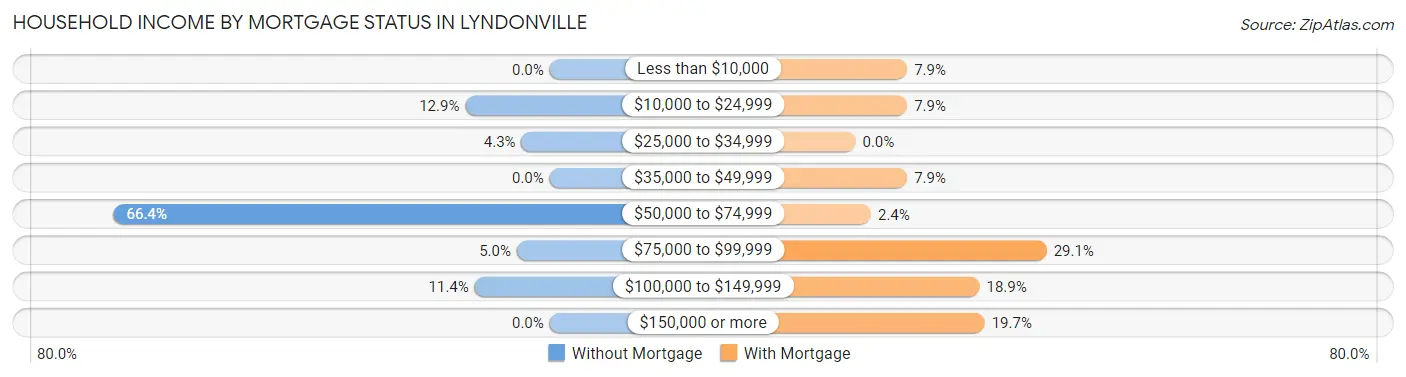
| Household Income | Without Mortgage | With Mortgage |
| Less than $10,000 | 0 (0.0%) | 10 (7.9%) |
| $10,000 to $24,999 | 18 (12.9%) | 10 (7.9%) |
| $25,000 to $34,999 | 6 (4.3%) | 0 (0.0%) |
| $35,000 to $49,999 | 0 (0.0%) | 10 (7.9%) |
| $50,000 to $74,999 | 93 (66.4%) | 3 (2.4%) |
| $75,000 to $99,999 | 7 (5.0%) | 37 (29.1%) |
| $100,000 to $149,999 | 16 (11.4%) | 24 (18.9%) |
| $150,000 or more | 0 (0.0%) | 25 (19.7%) |
| Total | 140 (100.0%) | 127 (100.0%) |
Property Value to Household Income Ratio in Lyndonville
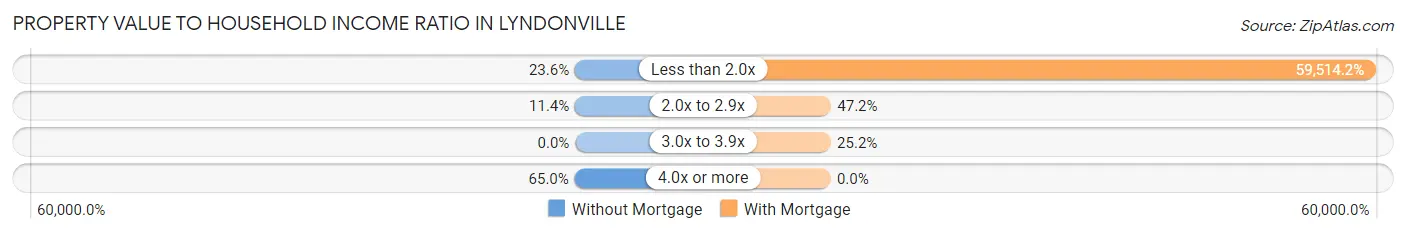
| Value-to-Income Ratio | Without Mortgage | With Mortgage |
| Less than 2.0x | 33 (23.6%) | 75,583 (59,514.2%) |
| 2.0x to 2.9x | 16 (11.4%) | 60 (47.2%) |
| 3.0x to 3.9x | 0 (0.0%) | 32 (25.2%) |
| 4.0x or more | 91 (65.0%) | 0 (0.0%) |
| Total | 140 (100.0%) | 127 (100.0%) |
Real Estate Taxes by Mortgage Status in Lyndonville
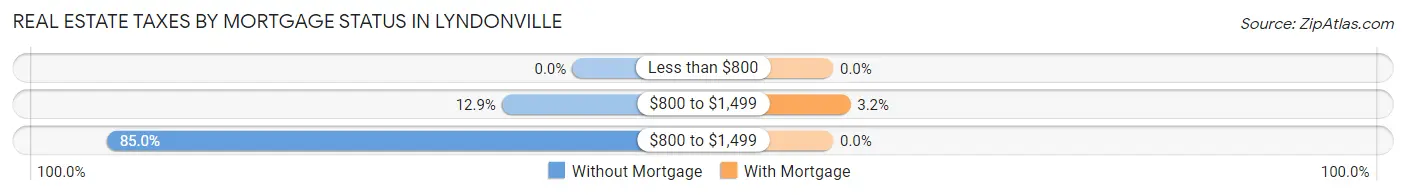
| Property Taxes | Without Mortgage | With Mortgage |
| Less than $800 | 0 (0.0%) | 0 (0.0%) |
| $800 to $1,499 | 18 (12.9%) | 4 (3.2%) |
| $800 to $1,499 | 119 (85.0%) | 0 (0.0%) |
| Total | 140 (100.0%) | 127 (100.0%) |
Health & Disability in Lyndonville
Health Insurance Coverage by Age in Lyndonville
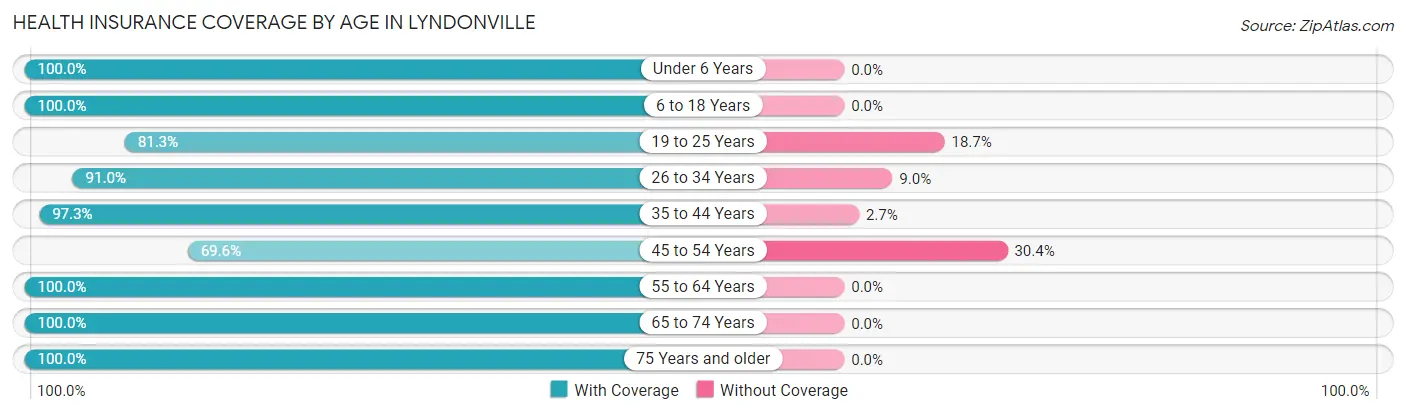
| Age Bracket | With Coverage | Without Coverage |
| Under 6 Years | 57 (100.0%) | 0 (0.0%) |
| 6 to 18 Years | 153 (100.0%) | 0 (0.0%) |
| 19 to 25 Years | 100 (81.3%) | 23 (18.7%) |
| 26 to 34 Years | 213 (91.0%) | 21 (9.0%) |
| 35 to 44 Years | 107 (97.3%) | 3 (2.7%) |
| 45 to 54 Years | 32 (69.6%) | 14 (30.4%) |
| 55 to 64 Years | 242 (100.0%) | 0 (0.0%) |
| 65 to 74 Years | 116 (100.0%) | 0 (0.0%) |
| 75 Years and older | 62 (100.0%) | 0 (0.0%) |
| Total | 1,082 (94.7%) | 61 (5.3%) |
Health Insurance Coverage by Citizenship Status in Lyndonville
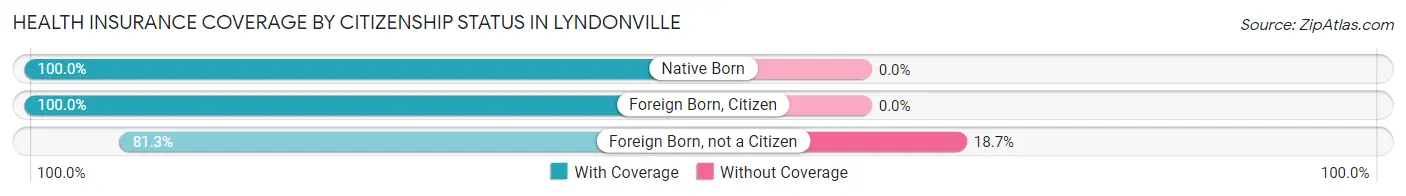
| Citizenship Status | With Coverage | Without Coverage |
| Native Born | 57 (100.0%) | 0 (0.0%) |
| Foreign Born, Citizen | 153 (100.0%) | 0 (0.0%) |
| Foreign Born, not a Citizen | 100 (81.3%) | 23 (18.7%) |
Health Insurance Coverage by Household Income in Lyndonville
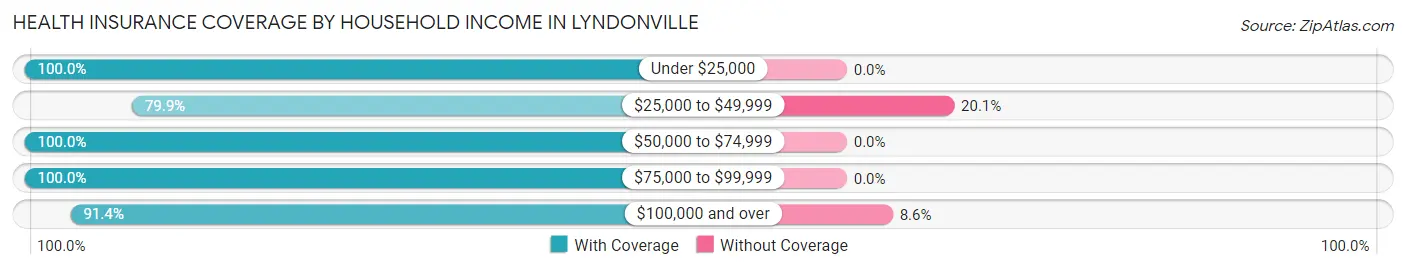
| Household Income | With Coverage | Without Coverage |
| Under $25,000 | 279 (100.0%) | 0 (0.0%) |
| $25,000 to $49,999 | 147 (79.9%) | 37 (20.1%) |
| $50,000 to $74,999 | 314 (100.0%) | 0 (0.0%) |
| $75,000 to $99,999 | 87 (100.0%) | 0 (0.0%) |
| $100,000 and over | 255 (91.4%) | 24 (8.6%) |
Public vs Private Health Insurance Coverage by Age in Lyndonville
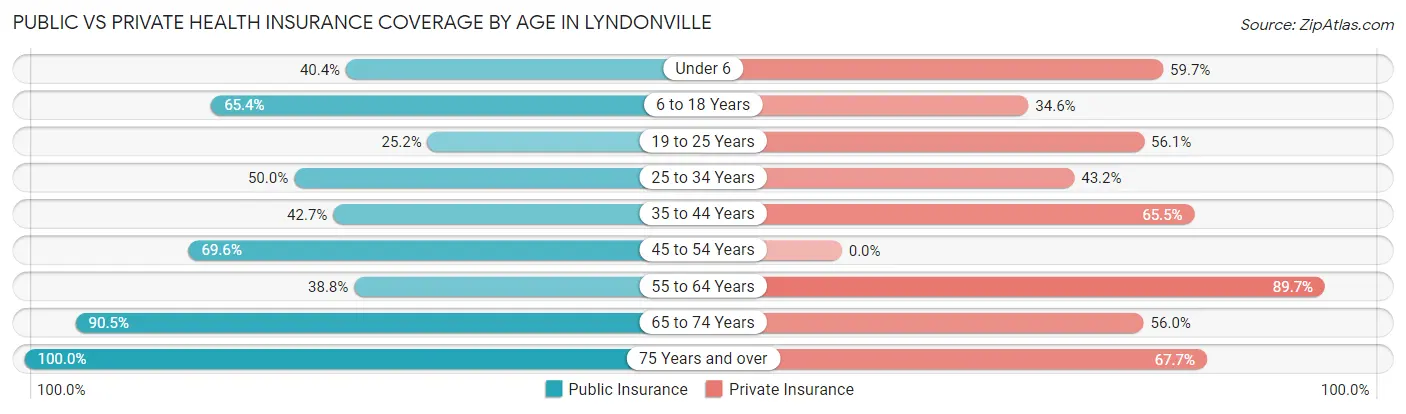
| Age Bracket | Public Insurance | Private Insurance |
| Under 6 | 23 (40.4%) | 34 (59.7%) |
| 6 to 18 Years | 100 (65.4%) | 53 (34.6%) |
| 19 to 25 Years | 31 (25.2%) | 69 (56.1%) |
| 25 to 34 Years | 117 (50.0%) | 101 (43.2%) |
| 35 to 44 Years | 47 (42.7%) | 72 (65.4%) |
| 45 to 54 Years | 32 (69.6%) | 0 (0.0%) |
| 55 to 64 Years | 94 (38.8%) | 217 (89.7%) |
| 65 to 74 Years | 105 (90.5%) | 65 (56.0%) |
| 75 Years and over | 62 (100.0%) | 42 (67.7%) |
| Total | 611 (53.5%) | 653 (57.1%) |
Disability Status by Sex by Age in Lyndonville
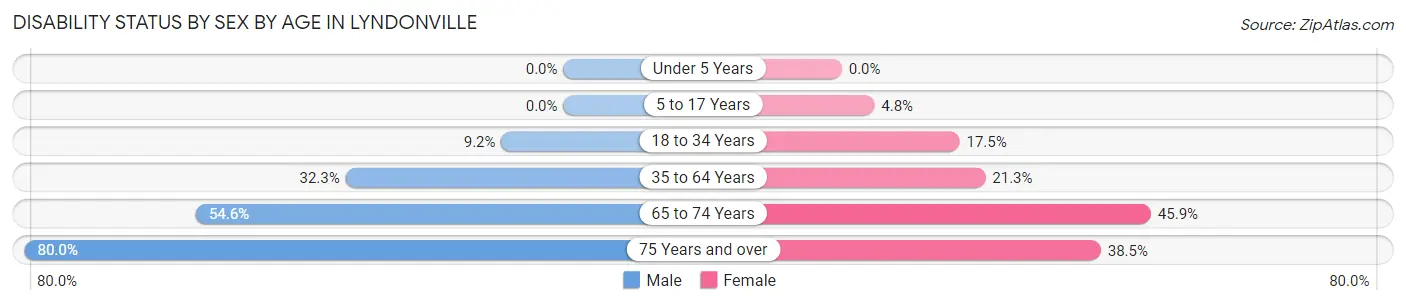
| Age Bracket | Male | Female |
| Under 5 Years | 0 (0.0%) | 0 (0.0%) |
| 5 to 17 Years | 0 (0.0%) | 3 (4.8%) |
| 18 to 34 Years | 16 (9.2%) | 32 (17.5%) |
| 35 to 64 Years | 65 (32.3%) | 42 (21.3%) |
| 65 to 74 Years | 30 (54.5%) | 28 (45.9%) |
| 75 Years and over | 8 (80.0%) | 20 (38.5%) |
Disability Class by Sex by Age in Lyndonville
Disability Class: Hearing Difficulty
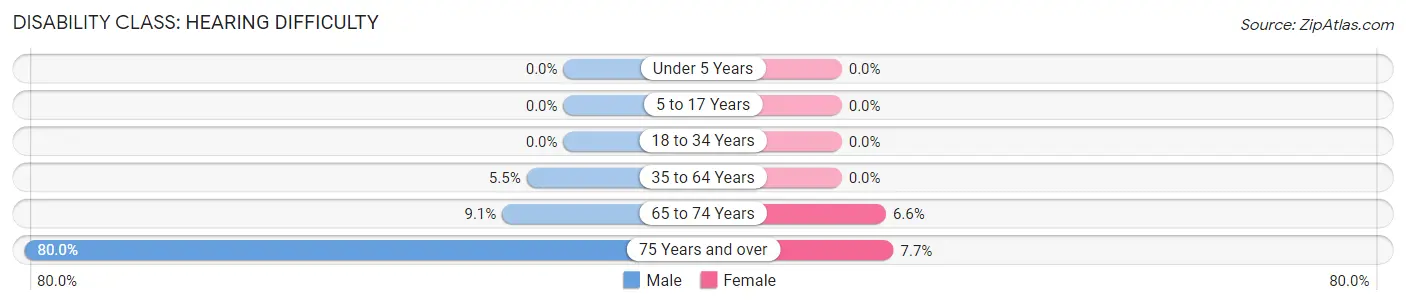
| Age Bracket | Male | Female |
| Under 5 Years | 0 (0.0%) | 0 (0.0%) |
| 5 to 17 Years | 0 (0.0%) | 0 (0.0%) |
| 18 to 34 Years | 0 (0.0%) | 0 (0.0%) |
| 35 to 64 Years | 11 (5.5%) | 0 (0.0%) |
| 65 to 74 Years | 5 (9.1%) | 4 (6.6%) |
| 75 Years and over | 8 (80.0%) | 4 (7.7%) |
Disability Class: Vision Difficulty
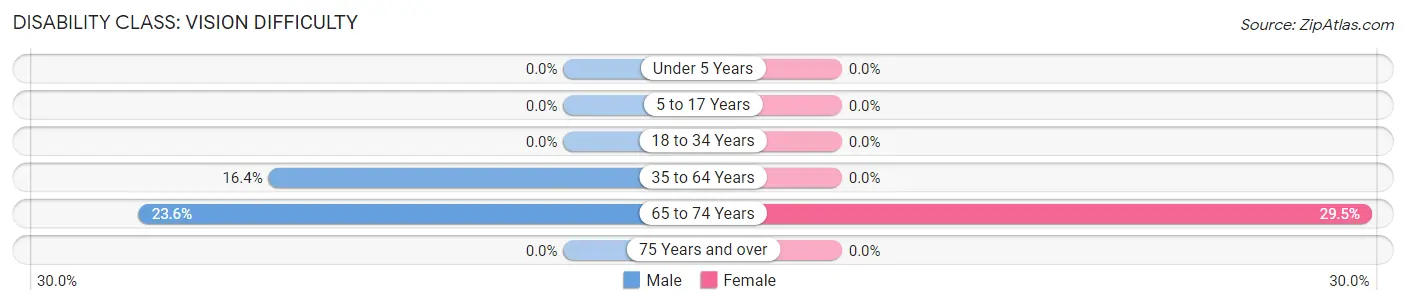
| Age Bracket | Male | Female |
| Under 5 Years | 0 (0.0%) | 0 (0.0%) |
| 5 to 17 Years | 0 (0.0%) | 0 (0.0%) |
| 18 to 34 Years | 0 (0.0%) | 0 (0.0%) |
| 35 to 64 Years | 33 (16.4%) | 0 (0.0%) |
| 65 to 74 Years | 13 (23.6%) | 18 (29.5%) |
| 75 Years and over | 0 (0.0%) | 0 (0.0%) |
Disability Class: Cognitive Difficulty
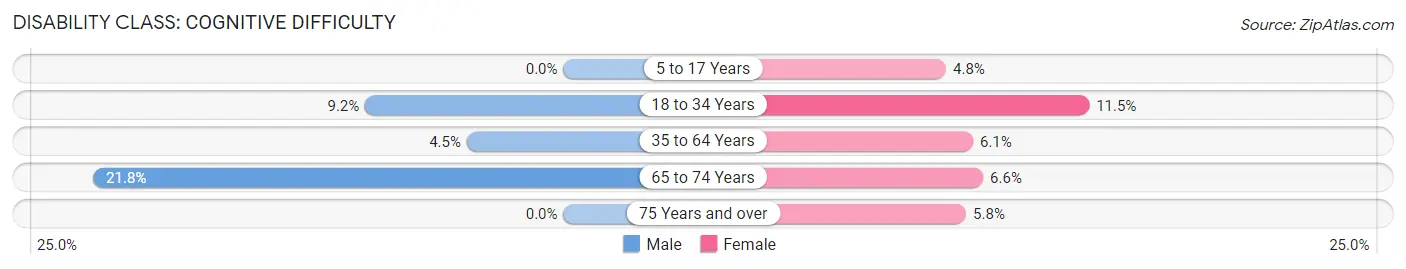
| Age Bracket | Male | Female |
| 5 to 17 Years | 0 (0.0%) | 3 (4.8%) |
| 18 to 34 Years | 16 (9.2%) | 21 (11.5%) |
| 35 to 64 Years | 9 (4.5%) | 12 (6.1%) |
| 65 to 74 Years | 12 (21.8%) | 4 (6.6%) |
| 75 Years and over | 0 (0.0%) | 3 (5.8%) |
Disability Class: Ambulatory Difficulty
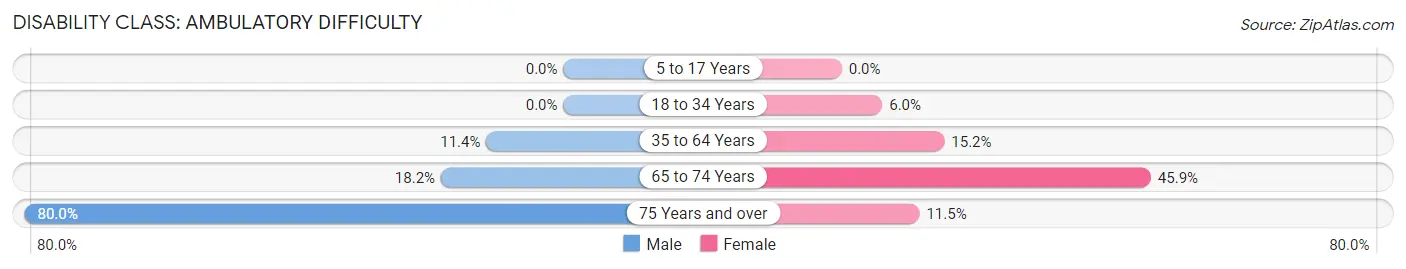
| Age Bracket | Male | Female |
| 5 to 17 Years | 0 (0.0%) | 0 (0.0%) |
| 18 to 34 Years | 0 (0.0%) | 11 (6.0%) |
| 35 to 64 Years | 23 (11.4%) | 30 (15.2%) |
| 65 to 74 Years | 10 (18.2%) | 28 (45.9%) |
| 75 Years and over | 8 (80.0%) | 6 (11.5%) |
Disability Class: Self-Care Difficulty
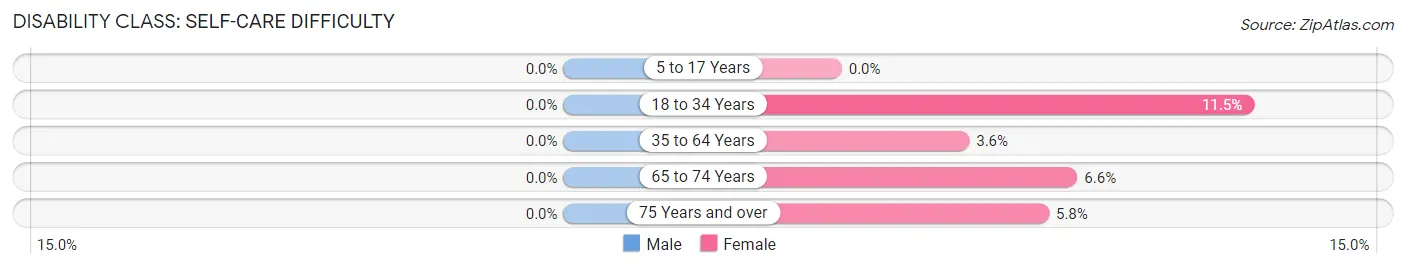
| Age Bracket | Male | Female |
| 5 to 17 Years | 0 (0.0%) | 0 (0.0%) |
| 18 to 34 Years | 0 (0.0%) | 21 (11.5%) |
| 35 to 64 Years | 0 (0.0%) | 7 (3.5%) |
| 65 to 74 Years | 0 (0.0%) | 4 (6.6%) |
| 75 Years and over | 0 (0.0%) | 3 (5.8%) |
Technology Access in Lyndonville
Computing Device Access in Lyndonville
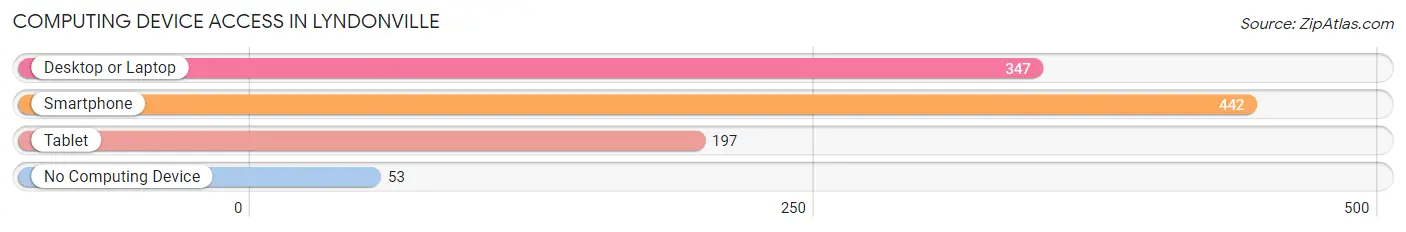
| Device Type | # Households | % Households |
| Desktop or Laptop | 347 | 64.6% |
| Smartphone | 442 | 82.3% |
| Tablet | 197 | 36.7% |
| No Computing Device | 53 | 9.9% |
| Total | 537 | 100.0% |
Internet Access in Lyndonville
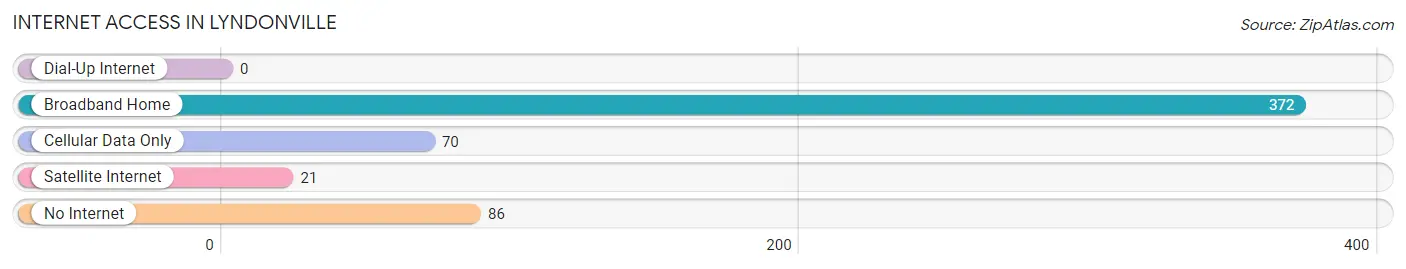
| Internet Type | # Households | % Households |
| Dial-Up Internet | 0 | 0.0% |
| Broadband Home | 372 | 69.3% |
| Cellular Data Only | 70 | 13.0% |
| Satellite Internet | 21 | 3.9% |
| No Internet | 86 | 16.0% |
| Total | 537 | 100.0% |
Lyndonville Summary
Lyndonville, Vermont is a small town located in the northeastern part of the state. It is situated in the heart of the Northeast Kingdom, a region of Vermont known for its rural beauty and small-town charm. The town is home to just over 2,000 people, and is the county seat of Caledonia County.
History
Lyndonville was first settled in 1780 by a group of settlers from Massachusetts. The town was named after the first settler, John Lyndon, who was a veteran of the Revolutionary War. The town was incorporated in 1781, and the first town meeting was held in 1782.
In the early 19th century, Lyndonville was a thriving agricultural community. The town was home to several mills, including a sawmill, gristmill, and a woolen mill. The town also had a blacksmith shop, a tannery, and a general store.
In the late 19th century, the town began to decline as the mills closed and the population decreased. However, the town was revitalized in the early 20th century with the arrival of the railroad. The railroad brought new industry to the town, and the population began to grow again.
Geography
Lyndonville is located in the northeastern part of Vermont, in the heart of the Northeast Kingdom. The town is situated in the valley of the Passumpsic River, and is surrounded by rolling hills and forests. The town is located about 25 miles from the Canadian border, and about 75 miles from the state capital of Montpelier.
The town covers an area of about 8.5 square miles, and is located at an elevation of about 1,000 feet. The climate in Lyndonville is generally mild, with cold winters and warm summers.
Economy
The economy of Lyndonville is largely based on agriculture and tourism. The town is home to several farms, which produce a variety of crops, including corn, hay, and apples. The town is also home to several small businesses, including restaurants, shops, and a brewery.
Tourism is an important part of the local economy, as the town is a popular destination for outdoor recreation. The town is home to several parks and trails, and is a popular spot for fishing, hunting, and camping.
Demographics
As of the 2010 census, the population of Lyndonville was 2,039. The town has a population density of about 240 people per square mile. The median age of the population is 43.7 years, and the median household income is $45,000.
The racial makeup of the town is 97.3% White, 0.7% African American, 0.3% Native American, 0.3% Asian, and 1.4% from other races. The town is home to a small Hispanic population, which makes up 1.2% of the population.
Conclusion
Lyndonville, Vermont is a small town located in the northeastern part of the state. It is situated in the heart of the Northeast Kingdom, and is home to just over 2,000 people. The town has a long history, and was once a thriving agricultural community. Today, the economy of Lyndonville is largely based on agriculture and tourism. The town is a popular destination for outdoor recreation, and is home to a diverse population.
Common Questions
What is Per Capita Income in Lyndonville?
Per Capita income in Lyndonville is $27,370.
What is the Median Family Income in Lyndonville?
Median Family Income in Lyndonville is $63,822.
What is the Median Household income in Lyndonville?
Median Household Income in Lyndonville is $54,688.
What is Income or Wage Gap in Lyndonville?
Income or Wage Gap in Lyndonville is 0.9%.
Women in Lyndonville earn 99.1 cents for every dollar earned by a man.
What is Inequality or Gini Index in Lyndonville?
Inequality or Gini Index in Lyndonville is 0.39.
What is the Total Population of Lyndonville?
Total Population of Lyndonville is 1,143.
What is the Total Male Population of Lyndonville?
Total Male Population of Lyndonville is 550.
What is the Total Female Population of Lyndonville?
Total Female Population of Lyndonville is 593.
What is the Ratio of Males per 100 Females in Lyndonville?
There are 92.75 Males per 100 Females in Lyndonville.
What is the Ratio of Females per 100 Males in Lyndonville?
There are 107.82 Females per 100 Males in Lyndonville.
What is the Median Population Age in Lyndonville?
Median Population Age in Lyndonville is 36.4 Years.
What is the Average Family Size in Lyndonville
Average Family Size in Lyndonville is 3.1 People.
What is the Average Household Size in Lyndonville
Average Household Size in Lyndonville is 2.1 People.
How Large is the Labor Force in Lyndonville?
There are 674 People in the Labor Forcein in Lyndonville.
What is the Percentage of People in the Labor Force in Lyndonville?
70.8% of People are in the Labor Force in Lyndonville.
What is the Unemployment Rate in Lyndonville?
Unemployment Rate in Lyndonville is 2.8%.