Chester, VT Map & Demographics
Chester Map
Chester Overview
$33,180
PER CAPITA INCOME
$83,542
AVG FAMILY INCOME
$63,919
AVG HOUSEHOLD INCOME
1.2%
WAGE / INCOME GAP [ % ]
98.8¢/ $1
WAGE / INCOME GAP [ $ ]
0.37
INEQUALITY / GINI INDEX
1,097
TOTAL POPULATION
498
MALE POPULATION
599
FEMALE POPULATION
83.14
MALES / 100 FEMALES
120.28
FEMALES / 100 MALES
40.0
MEDIAN AGE
3.0
AVG FAMILY SIZE
2.5
AVG HOUSEHOLD SIZE
538
LABOR FORCE [ PEOPLE ]
62.6%
PERCENT IN LABOR FORCE
2.2%
UNEMPLOYMENT RATE
Chester Zip Codes
Chester Area Codes
Income in Chester
Income Overview in Chester
Per Capita Income in Chester is $33,180, while median incomes of families and households are $83,542 and $63,919 respectively.
| Characteristic | Number | Measure |
| Per Capita Income | 1,097 | $33,180 |
| Median Family Income | 308 | $83,542 |
| Mean Family Income | 308 | $98,031 |
| Median Household Income | 444 | $63,919 |
| Mean Household Income | 444 | $80,324 |
| Income Deficit | 308 | $0 |
| Wage / Income Gap (%) | 1,097 | 1.24% |
| Wage / Income Gap ($) | 1,097 | 98.76¢ per $1 |
| Gini / Inequality Index | 1,097 | 0.37 |
Earnings by Sex in Chester
Average Earnings in Chester are $50,238, $50,673 for men and $50,043 for women, a difference of 1.2%.
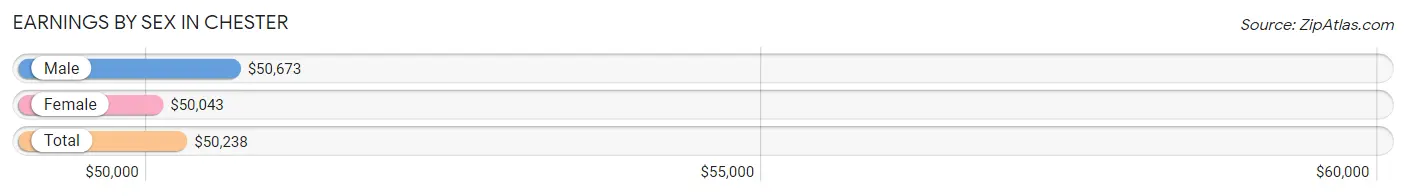
| Sex | Number | Average Earnings |
| Male | 251 (44.2%) | $50,673 |
| Female | 317 (55.8%) | $50,043 |
| Total | 568 (100.0%) | $50,238 |
Earnings by Sex by Income Bracket in Chester
The most common earnings brackets in Chester are $30,000 to $34,999 for men (54 | 21.5%) and $55,000 to $64,999 for women (67 | 21.1%).
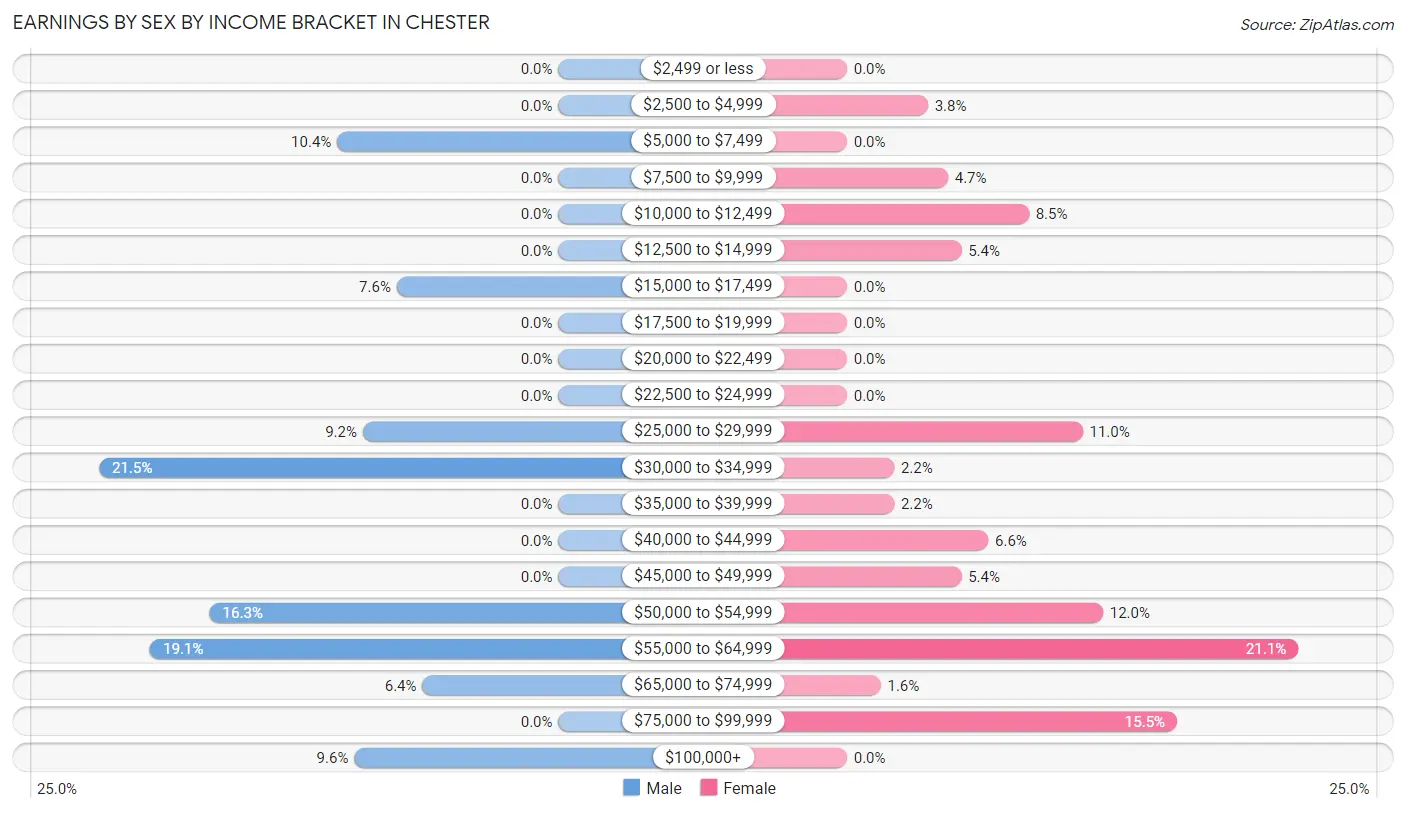
| Income | Male | Female |
| $2,499 or less | 0 (0.0%) | 0 (0.0%) |
| $2,500 to $4,999 | 0 (0.0%) | 12 (3.8%) |
| $5,000 to $7,499 | 26 (10.4%) | 0 (0.0%) |
| $7,500 to $9,999 | 0 (0.0%) | 15 (4.7%) |
| $10,000 to $12,499 | 0 (0.0%) | 27 (8.5%) |
| $12,500 to $14,999 | 0 (0.0%) | 17 (5.4%) |
| $15,000 to $17,499 | 19 (7.6%) | 0 (0.0%) |
| $17,500 to $19,999 | 0 (0.0%) | 0 (0.0%) |
| $20,000 to $22,499 | 0 (0.0%) | 0 (0.0%) |
| $22,500 to $24,999 | 0 (0.0%) | 0 (0.0%) |
| $25,000 to $29,999 | 23 (9.2%) | 35 (11.0%) |
| $30,000 to $34,999 | 54 (21.5%) | 7 (2.2%) |
| $35,000 to $39,999 | 0 (0.0%) | 7 (2.2%) |
| $40,000 to $44,999 | 0 (0.0%) | 21 (6.6%) |
| $45,000 to $49,999 | 0 (0.0%) | 17 (5.4%) |
| $50,000 to $54,999 | 41 (16.3%) | 38 (12.0%) |
| $55,000 to $64,999 | 48 (19.1%) | 67 (21.1%) |
| $65,000 to $74,999 | 16 (6.4%) | 5 (1.6%) |
| $75,000 to $99,999 | 0 (0.0%) | 49 (15.5%) |
| $100,000+ | 24 (9.6%) | 0 (0.0%) |
| Total | 251 (100.0%) | 317 (100.0%) |
Earnings by Sex by Educational Attainment in Chester
Average earnings in Chester are $52,115 for men and $52,198 for women, a difference of 0.2%. Men with an educational attainment of high school diploma enjoy the highest average annual earnings of $52,404, while those with high school diploma education earn the least with $52,404. Women with an educational attainment of bachelor's degree earn the most with the average annual earnings of $57,333, while those with bachelor's degree education have the smallest earnings of $57,333.
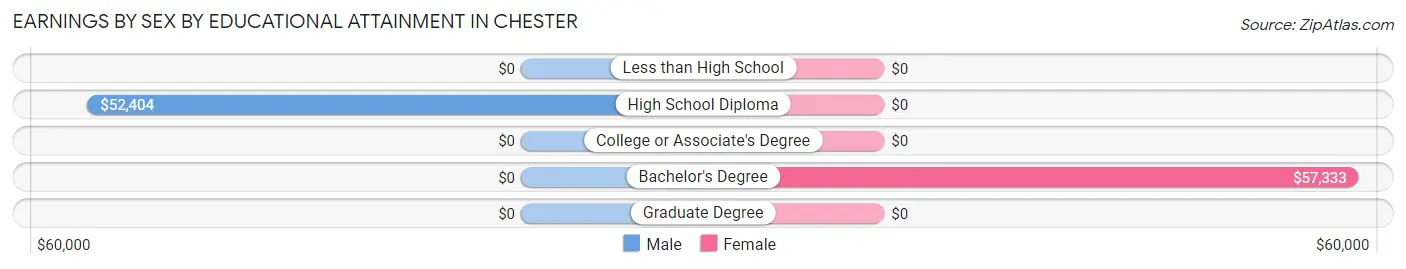
| Educational Attainment | Male Income | Female Income |
| Less than High School | - | - |
| High School Diploma | $52,404 | $0 |
| College or Associate's Degree | - | - |
| Bachelor's Degree | - | - |
| Graduate Degree | - | - |
| Total | $52,115 | $52,198 |
Family Income in Chester
Family Income Brackets in Chester
According to the Chester family income data, there are 96 families falling into the $50,000 to $74,999 income range, which is the most common income bracket and makes up 31.2% of all families.
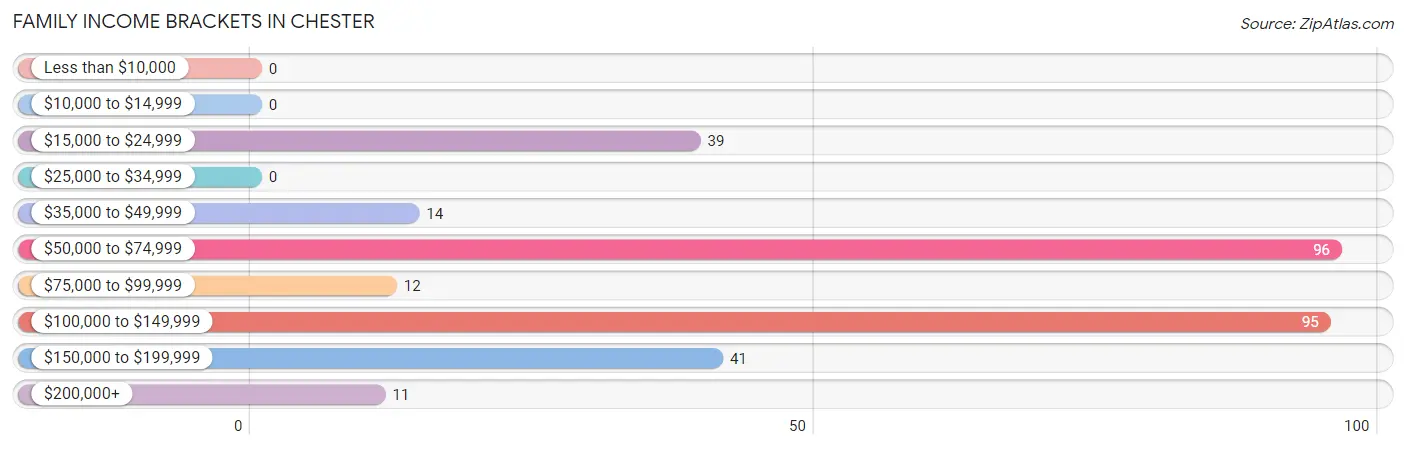
| Income Bracket | # Families | % Families |
| Less than $10,000 | 0 | 0.0% |
| $10,000 to $14,999 | 0 | 0.0% |
| $15,000 to $24,999 | 39 | 12.7% |
| $25,000 to $34,999 | 0 | 0.0% |
| $35,000 to $49,999 | 14 | 4.5% |
| $50,000 to $74,999 | 96 | 31.2% |
| $75,000 to $99,999 | 12 | 3.9% |
| $100,000 to $149,999 | 95 | 30.8% |
| $150,000 to $199,999 | 41 | 13.3% |
| $200,000+ | 11 | 3.6% |
Family Income by Famaliy Size in Chester
4-person families (35 | 11.4%) account for the highest median family income in Chester with $146,645 per family, while 3-person families (119 | 38.6%) have the highest median income of $37,765 per family member.
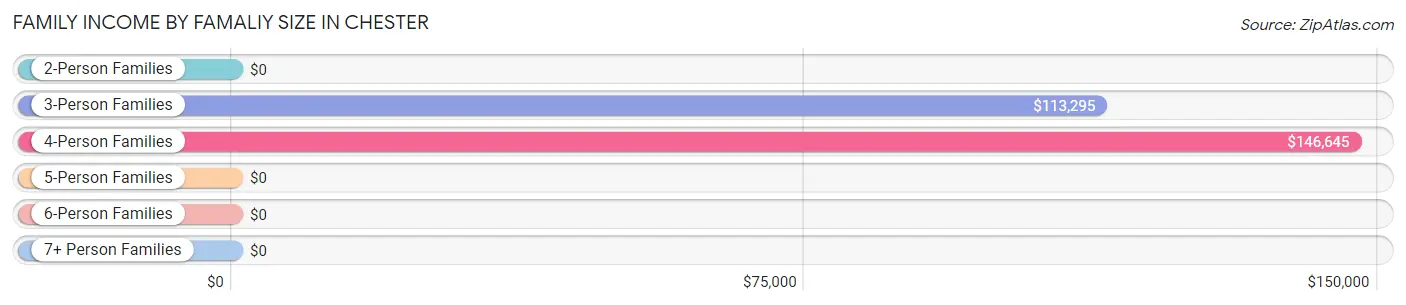
| Income Bracket | # Families | Median Income |
| 2-Person Families | 132 (42.9%) | $0 |
| 3-Person Families | 119 (38.6%) | $113,295 |
| 4-Person Families | 35 (11.4%) | $146,645 |
| 5-Person Families | 22 (7.1%) | $0 |
| 6-Person Families | 0 (0.0%) | $0 |
| 7+ Person Families | 0 (0.0%) | $0 |
| Total | 308 (100.0%) | $83,542 |
Family Income by Number of Earners in Chester
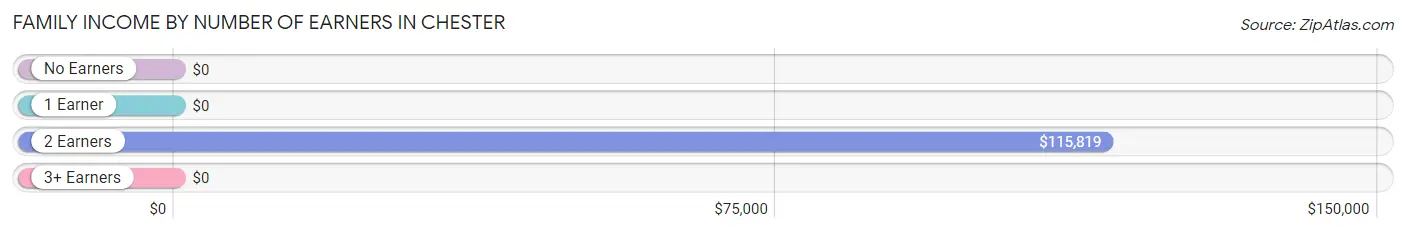
| Number of Earners | # Families | Median Income |
| No Earners | 67 (21.7%) | $0 |
| 1 Earner | 30 (9.7%) | $0 |
| 2 Earners | 211 (68.5%) | $115,819 |
| 3+ Earners | 0 (0.0%) | $0 |
| Total | 308 (100.0%) | $83,542 |
Household Income in Chester
Household Income Brackets in Chester
With 149 households falling in the category, the $50,000 to $74,999 income range is the most frequent in Chester, accounting for 33.6% of all households.
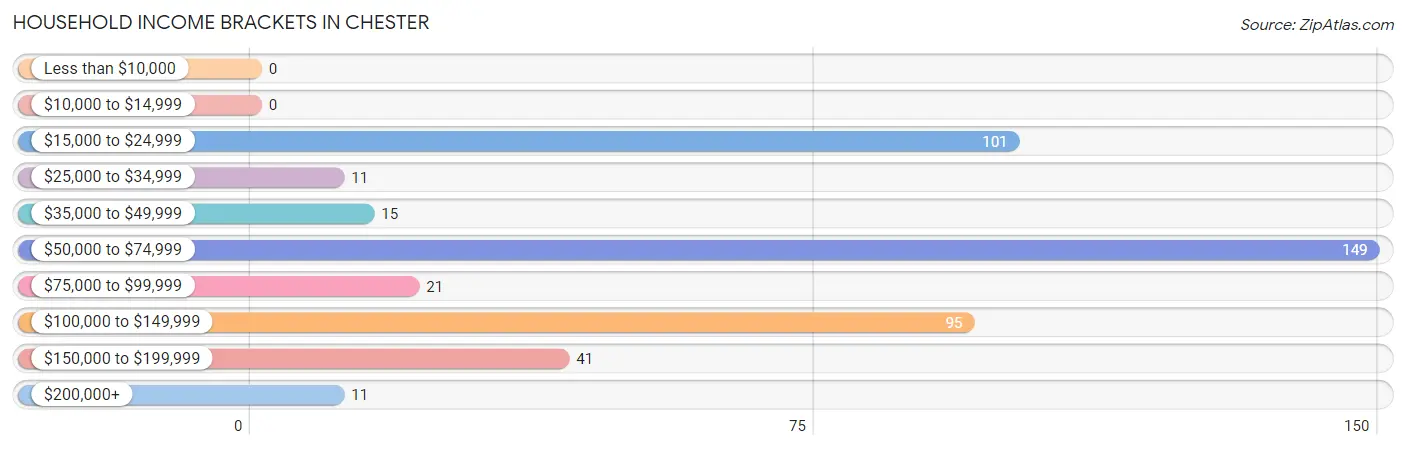
| Income Bracket | # Households | % Households |
| Less than $10,000 | 0 | 0.0% |
| $10,000 to $14,999 | 0 | 0.0% |
| $15,000 to $24,999 | 101 | 22.7% |
| $25,000 to $34,999 | 11 | 2.5% |
| $35,000 to $49,999 | 15 | 3.4% |
| $50,000 to $74,999 | 149 | 33.6% |
| $75,000 to $99,999 | 21 | 4.7% |
| $100,000 to $149,999 | 95 | 21.4% |
| $150,000 to $199,999 | 41 | 9.2% |
| $200,000+ | 11 | 2.5% |
Household Income by Householder Age in Chester
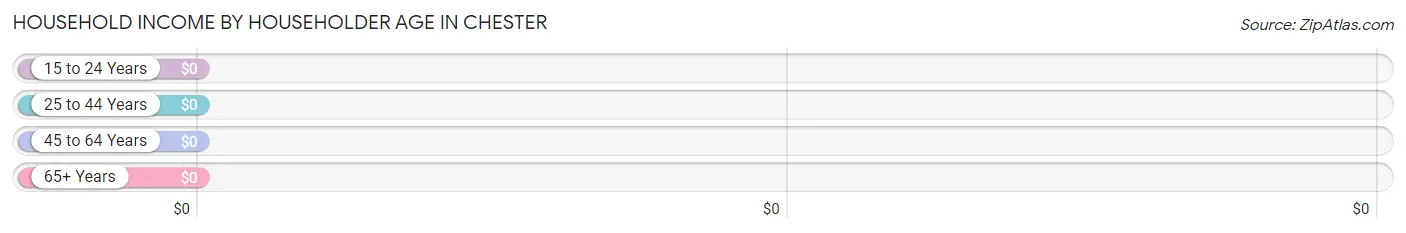
| Income Bracket | # Households | Median Income |
| 15 to 24 Years | 0 (0.0%) | $0 |
| 25 to 44 Years | 156 (35.1%) | $0 |
| 45 to 64 Years | 102 (23.0%) | $0 |
| 65+ Years | 186 (41.9%) | $0 |
| Total | 444 (100.0%) | $63,919 |
Poverty in Chester
Income Below Poverty by Sex and Age in Chester
| Age Bracket | Male | Female |
| Under 5 Years | 0 (0.0%) | 0 (0.0%) |
| 5 Years | 0 (0.0%) | 0 (0.0%) |
| 6 to 11 Years | 0 (0.0%) | 0 (0.0%) |
| 12 to 14 Years | 0 (0.0%) | 0 (0.0%) |
| 15 Years | 0 (0.0%) | 0 (0.0%) |
| 16 and 17 Years | 0 (0.0%) | 0 (0.0%) |
| 18 to 24 Years | 0 (0.0%) | 0 (0.0%) |
| 25 to 34 Years | 0 (0.0%) | 0 (0.0%) |
| 35 to 44 Years | 0 (0.0%) | 0 (0.0%) |
| 45 to 54 Years | 0 (0.0%) | 0 (0.0%) |
| 55 to 64 Years | 0 (0.0%) | 0 (0.0%) |
| 65 to 74 Years | 0 (0.0%) | 0 (0.0%) |
| 75 Years and over | 0 (0.0%) | 0 (0.0%) |
| Total | 0 (0.0%) | 0 (0.0%) |
Income Above Poverty by Sex and Age in Chester
According to the poverty statistics in Chester, males aged under 5 years and females aged under 5 years are the age groups that are most secure financially, with 100.0% of males and 100.0% of females in these age groups living above the poverty line.
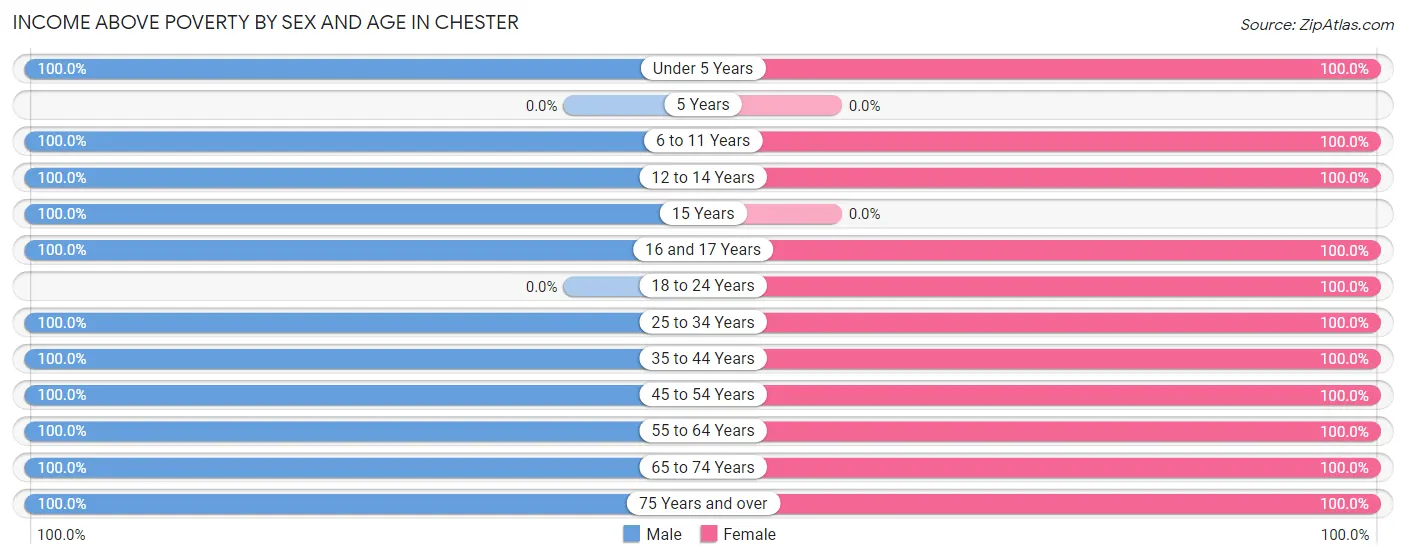
| Age Bracket | Male | Female |
| Under 5 Years | 48 (100.0%) | 25 (100.0%) |
| 5 Years | 0 (0.0%) | 0 (0.0%) |
| 6 to 11 Years | 32 (100.0%) | 61 (100.0%) |
| 12 to 14 Years | 12 (100.0%) | 39 (100.0%) |
| 15 Years | 20 (100.0%) | 0 (0.0%) |
| 16 and 17 Years | 15 (100.0%) | 13 (100.0%) |
| 18 to 24 Years | 0 (0.0%) | 50 (100.0%) |
| 25 to 34 Years | 70 (100.0%) | 44 (100.0%) |
| 35 to 44 Years | 77 (100.0%) | 105 (100.0%) |
| 45 to 54 Years | 34 (100.0%) | 60 (100.0%) |
| 55 to 64 Years | 47 (100.0%) | 25 (100.0%) |
| 65 to 74 Years | 115 (100.0%) | 159 (100.0%) |
| 75 Years and over | 28 (100.0%) | 18 (100.0%) |
| Total | 498 (100.0%) | 599 (100.0%) |
Income Below Poverty Among Married-Couple Families in Chester
| Children | Above Poverty | Below Poverty |
| No Children | 134 (100.0%) | 0 (0.0%) |
| 1 or 2 Children | 129 (100.0%) | 0 (0.0%) |
| 3 or 4 Children | 22 (100.0%) | 0 (0.0%) |
| 5 or more Children | 0 (0.0%) | 0 (0.0%) |
| Total | 285 (100.0%) | 0 (0.0%) |
Income Below Poverty Among Single-Parent Households in Chester
| Children | Single Father | Single Mother |
| No Children | 0 (0.0%) | 0 (0.0%) |
| 1 or 2 Children | 0 (0.0%) | 0 (0.0%) |
| 3 or 4 Children | 0 (0.0%) | 0 (0.0%) |
| 5 or more Children | 0 (0.0%) | 0 (0.0%) |
| Total | 0 (0.0%) | 0 (0.0%) |
Income Below Poverty Among Married-Couple vs Single-Parent Households in Chester
| Children | Married-Couple Families | Single-Parent Households |
| No Children | 0 (0.0%) | 0 (0.0%) |
| 1 or 2 Children | 0 (0.0%) | 0 (0.0%) |
| 3 or 4 Children | 0 (0.0%) | 0 (0.0%) |
| 5 or more Children | 0 (0.0%) | 0 (0.0%) |
| Total | 0 (0.0%) | 0 (0.0%) |
Race in Chester
The most populous races in Chester are White / Caucasian (1,073 | 97.8%), and Two or more Races (24 | 2.2%).
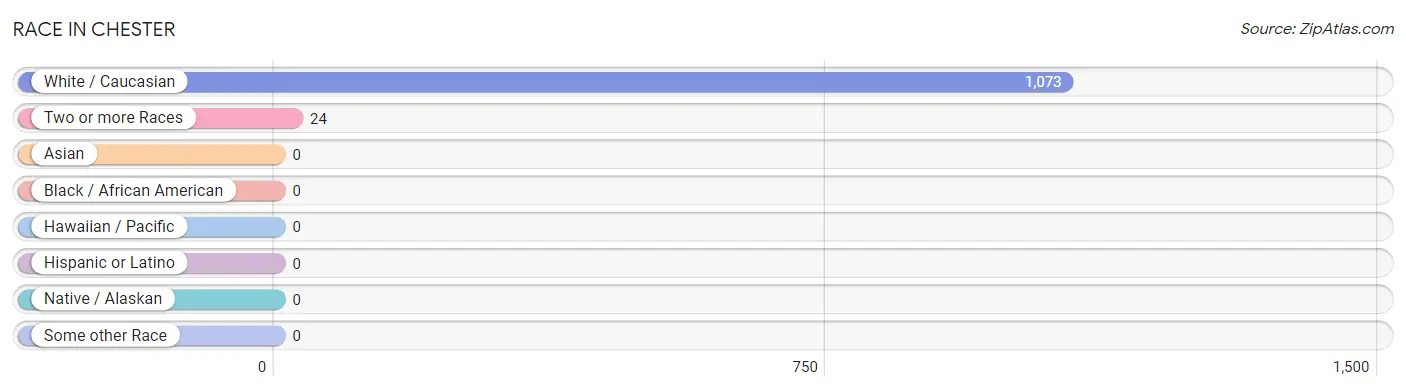
| Race | # Population | % Population |
| Asian | 0 | 0.0% |
| Black / African American | 0 | 0.0% |
| Hawaiian / Pacific | 0 | 0.0% |
| Hispanic or Latino | 0 | 0.0% |
| Native / Alaskan | 0 | 0.0% |
| White / Caucasian | 1,073 | 97.8% |
| Two or more Races | 24 | 2.2% |
| Some other Race | 0 | 0.0% |
| Total | 1,097 | 100.0% |
Ancestry in Chester
The most populous ancestries reported in Chester are Irish (262 | 23.9%), German (250 | 22.8%), English (159 | 14.5%), American (96 | 8.7%), and Italian (86 | 7.8%), together accounting for 77.8% of all Chester residents.
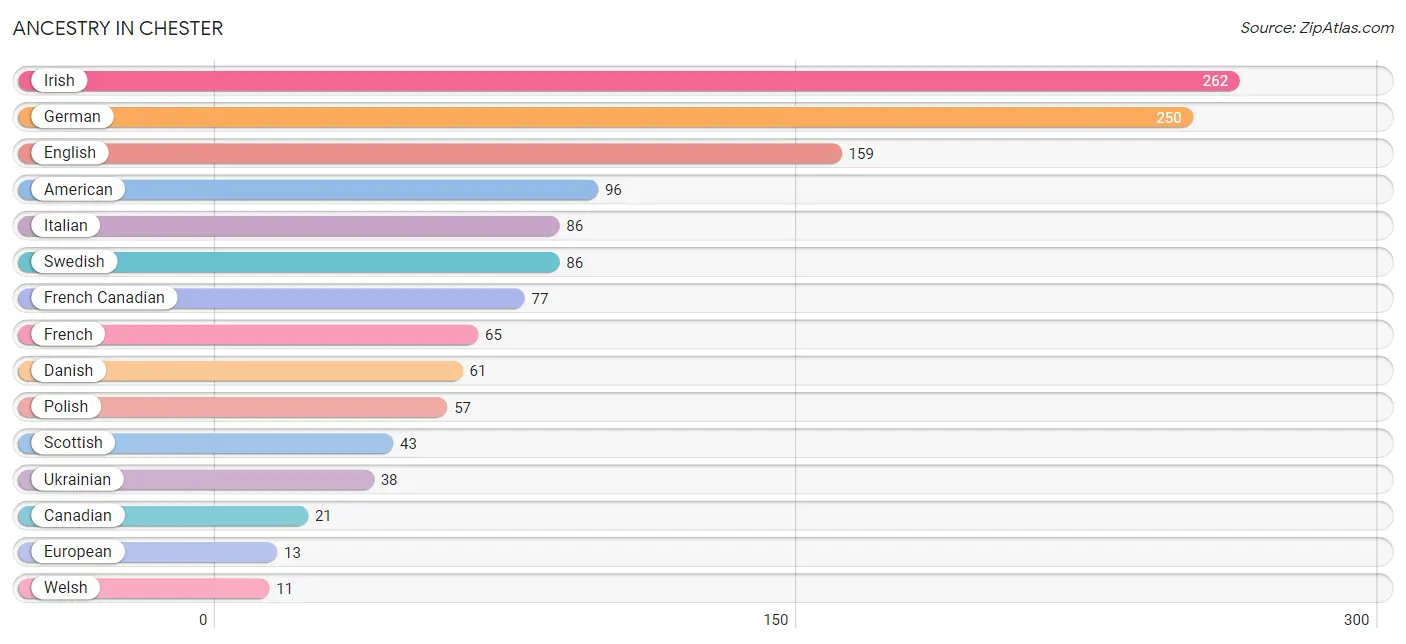
| Ancestry | # Population | % Population |
| American | 96 | 8.7% |
| Canadian | 21 | 1.9% |
| Danish | 61 | 5.6% |
| English | 159 | 14.5% |
| European | 13 | 1.2% |
| French | 65 | 5.9% |
| French Canadian | 77 | 7.0% |
| German | 250 | 22.8% |
| Irish | 262 | 23.9% |
| Italian | 86 | 7.8% |
| Polish | 57 | 5.2% |
| Scottish | 43 | 3.9% |
| Swedish | 86 | 7.8% |
| Ukrainian | 38 | 3.5% |
| Welsh | 11 | 1.0% | View All 15 Rows |
Immigrants in Chester
The most numerous immigrant groups reported in Chester came from Canada (77 | 7.0%), England (23 | 2.1%), Europe (23 | 2.1%), and Northern Europe (23 | 2.1%), together accounting for 13.3% of all Chester residents.
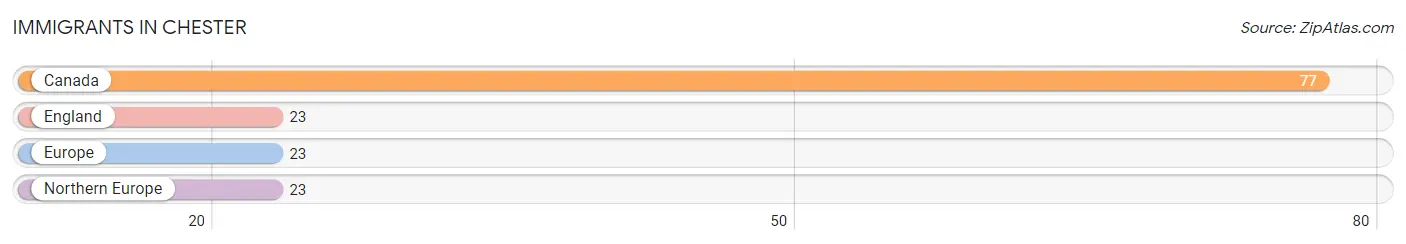
| Immigration Origin | # Population | % Population |
| Canada | 77 | 7.0% |
| England | 23 | 2.1% |
| Europe | 23 | 2.1% |
| Northern Europe | 23 | 2.1% | View All 4 Rows |
Sex and Age in Chester
Sex and Age in Chester
The most populous age groups in Chester are 70 to 74 Years (88 | 17.7%) for men and 65 to 69 Years (90 | 15.0%) for women.
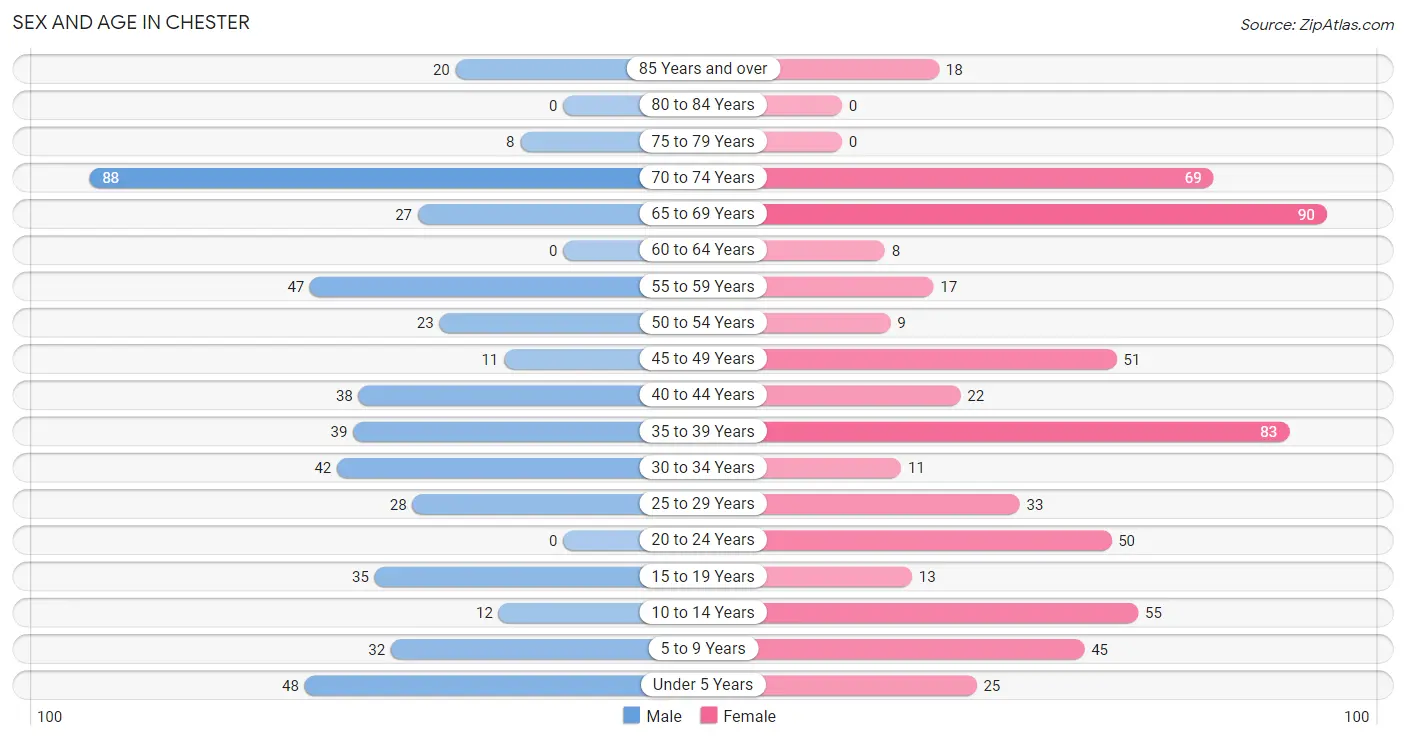
| Age Bracket | Male | Female |
| Under 5 Years | 48 (9.6%) | 25 (4.2%) |
| 5 to 9 Years | 32 (6.4%) | 45 (7.5%) |
| 10 to 14 Years | 12 (2.4%) | 55 (9.2%) |
| 15 to 19 Years | 35 (7.0%) | 13 (2.2%) |
| 20 to 24 Years | 0 (0.0%) | 50 (8.4%) |
| 25 to 29 Years | 28 (5.6%) | 33 (5.5%) |
| 30 to 34 Years | 42 (8.4%) | 11 (1.8%) |
| 35 to 39 Years | 39 (7.8%) | 83 (13.9%) |
| 40 to 44 Years | 38 (7.6%) | 22 (3.7%) |
| 45 to 49 Years | 11 (2.2%) | 51 (8.5%) |
| 50 to 54 Years | 23 (4.6%) | 9 (1.5%) |
| 55 to 59 Years | 47 (9.4%) | 17 (2.8%) |
| 60 to 64 Years | 0 (0.0%) | 8 (1.3%) |
| 65 to 69 Years | 27 (5.4%) | 90 (15.0%) |
| 70 to 74 Years | 88 (17.7%) | 69 (11.5%) |
| 75 to 79 Years | 8 (1.6%) | 0 (0.0%) |
| 80 to 84 Years | 0 (0.0%) | 0 (0.0%) |
| 85 Years and over | 20 (4.0%) | 18 (3.0%) |
| Total | 498 (100.0%) | 599 (100.0%) |
Families and Households in Chester
Median Family Size in Chester
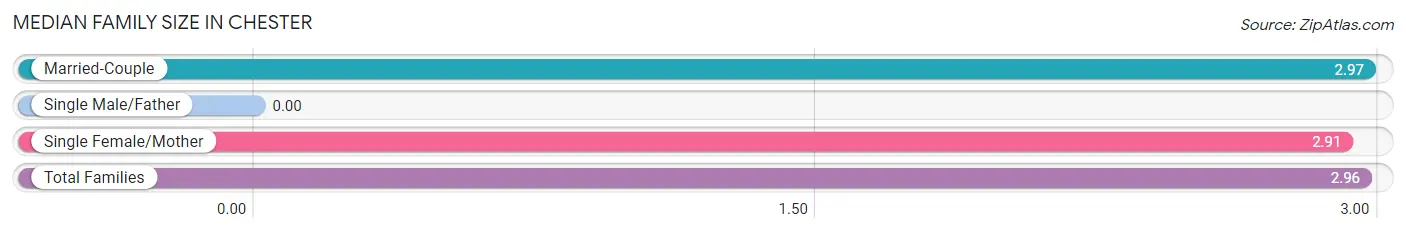
| Family Type | # Families | Family Size |
| Married-Couple | 285 (92.5%) | 2.97 |
| Single Male/Father | 0 (0.0%) | - |
| Single Female/Mother | 23 (7.5%) | 2.91 |
| Total Families | 308 (100.0%) | 2.96 |
Median Household Size in Chester
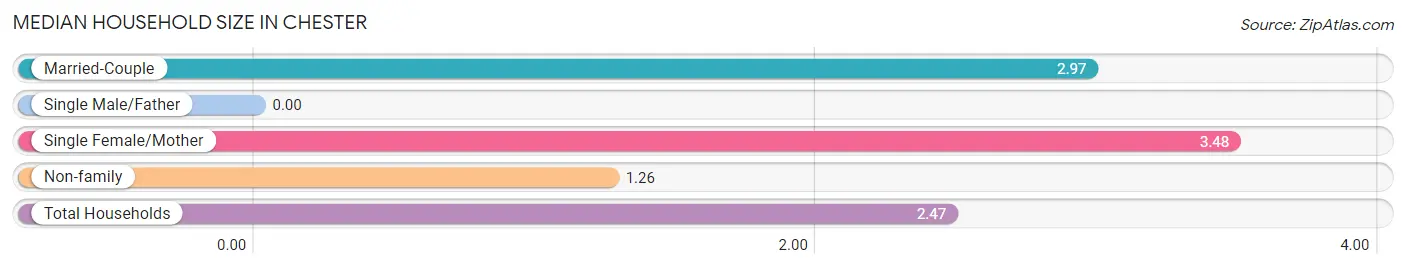
| Household Type | # Households | Household Size |
| Married-Couple | 285 (64.2%) | 2.97 |
| Single Male/Father | 0 (0.0%) | - |
| Single Female/Mother | 23 (5.2%) | 3.48 |
| Non-family | 136 (30.6%) | 1.26 |
| Total Households | 444 (100.0%) | 2.47 |
Household Size by Marriage Status in Chester
Out of a total of 444 households in Chester, 308 (69.4%) are family households, while 136 (30.6%) are nonfamily households. The most numerous type of family households are 3-person households, comprising 126, and the most common type of nonfamily households are 1-person households, comprising 98.
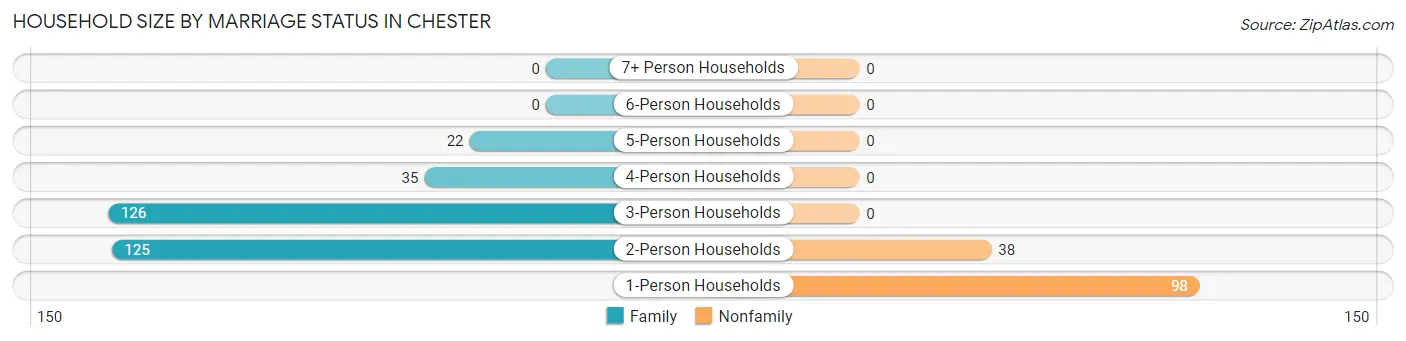
| Household Size | Family Households | Nonfamily Households |
| 1-Person Households | - | 98 (22.1%) |
| 2-Person Households | 125 (28.1%) | 38 (8.6%) |
| 3-Person Households | 126 (28.4%) | 0 (0.0%) |
| 4-Person Households | 35 (7.9%) | 0 (0.0%) |
| 5-Person Households | 22 (5.0%) | 0 (0.0%) |
| 6-Person Households | 0 (0.0%) | 0 (0.0%) |
| 7+ Person Households | 0 (0.0%) | 0 (0.0%) |
| Total | 308 (69.4%) | 136 (30.6%) |
Female Fertility in Chester
Fertility by Age in Chester
| Age Bracket | Women with Births | Births / 1,000 Women |
| 15 to 19 years | 0 (0.0%) | 0.0 |
| 20 to 34 years | 0 (0.0%) | 0.0 |
| 35 to 50 years | 0 (0.0%) | 0.0 |
| Total | 0 (0.0%) | 0.0 |
Fertility by Age by Marriage Status in Chester
| Age Bracket | Married | Unmarried |
| 15 to 19 years | 0 (0.0%) | 0 (0.0%) |
| 20 to 34 years | 0 (0.0%) | 0 (0.0%) |
| 35 to 50 years | 0 (0.0%) | 0 (0.0%) |
| Total | 0 (0.0%) | 0 (0.0%) |
Fertility by Education in Chester
| Educational Attainment | Women with Births | Births / 1,000 Women |
| Less than High School | 0 (0.0%) | 0.0 |
| High School Diploma | 0 (0.0%) | 0.0 |
| College or Associate's Degree | 0 (0.0%) | 0.0 |
| Bachelor's Degree | 0 (0.0%) | 0.0 |
| Graduate Degree | 0 (0.0%) | 0.0 |
| Total | 0 (0.0%) | 0.0 |
Fertility by Education by Marriage Status in Chester
| Educational Attainment | Married | Unmarried |
| Less than High School | 0 (0.0%) | 0 (0.0%) |
| High School Diploma | 0 (0.0%) | 0 (0.0%) |
| College or Associate's Degree | 0 (0.0%) | 0 (0.0%) |
| Bachelor's Degree | 0 (0.0%) | 0 (0.0%) |
| Graduate Degree | 0 (0.0%) | 0 (0.0%) |
| Total | 0 (0.0%) | 0 (0.0%) |
Employment Characteristics in Chester
Employment by Class of Employer in Chester
Among the 526 employed individuals in Chester, private company employees (185 | 35.2%), self-employed (not incorporated) (99 | 18.8%), and self-employed (incorporated) (95 | 18.1%) make up the most common classes of employment.
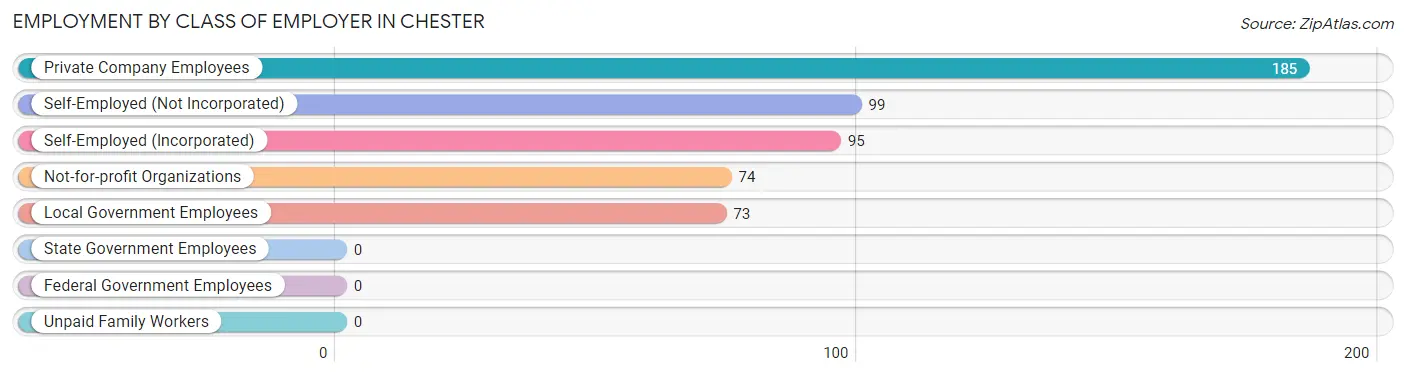
| Employer Class | # Employees | % Employees |
| Private Company Employees | 185 | 35.2% |
| Self-Employed (Incorporated) | 95 | 18.1% |
| Self-Employed (Not Incorporated) | 99 | 18.8% |
| Not-for-profit Organizations | 74 | 14.1% |
| Local Government Employees | 73 | 13.9% |
| State Government Employees | 0 | 0.0% |
| Federal Government Employees | 0 | 0.0% |
| Unpaid Family Workers | 0 | 0.0% |
| Total | 526 | 100.0% |
Employment Status by Age in Chester
According to the labor force statistics for Chester, out of the total population over 16 years of age (860), 62.6% or 538 individuals are in the labor force, with 2.2% or 12 of them unemployed. The age group with the highest labor force participation rate is 30 to 34 years, with 100.0% or 53 individuals in the labor force. Within the labor force, the 25 to 29 years age range has the highest percentage of unemployed individuals, with 26.1% or 12 of them being unemployed.
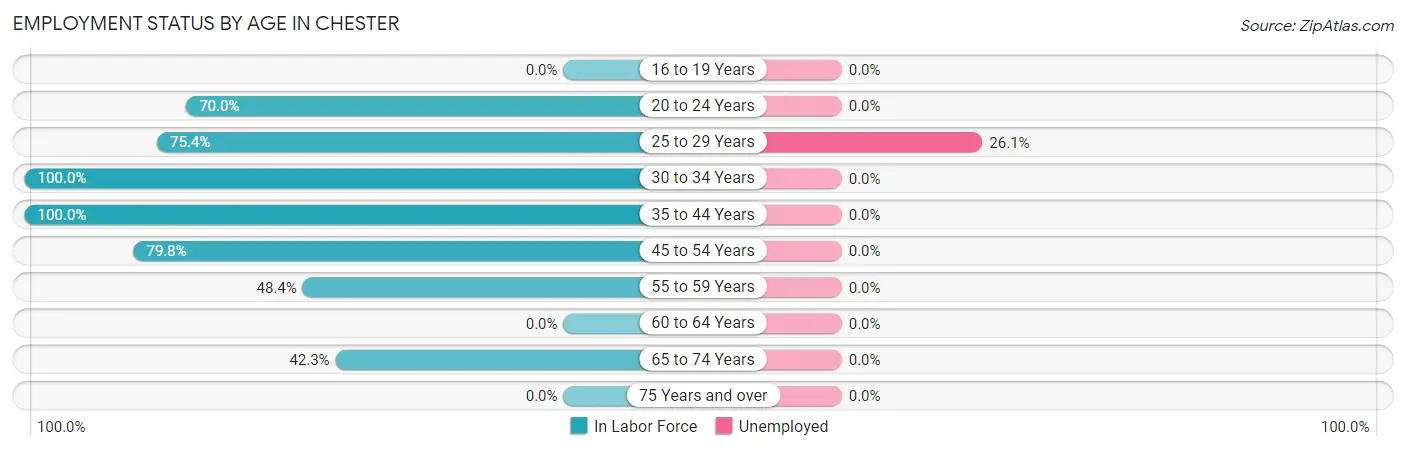
| Age Bracket | In Labor Force | Unemployed |
| 16 to 19 Years | 0 (0.0%) | 0 (0.0%) |
| 20 to 24 Years | 35 (70.0%) | 0 (0.0%) |
| 25 to 29 Years | 46 (75.4%) | 12 (26.1%) |
| 30 to 34 Years | 53 (100.0%) | 0 (0.0%) |
| 35 to 44 Years | 182 (100.0%) | 0 (0.0%) |
| 45 to 54 Years | 75 (79.8%) | 0 (0.0%) |
| 55 to 59 Years | 31 (48.4%) | 0 (0.0%) |
| 60 to 64 Years | 0 (0.0%) | 0 (0.0%) |
| 65 to 74 Years | 116 (42.3%) | 0 (0.0%) |
| 75 Years and over | 0 (0.0%) | 0 (0.0%) |
| Total | 538 (62.6%) | 12 (2.2%) |
Employment Status by Educational Attainment in Chester
According to labor force statistics for Chester, 83.8% of individuals (387) out of the total population between 25 and 64 years of age (462) are in the labor force, with 3.1% or 12 of them being unemployed. The group with the highest labor force participation rate are those with the educational attainment of high school diploma, with 100.0% or 86 individuals in the labor force. Within the labor force, individuals with college / associate degree education have the highest percentage of unemployment, with 15.4% or 12 of them being unemployed.
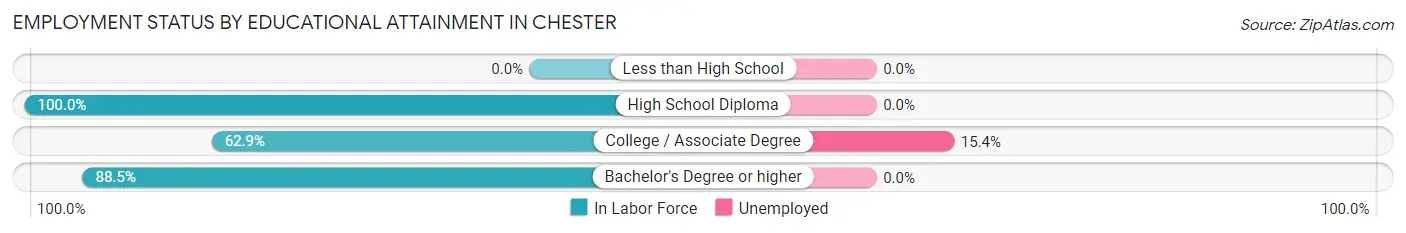
| Educational Attainment | In Labor Force | Unemployed |
| Less than High School | 0 (0.0%) | 0 (0.0%) |
| High School Diploma | 86 (100.0%) | 0 (0.0%) |
| College / Associate Degree | 78 (62.9%) | 19 (15.4%) |
| Bachelor's Degree or higher | 223 (88.5%) | 0 (0.0%) |
| Total | 387 (83.8%) | 14 (3.1%) |
Employment Occupations by Sex in Chester
Management, Business, Science and Arts Occupations
The most common Management, Business, Science and Arts occupations in Chester are Community & Social Service (96 | 18.2%), Management (74 | 14.1%), Health Diagnosing & Treating (59 | 11.2%), Health Technologists (54 | 10.3%), and Education Instruction & Library (52 | 9.9%).
Management, Business, Science and Arts Occupations by Sex
Within the Management, Business, Science and Arts occupations in Chester, the most male-oriented occupations are Management (100.0%), Education, Arts & Media (61.4%), and Community & Social Service (28.1%), while the most female-oriented occupations are Business & Financial (100.0%), Education Instruction & Library (100.0%), and Health Diagnosing & Treating (100.0%).
| Occupation | Male | Female |
| Management | 74 (100.0%) | 0 (0.0%) |
| Business & Financial | 0 (0.0%) | 23 (100.0%) |
| Computers, Engineering & Science | 0 (0.0%) | 0 (0.0%) |
| Computers & Mathematics | 0 (0.0%) | 0 (0.0%) |
| Architecture & Engineering | 0 (0.0%) | 0 (0.0%) |
| Life, Physical & Social Science | 0 (0.0%) | 0 (0.0%) |
| Community & Social Service | 27 (28.1%) | 69 (71.9%) |
| Education, Arts & Media | 27 (61.4%) | 17 (38.6%) |
| Legal Services & Support | 0 (0.0%) | 0 (0.0%) |
| Education Instruction & Library | 0 (0.0%) | 52 (100.0%) |
| Arts, Media & Entertainment | 0 (0.0%) | 0 (0.0%) |
| Health Diagnosing & Treating | 0 (0.0%) | 59 (100.0%) |
| Health Technologists | 0 (0.0%) | 54 (100.0%) |
| Total (Category) | 101 (40.1%) | 151 (59.9%) |
| Total (Overall) | 236 (44.9%) | 290 (55.1%) |
Services Occupations
The most common Services occupations in Chester are Healthcare Support (46 | 8.7%), Food Preparation & Serving (28 | 5.3%), and Cleaning & Maintenance (13 | 2.5%).
Services Occupations by Sex
| Occupation | Male | Female |
| Healthcare Support | 0 (0.0%) | 46 (100.0%) |
| Security & Protection | 0 (0.0%) | 0 (0.0%) |
| Firefighting & Prevention | 0 (0.0%) | 0 (0.0%) |
| Law Enforcement | 0 (0.0%) | 0 (0.0%) |
| Food Preparation & Serving | 0 (0.0%) | 28 (100.0%) |
| Cleaning & Maintenance | 13 (100.0%) | 0 (0.0%) |
| Personal Care & Service | 0 (0.0%) | 0 (0.0%) |
| Total (Category) | 13 (14.9%) | 74 (85.1%) |
| Total (Overall) | 236 (44.9%) | 290 (55.1%) |
Sales and Office Occupations
The most common Sales and Office occupations in Chester are Sales & Related (18 | 3.4%), and Office & Administration (11 | 2.1%).
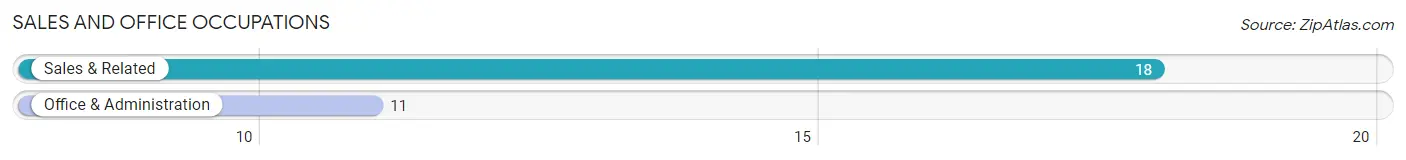
Sales and Office Occupations by Sex
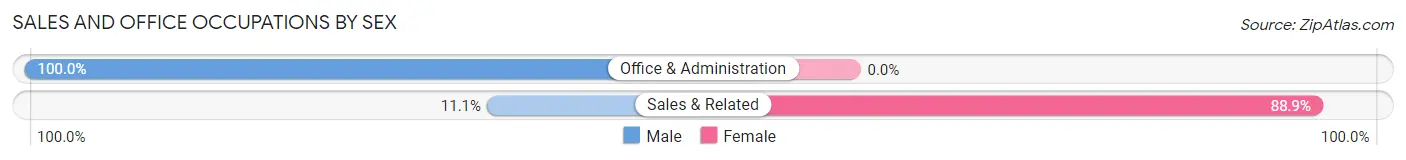
| Occupation | Male | Female |
| Sales & Related | 2 (11.1%) | 16 (88.9%) |
| Office & Administration | 11 (100.0%) | 0 (0.0%) |
| Total (Category) | 13 (44.8%) | 16 (55.2%) |
| Total (Overall) | 236 (44.9%) | 290 (55.1%) |
Natural Resources, Construction and Maintenance Occupations
The most common Natural Resources, Construction and Maintenance occupations in Chester are Construction & Extraction (69 | 13.1%), and Farming, Fishing & Forestry (59 | 11.2%).
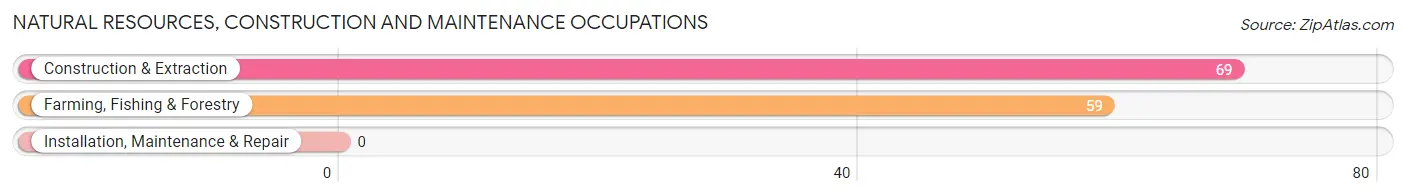
Natural Resources, Construction and Maintenance Occupations by Sex
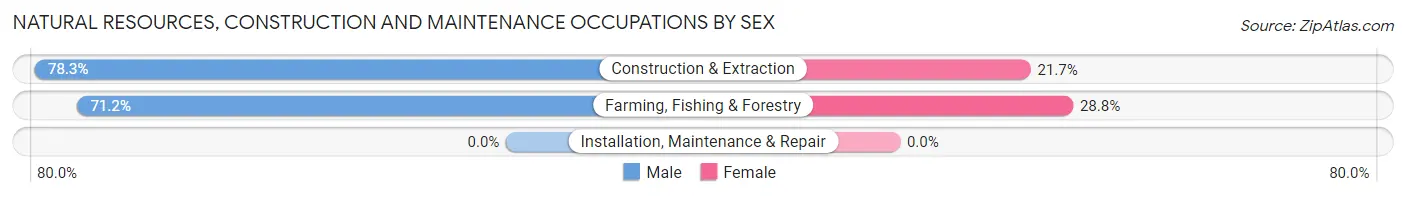
| Occupation | Male | Female |
| Farming, Fishing & Forestry | 42 (71.2%) | 17 (28.8%) |
| Construction & Extraction | 54 (78.3%) | 15 (21.7%) |
| Installation, Maintenance & Repair | 0 (0.0%) | 0 (0.0%) |
| Total (Category) | 96 (75.0%) | 32 (25.0%) |
| Total (Overall) | 236 (44.9%) | 290 (55.1%) |
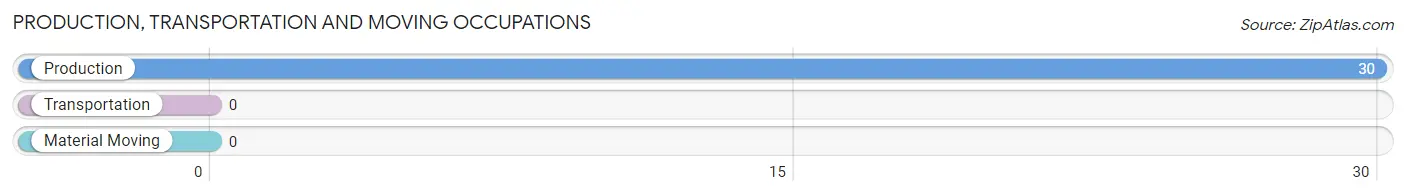
Production, Transportation and Moving Occupations
The most common Production, Transportation and Moving occupations in Chester are , and Production (30 | 5.7%).
Production, Transportation and Moving Occupations by Sex
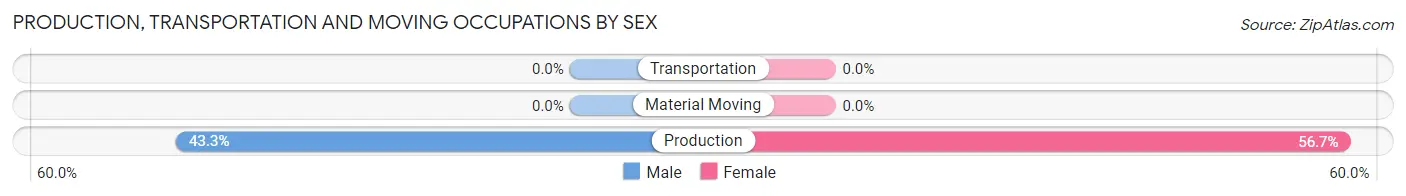
| Occupation | Male | Female |
| Production | 13 (43.3%) | 17 (56.7%) |
| Transportation | 0 (0.0%) | 0 (0.0%) |
| Material Moving | 0 (0.0%) | 0 (0.0%) |
| Total (Category) | 13 (43.3%) | 17 (56.7%) |
| Total (Overall) | 236 (44.9%) | 290 (55.1%) |
Employment Industries by Sex in Chester
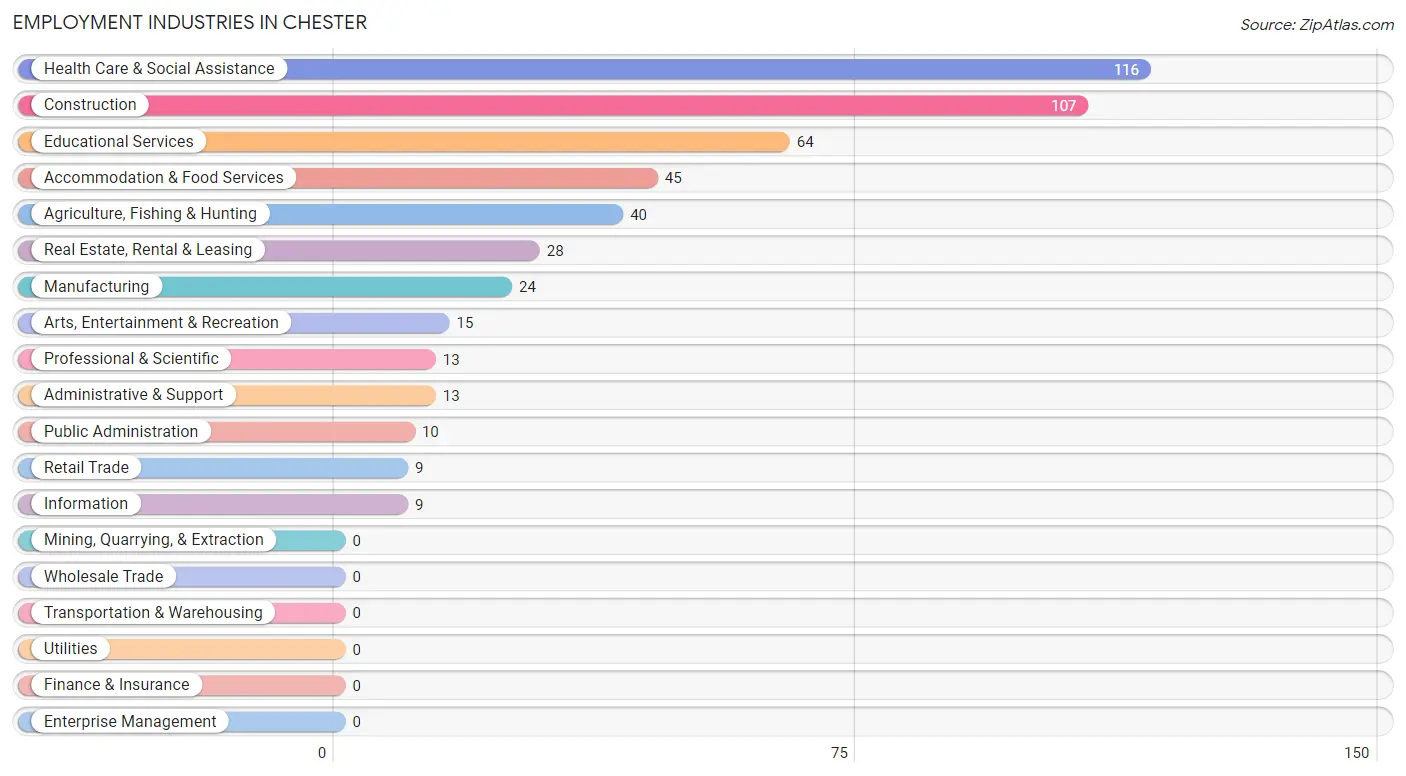
Employment Industries in Chester
The major employment industries in Chester include Health Care & Social Assistance (116 | 22.1%), Construction (107 | 20.3%), Educational Services (64 | 12.2%), Accommodation & Food Services (45 | 8.6%), and Agriculture, Fishing & Hunting (40 | 7.6%).
Employment Industries by Sex in Chester
The Chester industries that see more men than women are Construction (100.0%), Manufacturing (100.0%), and Real Estate, Rental & Leasing (100.0%), whereas the industries that tend to have a higher number of women are Information (100.0%), Professional & Scientific (100.0%), and Arts, Entertainment & Recreation (100.0%).
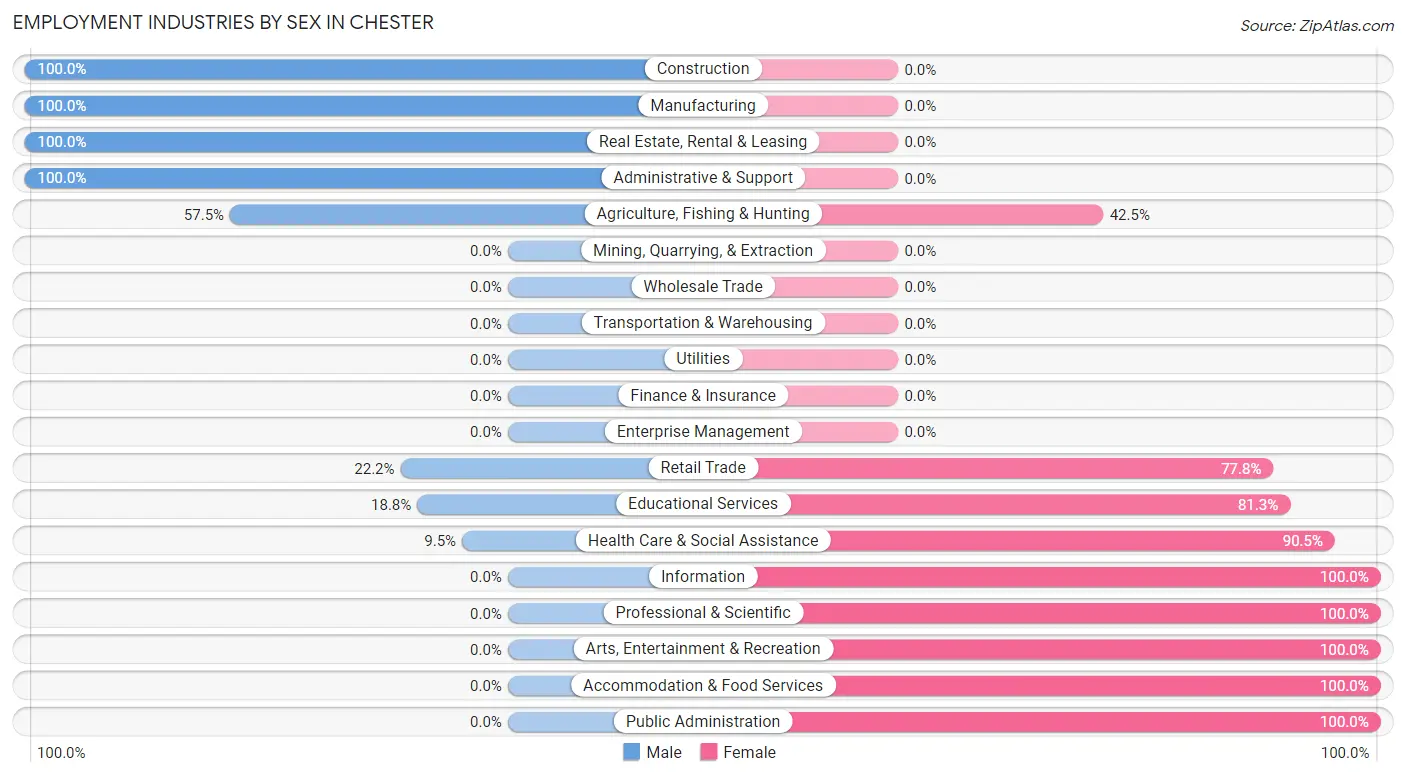
| Industry | Male | Female |
| Agriculture, Fishing & Hunting | 23 (57.5%) | 17 (42.5%) |
| Mining, Quarrying, & Extraction | 0 (0.0%) | 0 (0.0%) |
| Construction | 107 (100.0%) | 0 (0.0%) |
| Manufacturing | 24 (100.0%) | 0 (0.0%) |
| Wholesale Trade | 0 (0.0%) | 0 (0.0%) |
| Retail Trade | 2 (22.2%) | 7 (77.8%) |
| Transportation & Warehousing | 0 (0.0%) | 0 (0.0%) |
| Utilities | 0 (0.0%) | 0 (0.0%) |
| Information | 0 (0.0%) | 9 (100.0%) |
| Finance & Insurance | 0 (0.0%) | 0 (0.0%) |
| Real Estate, Rental & Leasing | 28 (100.0%) | 0 (0.0%) |
| Professional & Scientific | 0 (0.0%) | 13 (100.0%) |
| Enterprise Management | 0 (0.0%) | 0 (0.0%) |
| Administrative & Support | 13 (100.0%) | 0 (0.0%) |
| Educational Services | 12 (18.8%) | 52 (81.2%) |
| Health Care & Social Assistance | 11 (9.5%) | 105 (90.5%) |
| Arts, Entertainment & Recreation | 0 (0.0%) | 15 (100.0%) |
| Accommodation & Food Services | 0 (0.0%) | 45 (100.0%) |
| Public Administration | 0 (0.0%) | 10 (100.0%) |
| Total | 236 (44.9%) | 290 (55.1%) |
Education in Chester
School Enrollment in Chester
The most common levels of schooling among the 213 students in Chester are elementary school (93 | 43.7%), high school (74 | 34.7%), and middle school (25 | 11.7%).
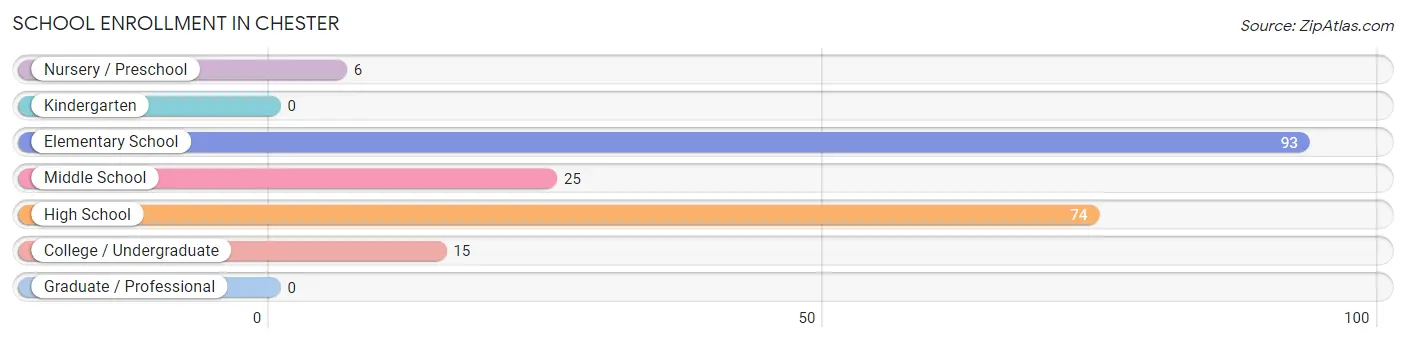
| School Level | # Students | % Students |
| Nursery / Preschool | 6 | 2.8% |
| Kindergarten | 0 | 0.0% |
| Elementary School | 93 | 43.7% |
| Middle School | 25 | 11.7% |
| High School | 74 | 34.7% |
| College / Undergraduate | 15 | 7.0% |
| Graduate / Professional | 0 | 0.0% |
| Total | 213 | 100.0% |
School Enrollment by Age by Funding Source in Chester
Out of a total of 213 students who are enrolled in schools in Chester, 74 (34.7%) attend a private institution, while the remaining 139 (65.3%) are enrolled in public schools. The age group of 3 to 4 year olds has the highest likelihood of being enrolled in private schools, with 6 (100.0% in the age bracket) enrolled. Conversely, the age group of 5 to 9 year old has the lowest likelihood of being enrolled in a private school, with 77 (100.0% in the age bracket) attending a public institution.
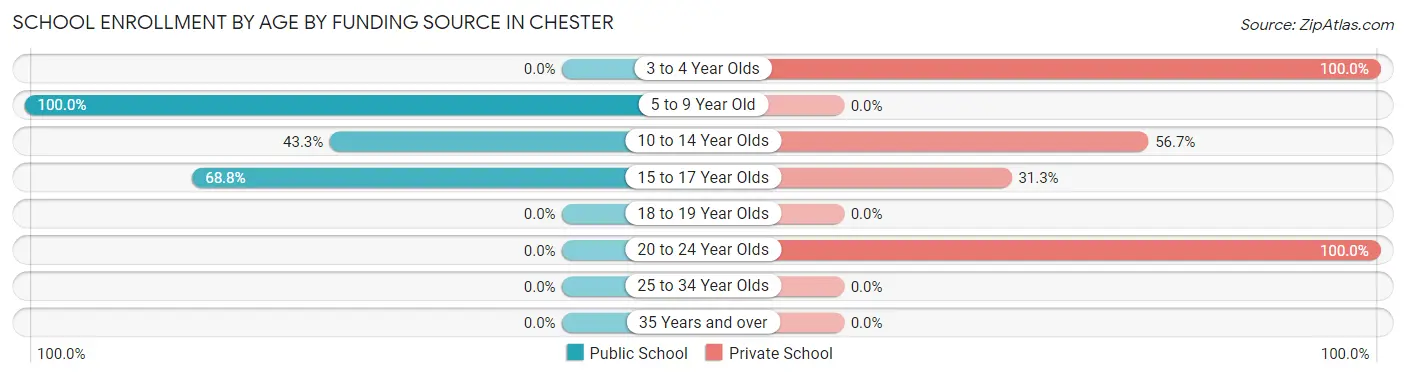
| Age Bracket | Public School | Private School |
| 3 to 4 Year Olds | 0 (0.0%) | 6 (100.0%) |
| 5 to 9 Year Old | 77 (100.0%) | 0 (0.0%) |
| 10 to 14 Year Olds | 29 (43.3%) | 38 (56.7%) |
| 15 to 17 Year Olds | 33 (68.8%) | 15 (31.2%) |
| 18 to 19 Year Olds | 0 (0.0%) | 0 (0.0%) |
| 20 to 24 Year Olds | 0 (0.0%) | 15 (100.0%) |
| 25 to 34 Year Olds | 0 (0.0%) | 0 (0.0%) |
| 35 Years and over | 0 (0.0%) | 0 (0.0%) |
| Total | 139 (65.3%) | 74 (34.7%) |
Educational Attainment by Field of Study in Chester
Education (113 | 27.4%), visual & performing arts (62 | 15.0%), communications (51 | 12.4%), bio, nature & agricultural (47 | 11.4%), and arts & humanities (41 | 10.0%) are the most common fields of study among 412 individuals in Chester who have obtained a bachelor's degree or higher.
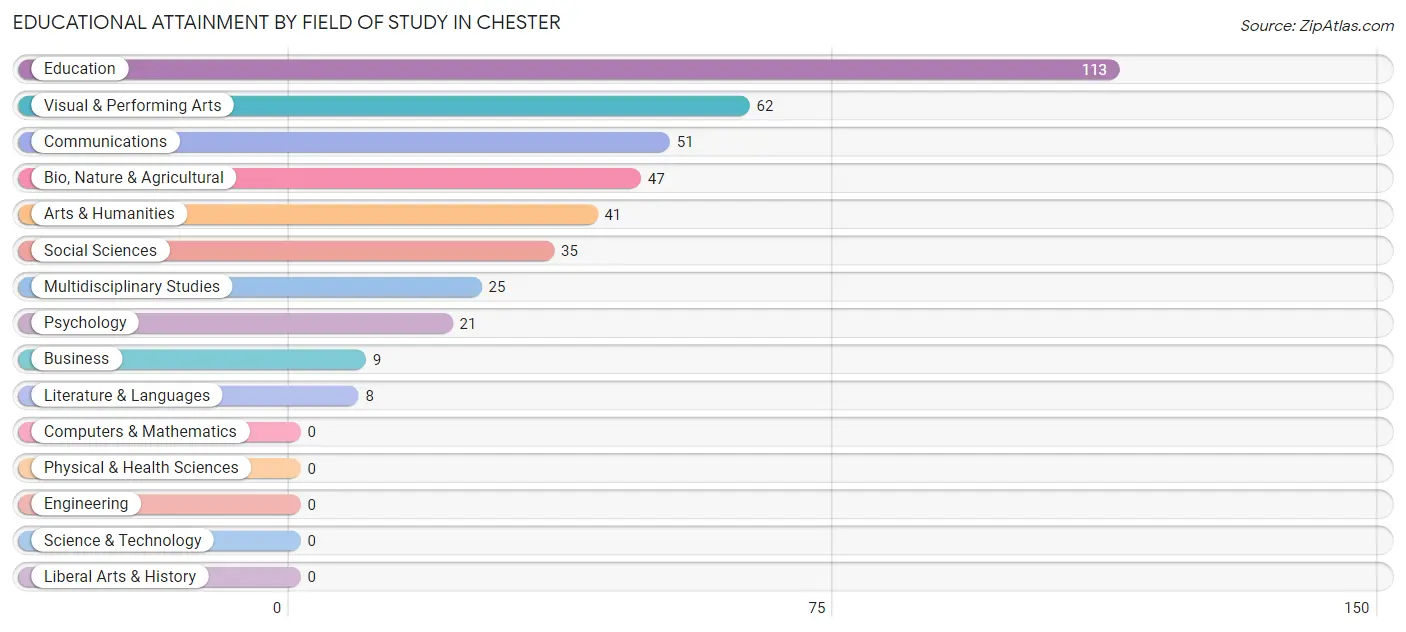
| Field of Study | # Graduates | % Graduates |
| Computers & Mathematics | 0 | 0.0% |
| Bio, Nature & Agricultural | 47 | 11.4% |
| Physical & Health Sciences | 0 | 0.0% |
| Psychology | 21 | 5.1% |
| Social Sciences | 35 | 8.5% |
| Engineering | 0 | 0.0% |
| Multidisciplinary Studies | 25 | 6.1% |
| Science & Technology | 0 | 0.0% |
| Business | 9 | 2.2% |
| Education | 113 | 27.4% |
| Literature & Languages | 8 | 1.9% |
| Liberal Arts & History | 0 | 0.0% |
| Visual & Performing Arts | 62 | 15.0% |
| Communications | 51 | 12.4% |
| Arts & Humanities | 41 | 10.0% |
| Total | 412 | 100.0% |
Transportation & Commute in Chester
Vehicle Availability by Sex in Chester
The most prevalent vehicle ownership categories in Chester are males with 2 vehicles (210, accounting for 89.0%) and females with 2 vehicles (219, making up 72.4%).
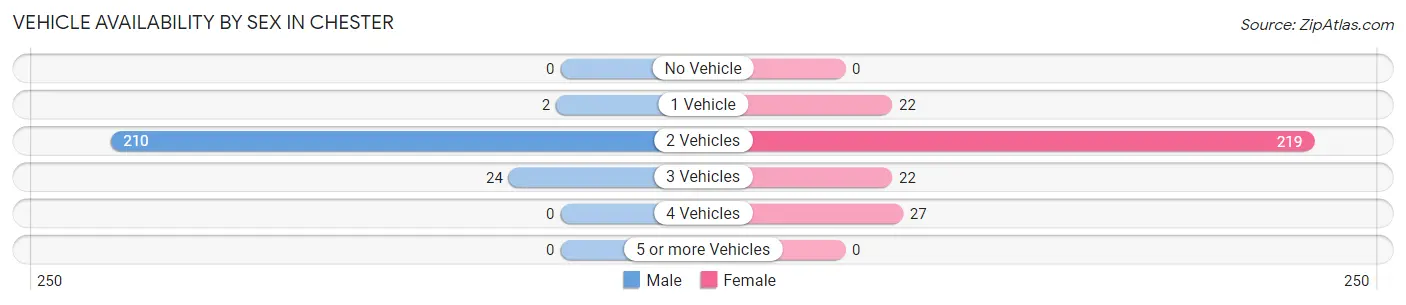
| Vehicles Available | Male | Female |
| No Vehicle | 0 (0.0%) | 0 (0.0%) |
| 1 Vehicle | 2 (0.9%) | 22 (7.6%) |
| 2 Vehicles | 210 (89.0%) | 219 (75.5%) |
| 3 Vehicles | 24 (10.2%) | 22 (7.6%) |
| 4 Vehicles | 0 (0.0%) | 27 (9.3%) |
| 5 or more Vehicles | 0 (0.0%) | 0 (0.0%) |
| Total | 236 (100.0%) | 290 (100.0%) |
Commute Time in Chester
The most frequently occuring commute durations in Chester are 20 to 24 minutes (96 commuters, 19.1%), 5 to 9 minutes (84 commuters, 16.7%), and 30 to 34 minutes (80 commuters, 15.9%).
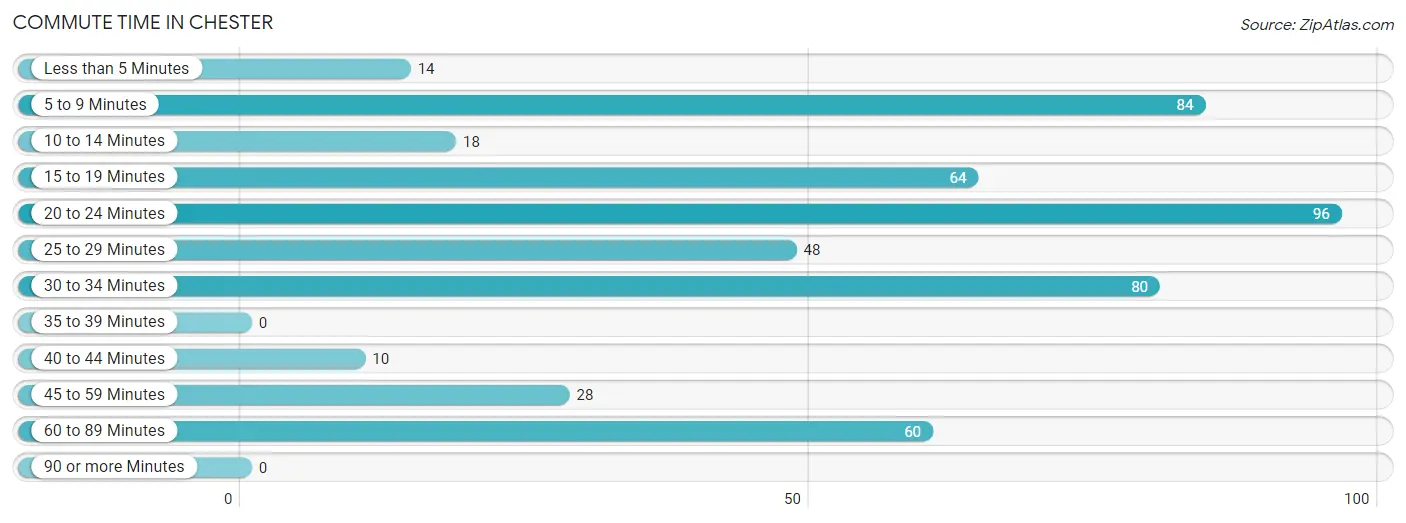
| Commute Time | # Commuters | % Commuters |
| Less than 5 Minutes | 14 | 2.8% |
| 5 to 9 Minutes | 84 | 16.7% |
| 10 to 14 Minutes | 18 | 3.6% |
| 15 to 19 Minutes | 64 | 12.8% |
| 20 to 24 Minutes | 96 | 19.1% |
| 25 to 29 Minutes | 48 | 9.6% |
| 30 to 34 Minutes | 80 | 15.9% |
| 35 to 39 Minutes | 0 | 0.0% |
| 40 to 44 Minutes | 10 | 2.0% |
| 45 to 59 Minutes | 28 | 5.6% |
| 60 to 89 Minutes | 60 | 11.9% |
| 90 or more Minutes | 0 | 0.0% |
Commute Time by Sex in Chester
The most common commute times in Chester are 60 to 89 minutes (60 commuters, 25.4%) for males and 5 to 9 minutes (56 commuters, 21.0%) for females.
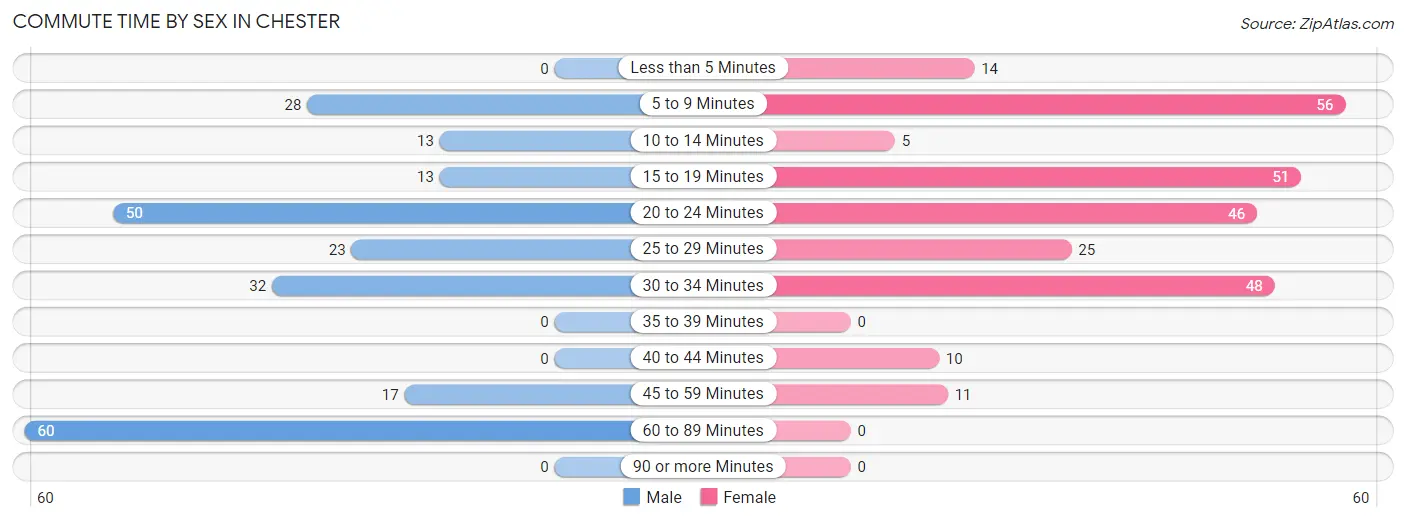
| Commute Time | Male | Female |
| Less than 5 Minutes | 0 (0.0%) | 14 (5.3%) |
| 5 to 9 Minutes | 28 (11.9%) | 56 (21.0%) |
| 10 to 14 Minutes | 13 (5.5%) | 5 (1.9%) |
| 15 to 19 Minutes | 13 (5.5%) | 51 (19.2%) |
| 20 to 24 Minutes | 50 (21.2%) | 46 (17.3%) |
| 25 to 29 Minutes | 23 (9.8%) | 25 (9.4%) |
| 30 to 34 Minutes | 32 (13.6%) | 48 (18.0%) |
| 35 to 39 Minutes | 0 (0.0%) | 0 (0.0%) |
| 40 to 44 Minutes | 0 (0.0%) | 10 (3.8%) |
| 45 to 59 Minutes | 17 (7.2%) | 11 (4.1%) |
| 60 to 89 Minutes | 60 (25.4%) | 0 (0.0%) |
| 90 or more Minutes | 0 (0.0%) | 0 (0.0%) |
Time of Departure to Work by Sex in Chester
The most frequent times of departure to work in Chester are 7:00 AM to 7:29 AM (77, 32.6%) for males and 4:00 PM to 11:59 PM (63, 23.7%) for females.
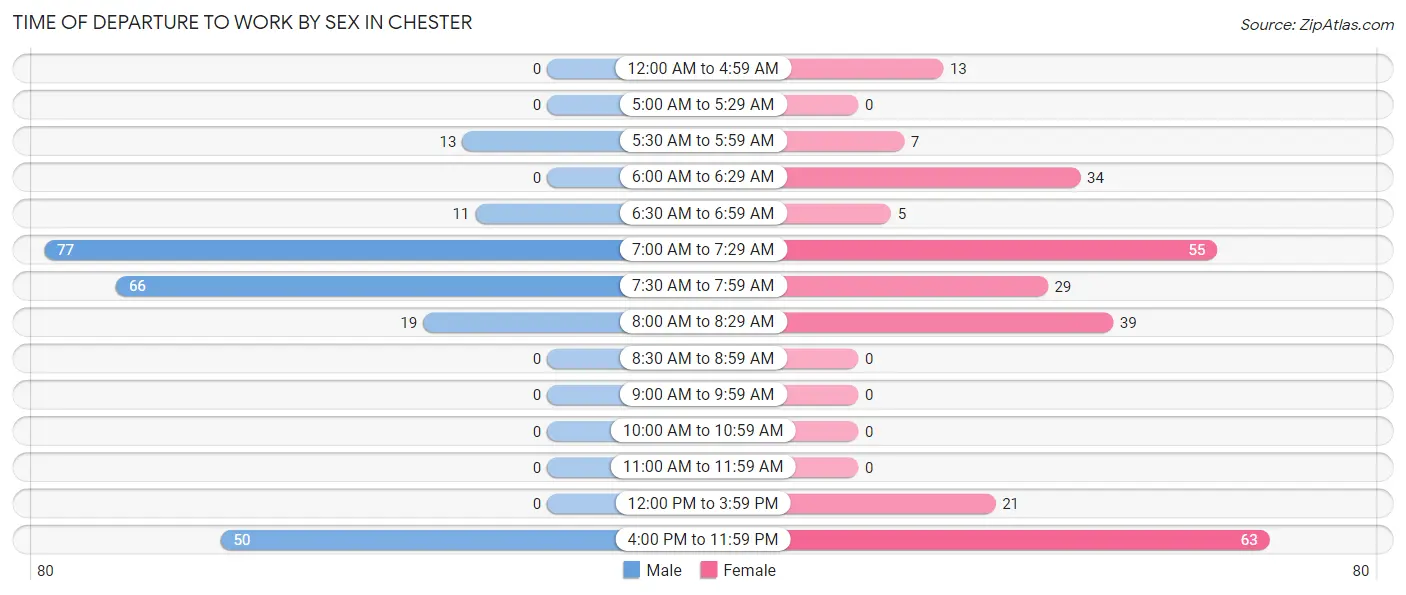
| Time of Departure | Male | Female |
| 12:00 AM to 4:59 AM | 0 (0.0%) | 13 (4.9%) |
| 5:00 AM to 5:29 AM | 0 (0.0%) | 0 (0.0%) |
| 5:30 AM to 5:59 AM | 13 (5.5%) | 7 (2.6%) |
| 6:00 AM to 6:29 AM | 0 (0.0%) | 34 (12.8%) |
| 6:30 AM to 6:59 AM | 11 (4.7%) | 5 (1.9%) |
| 7:00 AM to 7:29 AM | 77 (32.6%) | 55 (20.7%) |
| 7:30 AM to 7:59 AM | 66 (28.0%) | 29 (10.9%) |
| 8:00 AM to 8:29 AM | 19 (8.1%) | 39 (14.7%) |
| 8:30 AM to 8:59 AM | 0 (0.0%) | 0 (0.0%) |
| 9:00 AM to 9:59 AM | 0 (0.0%) | 0 (0.0%) |
| 10:00 AM to 10:59 AM | 0 (0.0%) | 0 (0.0%) |
| 11:00 AM to 11:59 AM | 0 (0.0%) | 0 (0.0%) |
| 12:00 PM to 3:59 PM | 0 (0.0%) | 21 (7.9%) |
| 4:00 PM to 11:59 PM | 50 (21.2%) | 63 (23.7%) |
| Total | 236 (100.0%) | 266 (100.0%) |
Housing Occupancy in Chester
Occupancy by Ownership in Chester
Of the total 444 dwellings in Chester, owner-occupied units account for 265 (59.7%), while renter-occupied units make up 179 (40.3%).
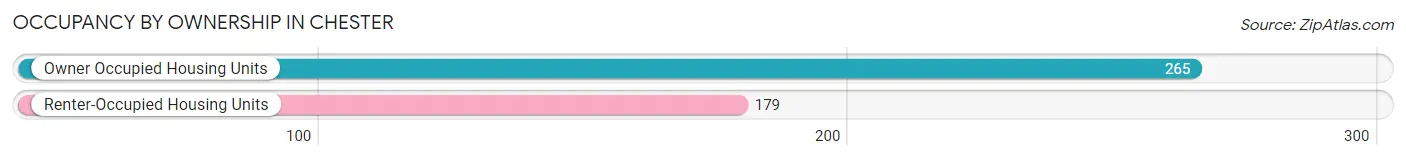
| Occupancy | # Housing Units | % Housing Units |
| Owner Occupied Housing Units | 265 | 59.7% |
| Renter-Occupied Housing Units | 179 | 40.3% |
| Total Occupied Housing Units | 444 | 100.0% |
Occupancy by Household Size in Chester
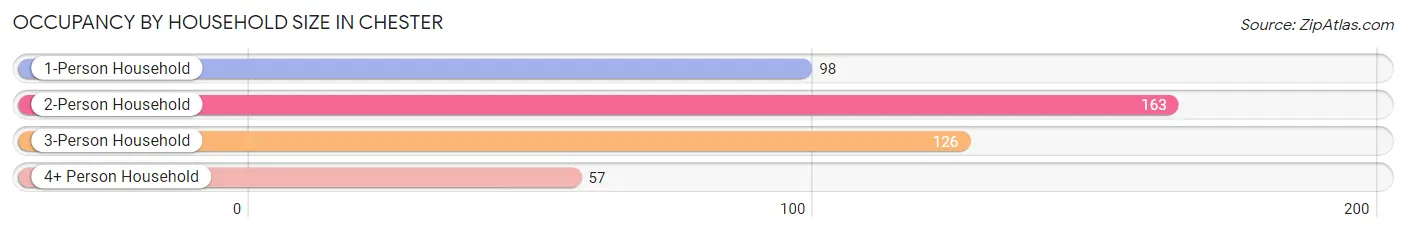
| Household Size | # Housing Units | % Housing Units |
| 1-Person Household | 98 | 22.1% |
| 2-Person Household | 163 | 36.7% |
| 3-Person Household | 126 | 28.4% |
| 4+ Person Household | 57 | 12.8% |
| Total Housing Units | 444 | 100.0% |
Occupancy by Ownership by Household Size in Chester
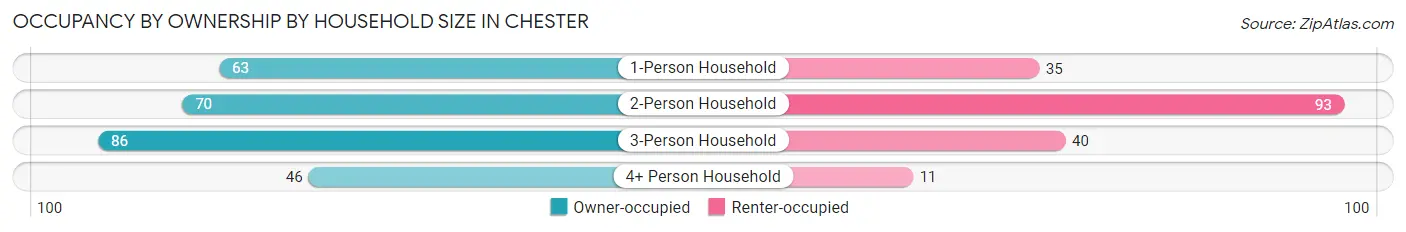
| Household Size | Owner-occupied | Renter-occupied |
| 1-Person Household | 63 (64.3%) | 35 (35.7%) |
| 2-Person Household | 70 (42.9%) | 93 (57.1%) |
| 3-Person Household | 86 (68.2%) | 40 (31.8%) |
| 4+ Person Household | 46 (80.7%) | 11 (19.3%) |
| Total Housing Units | 265 (59.7%) | 179 (40.3%) |
Occupancy by Educational Attainment in Chester
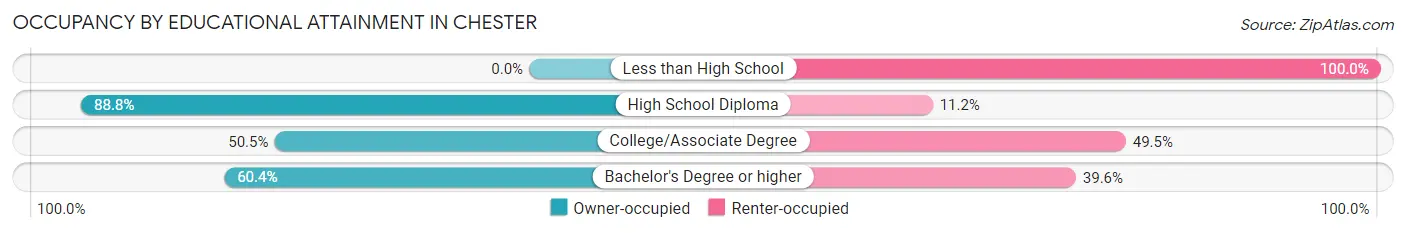
| Household Size | Owner-occupied | Renter-occupied |
| Less than High School | 0 (0.0%) | 39 (100.0%) |
| High School Diploma | 95 (88.8%) | 12 (11.2%) |
| College/Associate Degree | 51 (50.5%) | 50 (49.5%) |
| Bachelor's Degree or higher | 119 (60.4%) | 78 (39.6%) |
Occupancy by Age of Householder in Chester
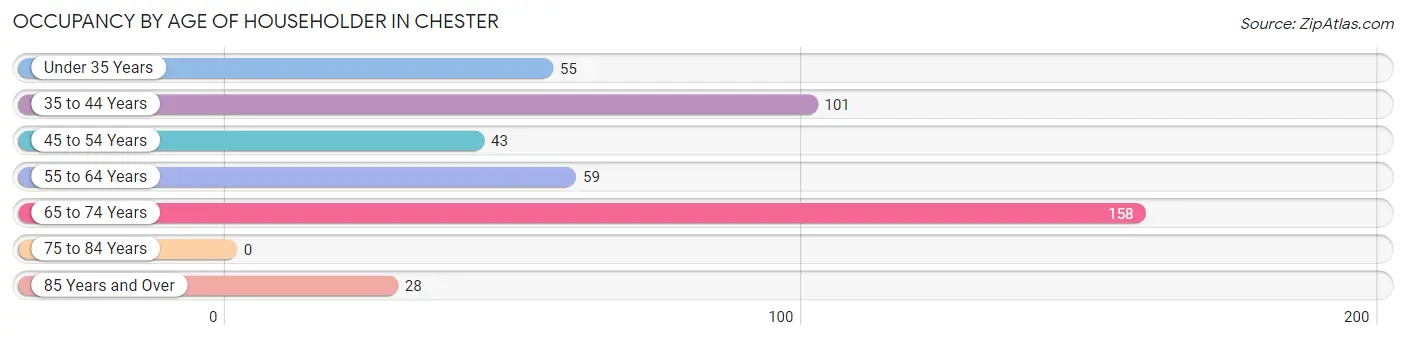
| Age Bracket | # Households | % Households |
| Under 35 Years | 55 | 12.4% |
| 35 to 44 Years | 101 | 22.8% |
| 45 to 54 Years | 43 | 9.7% |
| 55 to 64 Years | 59 | 13.3% |
| 65 to 74 Years | 158 | 35.6% |
| 75 to 84 Years | 0 | 0.0% |
| 85 Years and Over | 28 | 6.3% |
| Total | 444 | 100.0% |
Housing Finances in Chester
Median Income by Occupancy in Chester
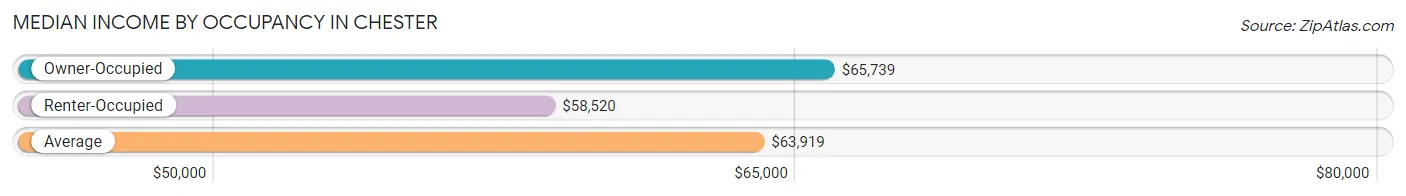
| Occupancy Type | # Households | Median Income |
| Owner-Occupied | 265 (59.7%) | $65,739 |
| Renter-Occupied | 179 (40.3%) | $58,520 |
| Average | 444 (100.0%) | $63,919 |
Occupancy by Householder Income Bracket in Chester
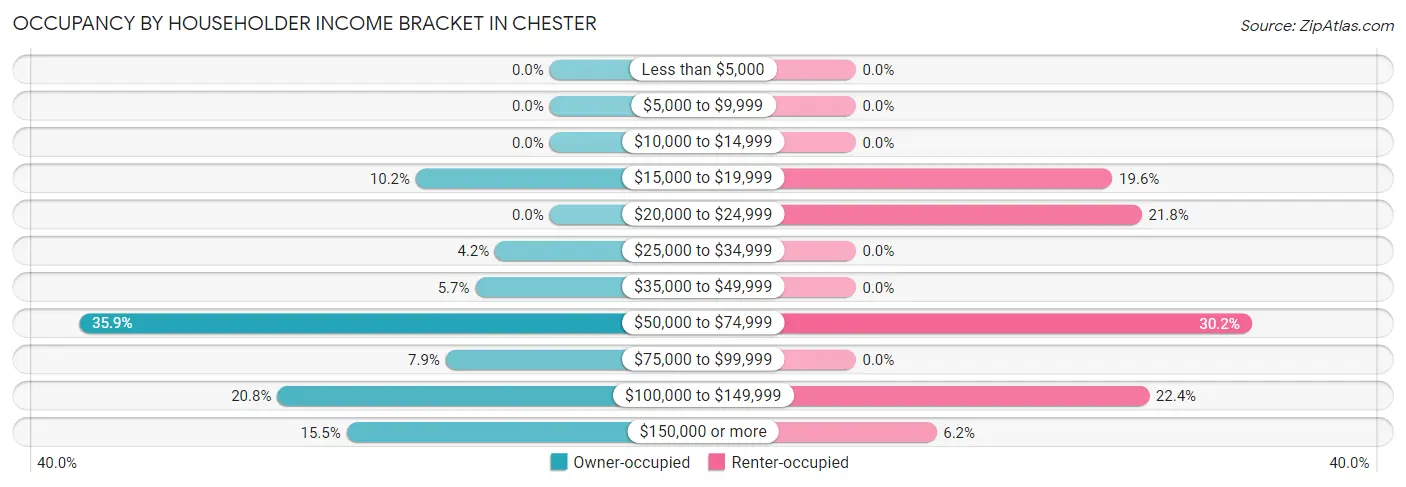
| Income Bracket | Owner-occupied | Renter-occupied |
| Less than $5,000 | 0 (0.0%) | 0 (0.0%) |
| $5,000 to $9,999 | 0 (0.0%) | 0 (0.0%) |
| $10,000 to $14,999 | 0 (0.0%) | 0 (0.0%) |
| $15,000 to $19,999 | 27 (10.2%) | 35 (19.6%) |
| $20,000 to $24,999 | 0 (0.0%) | 39 (21.8%) |
| $25,000 to $34,999 | 11 (4.2%) | 0 (0.0%) |
| $35,000 to $49,999 | 15 (5.7%) | 0 (0.0%) |
| $50,000 to $74,999 | 95 (35.8%) | 54 (30.2%) |
| $75,000 to $99,999 | 21 (7.9%) | 0 (0.0%) |
| $100,000 to $149,999 | 55 (20.7%) | 40 (22.4%) |
| $150,000 or more | 41 (15.5%) | 11 (6.1%) |
| Total | 265 (100.0%) | 179 (100.0%) |
Monthly Housing Cost Tiers in Chester
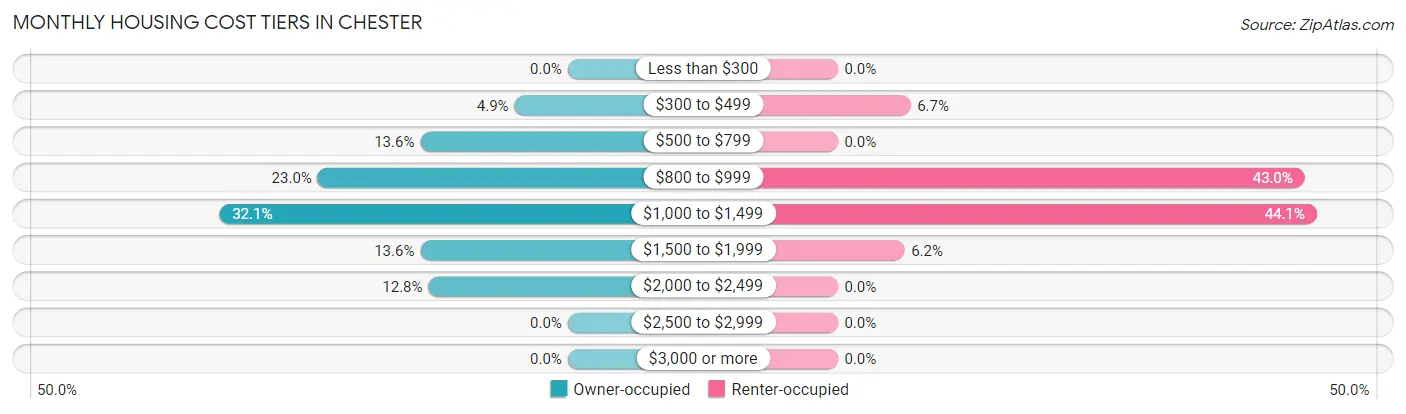
| Monthly Cost | Owner-occupied | Renter-occupied |
| Less than $300 | 0 (0.0%) | 0 (0.0%) |
| $300 to $499 | 13 (4.9%) | 12 (6.7%) |
| $500 to $799 | 36 (13.6%) | 0 (0.0%) |
| $800 to $999 | 61 (23.0%) | 77 (43.0%) |
| $1,000 to $1,499 | 85 (32.1%) | 79 (44.1%) |
| $1,500 to $1,999 | 36 (13.6%) | 11 (6.1%) |
| $2,000 to $2,499 | 34 (12.8%) | 0 (0.0%) |
| $2,500 to $2,999 | 0 (0.0%) | 0 (0.0%) |
| $3,000 or more | 0 (0.0%) | 0 (0.0%) |
| Total | 265 (100.0%) | 179 (100.0%) |
Physical Housing Characteristics in Chester
Housing Structures in Chester
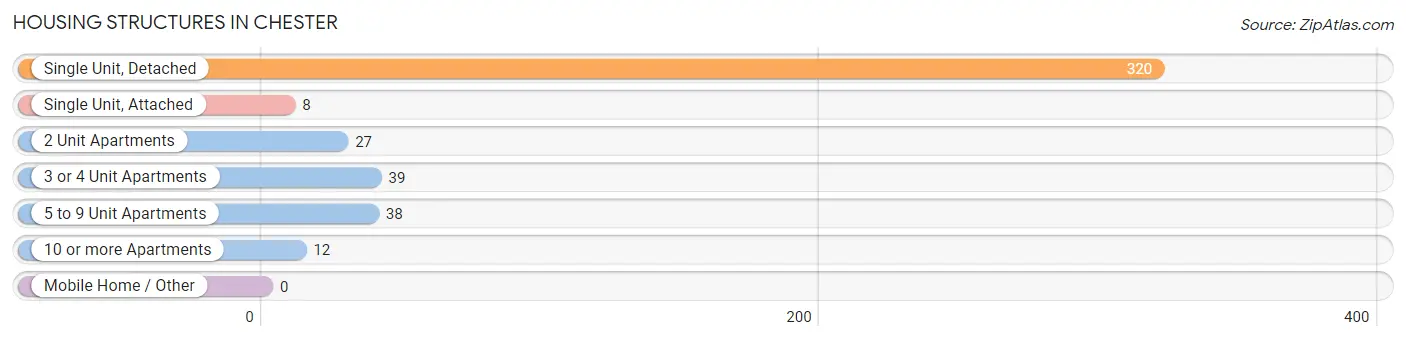
| Structure Type | # Housing Units | % Housing Units |
| Single Unit, Detached | 320 | 72.1% |
| Single Unit, Attached | 8 | 1.8% |
| 2 Unit Apartments | 27 | 6.1% |
| 3 or 4 Unit Apartments | 39 | 8.8% |
| 5 to 9 Unit Apartments | 38 | 8.6% |
| 10 or more Apartments | 12 | 2.7% |
| Mobile Home / Other | 0 | 0.0% |
| Total | 444 | 100.0% |
Housing Structures by Occupancy in Chester
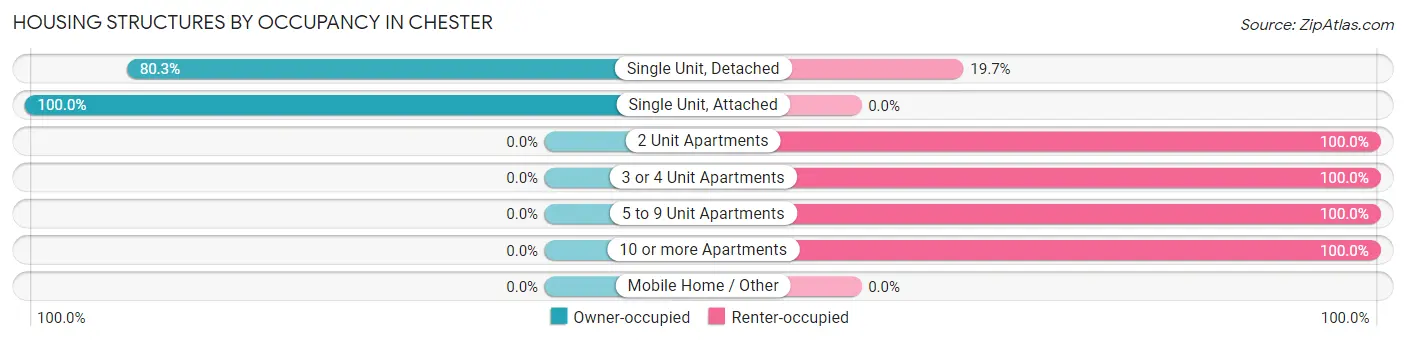
| Structure Type | Owner-occupied | Renter-occupied |
| Single Unit, Detached | 257 (80.3%) | 63 (19.7%) |
| Single Unit, Attached | 8 (100.0%) | 0 (0.0%) |
| 2 Unit Apartments | 0 (0.0%) | 27 (100.0%) |
| 3 or 4 Unit Apartments | 0 (0.0%) | 39 (100.0%) |
| 5 to 9 Unit Apartments | 0 (0.0%) | 38 (100.0%) |
| 10 or more Apartments | 0 (0.0%) | 12 (100.0%) |
| Mobile Home / Other | 0 (0.0%) | 0 (0.0%) |
| Total | 265 (59.7%) | 179 (40.3%) |
Housing Structures by Number of Rooms in Chester
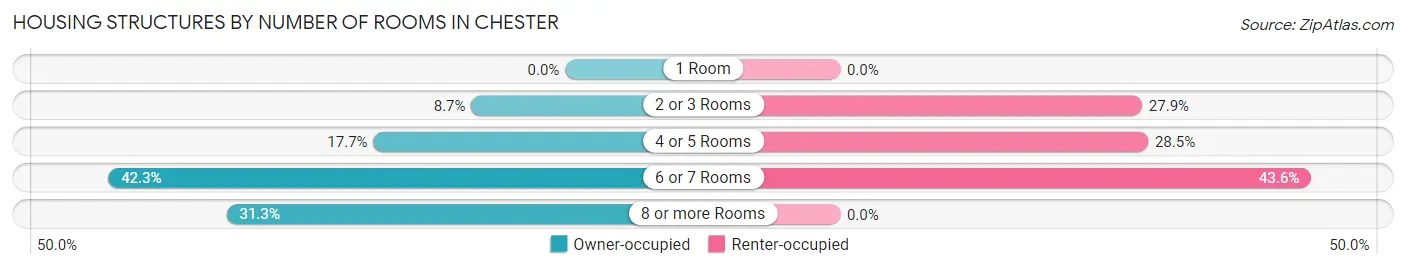
| Number of Rooms | Owner-occupied | Renter-occupied |
| 1 Room | 0 (0.0%) | 0 (0.0%) |
| 2 or 3 Rooms | 23 (8.7%) | 50 (27.9%) |
| 4 or 5 Rooms | 47 (17.7%) | 51 (28.5%) |
| 6 or 7 Rooms | 112 (42.3%) | 78 (43.6%) |
| 8 or more Rooms | 83 (31.3%) | 0 (0.0%) |
| Total | 265 (100.0%) | 179 (100.0%) |
Housing Structure by Heating Type in Chester
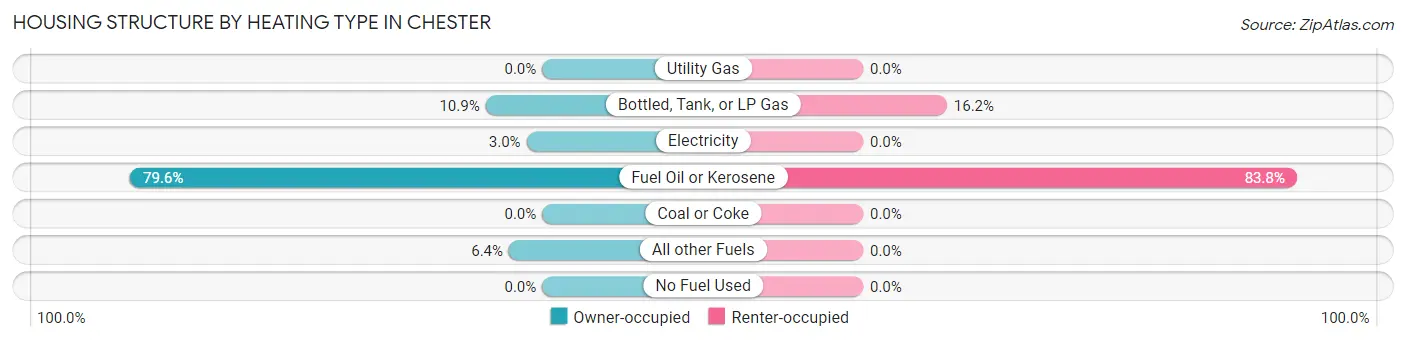
| Heating Type | Owner-occupied | Renter-occupied |
| Utility Gas | 0 (0.0%) | 0 (0.0%) |
| Bottled, Tank, or LP Gas | 29 (10.9%) | 29 (16.2%) |
| Electricity | 8 (3.0%) | 0 (0.0%) |
| Fuel Oil or Kerosene | 211 (79.6%) | 150 (83.8%) |
| Coal or Coke | 0 (0.0%) | 0 (0.0%) |
| All other Fuels | 17 (6.4%) | 0 (0.0%) |
| No Fuel Used | 0 (0.0%) | 0 (0.0%) |
| Total | 265 (100.0%) | 179 (100.0%) |
Household Vehicle Usage in Chester
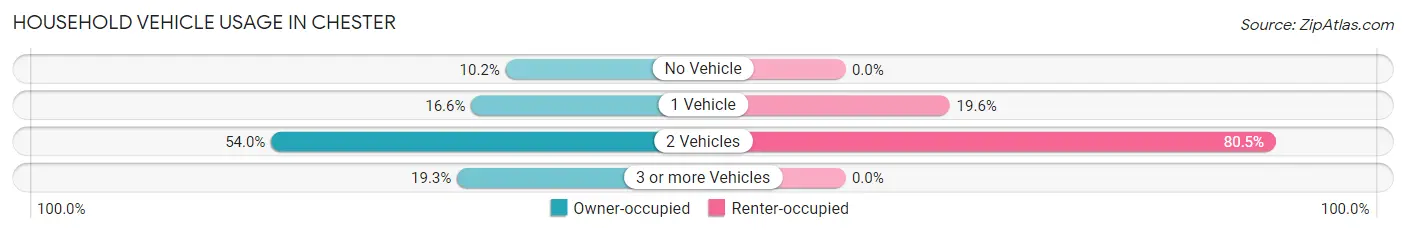
| Vehicles per Household | Owner-occupied | Renter-occupied |
| No Vehicle | 27 (10.2%) | 0 (0.0%) |
| 1 Vehicle | 44 (16.6%) | 35 (19.6%) |
| 2 Vehicles | 143 (54.0%) | 144 (80.4%) |
| 3 or more Vehicles | 51 (19.3%) | 0 (0.0%) |
| Total | 265 (100.0%) | 179 (100.0%) |
Real Estate & Mortgages in Chester
Real Estate and Mortgage Overview in Chester
| Characteristic | Without Mortgage | With Mortgage |
| Housing Units | 129 | 136 |
| Median Property Value | $293,800 | $256,300 |
| Median Household Income | $63,594 | $13 |
| Monthly Housing Costs | $928 | $0 |
| Real Estate Taxes | $4,569 | $0 |
Property Value by Mortgage Status in Chester
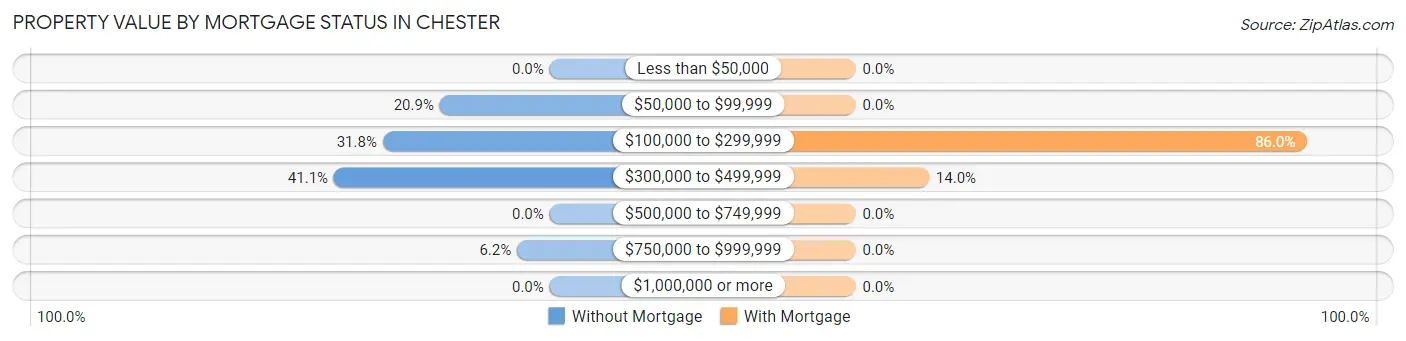
| Property Value | Without Mortgage | With Mortgage |
| Less than $50,000 | 0 (0.0%) | 0 (0.0%) |
| $50,000 to $99,999 | 27 (20.9%) | 0 (0.0%) |
| $100,000 to $299,999 | 41 (31.8%) | 117 (86.0%) |
| $300,000 to $499,999 | 53 (41.1%) | 19 (14.0%) |
| $500,000 to $749,999 | 0 (0.0%) | 0 (0.0%) |
| $750,000 to $999,999 | 8 (6.2%) | 0 (0.0%) |
| $1,000,000 or more | 0 (0.0%) | 0 (0.0%) |
| Total | 129 (100.0%) | 136 (100.0%) |
Household Income by Mortgage Status in Chester
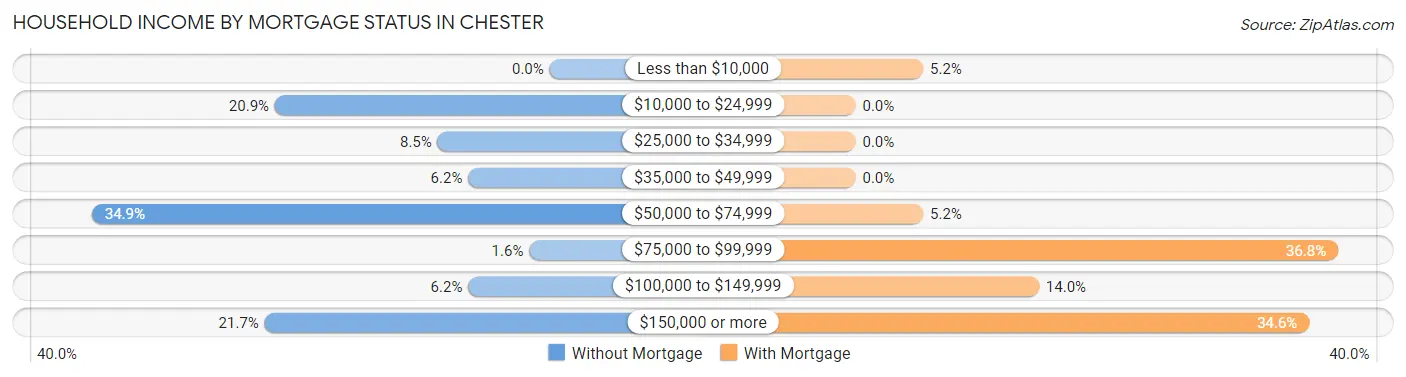
| Household Income | Without Mortgage | With Mortgage |
| Less than $10,000 | 0 (0.0%) | 7 (5.1%) |
| $10,000 to $24,999 | 27 (20.9%) | 0 (0.0%) |
| $25,000 to $34,999 | 11 (8.5%) | 0 (0.0%) |
| $35,000 to $49,999 | 8 (6.2%) | 0 (0.0%) |
| $50,000 to $74,999 | 45 (34.9%) | 7 (5.1%) |
| $75,000 to $99,999 | 2 (1.5%) | 50 (36.8%) |
| $100,000 to $149,999 | 8 (6.2%) | 19 (14.0%) |
| $150,000 or more | 28 (21.7%) | 47 (34.6%) |
| Total | 129 (100.0%) | 136 (100.0%) |
Property Value to Household Income Ratio in Chester
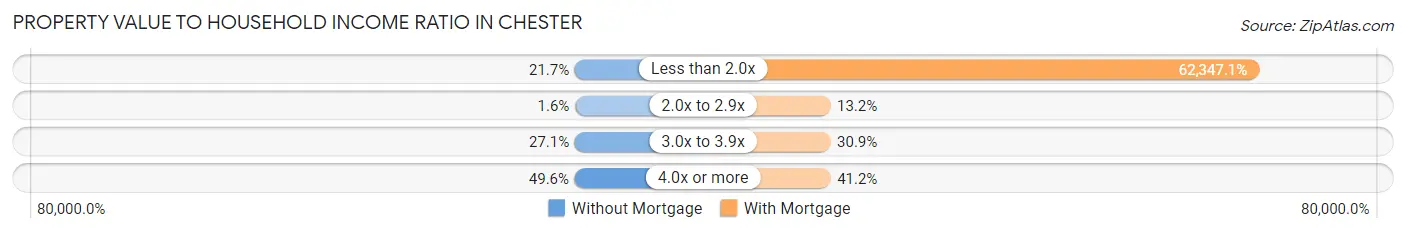
| Value-to-Income Ratio | Without Mortgage | With Mortgage |
| Less than 2.0x | 28 (21.7%) | 84,792 (62,347.1%) |
| 2.0x to 2.9x | 2 (1.5%) | 18 (13.2%) |
| 3.0x to 3.9x | 35 (27.1%) | 42 (30.9%) |
| 4.0x or more | 64 (49.6%) | 56 (41.2%) |
| Total | 129 (100.0%) | 136 (100.0%) |
Real Estate Taxes by Mortgage Status in Chester
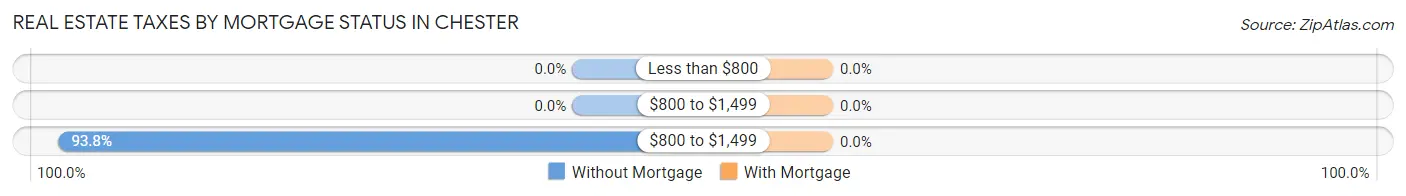
| Property Taxes | Without Mortgage | With Mortgage |
| Less than $800 | 0 (0.0%) | 0 (0.0%) |
| $800 to $1,499 | 0 (0.0%) | 0 (0.0%) |
| $800 to $1,499 | 121 (93.8%) | 0 (0.0%) |
| Total | 129 (100.0%) | 136 (100.0%) |
Health & Disability in Chester
Health Insurance Coverage by Age in Chester
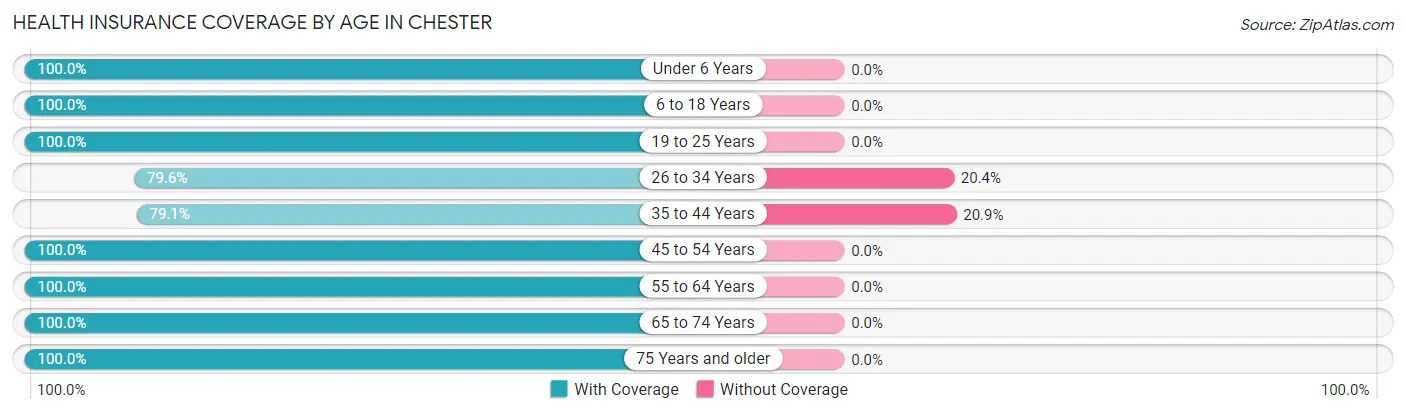
| Age Bracket | With Coverage | Without Coverage |
| Under 6 Years | 73 (100.0%) | 0 (0.0%) |
| 6 to 18 Years | 192 (100.0%) | 0 (0.0%) |
| 19 to 25 Years | 71 (100.0%) | 0 (0.0%) |
| 26 to 34 Years | 74 (79.6%) | 19 (20.4%) |
| 35 to 44 Years | 144 (79.1%) | 38 (20.9%) |
| 45 to 54 Years | 94 (100.0%) | 0 (0.0%) |
| 55 to 64 Years | 72 (100.0%) | 0 (0.0%) |
| 65 to 74 Years | 274 (100.0%) | 0 (0.0%) |
| 75 Years and older | 46 (100.0%) | 0 (0.0%) |
| Total | 1,040 (94.8%) | 57 (5.2%) |
Health Insurance Coverage by Citizenship Status in Chester
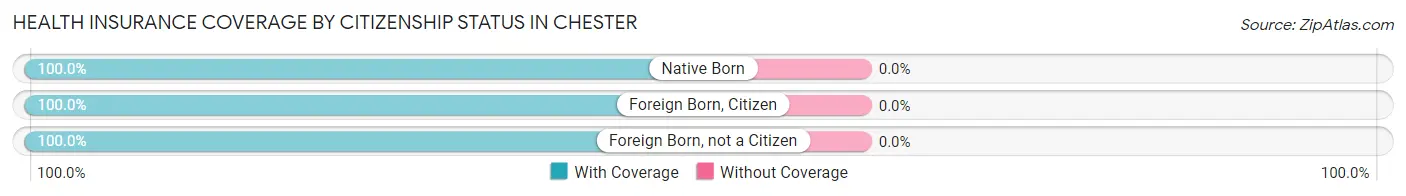
| Citizenship Status | With Coverage | Without Coverage |
| Native Born | 73 (100.0%) | 0 (0.0%) |
| Foreign Born, Citizen | 192 (100.0%) | 0 (0.0%) |
| Foreign Born, not a Citizen | 71 (100.0%) | 0 (0.0%) |
Health Insurance Coverage by Household Income in Chester
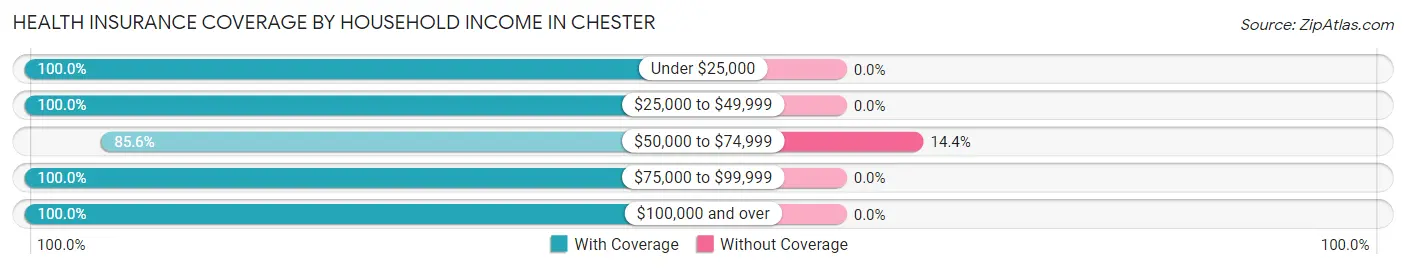
| Household Income | With Coverage | Without Coverage |
| Under $25,000 | 139 (100.0%) | 0 (0.0%) |
| $25,000 to $49,999 | 43 (100.0%) | 0 (0.0%) |
| $50,000 to $74,999 | 339 (85.6%) | 57 (14.4%) |
| $75,000 to $99,999 | 54 (100.0%) | 0 (0.0%) |
| $100,000 and over | 465 (100.0%) | 0 (0.0%) |
Public vs Private Health Insurance Coverage by Age in Chester
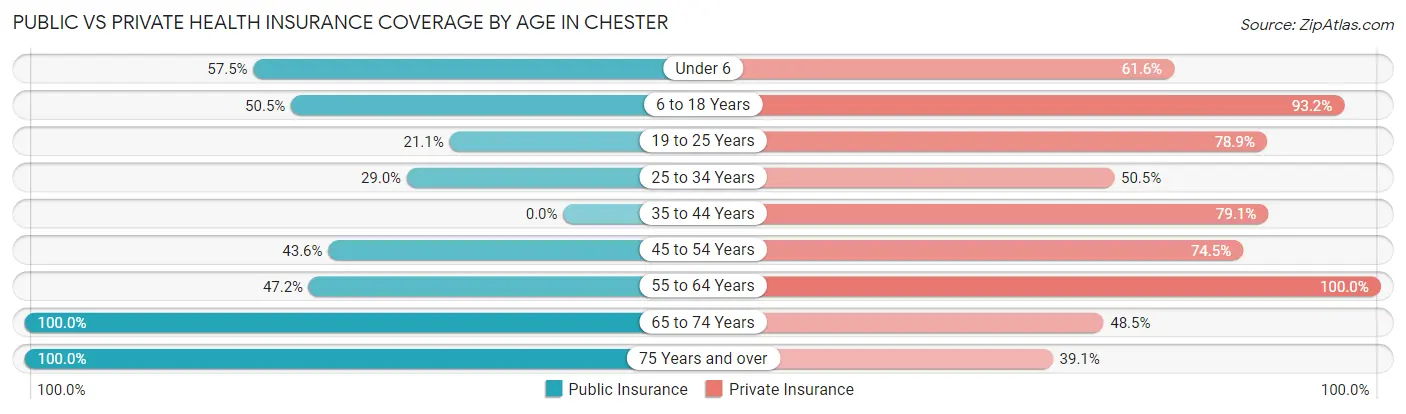
| Age Bracket | Public Insurance | Private Insurance |
| Under 6 | 42 (57.5%) | 45 (61.6%) |
| 6 to 18 Years | 97 (50.5%) | 179 (93.2%) |
| 19 to 25 Years | 15 (21.1%) | 56 (78.9%) |
| 25 to 34 Years | 27 (29.0%) | 47 (50.5%) |
| 35 to 44 Years | 0 (0.0%) | 144 (79.1%) |
| 45 to 54 Years | 41 (43.6%) | 70 (74.5%) |
| 55 to 64 Years | 34 (47.2%) | 72 (100.0%) |
| 65 to 74 Years | 274 (100.0%) | 133 (48.5%) |
| 75 Years and over | 46 (100.0%) | 18 (39.1%) |
| Total | 576 (52.5%) | 764 (69.6%) |
Disability Status by Sex by Age in Chester
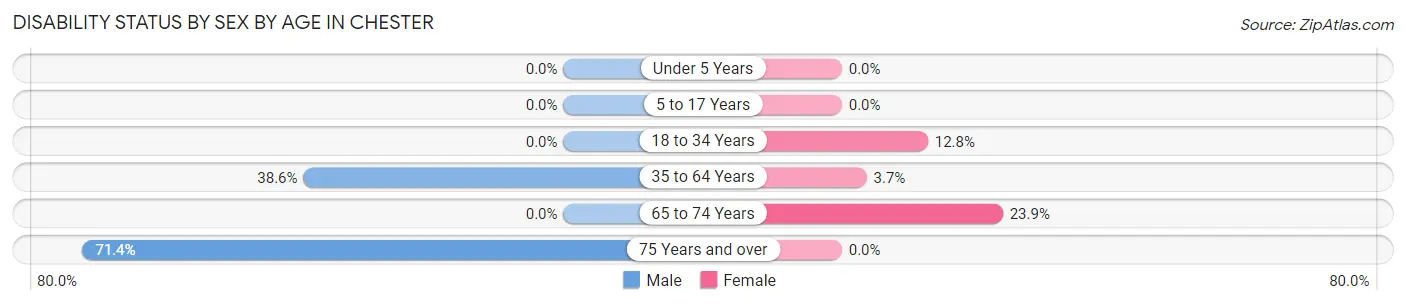
| Age Bracket | Male | Female |
| Under 5 Years | 0 (0.0%) | 0 (0.0%) |
| 5 to 17 Years | 0 (0.0%) | 0 (0.0%) |
| 18 to 34 Years | 0 (0.0%) | 12 (12.8%) |
| 35 to 64 Years | 61 (38.6%) | 7 (3.7%) |
| 65 to 74 Years | 0 (0.0%) | 38 (23.9%) |
| 75 Years and over | 20 (71.4%) | 0 (0.0%) |
Disability Class by Sex by Age in Chester
Disability Class: Hearing Difficulty
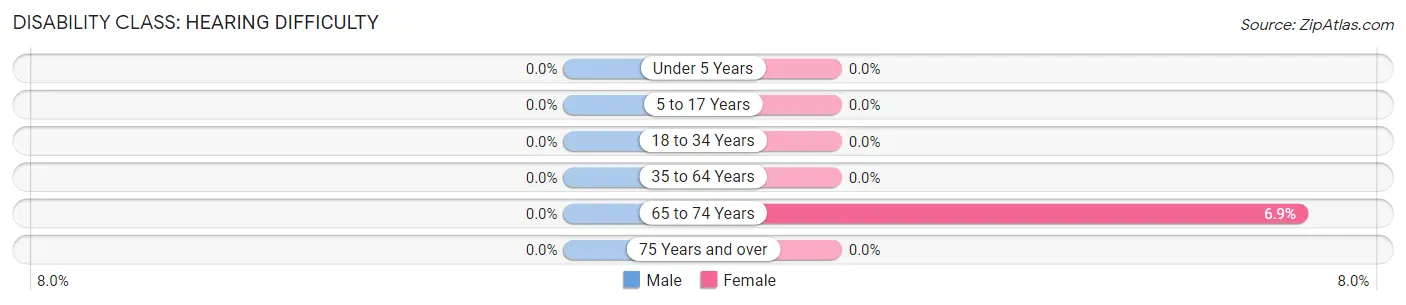
| Age Bracket | Male | Female |
| Under 5 Years | 0 (0.0%) | 0 (0.0%) |
| 5 to 17 Years | 0 (0.0%) | 0 (0.0%) |
| 18 to 34 Years | 0 (0.0%) | 0 (0.0%) |
| 35 to 64 Years | 0 (0.0%) | 0 (0.0%) |
| 65 to 74 Years | 0 (0.0%) | 11 (6.9%) |
| 75 Years and over | 0 (0.0%) | 0 (0.0%) |
Disability Class: Vision Difficulty
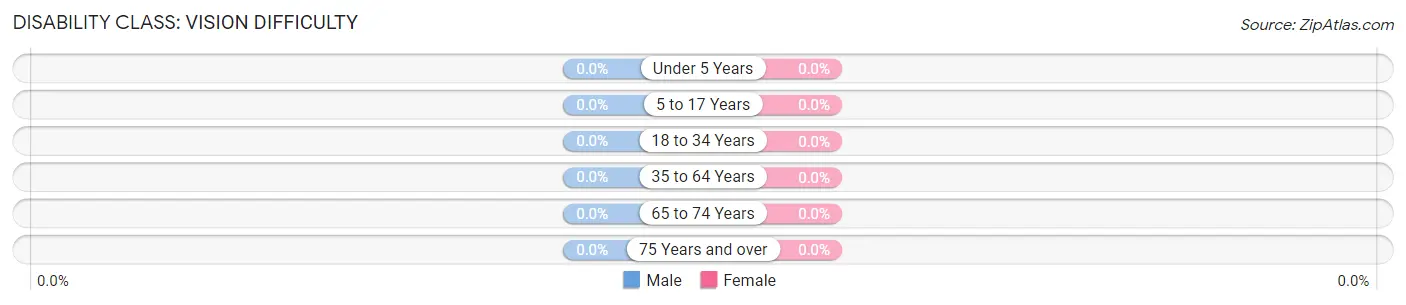
| Age Bracket | Male | Female |
| Under 5 Years | 0 (0.0%) | 0 (0.0%) |
| 5 to 17 Years | 0 (0.0%) | 0 (0.0%) |
| 18 to 34 Years | 0 (0.0%) | 0 (0.0%) |
| 35 to 64 Years | 0 (0.0%) | 0 (0.0%) |
| 65 to 74 Years | 0 (0.0%) | 0 (0.0%) |
| 75 Years and over | 0 (0.0%) | 0 (0.0%) |
Disability Class: Cognitive Difficulty
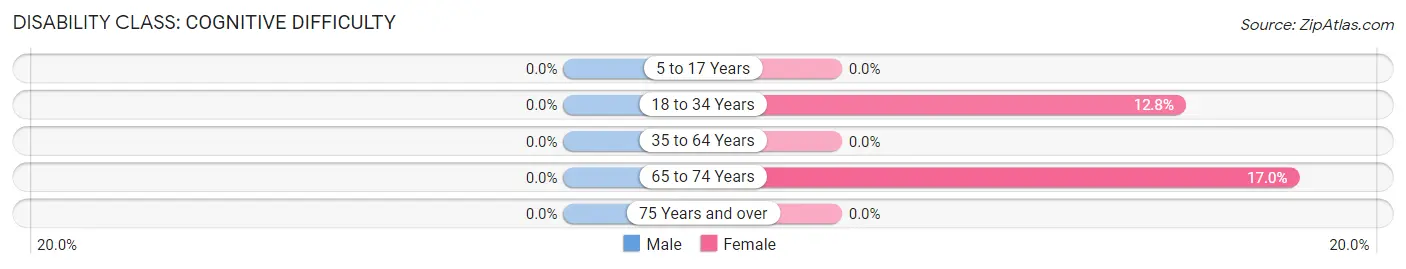
| Age Bracket | Male | Female |
| 5 to 17 Years | 0 (0.0%) | 0 (0.0%) |
| 18 to 34 Years | 0 (0.0%) | 12 (12.8%) |
| 35 to 64 Years | 0 (0.0%) | 0 (0.0%) |
| 65 to 74 Years | 0 (0.0%) | 27 (17.0%) |
| 75 Years and over | 0 (0.0%) | 0 (0.0%) |
Disability Class: Ambulatory Difficulty
| Age Bracket | Male | Female |
| 5 to 17 Years | 0 (0.0%) | 0 (0.0%) |
| 18 to 34 Years | 0 (0.0%) | 0 (0.0%) |
| 35 to 64 Years | 23 (14.6%) | 7 (3.7%) |
| 65 to 74 Years | 0 (0.0%) | 0 (0.0%) |
| 75 Years and over | 20 (71.4%) | 0 (0.0%) |
Disability Class: Self-Care Difficulty
| Age Bracket | Male | Female |
| 5 to 17 Years | 0 (0.0%) | 0 (0.0%) |
| 18 to 34 Years | 0 (0.0%) | 0 (0.0%) |
| 35 to 64 Years | 61 (38.6%) | 0 (0.0%) |
| 65 to 74 Years | 0 (0.0%) | 0 (0.0%) |
| 75 Years and over | 0 (0.0%) | 0 (0.0%) |
Technology Access in Chester
Computing Device Access in Chester
| Device Type | # Households | % Households |
| Desktop or Laptop | 349 | 78.6% |
| Smartphone | 384 | 86.5% |
| Tablet | 281 | 63.3% |
| No Computing Device | 27 | 6.1% |
| Total | 444 | 100.0% |
Internet Access in Chester
| Internet Type | # Households | % Households |
| Dial-Up Internet | 0 | 0.0% |
| Broadband Home | 317 | 71.4% |
| Cellular Data Only | 77 | 17.3% |
| Satellite Internet | 10 | 2.2% |
| No Internet | 50 | 11.3% |
| Total | 444 | 100.0% |
Chester Summary
Chester, Vermont is a small town located in the southwestern corner of the state, in the heart of the Green Mountains. It is a rural community with a population of 2,845 as of the 2010 census. The town is situated in the Connecticut River Valley, and is bordered by the towns of Andover, Cavendish, Grafton, Londonderry, and Springfield.
History
Chester was first settled in 1763 by a group of settlers from Connecticut. The town was named after the English city of Chester, and was incorporated in 1780. The town was originally an agricultural community, with the main crops being corn, wheat, and potatoes. In the 19th century, the town was home to several small industries, including a sawmill, gristmill, and a tannery.
In the late 19th century, the town began to experience a period of growth and prosperity. The railroad arrived in 1875, and the town became a popular tourist destination. The town was home to several resorts, including the Chester House, the Chester Inn, and the Chester Hotel.
Geography
Chester is located in the southwestern corner of Vermont, in the heart of the Green Mountains. The town is situated in the Connecticut River Valley, and is bordered by the towns of Andover, Cavendish, Grafton, Londonderry, and Springfield. The town is located approximately 25 miles from the state capital of Montpelier.
The town is home to several small lakes, including Lake Rescue, Lake Whitingham, and Lake Sadawga. The town is also home to several small streams, including the Williams River, the Black River, and the Saxtons River.
Economy
Chester is a rural community with a strong agricultural base. The town is home to several small farms, and the main crops are corn, wheat, and potatoes. The town is also home to several small businesses, including a sawmill, gristmill, and a tannery.
The town is also home to several small manufacturing companies, including a furniture factory, a paper mill, and a plastics factory. The town is also home to several small retail stores, including a grocery store, a hardware store, and a clothing store.
Demographics
As of the 2010 census, the population of Chester was 2,845. The racial makeup of the town was 97.3% White, 0.7% African American, 0.3% Native American, 0.3% Asian, 0.1% Pacific Islander, 0.2% from other races, and 1.2% from two or more races. Hispanic or Latino of any race were 1.2% of the population.
The median household income in Chester was $45,938, and the median family income was $51,938. The per capita income for the town was $22,938. About 8.3% of families and 10.2% of the population were below the poverty line, including 14.2% of those under age 18 and 6.2% of those age 65 or over.
Common Questions
What is Per Capita Income in Chester?
Per Capita income in Chester is $33,180.
What is the Median Family Income in Chester?
Median Family Income in Chester is $83,542.
What is the Median Household income in Chester?
Median Household Income in Chester is $63,919.
What is Income or Wage Gap in Chester?
Income or Wage Gap in Chester is 1.2%.
Women in Chester earn 98.8 cents for every dollar earned by a man.
What is Inequality or Gini Index in Chester?
Inequality or Gini Index in Chester is 0.37.
What is the Total Population of Chester?
Total Population of Chester is 1,097.
What is the Total Male Population of Chester?
Total Male Population of Chester is 498.
What is the Total Female Population of Chester?
Total Female Population of Chester is 599.
What is the Ratio of Males per 100 Females in Chester?
There are 83.14 Males per 100 Females in Chester.
What is the Ratio of Females per 100 Males in Chester?
There are 120.28 Females per 100 Males in Chester.
What is the Median Population Age in Chester?
Median Population Age in Chester is 40.0 Years.
What is the Average Family Size in Chester
Average Family Size in Chester is 3.0 People.
What is the Average Household Size in Chester
Average Household Size in Chester is 2.5 People.
How Large is the Labor Force in Chester?
There are 538 People in the Labor Forcein in Chester.
What is the Percentage of People in the Labor Force in Chester?
62.6% of People are in the Labor Force in Chester.
What is the Unemployment Rate in Chester?
Unemployment Rate in Chester is 2.2%.