Beecher Falls, VT Map & Demographics
Beecher Falls Map
Beecher Falls Overview
$23,713
PER CAPITA INCOME
$40,417
AVG FAMILY INCOME
$30,469
AVG HOUSEHOLD INCOME
52.7%
WAGE / INCOME GAP [ % ]
47.3¢/ $1
WAGE / INCOME GAP [ $ ]
0.38
INEQUALITY / GINI INDEX
101
TOTAL POPULATION
50
MALE POPULATION
51
FEMALE POPULATION
98.04
MALES / 100 FEMALES
102.00
FEMALES / 100 MALES
58.0
MEDIAN AGE
2.1
AVG FAMILY SIZE
1.8
AVG HOUSEHOLD SIZE
46
LABOR FORCE [ PEOPLE ]
51.7%
PERCENT IN LABOR FORCE
15.2%
UNEMPLOYMENT RATE
Beecher Falls Zip Codes
Beecher Falls Area Codes
Income in Beecher Falls
Income Overview in Beecher Falls
Per Capita Income in Beecher Falls is $23,713, while median incomes of families and households are $40,417 and $30,469 respectively.
| Characteristic | Number | Measure |
| Per Capita Income | 101 | $23,713 |
| Median Family Income | 41 | $40,417 |
| Mean Family Income | 41 | $50,527 |
| Median Household Income | 55 | $30,469 |
| Mean Household Income | 55 | $42,307 |
| Income Deficit | 41 | $0 |
| Wage / Income Gap (%) | 101 | 52.66% |
| Wage / Income Gap ($) | 101 | 47.34¢ per $1 |
| Gini / Inequality Index | 101 | 0.38 |
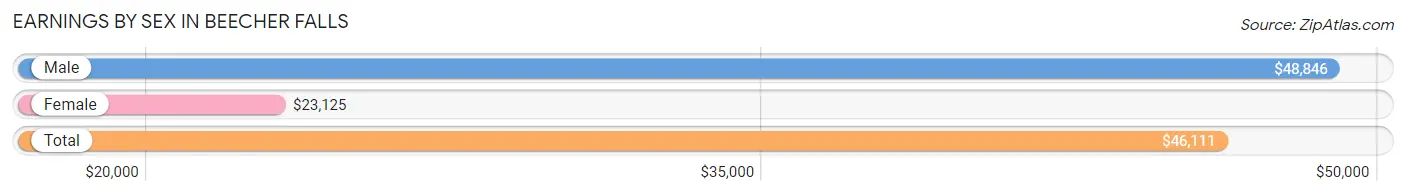
Earnings by Sex in Beecher Falls
Average Earnings in Beecher Falls are $46,111, $48,846 for men and $23,125 for women, a difference of 52.7%.
| Sex | Number | Average Earnings |
| Male | 20 (45.5%) | $48,846 |
| Female | 24 (54.5%) | $23,125 |
| Total | 44 (100.0%) | $46,111 |
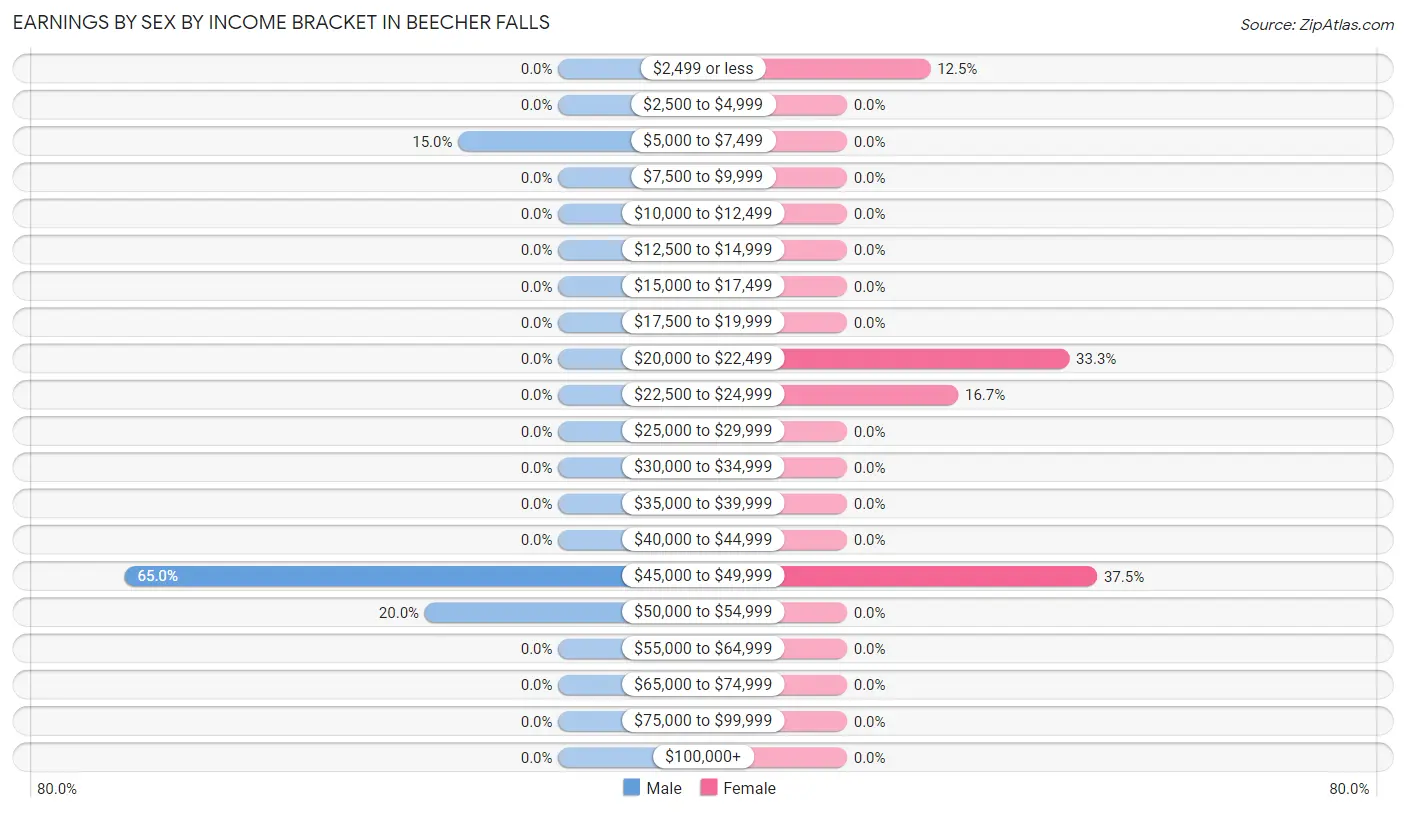
Earnings by Sex by Income Bracket in Beecher Falls
The most common earnings brackets in Beecher Falls are $45,000 to $49,999 for men (13 | 65.0%) and $45,000 to $49,999 for women (9 | 37.5%).
| Income | Male | Female |
| $2,499 or less | 0 (0.0%) | 3 (12.5%) |
| $2,500 to $4,999 | 0 (0.0%) | 0 (0.0%) |
| $5,000 to $7,499 | 3 (15.0%) | 0 (0.0%) |
| $7,500 to $9,999 | 0 (0.0%) | 0 (0.0%) |
| $10,000 to $12,499 | 0 (0.0%) | 0 (0.0%) |
| $12,500 to $14,999 | 0 (0.0%) | 0 (0.0%) |
| $15,000 to $17,499 | 0 (0.0%) | 0 (0.0%) |
| $17,500 to $19,999 | 0 (0.0%) | 0 (0.0%) |
| $20,000 to $22,499 | 0 (0.0%) | 8 (33.3%) |
| $22,500 to $24,999 | 0 (0.0%) | 4 (16.7%) |
| $25,000 to $29,999 | 0 (0.0%) | 0 (0.0%) |
| $30,000 to $34,999 | 0 (0.0%) | 0 (0.0%) |
| $35,000 to $39,999 | 0 (0.0%) | 0 (0.0%) |
| $40,000 to $44,999 | 0 (0.0%) | 0 (0.0%) |
| $45,000 to $49,999 | 13 (65.0%) | 9 (37.5%) |
| $50,000 to $54,999 | 4 (20.0%) | 0 (0.0%) |
| $55,000 to $64,999 | 0 (0.0%) | 0 (0.0%) |
| $65,000 to $74,999 | 0 (0.0%) | 0 (0.0%) |
| $75,000 to $99,999 | 0 (0.0%) | 0 (0.0%) |
| $100,000+ | 0 (0.0%) | 0 (0.0%) |
| Total | 20 (100.0%) | 24 (100.0%) |
Earnings by Sex by Educational Attainment in Beecher Falls
| Educational Attainment | Male Income | Female Income |
| Less than High School | - | - |
| High School Diploma | - | - |
| College or Associate's Degree | - | - |
| Bachelor's Degree | - | - |
| Graduate Degree | - | - |
| Total | $48,846 | $0 |
Family Income in Beecher Falls
Family Income Brackets in Beecher Falls
According to the Beecher Falls family income data, there are 9 families falling into the $15,000 to $24,999 income range, which is the most common income bracket and makes up 22.0% of all families.
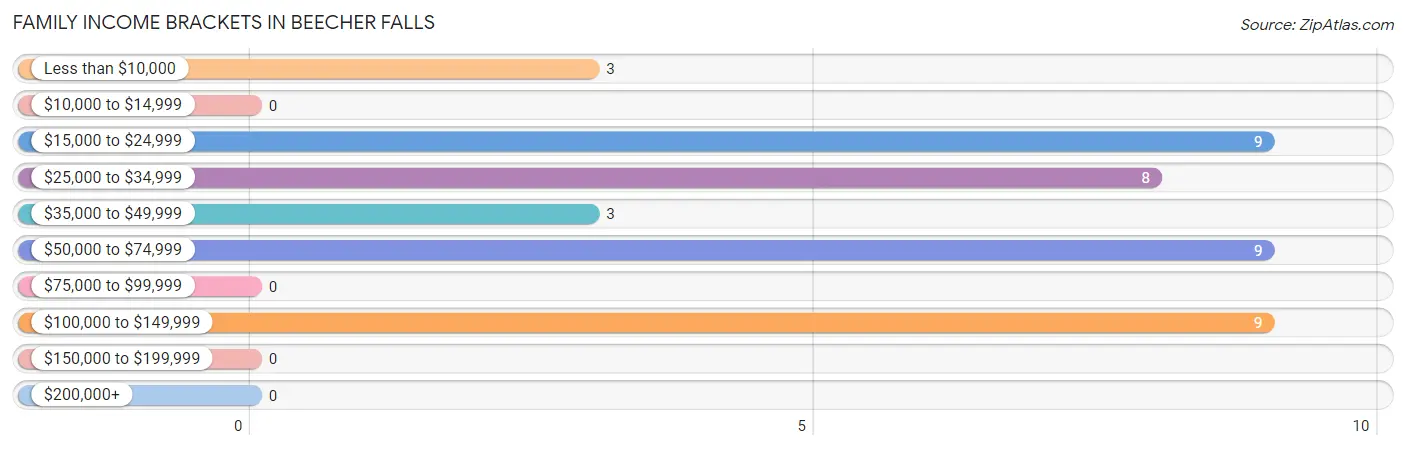
| Income Bracket | # Families | % Families |
| Less than $10,000 | 3 | 7.3% |
| $10,000 to $14,999 | 0 | 0.0% |
| $15,000 to $24,999 | 9 | 22.0% |
| $25,000 to $34,999 | 8 | 19.5% |
| $35,000 to $49,999 | 3 | 7.3% |
| $50,000 to $74,999 | 9 | 22.0% |
| $75,000 to $99,999 | 0 | 0.0% |
| $100,000 to $149,999 | 9 | 22.0% |
| $150,000 to $199,999 | 0 | 0.0% |
| $200,000+ | 0 | 0.0% |
Family Income by Famaliy Size in Beecher Falls
2-person families (38 | 92.7%) account for the highest median family income in Beecher Falls with $41,667 per family, while 2-person families (38 | 92.7%) have the highest median income of $20,834 per family member.
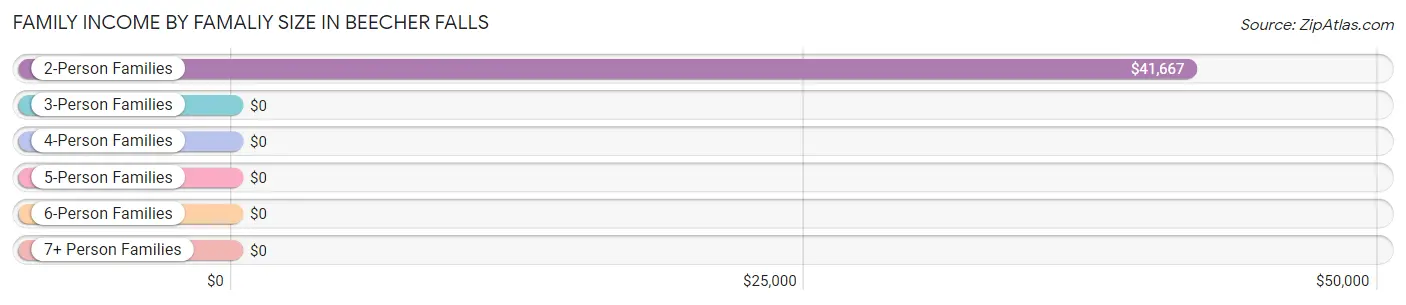
| Income Bracket | # Families | Median Income |
| 2-Person Families | 38 (92.7%) | $41,667 |
| 3-Person Families | 0 (0.0%) | $0 |
| 4-Person Families | 3 (7.3%) | $0 |
| 5-Person Families | 0 (0.0%) | $0 |
| 6-Person Families | 0 (0.0%) | $0 |
| 7+ Person Families | 0 (0.0%) | $0 |
| Total | 41 (100.0%) | $40,417 |
Family Income by Number of Earners in Beecher Falls
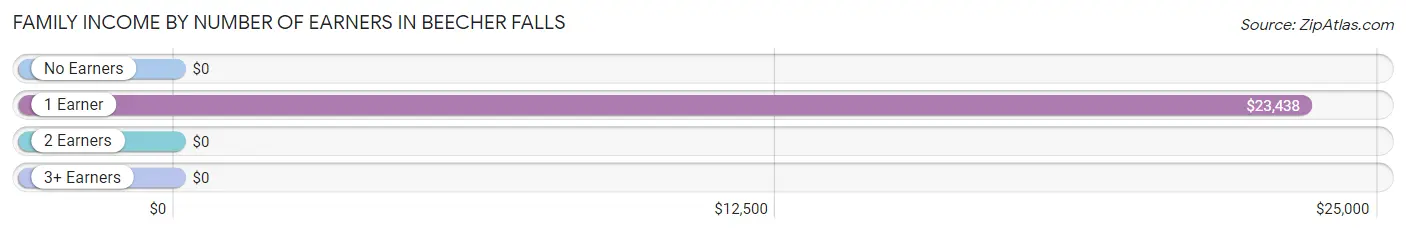
| Number of Earners | # Families | Median Income |
| No Earners | 13 (31.7%) | $0 |
| 1 Earner | 19 (46.3%) | $23,438 |
| 2 Earners | 9 (22.0%) | $0 |
| 3+ Earners | 0 (0.0%) | $0 |
| Total | 41 (100.0%) | $40,417 |
Household Income in Beecher Falls
Household Income Brackets in Beecher Falls
With 20 households falling in the category, the $15,000 to $24,999 income range is the most frequent in Beecher Falls, accounting for 36.4% of all households.
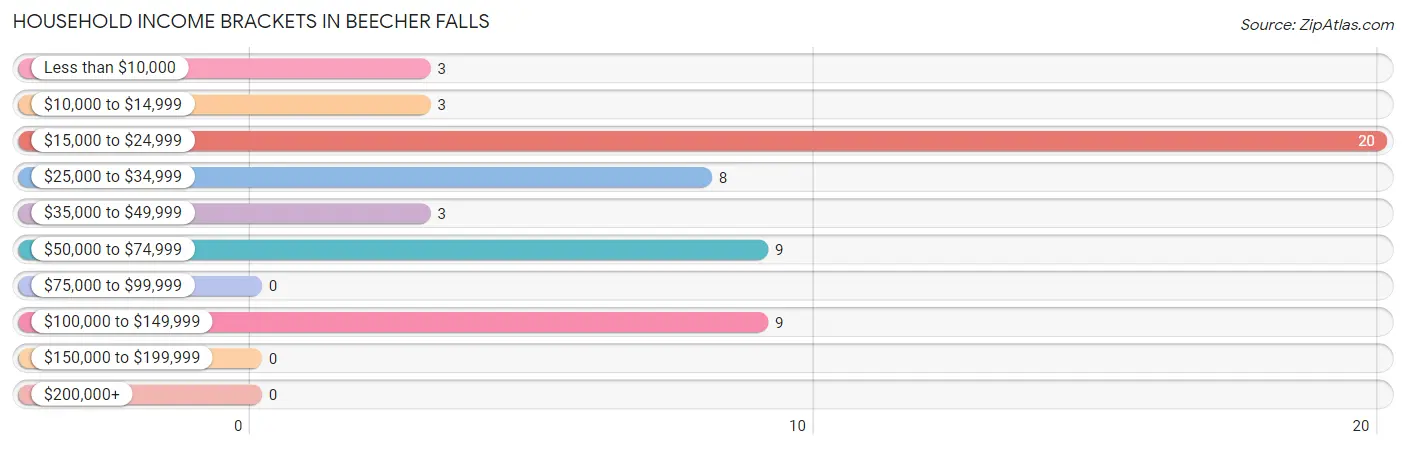
| Income Bracket | # Households | % Households |
| Less than $10,000 | 3 | 5.5% |
| $10,000 to $14,999 | 3 | 5.5% |
| $15,000 to $24,999 | 20 | 36.4% |
| $25,000 to $34,999 | 8 | 14.5% |
| $35,000 to $49,999 | 3 | 5.5% |
| $50,000 to $74,999 | 9 | 16.4% |
| $75,000 to $99,999 | 0 | 0.0% |
| $100,000 to $149,999 | 9 | 16.4% |
| $150,000 to $199,999 | 0 | 0.0% |
| $200,000+ | 0 | 0.0% |
Household Income by Householder Age in Beecher Falls
The median household income in Beecher Falls is $30,469, with the highest median household income of $48,750 found in the 65+ years age bracket for the primary householder. A total of 28 households (50.9%) fall into this category.
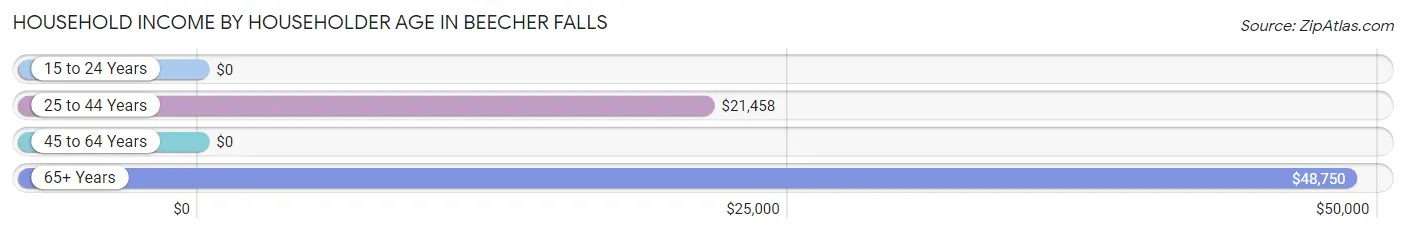
| Income Bracket | # Households | Median Income |
| 15 to 24 Years | 0 (0.0%) | $0 |
| 25 to 44 Years | 13 (23.6%) | $21,458 |
| 45 to 64 Years | 14 (25.5%) | $0 |
| 65+ Years | 28 (50.9%) | $48,750 |
| Total | 55 (100.0%) | $30,469 |
Poverty in Beecher Falls
Income Below Poverty by Sex and Age in Beecher Falls
With 12.0% poverty level for males and 17.6% for females among the residents of Beecher Falls, 6 to 11 year old males and 6 to 11 year old females are the most vulnerable to poverty, with 4 males (100.0%) and 3 females (100.0%) in their respective age groups living below the poverty level.
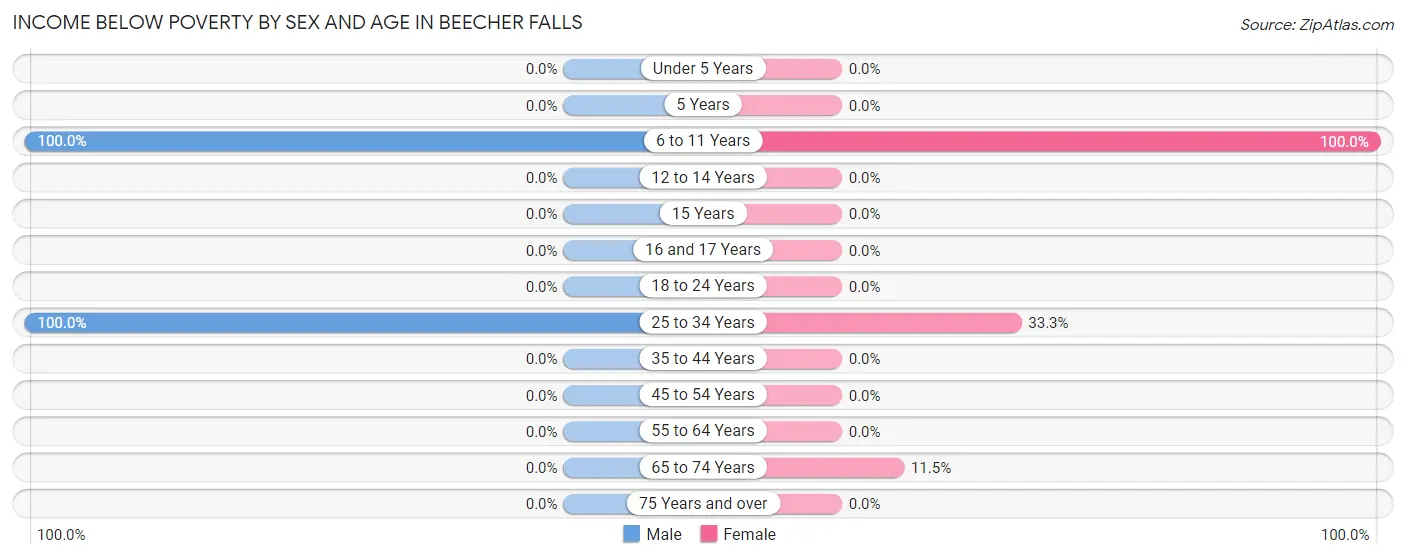
| Age Bracket | Male | Female |
| Under 5 Years | 0 (0.0%) | 0 (0.0%) |
| 5 Years | 0 (0.0%) | 0 (0.0%) |
| 6 to 11 Years | 4 (100.0%) | 3 (100.0%) |
| 12 to 14 Years | 0 (0.0%) | 0 (0.0%) |
| 15 Years | 0 (0.0%) | 0 (0.0%) |
| 16 and 17 Years | 0 (0.0%) | 0 (0.0%) |
| 18 to 24 Years | 0 (0.0%) | 0 (0.0%) |
| 25 to 34 Years | 2 (100.0%) | 3 (33.3%) |
| 35 to 44 Years | 0 (0.0%) | 0 (0.0%) |
| 45 to 54 Years | 0 (0.0%) | 0 (0.0%) |
| 55 to 64 Years | 0 (0.0%) | 0 (0.0%) |
| 65 to 74 Years | 0 (0.0%) | 3 (11.5%) |
| 75 Years and over | 0 (0.0%) | 0 (0.0%) |
| Total | 6 (12.0%) | 9 (17.6%) |
Income Above Poverty by Sex and Age in Beecher Falls
According to the poverty statistics in Beecher Falls, males aged under 5 years and females aged 18 to 24 years are the age groups that are most secure financially, with 100.0% of males and 100.0% of females in these age groups living above the poverty line.
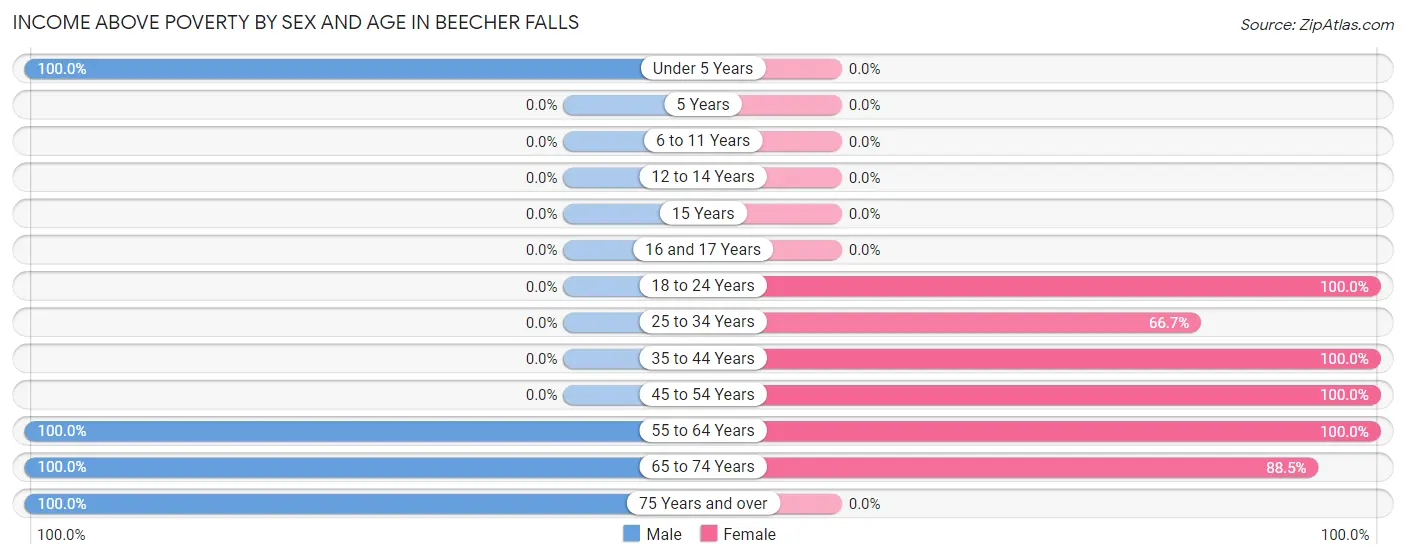
| Age Bracket | Male | Female |
| Under 5 Years | 5 (100.0%) | 0 (0.0%) |
| 5 Years | 0 (0.0%) | 0 (0.0%) |
| 6 to 11 Years | 0 (0.0%) | 0 (0.0%) |
| 12 to 14 Years | 0 (0.0%) | 0 (0.0%) |
| 15 Years | 0 (0.0%) | 0 (0.0%) |
| 16 and 17 Years | 0 (0.0%) | 0 (0.0%) |
| 18 to 24 Years | 0 (0.0%) | 2 (100.0%) |
| 25 to 34 Years | 0 (0.0%) | 6 (66.7%) |
| 35 to 44 Years | 0 (0.0%) | 4 (100.0%) |
| 45 to 54 Years | 0 (0.0%) | 5 (100.0%) |
| 55 to 64 Years | 22 (100.0%) | 2 (100.0%) |
| 65 to 74 Years | 9 (100.0%) | 23 (88.5%) |
| 75 Years and over | 8 (100.0%) | 0 (0.0%) |
| Total | 44 (88.0%) | 42 (82.4%) |
Income Below Poverty Among Married-Couple Families in Beecher Falls
The poverty statistics for married-couple families in Beecher Falls show that 9.4% or 3 of the total 32 families live below the poverty line. Families with 1 or 2 children have the highest poverty rate of 100.0%, comprising of 3 families. On the other hand, families with no children have the lowest poverty rate of 0.0%, which includes 0 families.
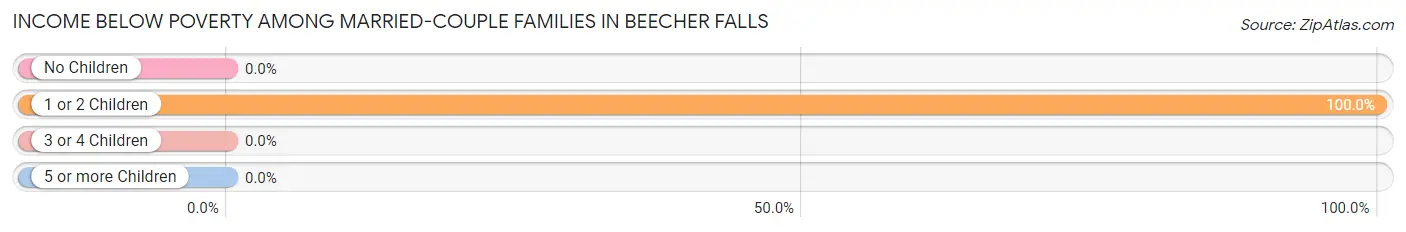
| Children | Above Poverty | Below Poverty |
| No Children | 29 (100.0%) | 0 (0.0%) |
| 1 or 2 Children | 0 (0.0%) | 3 (100.0%) |
| 3 or 4 Children | 0 (0.0%) | 0 (0.0%) |
| 5 or more Children | 0 (0.0%) | 0 (0.0%) |
| Total | 29 (90.6%) | 3 (9.4%) |
Income Below Poverty Among Single-Parent Households in Beecher Falls
| Children | Single Father | Single Mother |
| No Children | 0 (0.0%) | 0 (0.0%) |
| 1 or 2 Children | 0 (0.0%) | 0 (0.0%) |
| 3 or 4 Children | 0 (0.0%) | 0 (0.0%) |
| 5 or more Children | 0 (0.0%) | 0 (0.0%) |
| Total | 0 (0.0%) | 0 (0.0%) |
Income Below Poverty Among Married-Couple vs Single-Parent Households in Beecher Falls
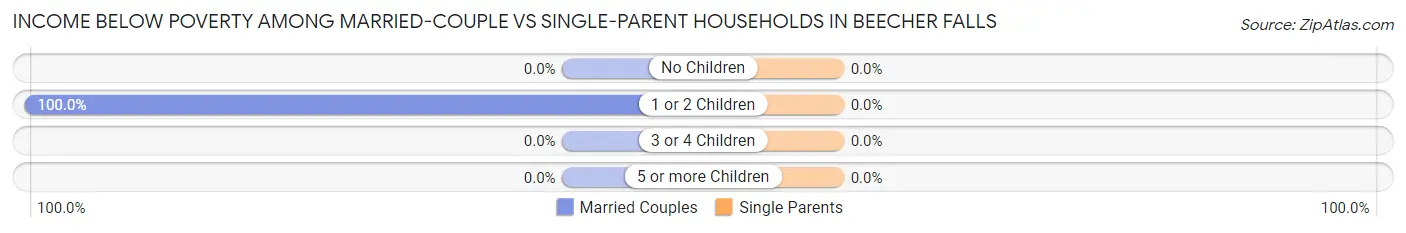
| Children | Married-Couple Families | Single-Parent Households |
| No Children | 0 (0.0%) | 0 (0.0%) |
| 1 or 2 Children | 3 (100.0%) | 0 (0.0%) |
| 3 or 4 Children | 0 (0.0%) | 0 (0.0%) |
| 5 or more Children | 0 (0.0%) | 0 (0.0%) |
| Total | 3 (9.4%) | 0 (0.0%) |
Race in Beecher Falls
The most populous races in Beecher Falls are White / Caucasian (96 | 95.1%), and Two or more Races (5 | 5.0%).
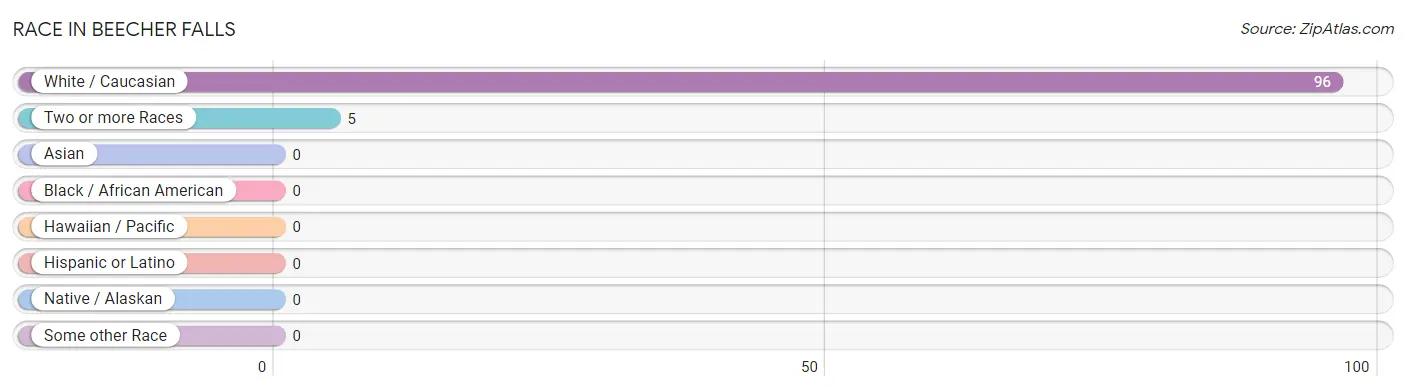
| Race | # Population | % Population |
| Asian | 0 | 0.0% |
| Black / African American | 0 | 0.0% |
| Hawaiian / Pacific | 0 | 0.0% |
| Hispanic or Latino | 0 | 0.0% |
| Native / Alaskan | 0 | 0.0% |
| White / Caucasian | 96 | 95.1% |
| Two or more Races | 5 | 5.0% |
| Some other Race | 0 | 0.0% |
| Total | 101 | 100.0% |
Ancestry in Beecher Falls
The most populous ancestries reported in Beecher Falls are French Canadian (39 | 38.6%), Irish (28 | 27.7%), American (12 | 11.9%), German (3 | 3.0%), and French (2 | 2.0%), together accounting for 83.2% of all Beecher Falls residents.
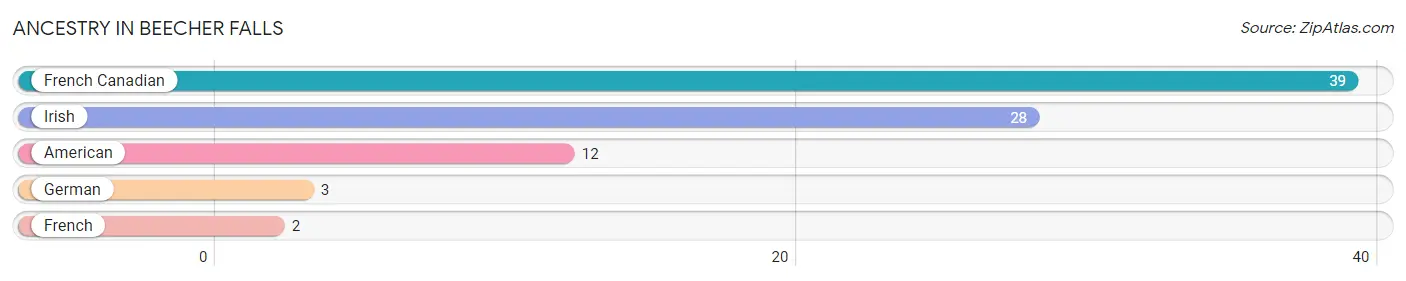
| Ancestry | # Population | % Population |
| American | 12 | 11.9% |
| French | 2 | 2.0% |
| French Canadian | 39 | 38.6% |
| German | 3 | 3.0% |
| Irish | 28 | 27.7% | View All 5 Rows |
Immigrants in Beecher Falls
The most numerous immigrant groups reported in Beecher Falls came from , and Canada (17 | 16.8%), together accounting for 16.8% of all Beecher Falls residents.

| Immigration Origin | # Population | % Population |
| Canada | 17 | 16.8% | View All 1 Rows |
Sex and Age in Beecher Falls
Sex and Age in Beecher Falls
The most populous age groups in Beecher Falls are 55 to 59 Years (17 | 34.0%) for men and 70 to 74 Years (17 | 33.3%) for women.
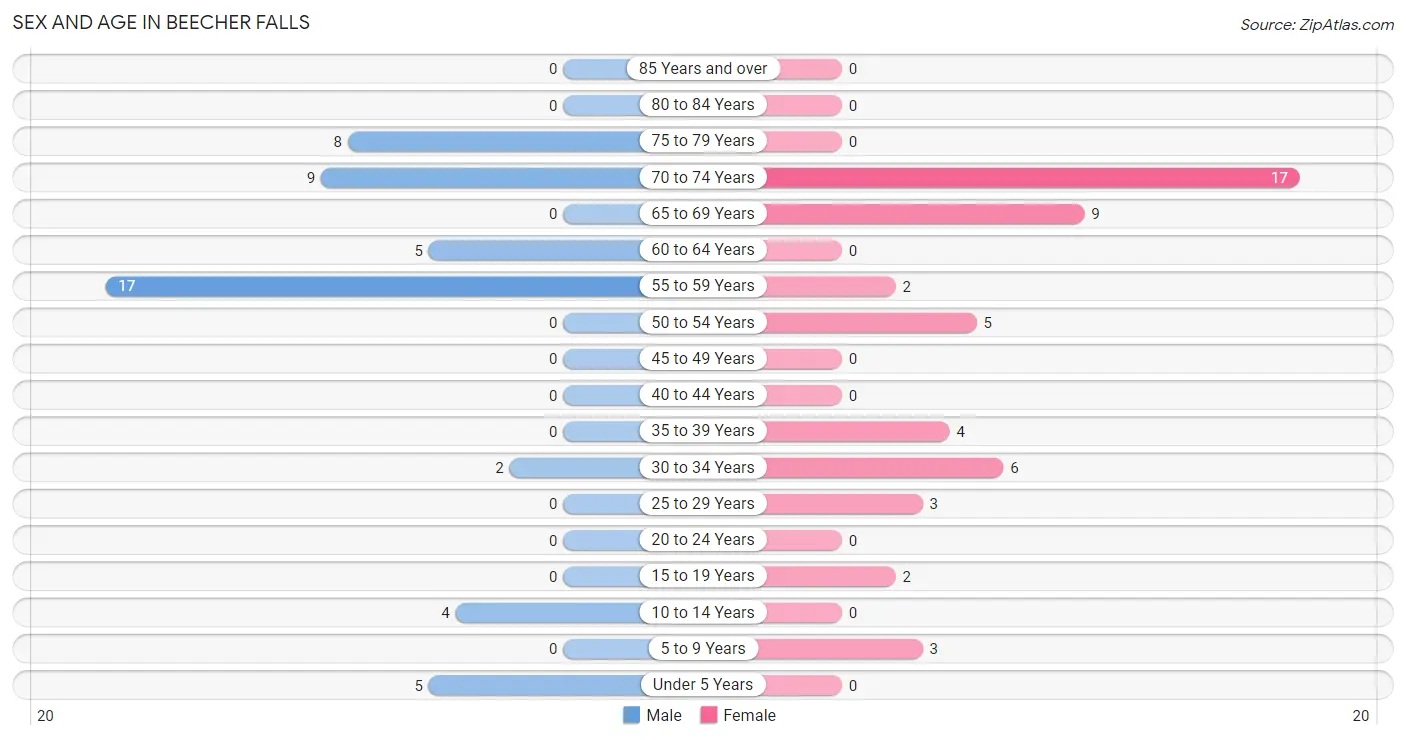
| Age Bracket | Male | Female |
| Under 5 Years | 5 (10.0%) | 0 (0.0%) |
| 5 to 9 Years | 0 (0.0%) | 3 (5.9%) |
| 10 to 14 Years | 4 (8.0%) | 0 (0.0%) |
| 15 to 19 Years | 0 (0.0%) | 2 (3.9%) |
| 20 to 24 Years | 0 (0.0%) | 0 (0.0%) |
| 25 to 29 Years | 0 (0.0%) | 3 (5.9%) |
| 30 to 34 Years | 2 (4.0%) | 6 (11.8%) |
| 35 to 39 Years | 0 (0.0%) | 4 (7.8%) |
| 40 to 44 Years | 0 (0.0%) | 0 (0.0%) |
| 45 to 49 Years | 0 (0.0%) | 0 (0.0%) |
| 50 to 54 Years | 0 (0.0%) | 5 (9.8%) |
| 55 to 59 Years | 17 (34.0%) | 2 (3.9%) |
| 60 to 64 Years | 5 (10.0%) | 0 (0.0%) |
| 65 to 69 Years | 0 (0.0%) | 9 (17.6%) |
| 70 to 74 Years | 9 (18.0%) | 17 (33.3%) |
| 75 to 79 Years | 8 (16.0%) | 0 (0.0%) |
| 80 to 84 Years | 0 (0.0%) | 0 (0.0%) |
| 85 Years and over | 0 (0.0%) | 0 (0.0%) |
| Total | 50 (100.0%) | 51 (100.0%) |
Families and Households in Beecher Falls
Median Family Size in Beecher Falls
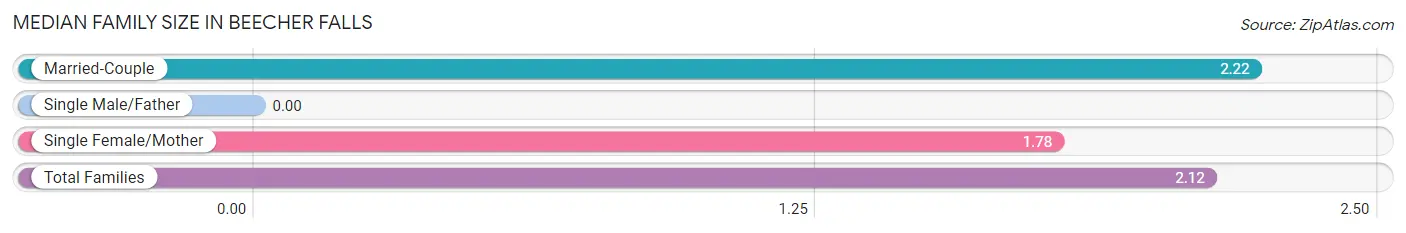
| Family Type | # Families | Family Size |
| Married-Couple | 32 (78.0%) | 2.22 |
| Single Male/Father | 0 (0.0%) | - |
| Single Female/Mother | 9 (22.0%) | 1.78 |
| Total Families | 41 (100.0%) | 2.12 |
Median Household Size in Beecher Falls
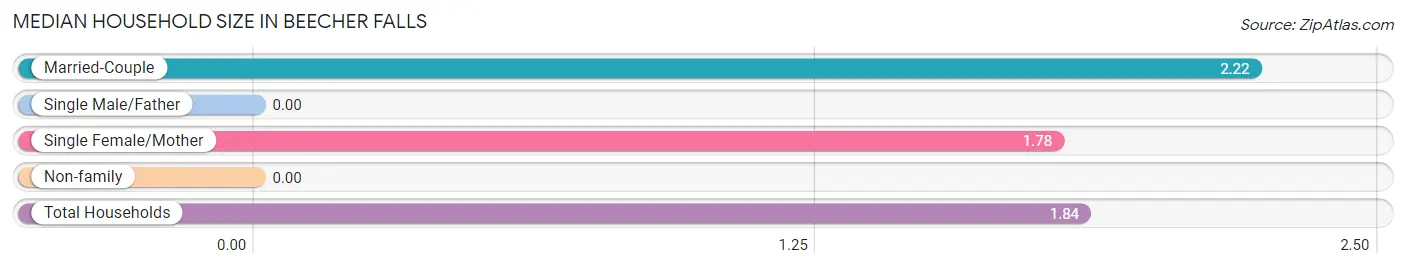
| Household Type | # Households | Household Size |
| Married-Couple | 32 (58.2%) | 2.22 |
| Single Male/Father | 0 (0.0%) | - |
| Single Female/Mother | 9 (16.4%) | 1.78 |
| Non-family | 14 (25.5%) | - |
| Total Households | 55 (100.0%) | 1.84 |
Household Size by Marriage Status in Beecher Falls
Out of a total of 55 households in Beecher Falls, 41 (74.6%) are family households, while 14 (25.5%) are nonfamily households. The most numerous type of family households are 2-person households, comprising 38, and the most common type of nonfamily households are 1-person households, comprising 14.
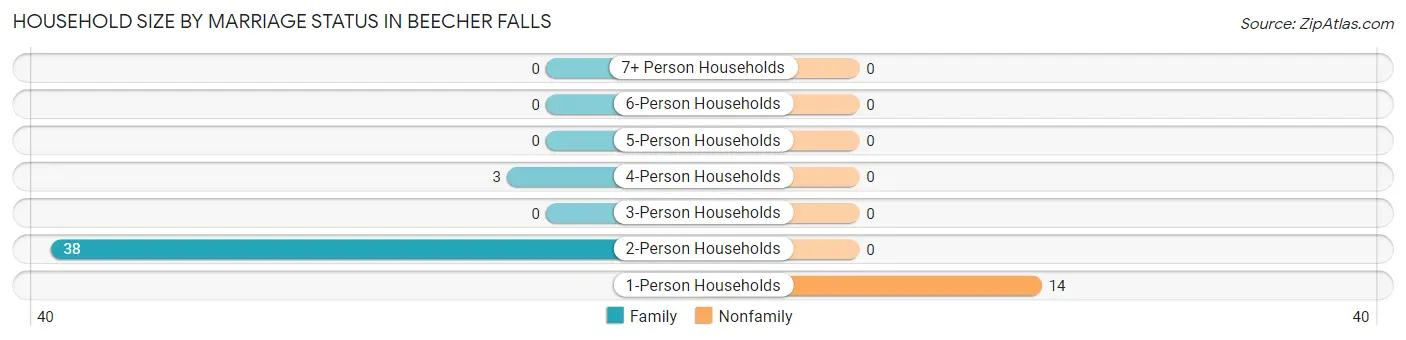
| Household Size | Family Households | Nonfamily Households |
| 1-Person Households | - | 14 (25.5%) |
| 2-Person Households | 38 (69.1%) | 0 (0.0%) |
| 3-Person Households | 0 (0.0%) | 0 (0.0%) |
| 4-Person Households | 3 (5.4%) | 0 (0.0%) |
| 5-Person Households | 0 (0.0%) | 0 (0.0%) |
| 6-Person Households | 0 (0.0%) | 0 (0.0%) |
| 7+ Person Households | 0 (0.0%) | 0 (0.0%) |
| Total | 41 (74.6%) | 14 (25.5%) |
Female Fertility in Beecher Falls
Fertility by Age in Beecher Falls
| Age Bracket | Women with Births | Births / 1,000 Women |
| 15 to 19 years | 0 (0.0%) | 0.0 |
| 20 to 34 years | 0 (0.0%) | 0.0 |
| 35 to 50 years | 0 (0.0%) | 0.0 |
| Total | 0 (0.0%) | 0.0 |
Fertility by Age by Marriage Status in Beecher Falls
| Age Bracket | Married | Unmarried |
| 15 to 19 years | 0 (0.0%) | 0 (0.0%) |
| 20 to 34 years | 0 (0.0%) | 0 (0.0%) |
| 35 to 50 years | 0 (0.0%) | 0 (0.0%) |
| Total | 0 (0.0%) | 0 (0.0%) |
Fertility by Education in Beecher Falls
| Educational Attainment | Women with Births | Births / 1,000 Women |
| Less than High School | 0 (0.0%) | 0.0 |
| High School Diploma | 0 (0.0%) | 0.0 |
| College or Associate's Degree | 0 (0.0%) | 0.0 |
| Bachelor's Degree | 0 (0.0%) | 0.0 |
| Graduate Degree | 0 (0.0%) | 0.0 |
| Total | 0 (0.0%) | 0.0 |
Fertility by Education by Marriage Status in Beecher Falls
| Educational Attainment | Married | Unmarried |
| Less than High School | 0 (0.0%) | 0 (0.0%) |
| High School Diploma | 0 (0.0%) | 0 (0.0%) |
| College or Associate's Degree | 0 (0.0%) | 0 (0.0%) |
| Bachelor's Degree | 0 (0.0%) | 0 (0.0%) |
| Graduate Degree | 0 (0.0%) | 0 (0.0%) |
| Total | 0 (0.0%) | 0 (0.0%) |
Employment Characteristics in Beecher Falls
Employment by Class of Employer in Beecher Falls
Among the 39 employed individuals in Beecher Falls, private company employees (26 | 66.7%), self-employed (not incorporated) (9 | 23.1%), and local government employees (4 | 10.3%) make up the most common classes of employment.
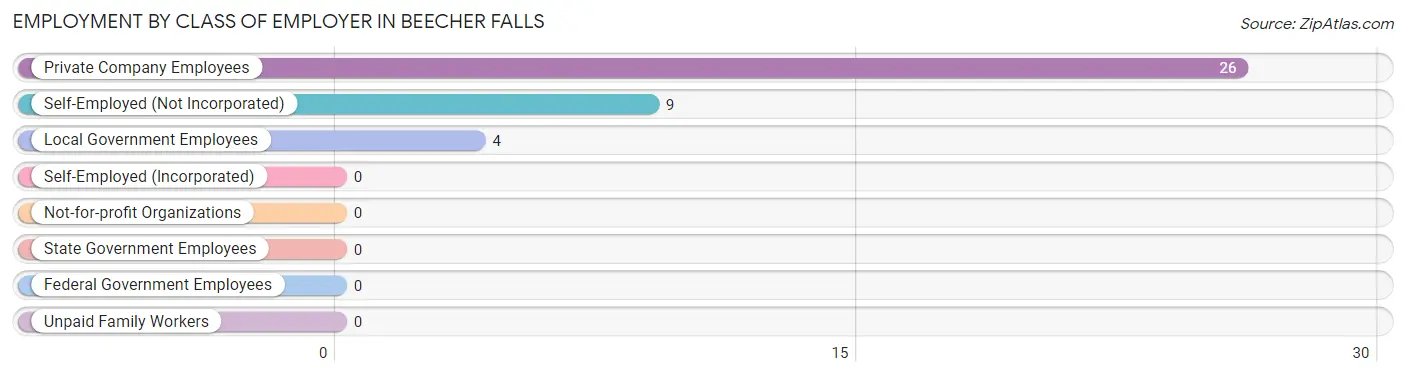
| Employer Class | # Employees | % Employees |
| Private Company Employees | 26 | 66.7% |
| Self-Employed (Incorporated) | 0 | 0.0% |
| Self-Employed (Not Incorporated) | 9 | 23.1% |
| Not-for-profit Organizations | 0 | 0.0% |
| Local Government Employees | 4 | 10.3% |
| State Government Employees | 0 | 0.0% |
| Federal Government Employees | 0 | 0.0% |
| Unpaid Family Workers | 0 | 0.0% |
| Total | 39 | 100.0% |
Employment Status by Age in Beecher Falls
According to the labor force statistics for Beecher Falls, out of the total population over 16 years of age (89), 51.7% or 46 individuals are in the labor force, with 15.2% or 7 of them unemployed. The age group with the highest labor force participation rate is 16 to 19 years, with 100.0% or 2 individuals in the labor force. Within the labor force, the 16 to 19 years age range has the highest percentage of unemployed individuals, with 100.0% or 2 of them being unemployed.
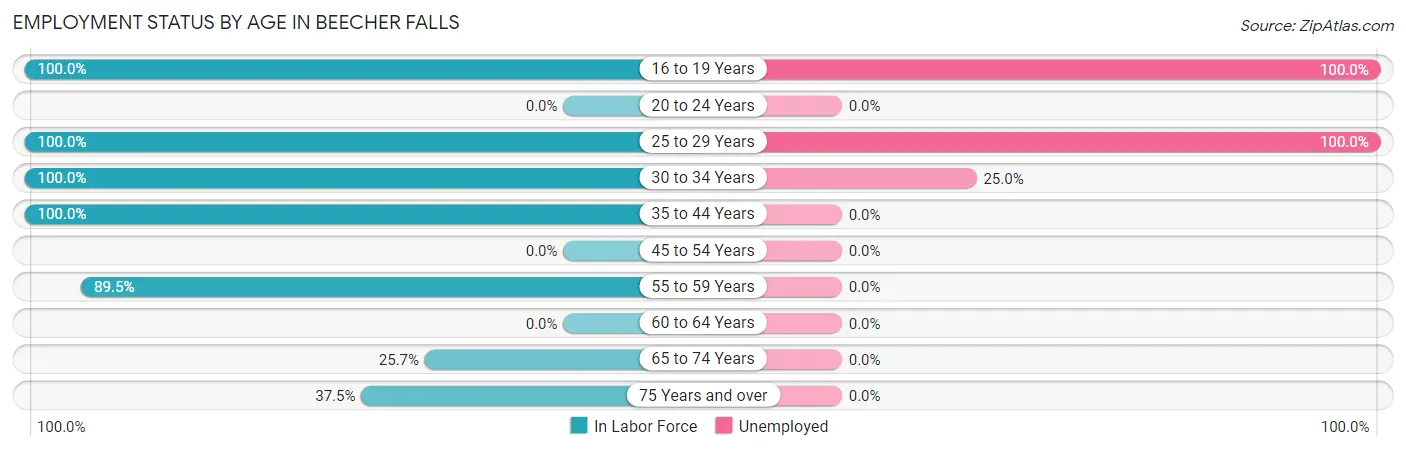
| Age Bracket | In Labor Force | Unemployed |
| 16 to 19 Years | 2 (100.0%) | 2 (100.0%) |
| 20 to 24 Years | 0 (0.0%) | 0 (0.0%) |
| 25 to 29 Years | 3 (100.0%) | 3 (100.0%) |
| 30 to 34 Years | 8 (100.0%) | 2 (25.0%) |
| 35 to 44 Years | 4 (100.0%) | 0 (0.0%) |
| 45 to 54 Years | 0 (0.0%) | 0 (0.0%) |
| 55 to 59 Years | 17 (89.5%) | 0 (0.0%) |
| 60 to 64 Years | 0 (0.0%) | 0 (0.0%) |
| 65 to 74 Years | 9 (25.7%) | 0 (0.0%) |
| 75 Years and over | 3 (37.5%) | 0 (0.0%) |
| Total | 46 (51.7%) | 7 (15.2%) |
Employment Status by Educational Attainment in Beecher Falls
According to labor force statistics for Beecher Falls, 72.7% of individuals (32) out of the total population between 25 and 64 years of age (44) are in the labor force, with 15.6% or 5 of them being unemployed. The group with the highest labor force participation rate are those with the educational attainment of less than high school, with 100.0% or 15 individuals in the labor force. Within the labor force, individuals with high school diploma education have the highest percentage of unemployment, with 23.1% or 3 of them being unemployed.
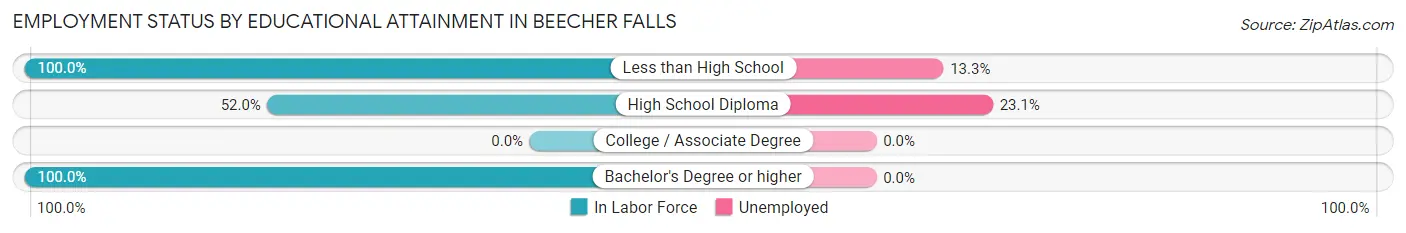
| Educational Attainment | In Labor Force | Unemployed |
| Less than High School | 15 (100.0%) | 2 (13.3%) |
| High School Diploma | 13 (52.0%) | 6 (23.1%) |
| College / Associate Degree | 0 (0.0%) | 0 (0.0%) |
| Bachelor's Degree or higher | 4 (100.0%) | 0 (0.0%) |
| Total | 32 (72.7%) | 7 (15.6%) |
Employment Occupations by Sex in Beecher Falls
Management, Business, Science and Arts Occupations
The most common Management, Business, Science and Arts occupations in Beecher Falls are Community & Social Service (4 | 10.3%), and Education Instruction & Library (4 | 10.3%).
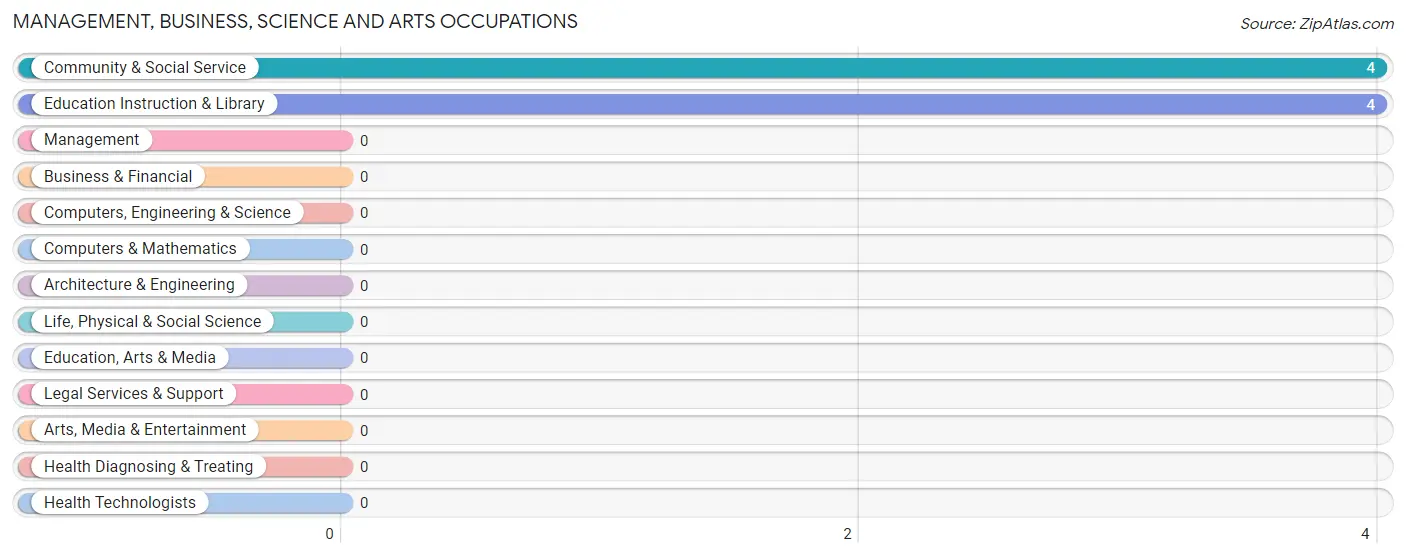
Management, Business, Science and Arts Occupations by Sex
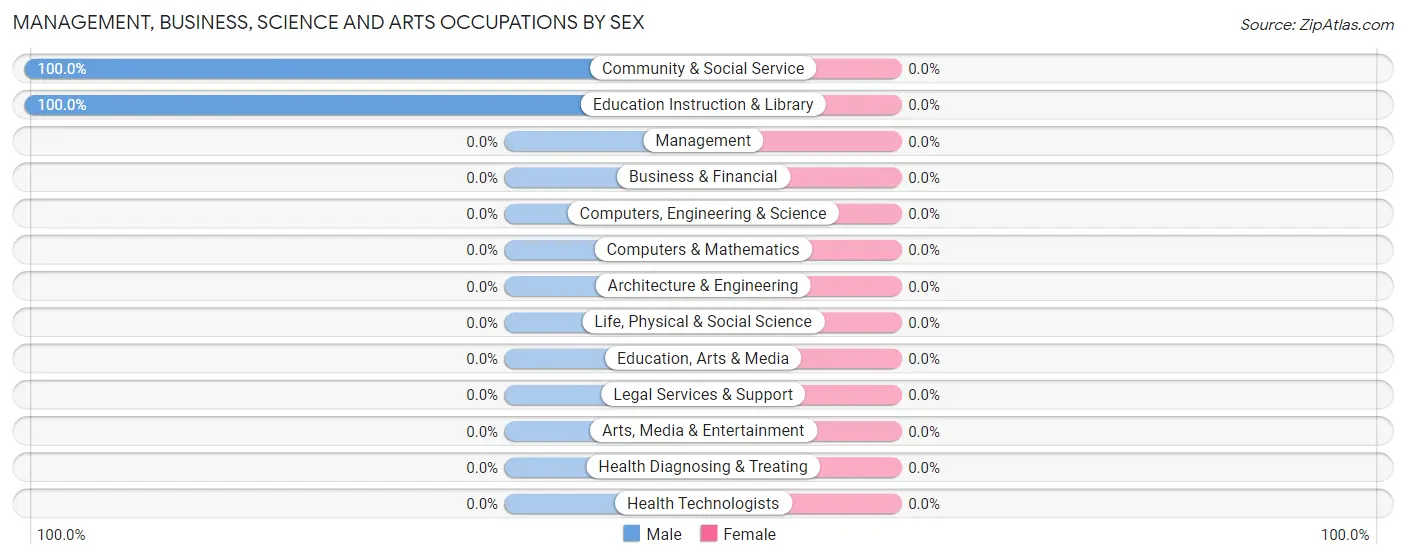
| Occupation | Male | Female |
| Management | 0 (0.0%) | 0 (0.0%) |
| Business & Financial | 0 (0.0%) | 0 (0.0%) |
| Computers, Engineering & Science | 0 (0.0%) | 0 (0.0%) |
| Computers & Mathematics | 0 (0.0%) | 0 (0.0%) |
| Architecture & Engineering | 0 (0.0%) | 0 (0.0%) |
| Life, Physical & Social Science | 0 (0.0%) | 0 (0.0%) |
| Community & Social Service | 4 (100.0%) | 0 (0.0%) |
| Education, Arts & Media | 0 (0.0%) | 0 (0.0%) |
| Legal Services & Support | 0 (0.0%) | 0 (0.0%) |
| Education Instruction & Library | 4 (100.0%) | 0 (0.0%) |
| Arts, Media & Entertainment | 0 (0.0%) | 0 (0.0%) |
| Health Diagnosing & Treating | 0 (0.0%) | 0 (0.0%) |
| Health Technologists | 0 (0.0%) | 0 (0.0%) |
| Total (Category) | 4 (100.0%) | 0 (0.0%) |
| Total (Overall) | 20 (51.3%) | 19 (48.7%) |
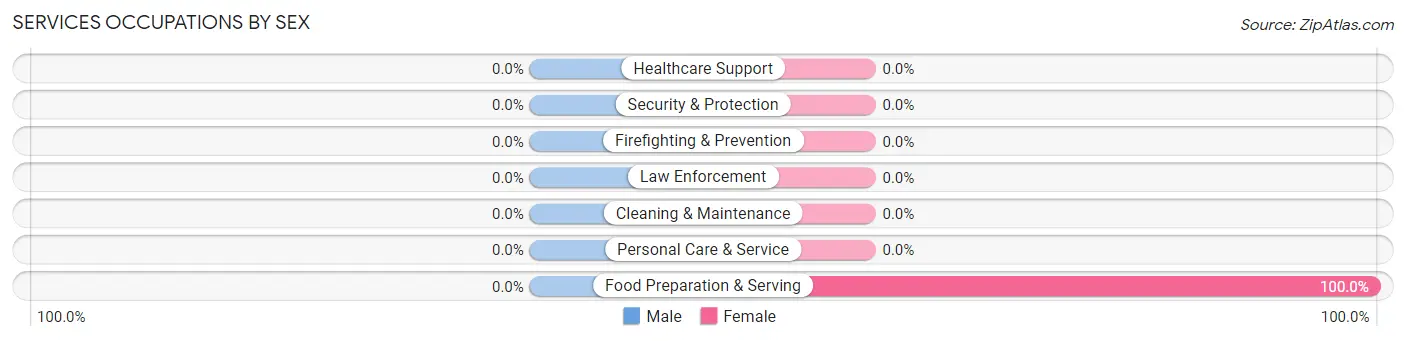
Services Occupations
The most common Services occupations in Beecher Falls are , and Food Preparation & Serving (15 | 38.5%).
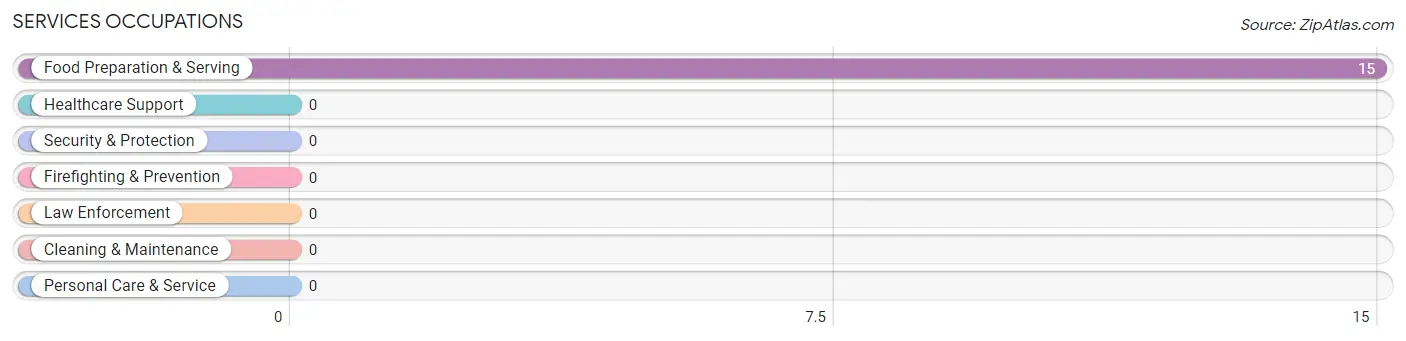
Services Occupations by Sex
| Occupation | Male | Female |
| Healthcare Support | 0 (0.0%) | 0 (0.0%) |
| Security & Protection | 0 (0.0%) | 0 (0.0%) |
| Firefighting & Prevention | 0 (0.0%) | 0 (0.0%) |
| Law Enforcement | 0 (0.0%) | 0 (0.0%) |
| Food Preparation & Serving | 0 (0.0%) | 15 (100.0%) |
| Cleaning & Maintenance | 0 (0.0%) | 0 (0.0%) |
| Personal Care & Service | 0 (0.0%) | 0 (0.0%) |
| Total (Category) | 0 (0.0%) | 15 (100.0%) |
| Total (Overall) | 20 (51.3%) | 19 (48.7%) |
Sales and Office Occupations
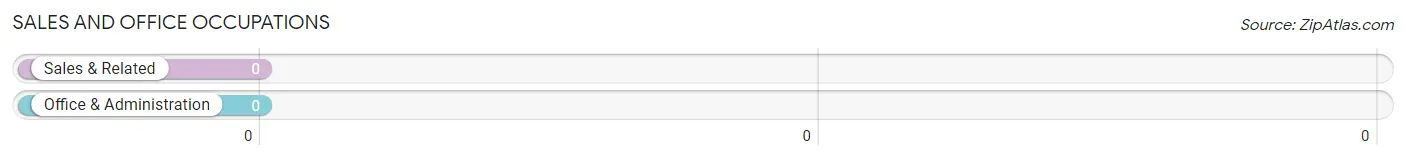
Sales and Office Occupations by Sex
| Occupation | Male | Female |
| Sales & Related | 0 (0.0%) | 0 (0.0%) |
| Office & Administration | 0 (0.0%) | 0 (0.0%) |
| Total (Category) | 0 (0.0%) | 0 (0.0%) |
| Total (Overall) | 20 (51.3%) | 19 (48.7%) |
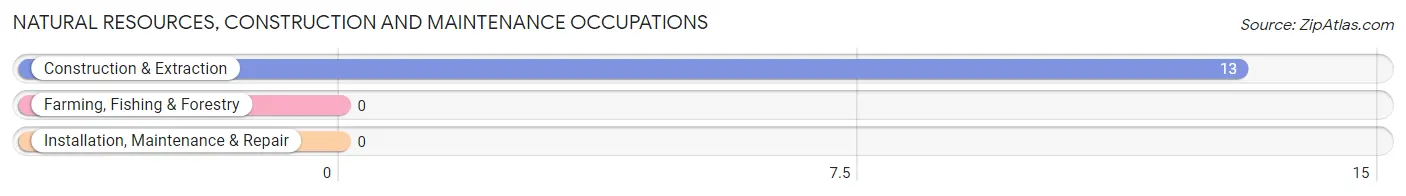
Natural Resources, Construction and Maintenance Occupations
The most common Natural Resources, Construction and Maintenance occupations in Beecher Falls are , and Construction & Extraction (13 | 33.3%).
Natural Resources, Construction and Maintenance Occupations by Sex
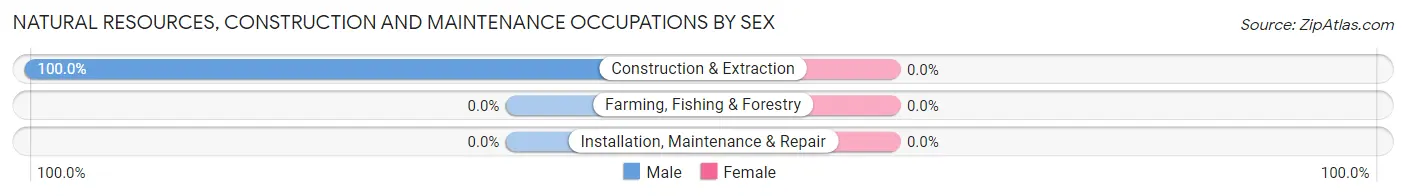
| Occupation | Male | Female |
| Farming, Fishing & Forestry | 0 (0.0%) | 0 (0.0%) |
| Construction & Extraction | 13 (100.0%) | 0 (0.0%) |
| Installation, Maintenance & Repair | 0 (0.0%) | 0 (0.0%) |
| Total (Category) | 13 (100.0%) | 0 (0.0%) |
| Total (Overall) | 20 (51.3%) | 19 (48.7%) |
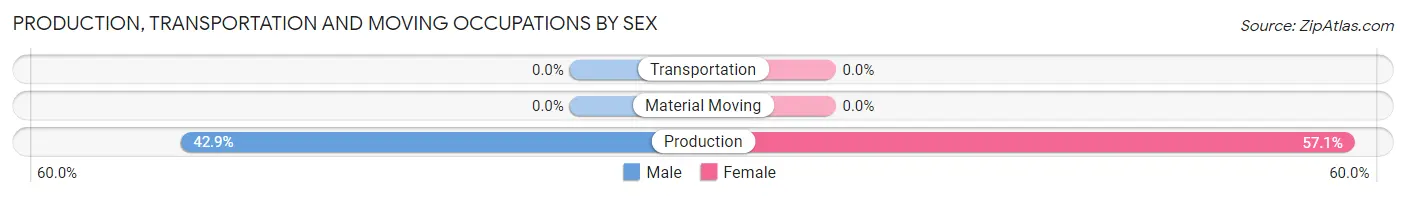
Production, Transportation and Moving Occupations
The most common Production, Transportation and Moving occupations in Beecher Falls are , and Production (7 | 17.9%).
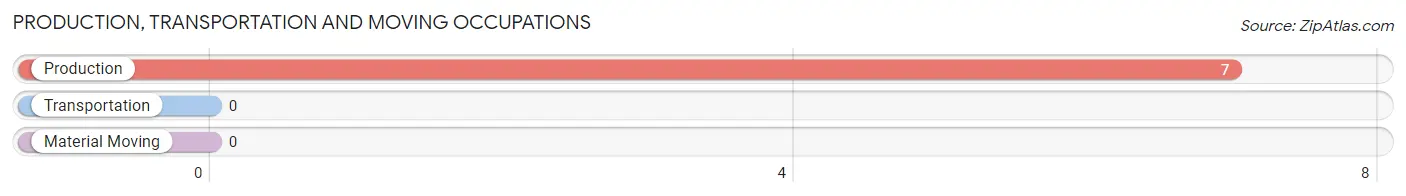
Production, Transportation and Moving Occupations by Sex
| Occupation | Male | Female |
| Production | 3 (42.9%) | 4 (57.1%) |
| Transportation | 0 (0.0%) | 0 (0.0%) |
| Material Moving | 0 (0.0%) | 0 (0.0%) |
| Total (Category) | 3 (42.9%) | 4 (57.1%) |
| Total (Overall) | 20 (51.3%) | 19 (48.7%) |
Employment Industries by Sex in Beecher Falls
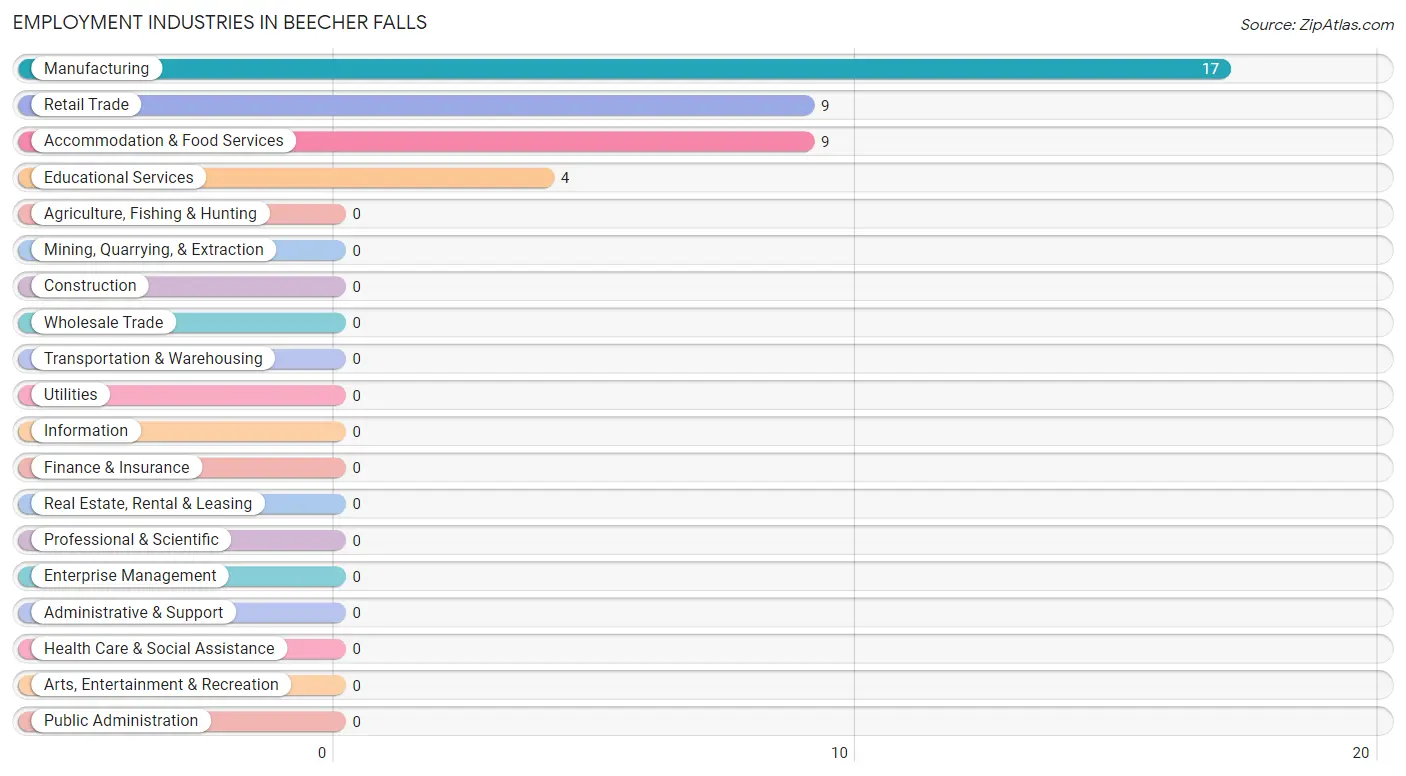
Employment Industries in Beecher Falls
The major employment industries in Beecher Falls include Manufacturing (17 | 43.6%), Retail Trade (9 | 23.1%), Accommodation & Food Services (9 | 23.1%), and Educational Services (4 | 10.3%).
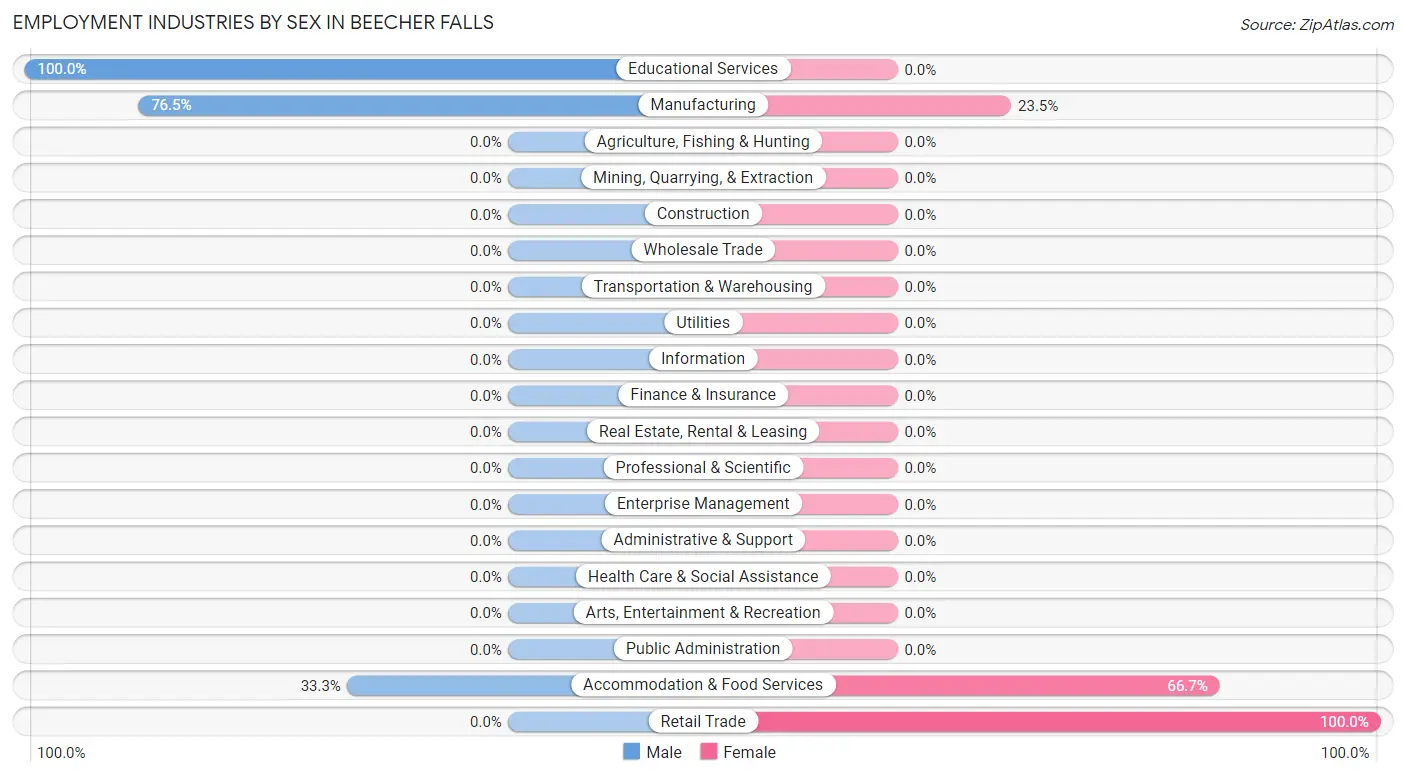
Employment Industries by Sex in Beecher Falls
The Beecher Falls industries that see more men than women are Educational Services (100.0%), Manufacturing (76.5%), and Accommodation & Food Services (33.3%), whereas the industries that tend to have a higher number of women are Retail Trade (100.0%), Accommodation & Food Services (66.7%), and Manufacturing (23.5%).
| Industry | Male | Female |
| Agriculture, Fishing & Hunting | 0 (0.0%) | 0 (0.0%) |
| Mining, Quarrying, & Extraction | 0 (0.0%) | 0 (0.0%) |
| Construction | 0 (0.0%) | 0 (0.0%) |
| Manufacturing | 13 (76.5%) | 4 (23.5%) |
| Wholesale Trade | 0 (0.0%) | 0 (0.0%) |
| Retail Trade | 0 (0.0%) | 9 (100.0%) |
| Transportation & Warehousing | 0 (0.0%) | 0 (0.0%) |
| Utilities | 0 (0.0%) | 0 (0.0%) |
| Information | 0 (0.0%) | 0 (0.0%) |
| Finance & Insurance | 0 (0.0%) | 0 (0.0%) |
| Real Estate, Rental & Leasing | 0 (0.0%) | 0 (0.0%) |
| Professional & Scientific | 0 (0.0%) | 0 (0.0%) |
| Enterprise Management | 0 (0.0%) | 0 (0.0%) |
| Administrative & Support | 0 (0.0%) | 0 (0.0%) |
| Educational Services | 4 (100.0%) | 0 (0.0%) |
| Health Care & Social Assistance | 0 (0.0%) | 0 (0.0%) |
| Arts, Entertainment & Recreation | 0 (0.0%) | 0 (0.0%) |
| Accommodation & Food Services | 3 (33.3%) | 6 (66.7%) |
| Public Administration | 0 (0.0%) | 0 (0.0%) |
| Total | 20 (51.3%) | 19 (48.7%) |
Education in Beecher Falls
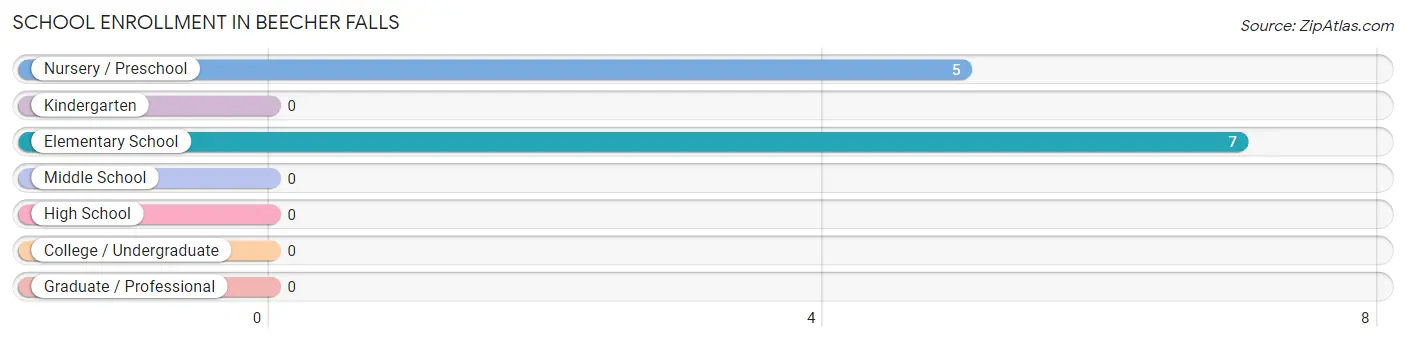
School Enrollment in Beecher Falls
The most common levels of schooling among the 12 students in Beecher Falls are elementary school (7 | 58.3%), and nursery / preschool (5 | 41.7%).
| School Level | # Students | % Students |
| Nursery / Preschool | 5 | 41.7% |
| Kindergarten | 0 | 0.0% |
| Elementary School | 7 | 58.3% |
| Middle School | 0 | 0.0% |
| High School | 0 | 0.0% |
| College / Undergraduate | 0 | 0.0% |
| Graduate / Professional | 0 | 0.0% |
| Total | 12 | 100.0% |
School Enrollment by Age by Funding Source in Beecher Falls
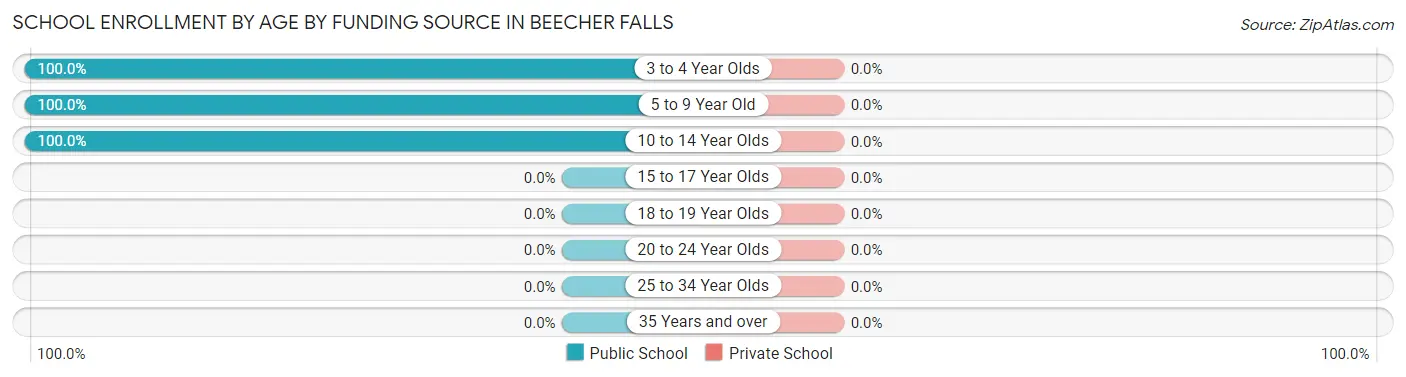
| Age Bracket | Public School | Private School |
| 3 to 4 Year Olds | 5 (100.0%) | 0 (0.0%) |
| 5 to 9 Year Old | 3 (100.0%) | 0 (0.0%) |
| 10 to 14 Year Olds | 4 (100.0%) | 0 (0.0%) |
| 15 to 17 Year Olds | 0 (0.0%) | 0 (0.0%) |
| 18 to 19 Year Olds | 0 (0.0%) | 0 (0.0%) |
| 20 to 24 Year Olds | 0 (0.0%) | 0 (0.0%) |
| 25 to 34 Year Olds | 0 (0.0%) | 0 (0.0%) |
| 35 Years and over | 0 (0.0%) | 0 (0.0%) |
| Total | 12 (100.0%) | 0 (0.0%) |
Educational Attainment by Field of Study in Beecher Falls
, and education (4 | 100.0%) are the most common fields of study among 4 individuals in Beecher Falls who have obtained a bachelor's degree or higher.
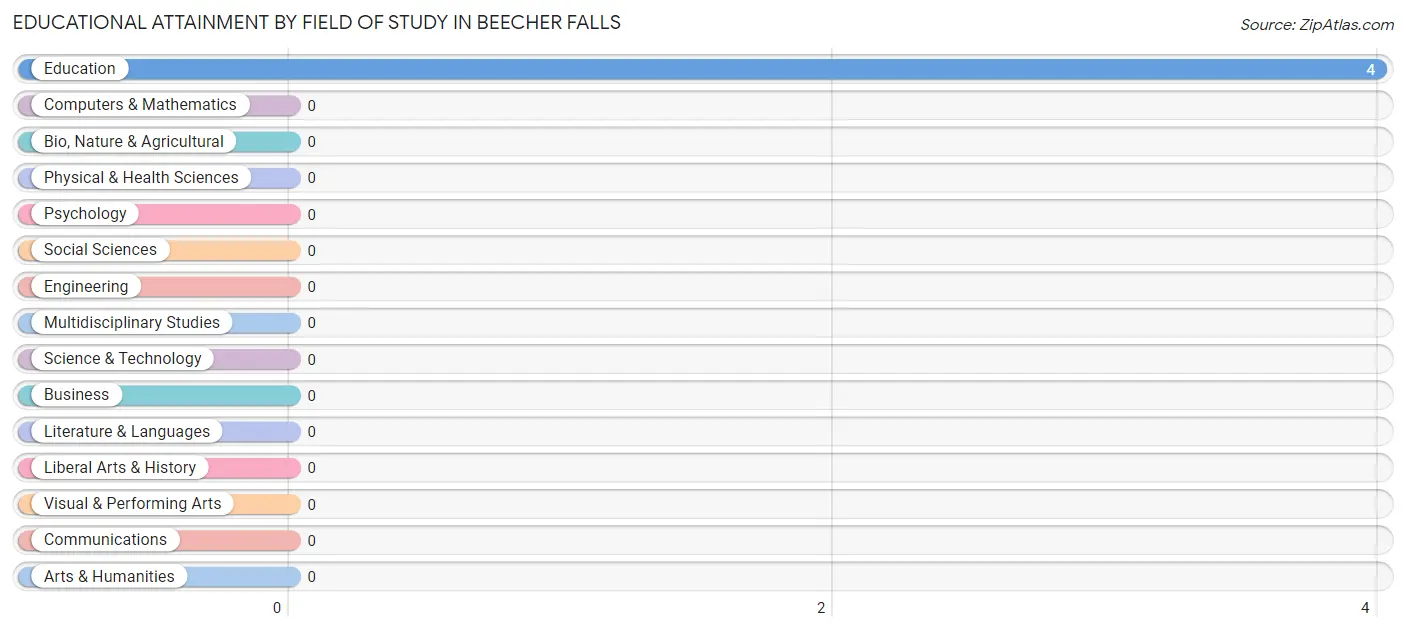
| Field of Study | # Graduates | % Graduates |
| Computers & Mathematics | 0 | 0.0% |
| Bio, Nature & Agricultural | 0 | 0.0% |
| Physical & Health Sciences | 0 | 0.0% |
| Psychology | 0 | 0.0% |
| Social Sciences | 0 | 0.0% |
| Engineering | 0 | 0.0% |
| Multidisciplinary Studies | 0 | 0.0% |
| Science & Technology | 0 | 0.0% |
| Business | 0 | 0.0% |
| Education | 4 | 100.0% |
| Literature & Languages | 0 | 0.0% |
| Liberal Arts & History | 0 | 0.0% |
| Visual & Performing Arts | 0 | 0.0% |
| Communications | 0 | 0.0% |
| Arts & Humanities | 0 | 0.0% |
| Total | 4 | 100.0% |
Transportation & Commute in Beecher Falls
Vehicle Availability by Sex in Beecher Falls
The most prevalent vehicle ownership categories in Beecher Falls are males with 2 vehicles (16, accounting for 80.0%) and females with 2 vehicles (9, making up 84.2%).
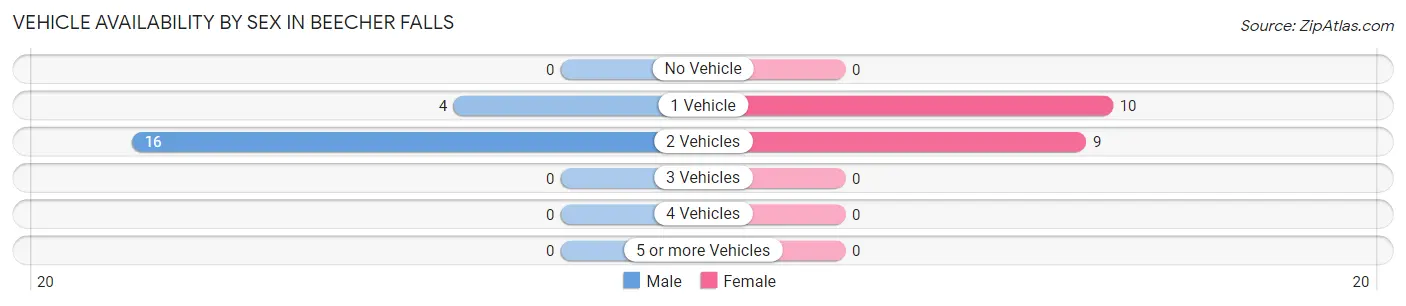
| Vehicles Available | Male | Female |
| No Vehicle | 0 (0.0%) | 0 (0.0%) |
| 1 Vehicle | 4 (20.0%) | 10 (52.6%) |
| 2 Vehicles | 16 (80.0%) | 9 (47.4%) |
| 3 Vehicles | 0 (0.0%) | 0 (0.0%) |
| 4 Vehicles | 0 (0.0%) | 0 (0.0%) |
| 5 or more Vehicles | 0 (0.0%) | 0 (0.0%) |
| Total | 20 (100.0%) | 19 (100.0%) |
Commute Time in Beecher Falls
The most frequently occuring commute durations in Beecher Falls are 5 to 9 minutes (21 commuters, 53.8%), 15 to 19 minutes (9 commuters, 23.1%), and 90 or more minutes (6 commuters, 15.4%).
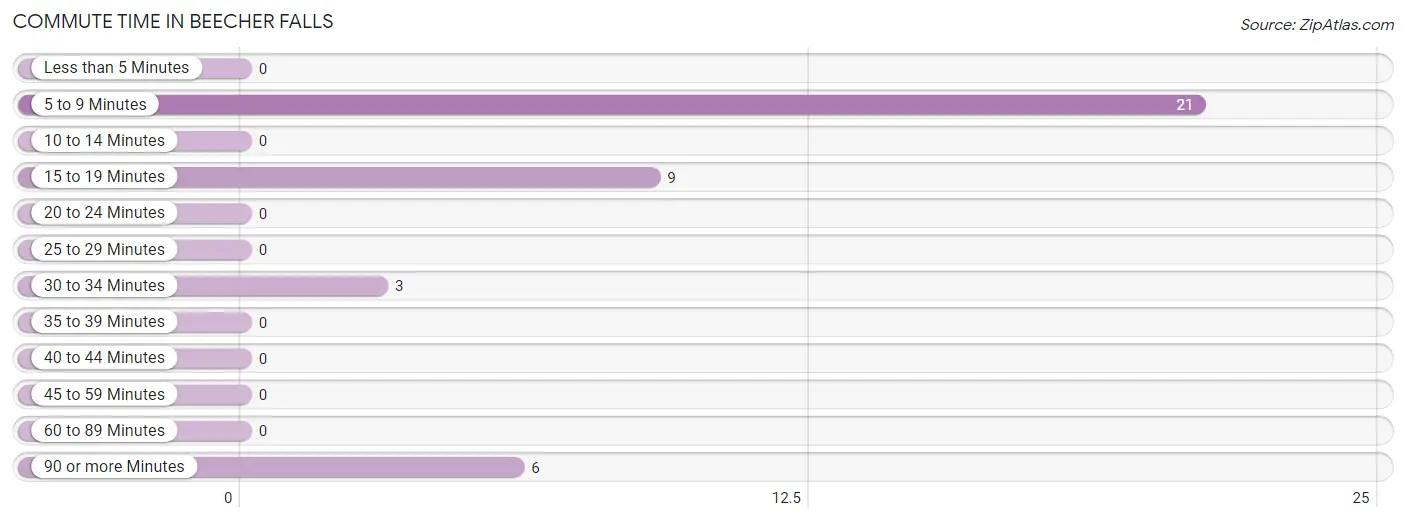
| Commute Time | # Commuters | % Commuters |
| Less than 5 Minutes | 0 | 0.0% |
| 5 to 9 Minutes | 21 | 53.8% |
| 10 to 14 Minutes | 0 | 0.0% |
| 15 to 19 Minutes | 9 | 23.1% |
| 20 to 24 Minutes | 0 | 0.0% |
| 25 to 29 Minutes | 0 | 0.0% |
| 30 to 34 Minutes | 3 | 7.7% |
| 35 to 39 Minutes | 0 | 0.0% |
| 40 to 44 Minutes | 0 | 0.0% |
| 45 to 59 Minutes | 0 | 0.0% |
| 60 to 89 Minutes | 0 | 0.0% |
| 90 or more Minutes | 6 | 15.4% |
Commute Time by Sex in Beecher Falls
The most common commute times in Beecher Falls are 5 to 9 minutes (17 commuters, 85.0%) for males and 15 to 19 minutes (9 commuters, 47.4%) for females.
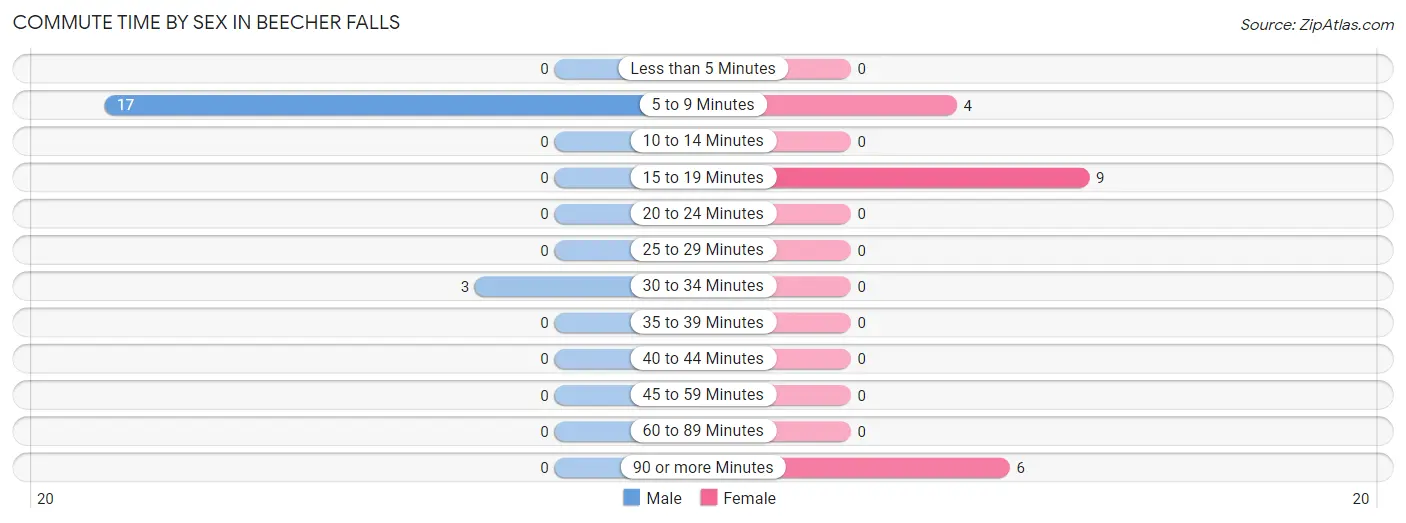
| Commute Time | Male | Female |
| Less than 5 Minutes | 0 (0.0%) | 0 (0.0%) |
| 5 to 9 Minutes | 17 (85.0%) | 4 (21.0%) |
| 10 to 14 Minutes | 0 (0.0%) | 0 (0.0%) |
| 15 to 19 Minutes | 0 (0.0%) | 9 (47.4%) |
| 20 to 24 Minutes | 0 (0.0%) | 0 (0.0%) |
| 25 to 29 Minutes | 0 (0.0%) | 0 (0.0%) |
| 30 to 34 Minutes | 3 (15.0%) | 0 (0.0%) |
| 35 to 39 Minutes | 0 (0.0%) | 0 (0.0%) |
| 40 to 44 Minutes | 0 (0.0%) | 0 (0.0%) |
| 45 to 59 Minutes | 0 (0.0%) | 0 (0.0%) |
| 60 to 89 Minutes | 0 (0.0%) | 0 (0.0%) |
| 90 or more Minutes | 0 (0.0%) | 6 (31.6%) |
Time of Departure to Work by Sex in Beecher Falls
The most frequent times of departure to work in Beecher Falls are 5:30 AM to 5:59 AM (13, 65.0%) for males and 8:30 AM to 8:59 AM (9, 47.4%) for females.
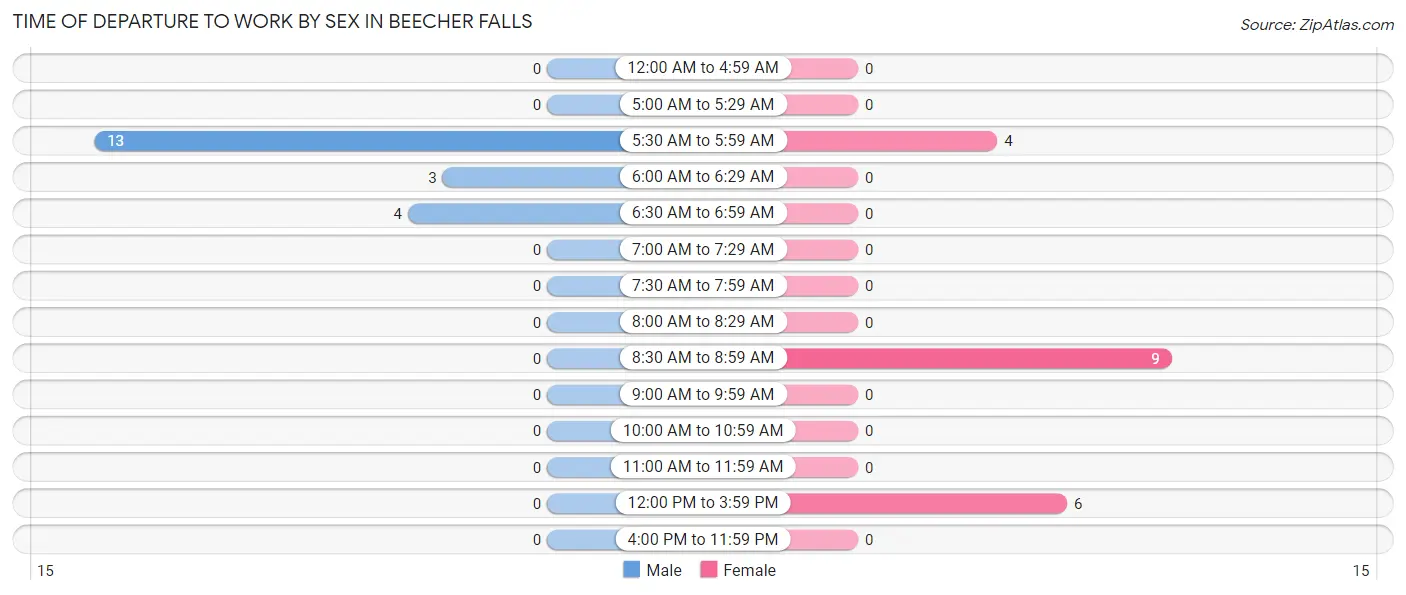
| Time of Departure | Male | Female |
| 12:00 AM to 4:59 AM | 0 (0.0%) | 0 (0.0%) |
| 5:00 AM to 5:29 AM | 0 (0.0%) | 0 (0.0%) |
| 5:30 AM to 5:59 AM | 13 (65.0%) | 4 (21.0%) |
| 6:00 AM to 6:29 AM | 3 (15.0%) | 0 (0.0%) |
| 6:30 AM to 6:59 AM | 4 (20.0%) | 0 (0.0%) |
| 7:00 AM to 7:29 AM | 0 (0.0%) | 0 (0.0%) |
| 7:30 AM to 7:59 AM | 0 (0.0%) | 0 (0.0%) |
| 8:00 AM to 8:29 AM | 0 (0.0%) | 0 (0.0%) |
| 8:30 AM to 8:59 AM | 0 (0.0%) | 9 (47.4%) |
| 9:00 AM to 9:59 AM | 0 (0.0%) | 0 (0.0%) |
| 10:00 AM to 10:59 AM | 0 (0.0%) | 0 (0.0%) |
| 11:00 AM to 11:59 AM | 0 (0.0%) | 0 (0.0%) |
| 12:00 PM to 3:59 PM | 0 (0.0%) | 6 (31.6%) |
| 4:00 PM to 11:59 PM | 0 (0.0%) | 0 (0.0%) |
| Total | 20 (100.0%) | 19 (100.0%) |
Housing Occupancy in Beecher Falls
Occupancy by Ownership in Beecher Falls
Of the total 55 dwellings in Beecher Falls, owner-occupied units account for 52 (94.6%), while renter-occupied units make up 3 (5.4%).
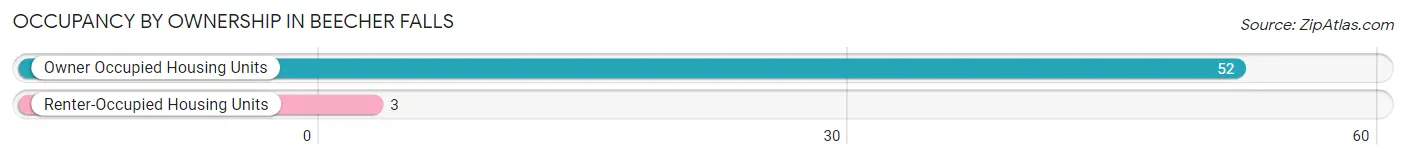
| Occupancy | # Housing Units | % Housing Units |
| Owner Occupied Housing Units | 52 | 94.6% |
| Renter-Occupied Housing Units | 3 | 5.4% |
| Total Occupied Housing Units | 55 | 100.0% |
Occupancy by Household Size in Beecher Falls
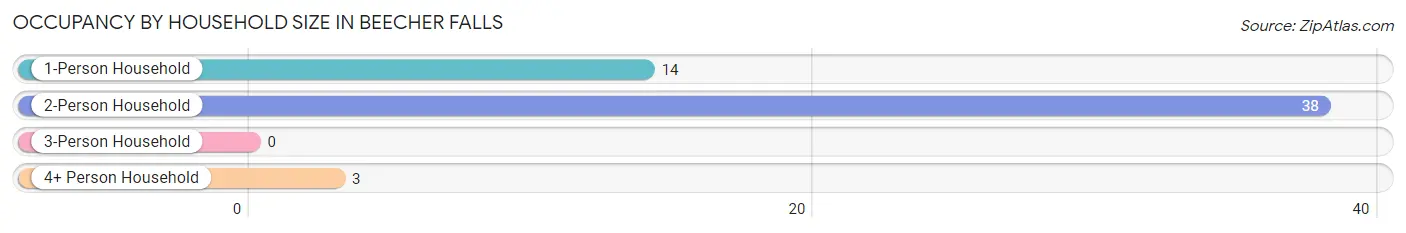
| Household Size | # Housing Units | % Housing Units |
| 1-Person Household | 14 | 25.5% |
| 2-Person Household | 38 | 69.1% |
| 3-Person Household | 0 | 0.0% |
| 4+ Person Household | 3 | 5.4% |
| Total Housing Units | 55 | 100.0% |
Occupancy by Ownership by Household Size in Beecher Falls
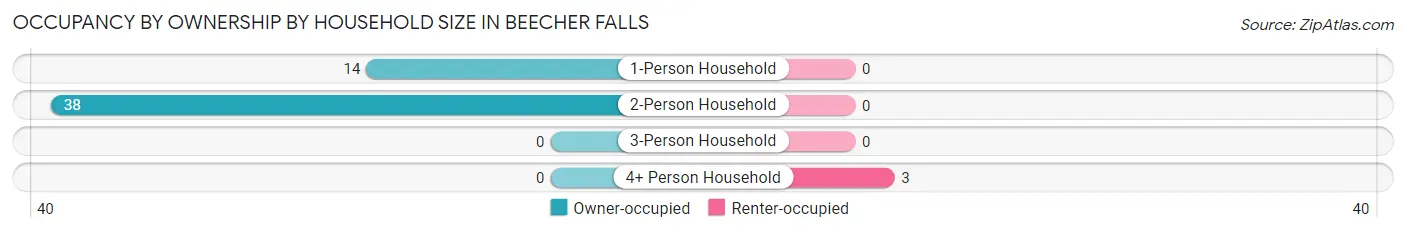
| Household Size | Owner-occupied | Renter-occupied |
| 1-Person Household | 14 (100.0%) | 0 (0.0%) |
| 2-Person Household | 38 (100.0%) | 0 (0.0%) |
| 3-Person Household | 0 (0.0%) | 0 (0.0%) |
| 4+ Person Household | 0 (0.0%) | 3 (100.0%) |
| Total Housing Units | 52 (94.6%) | 3 (5.4%) |
Occupancy by Educational Attainment in Beecher Falls
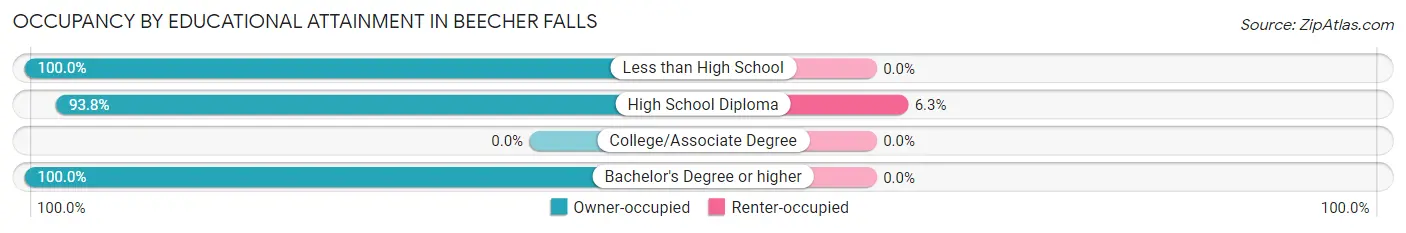
| Household Size | Owner-occupied | Renter-occupied |
| Less than High School | 3 (100.0%) | 0 (0.0%) |
| High School Diploma | 45 (93.8%) | 3 (6.2%) |
| College/Associate Degree | 0 (0.0%) | 0 (0.0%) |
| Bachelor's Degree or higher | 4 (100.0%) | 0 (0.0%) |
Occupancy by Age of Householder in Beecher Falls
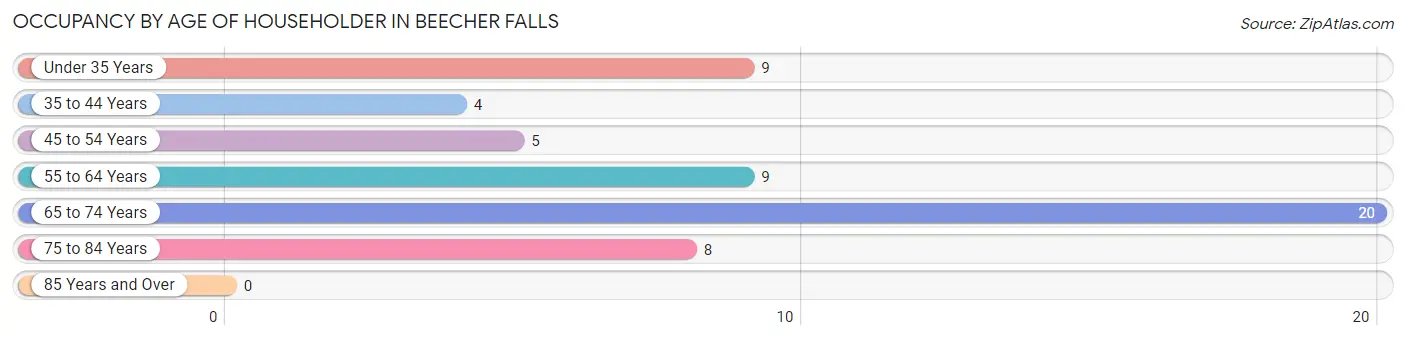
| Age Bracket | # Households | % Households |
| Under 35 Years | 9 | 16.4% |
| 35 to 44 Years | 4 | 7.3% |
| 45 to 54 Years | 5 | 9.1% |
| 55 to 64 Years | 9 | 16.4% |
| 65 to 74 Years | 20 | 36.4% |
| 75 to 84 Years | 8 | 14.5% |
| 85 Years and Over | 0 | 0.0% |
| Total | 55 | 100.0% |
Housing Finances in Beecher Falls
Median Income by Occupancy in Beecher Falls
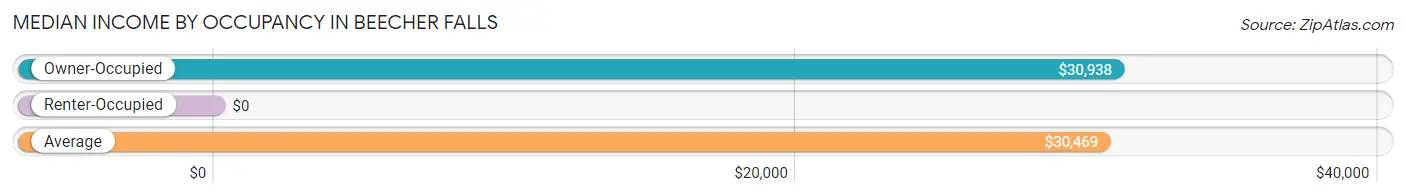
| Occupancy Type | # Households | Median Income |
| Owner-Occupied | 52 (94.6%) | $30,938 |
| Renter-Occupied | 3 (5.4%) | $0 |
| Average | 55 (100.0%) | $30,469 |
Occupancy by Householder Income Bracket in Beecher Falls
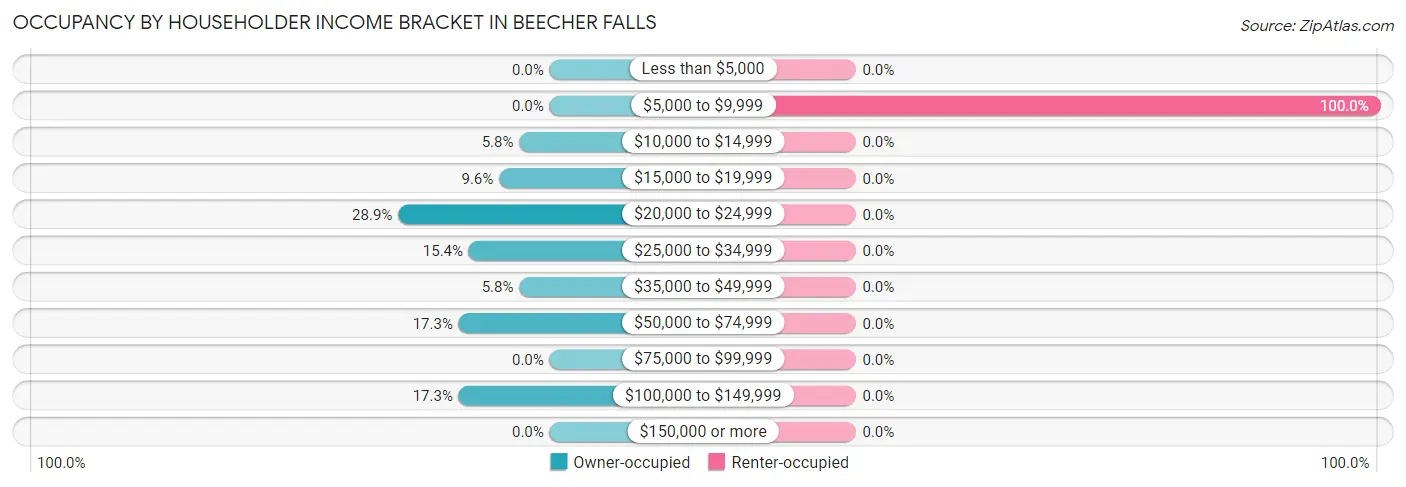
| Income Bracket | Owner-occupied | Renter-occupied |
| Less than $5,000 | 0 (0.0%) | 0 (0.0%) |
| $5,000 to $9,999 | 0 (0.0%) | 3 (100.0%) |
| $10,000 to $14,999 | 3 (5.8%) | 0 (0.0%) |
| $15,000 to $19,999 | 5 (9.6%) | 0 (0.0%) |
| $20,000 to $24,999 | 15 (28.8%) | 0 (0.0%) |
| $25,000 to $34,999 | 8 (15.4%) | 0 (0.0%) |
| $35,000 to $49,999 | 3 (5.8%) | 0 (0.0%) |
| $50,000 to $74,999 | 9 (17.3%) | 0 (0.0%) |
| $75,000 to $99,999 | 0 (0.0%) | 0 (0.0%) |
| $100,000 to $149,999 | 9 (17.3%) | 0 (0.0%) |
| $150,000 or more | 0 (0.0%) | 0 (0.0%) |
| Total | 52 (100.0%) | 3 (100.0%) |
Monthly Housing Cost Tiers in Beecher Falls
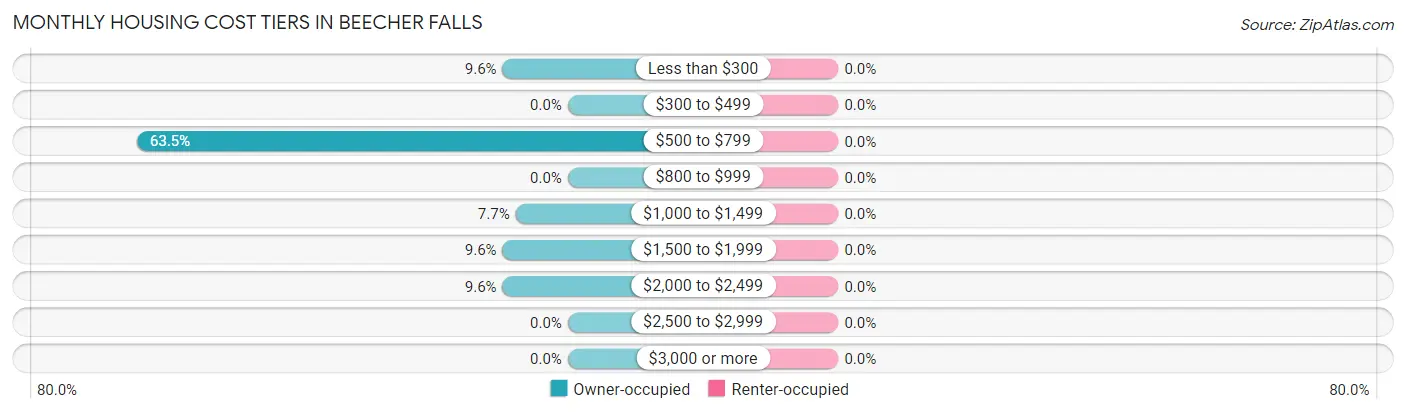
| Monthly Cost | Owner-occupied | Renter-occupied |
| Less than $300 | 5 (9.6%) | 0 (0.0%) |
| $300 to $499 | 0 (0.0%) | 0 (0.0%) |
| $500 to $799 | 33 (63.5%) | 0 (0.0%) |
| $800 to $999 | 0 (0.0%) | 0 (0.0%) |
| $1,000 to $1,499 | 4 (7.7%) | 0 (0.0%) |
| $1,500 to $1,999 | 5 (9.6%) | 0 (0.0%) |
| $2,000 to $2,499 | 5 (9.6%) | 0 (0.0%) |
| $2,500 to $2,999 | 0 (0.0%) | 0 (0.0%) |
| $3,000 or more | 0 (0.0%) | 0 (0.0%) |
| Total | 52 (100.0%) | 3 (100.0%) |
Physical Housing Characteristics in Beecher Falls
Housing Structures in Beecher Falls
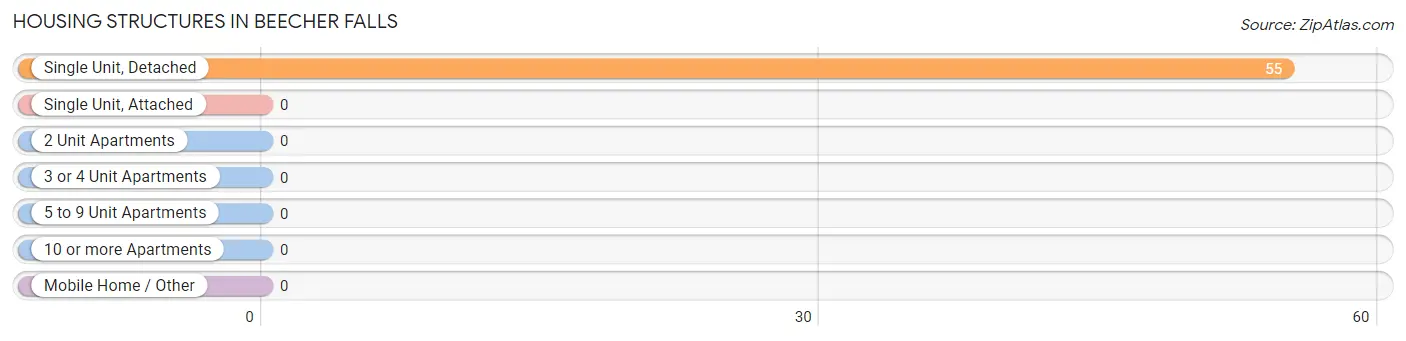
| Structure Type | # Housing Units | % Housing Units |
| Single Unit, Detached | 55 | 100.0% |
| Single Unit, Attached | 0 | 0.0% |
| 2 Unit Apartments | 0 | 0.0% |
| 3 or 4 Unit Apartments | 0 | 0.0% |
| 5 to 9 Unit Apartments | 0 | 0.0% |
| 10 or more Apartments | 0 | 0.0% |
| Mobile Home / Other | 0 | 0.0% |
| Total | 55 | 100.0% |
Housing Structures by Occupancy in Beecher Falls
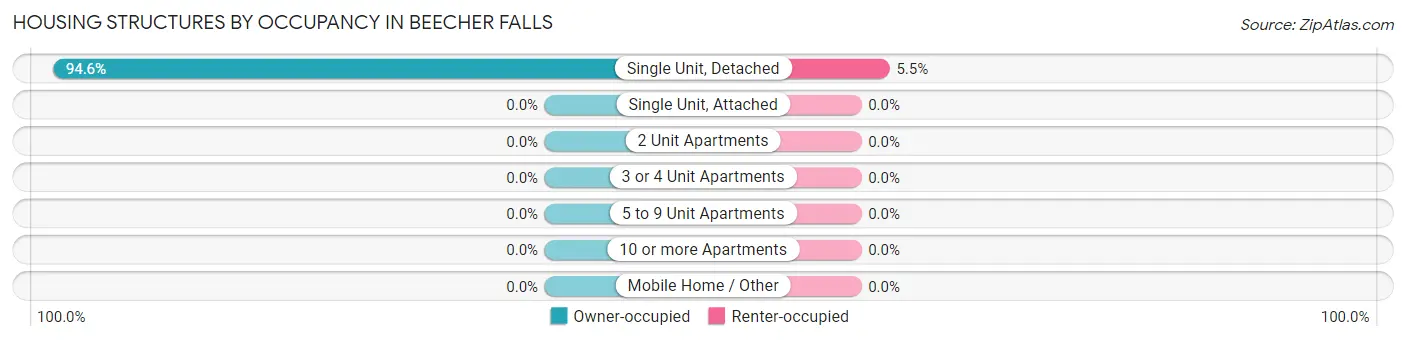
| Structure Type | Owner-occupied | Renter-occupied |
| Single Unit, Detached | 52 (94.6%) | 3 (5.4%) |
| Single Unit, Attached | 0 (0.0%) | 0 (0.0%) |
| 2 Unit Apartments | 0 (0.0%) | 0 (0.0%) |
| 3 or 4 Unit Apartments | 0 (0.0%) | 0 (0.0%) |
| 5 to 9 Unit Apartments | 0 (0.0%) | 0 (0.0%) |
| 10 or more Apartments | 0 (0.0%) | 0 (0.0%) |
| Mobile Home / Other | 0 (0.0%) | 0 (0.0%) |
| Total | 52 (94.6%) | 3 (5.4%) |
Housing Structures by Number of Rooms in Beecher Falls
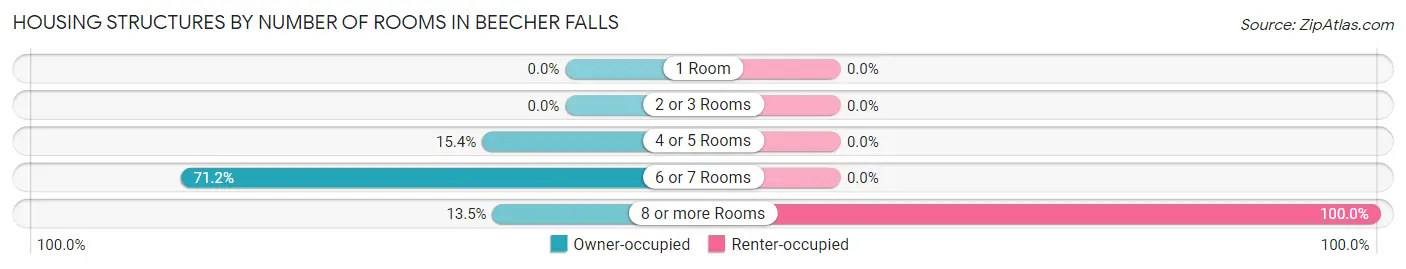
| Number of Rooms | Owner-occupied | Renter-occupied |
| 1 Room | 0 (0.0%) | 0 (0.0%) |
| 2 or 3 Rooms | 0 (0.0%) | 0 (0.0%) |
| 4 or 5 Rooms | 8 (15.4%) | 0 (0.0%) |
| 6 or 7 Rooms | 37 (71.2%) | 0 (0.0%) |
| 8 or more Rooms | 7 (13.5%) | 3 (100.0%) |
| Total | 52 (100.0%) | 3 (100.0%) |
Housing Structure by Heating Type in Beecher Falls
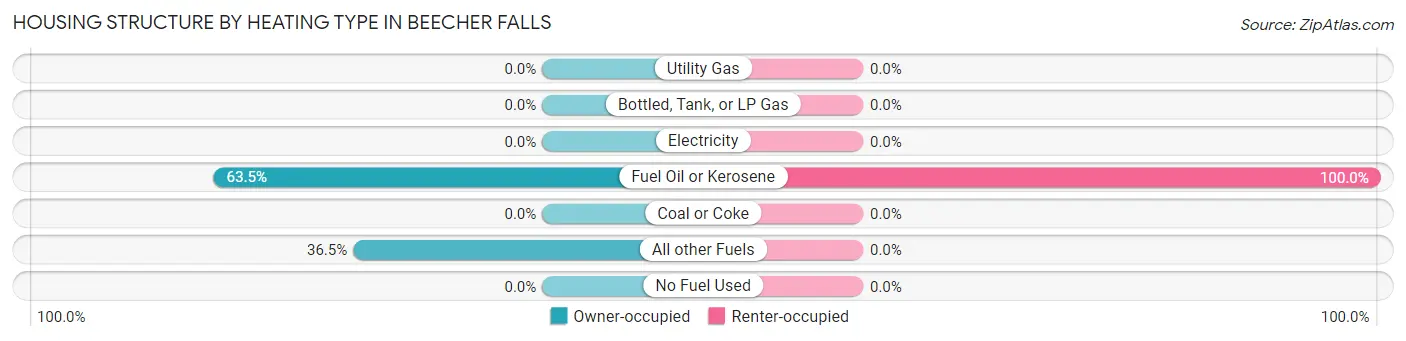
| Heating Type | Owner-occupied | Renter-occupied |
| Utility Gas | 0 (0.0%) | 0 (0.0%) |
| Bottled, Tank, or LP Gas | 0 (0.0%) | 0 (0.0%) |
| Electricity | 0 (0.0%) | 0 (0.0%) |
| Fuel Oil or Kerosene | 33 (63.5%) | 3 (100.0%) |
| Coal or Coke | 0 (0.0%) | 0 (0.0%) |
| All other Fuels | 19 (36.5%) | 0 (0.0%) |
| No Fuel Used | 0 (0.0%) | 0 (0.0%) |
| Total | 52 (100.0%) | 3 (100.0%) |
Household Vehicle Usage in Beecher Falls
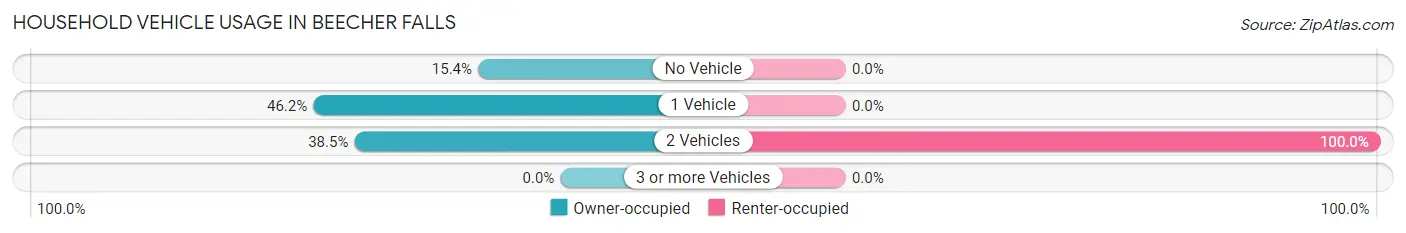
| Vehicles per Household | Owner-occupied | Renter-occupied |
| No Vehicle | 8 (15.4%) | 0 (0.0%) |
| 1 Vehicle | 24 (46.2%) | 0 (0.0%) |
| 2 Vehicles | 20 (38.5%) | 3 (100.0%) |
| 3 or more Vehicles | 0 (0.0%) | 0 (0.0%) |
| Total | 52 (100.0%) | 3 (100.0%) |
Real Estate & Mortgages in Beecher Falls
Real Estate and Mortgage Overview in Beecher Falls
| Characteristic | Without Mortgage | With Mortgage |
| Housing Units | 29 | 23 |
| Median Property Value | $89,600 | $154,500 |
| Median Household Income | $22,813 | $0 |
| Monthly Housing Costs | $592 | $0 |
| Real Estate Taxes | $2,200 | $0 |
Property Value by Mortgage Status in Beecher Falls
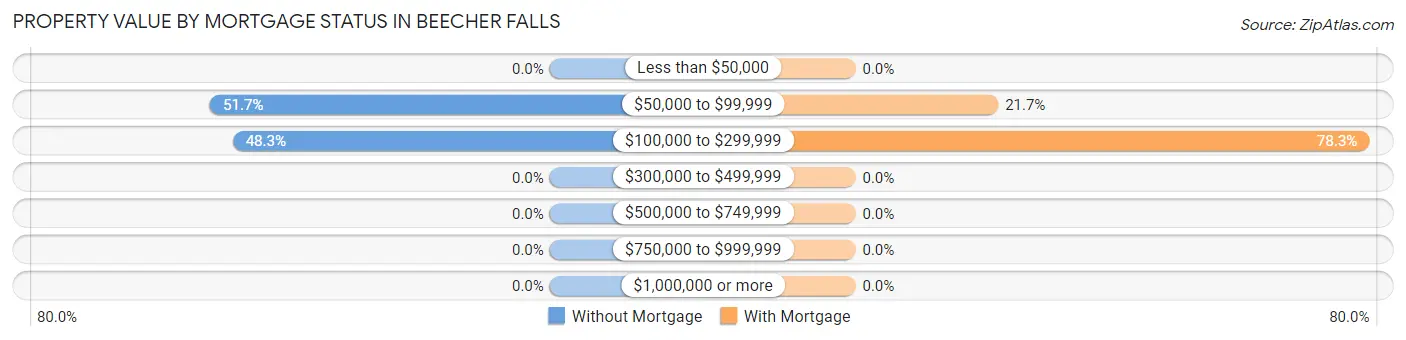
| Property Value | Without Mortgage | With Mortgage |
| Less than $50,000 | 0 (0.0%) | 0 (0.0%) |
| $50,000 to $99,999 | 15 (51.7%) | 5 (21.7%) |
| $100,000 to $299,999 | 14 (48.3%) | 18 (78.3%) |
| $300,000 to $499,999 | 0 (0.0%) | 0 (0.0%) |
| $500,000 to $749,999 | 0 (0.0%) | 0 (0.0%) |
| $750,000 to $999,999 | 0 (0.0%) | 0 (0.0%) |
| $1,000,000 or more | 0 (0.0%) | 0 (0.0%) |
| Total | 29 (100.0%) | 23 (100.0%) |
Household Income by Mortgage Status in Beecher Falls
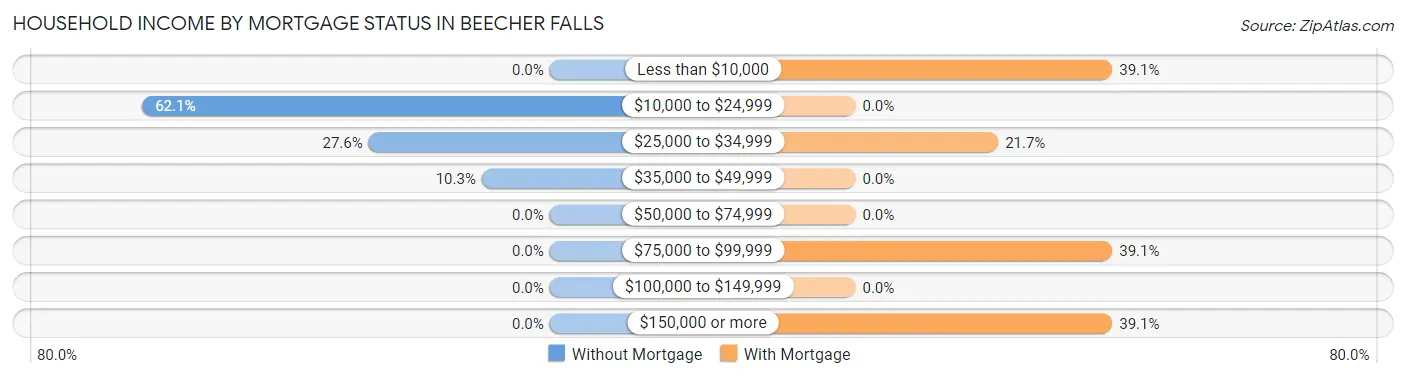
| Household Income | Without Mortgage | With Mortgage |
| Less than $10,000 | 0 (0.0%) | 9 (39.1%) |
| $10,000 to $24,999 | 18 (62.1%) | 0 (0.0%) |
| $25,000 to $34,999 | 8 (27.6%) | 5 (21.7%) |
| $35,000 to $49,999 | 3 (10.3%) | 0 (0.0%) |
| $50,000 to $74,999 | 0 (0.0%) | 0 (0.0%) |
| $75,000 to $99,999 | 0 (0.0%) | 9 (39.1%) |
| $100,000 to $149,999 | 0 (0.0%) | 0 (0.0%) |
| $150,000 or more | 0 (0.0%) | 9 (39.1%) |
| Total | 29 (100.0%) | 23 (100.0%) |
Property Value to Household Income Ratio in Beecher Falls
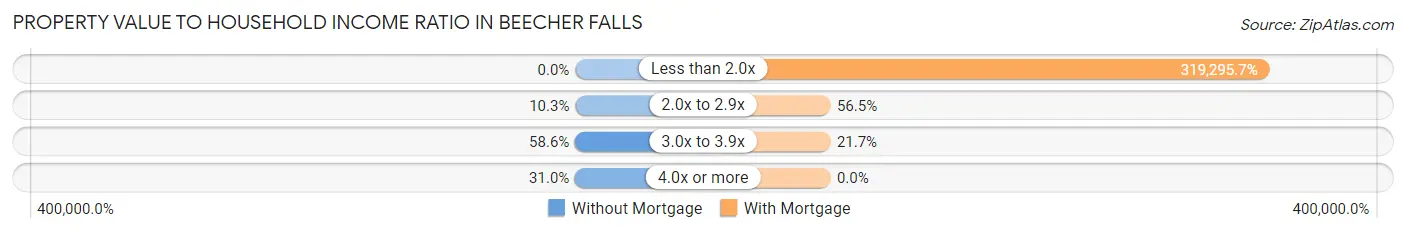
| Value-to-Income Ratio | Without Mortgage | With Mortgage |
| Less than 2.0x | 0 (0.0%) | 73,438 (319,295.6%) |
| 2.0x to 2.9x | 3 (10.3%) | 13 (56.5%) |
| 3.0x to 3.9x | 17 (58.6%) | 5 (21.7%) |
| 4.0x or more | 9 (31.0%) | 0 (0.0%) |
| Total | 29 (100.0%) | 23 (100.0%) |
Real Estate Taxes by Mortgage Status in Beecher Falls
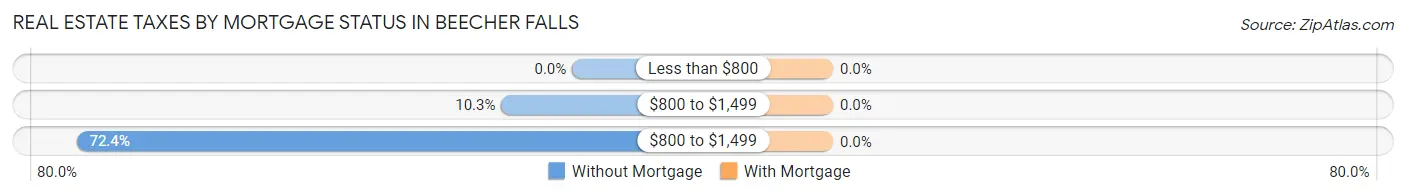
| Property Taxes | Without Mortgage | With Mortgage |
| Less than $800 | 0 (0.0%) | 0 (0.0%) |
| $800 to $1,499 | 3 (10.3%) | 0 (0.0%) |
| $800 to $1,499 | 21 (72.4%) | 0 (0.0%) |
| Total | 29 (100.0%) | 23 (100.0%) |
Health & Disability in Beecher Falls
Health Insurance Coverage by Age in Beecher Falls
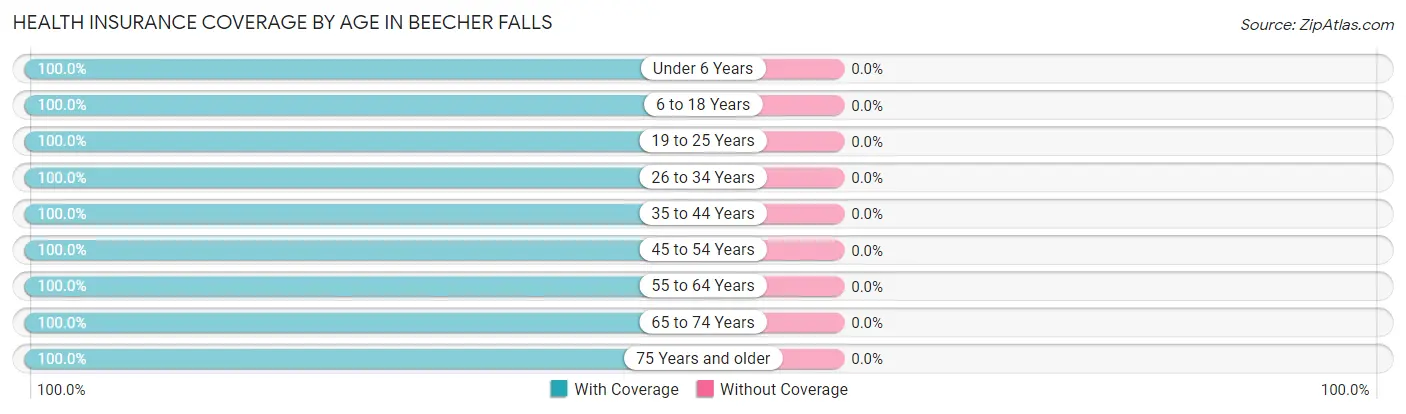
| Age Bracket | With Coverage | Without Coverage |
| Under 6 Years | 5 (100.0%) | 0 (0.0%) |
| 6 to 18 Years | 7 (100.0%) | 0 (0.0%) |
| 19 to 25 Years | 2 (100.0%) | 0 (0.0%) |
| 26 to 34 Years | 11 (100.0%) | 0 (0.0%) |
| 35 to 44 Years | 4 (100.0%) | 0 (0.0%) |
| 45 to 54 Years | 5 (100.0%) | 0 (0.0%) |
| 55 to 64 Years | 24 (100.0%) | 0 (0.0%) |
| 65 to 74 Years | 35 (100.0%) | 0 (0.0%) |
| 75 Years and older | 8 (100.0%) | 0 (0.0%) |
| Total | 101 (100.0%) | 0 (0.0%) |
Health Insurance Coverage by Citizenship Status in Beecher Falls
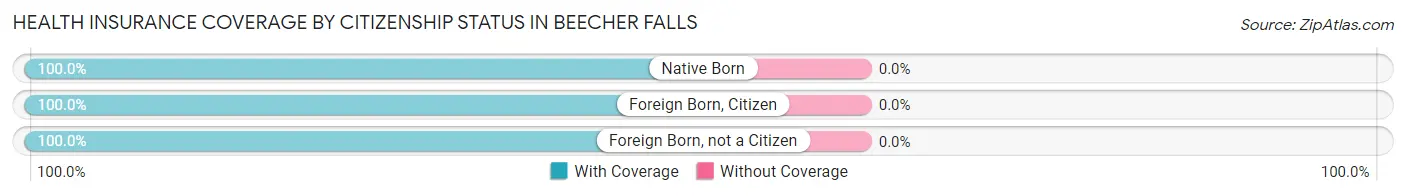
| Citizenship Status | With Coverage | Without Coverage |
| Native Born | 5 (100.0%) | 0 (0.0%) |
| Foreign Born, Citizen | 7 (100.0%) | 0 (0.0%) |
| Foreign Born, not a Citizen | 2 (100.0%) | 0 (0.0%) |
Health Insurance Coverage by Household Income in Beecher Falls
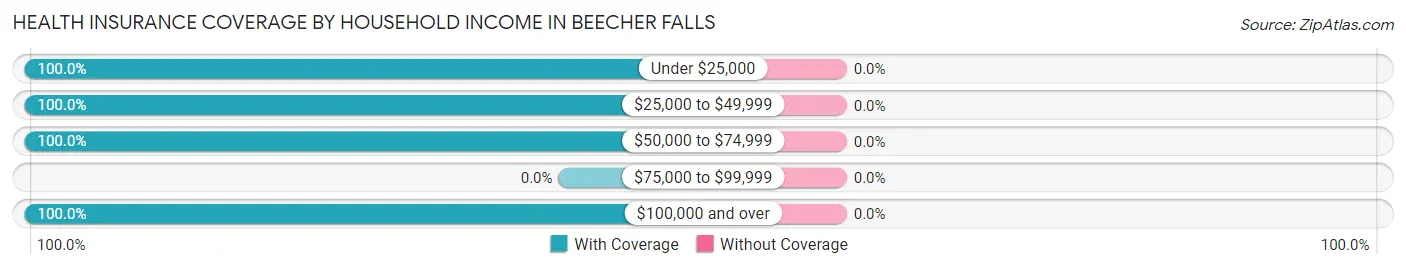
| Household Income | With Coverage | Without Coverage |
| Under $25,000 | 42 (100.0%) | 0 (0.0%) |
| $25,000 to $49,999 | 22 (100.0%) | 0 (0.0%) |
| $50,000 to $74,999 | 15 (100.0%) | 0 (0.0%) |
| $75,000 to $99,999 | 0 (0.0%) | 0 (0.0%) |
| $100,000 and over | 22 (100.0%) | 0 (0.0%) |
Public vs Private Health Insurance Coverage by Age in Beecher Falls
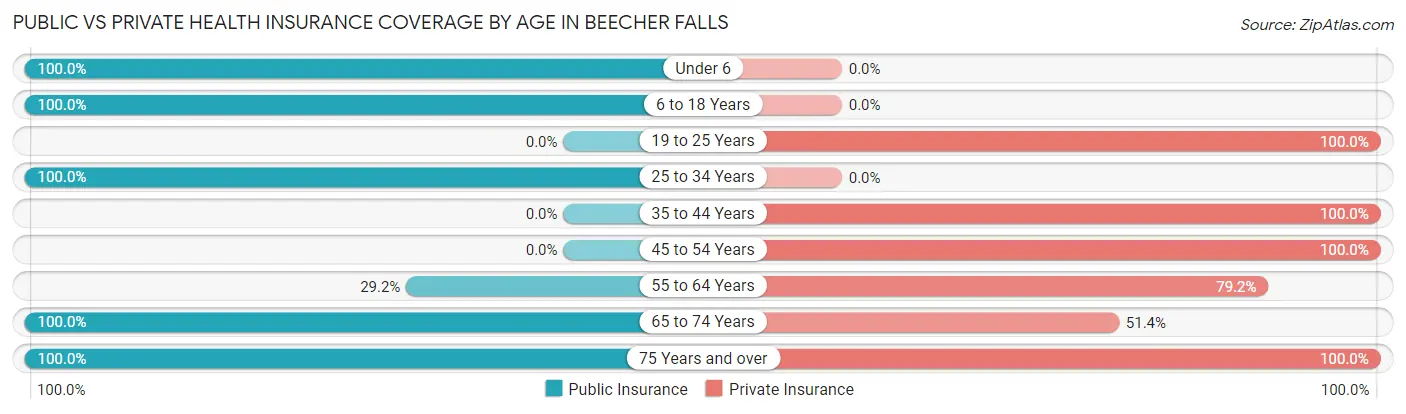
| Age Bracket | Public Insurance | Private Insurance |
| Under 6 | 5 (100.0%) | 0 (0.0%) |
| 6 to 18 Years | 7 (100.0%) | 0 (0.0%) |
| 19 to 25 Years | 0 (0.0%) | 2 (100.0%) |
| 25 to 34 Years | 11 (100.0%) | 0 (0.0%) |
| 35 to 44 Years | 0 (0.0%) | 4 (100.0%) |
| 45 to 54 Years | 0 (0.0%) | 5 (100.0%) |
| 55 to 64 Years | 7 (29.2%) | 19 (79.2%) |
| 65 to 74 Years | 35 (100.0%) | 18 (51.4%) |
| 75 Years and over | 8 (100.0%) | 8 (100.0%) |
| Total | 73 (72.3%) | 56 (55.4%) |
Disability Status by Sex by Age in Beecher Falls
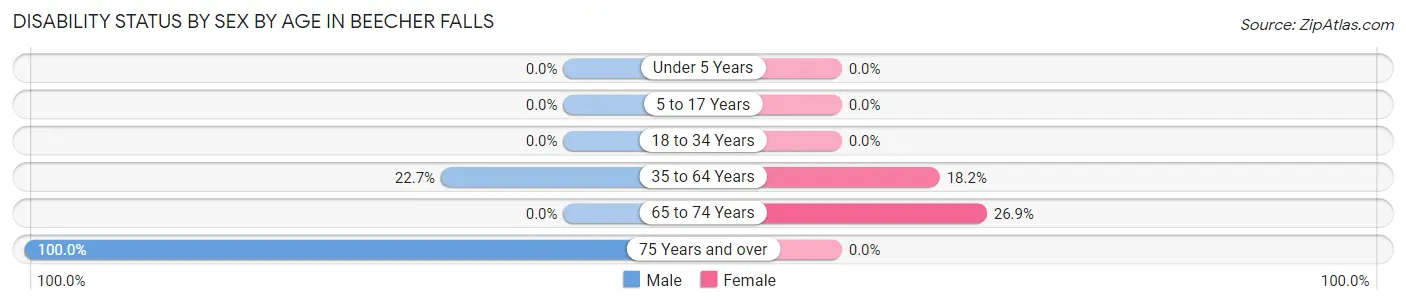
| Age Bracket | Male | Female |
| Under 5 Years | 0 (0.0%) | 0 (0.0%) |
| 5 to 17 Years | 0 (0.0%) | 0 (0.0%) |
| 18 to 34 Years | 0 (0.0%) | 0 (0.0%) |
| 35 to 64 Years | 5 (22.7%) | 2 (18.2%) |
| 65 to 74 Years | 0 (0.0%) | 7 (26.9%) |
| 75 Years and over | 8 (100.0%) | 0 (0.0%) |
Disability Class by Sex by Age in Beecher Falls
Disability Class: Hearing Difficulty
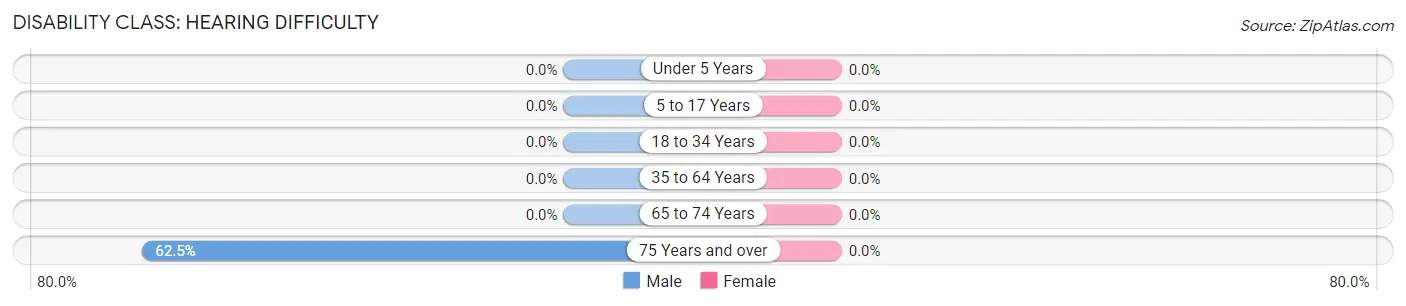
| Age Bracket | Male | Female |
| Under 5 Years | 0 (0.0%) | 0 (0.0%) |
| 5 to 17 Years | 0 (0.0%) | 0 (0.0%) |
| 18 to 34 Years | 0 (0.0%) | 0 (0.0%) |
| 35 to 64 Years | 0 (0.0%) | 0 (0.0%) |
| 65 to 74 Years | 0 (0.0%) | 0 (0.0%) |
| 75 Years and over | 5 (62.5%) | 0 (0.0%) |
Disability Class: Vision Difficulty
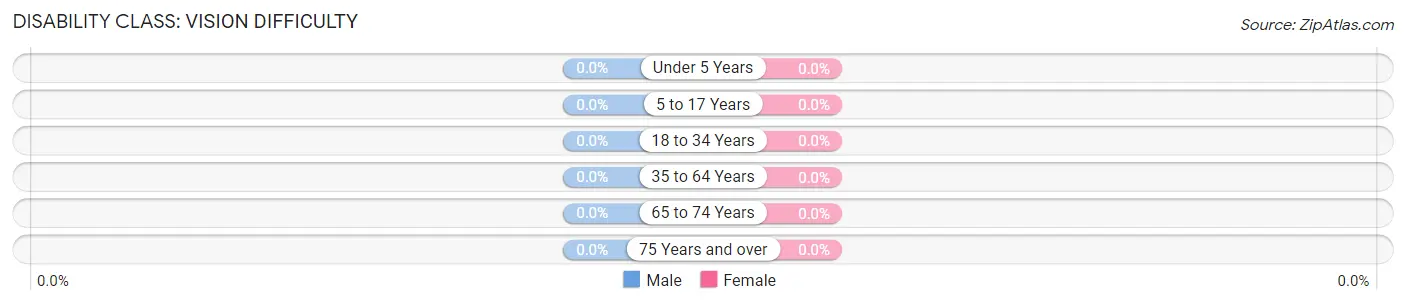
| Age Bracket | Male | Female |
| Under 5 Years | 0 (0.0%) | 0 (0.0%) |
| 5 to 17 Years | 0 (0.0%) | 0 (0.0%) |
| 18 to 34 Years | 0 (0.0%) | 0 (0.0%) |
| 35 to 64 Years | 0 (0.0%) | 0 (0.0%) |
| 65 to 74 Years | 0 (0.0%) | 0 (0.0%) |
| 75 Years and over | 0 (0.0%) | 0 (0.0%) |
Disability Class: Cognitive Difficulty
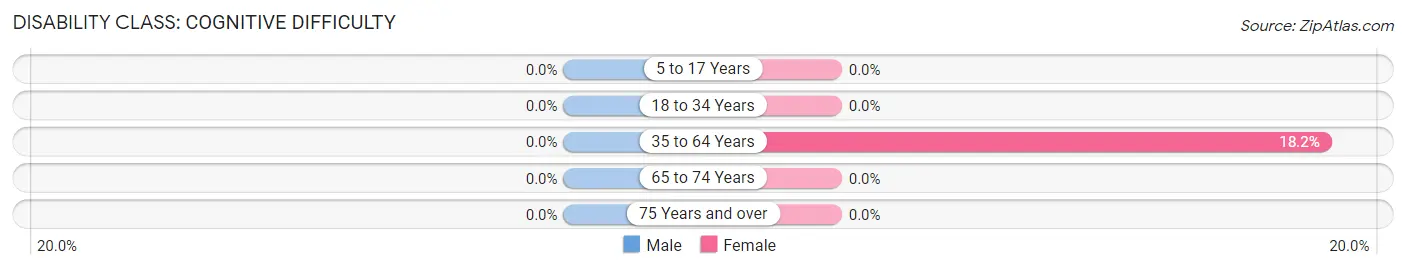
| Age Bracket | Male | Female |
| 5 to 17 Years | 0 (0.0%) | 0 (0.0%) |
| 18 to 34 Years | 0 (0.0%) | 0 (0.0%) |
| 35 to 64 Years | 0 (0.0%) | 2 (18.2%) |
| 65 to 74 Years | 0 (0.0%) | 0 (0.0%) |
| 75 Years and over | 0 (0.0%) | 0 (0.0%) |
Disability Class: Ambulatory Difficulty
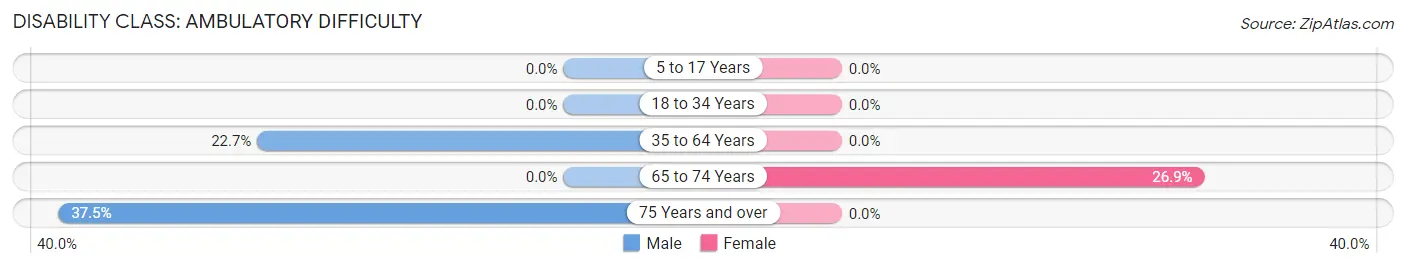
| Age Bracket | Male | Female |
| 5 to 17 Years | 0 (0.0%) | 0 (0.0%) |
| 18 to 34 Years | 0 (0.0%) | 0 (0.0%) |
| 35 to 64 Years | 5 (22.7%) | 0 (0.0%) |
| 65 to 74 Years | 0 (0.0%) | 7 (26.9%) |
| 75 Years and over | 3 (37.5%) | 0 (0.0%) |
Disability Class: Self-Care Difficulty
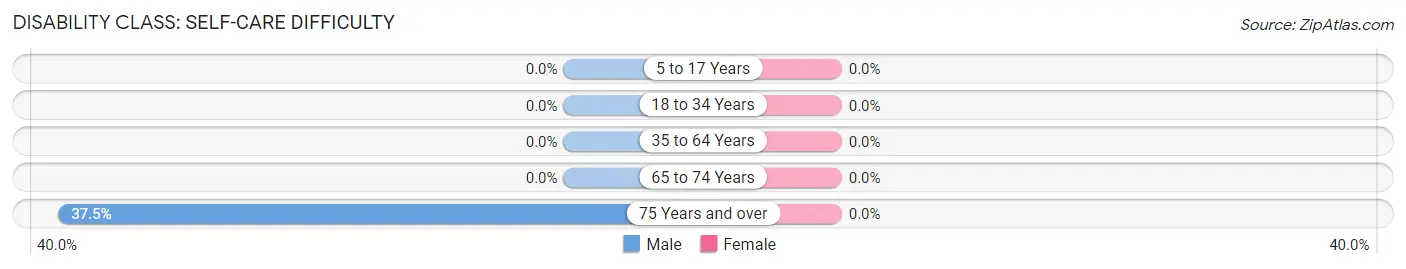
| Age Bracket | Male | Female |
| 5 to 17 Years | 0 (0.0%) | 0 (0.0%) |
| 18 to 34 Years | 0 (0.0%) | 0 (0.0%) |
| 35 to 64 Years | 0 (0.0%) | 0 (0.0%) |
| 65 to 74 Years | 0 (0.0%) | 0 (0.0%) |
| 75 Years and over | 3 (37.5%) | 0 (0.0%) |
Technology Access in Beecher Falls
Computing Device Access in Beecher Falls
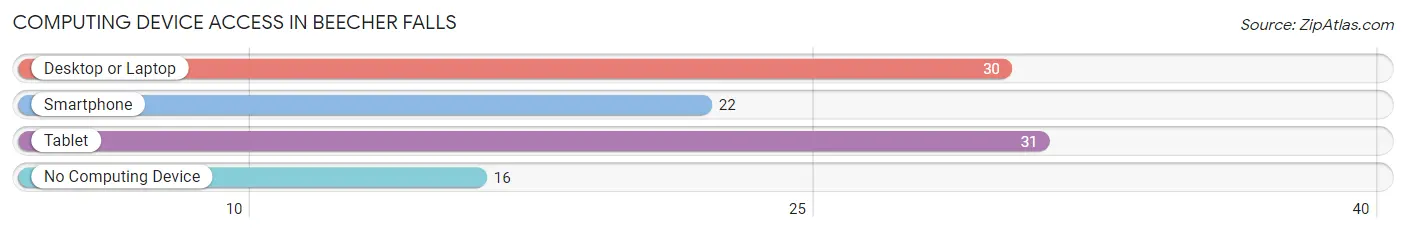
| Device Type | # Households | % Households |
| Desktop or Laptop | 30 | 54.5% |
| Smartphone | 22 | 40.0% |
| Tablet | 31 | 56.4% |
| No Computing Device | 16 | 29.1% |
| Total | 55 | 100.0% |
Internet Access in Beecher Falls
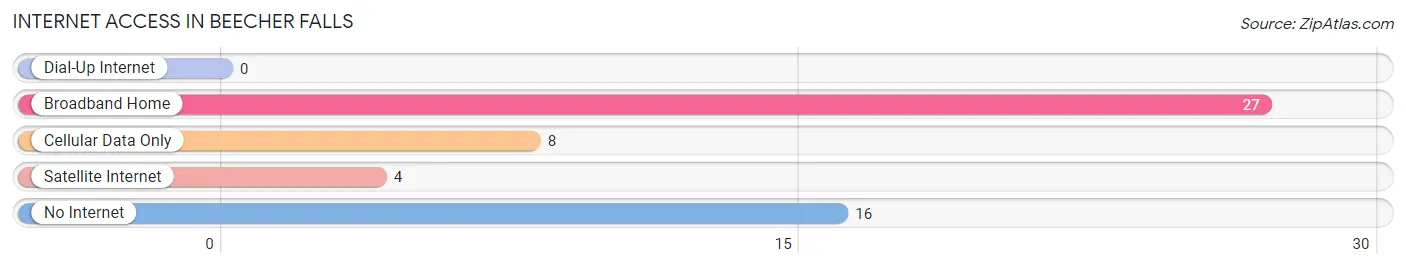
| Internet Type | # Households | % Households |
| Dial-Up Internet | 0 | 0.0% |
| Broadband Home | 27 | 49.1% |
| Cellular Data Only | 8 | 14.5% |
| Satellite Internet | 4 | 7.3% |
| No Internet | 16 | 29.1% |
| Total | 55 | 100.0% |
Beecher Falls Summary
Beecher Falls is a small town located in the northeastern corner of Vermont, near the Canadian border. It is situated in the Connecticut River Valley, and is part of the larger Essex County. The town has a population of just over 500 people, and is known for its rural charm and scenic beauty.
History
Beecher Falls was first settled in 1790 by a group of settlers from Massachusetts. The town was named after the Beecher family, who were among the first settlers. The town was originally part of the town of Canaan, but was incorporated as its own town in 1820.
In the 19th century, Beecher Falls was an important stop on the stagecoach route between Montreal and Boston. The town was also a major stop on the railroad line between Montreal and Boston, and was the site of a major train station.
Geography
Beecher Falls is located in the Connecticut River Valley, near the Canadian border. The town is situated on the banks of the Connecticut River, and is surrounded by rolling hills and forests. The town is located in the northern part of Vermont, and is about an hour’s drive from the state capital of Montpelier.
The town is located in a rural area, and is known for its scenic beauty. The town is home to several small lakes, including Lake Francis, which is a popular spot for fishing and swimming. The town is also home to several small streams, which are popular for canoeing and kayaking.
Economy
Beecher Falls is a small, rural town, and the economy is largely based on agriculture and tourism. The town is home to several small farms, which produce a variety of crops, including corn, hay, and vegetables. The town is also home to several small businesses, including a general store, a gas station, and a few restaurants.
The town is also a popular tourist destination, and is home to several attractions, including the Beecher Falls Historical Society Museum, the Beecher Falls Covered Bridge, and the Beecher Falls Railroad Station. The town is also home to several outdoor recreation areas, including the Beecher Falls State Park, which offers camping, hiking, and fishing.
Demographics
As of the 2010 census, Beecher Falls had a population of 517 people. The town is predominantly white, with 95.3% of the population identifying as white. The town also has a small Hispanic population, with 2.3% of the population identifying as Hispanic or Latino. The median household income in Beecher Falls is $41,250, and the median home value is $133,400. The town has a low unemployment rate, with only 3.2% of the population unemployed.
Common Questions
What is Per Capita Income in Beecher Falls?
Per Capita income in Beecher Falls is $23,713.
What is the Median Family Income in Beecher Falls?
Median Family Income in Beecher Falls is $40,417.
What is the Median Household income in Beecher Falls?
Median Household Income in Beecher Falls is $30,469.
What is Income or Wage Gap in Beecher Falls?
Income or Wage Gap in Beecher Falls is 52.7%.
Women in Beecher Falls earn 47.3 cents for every dollar earned by a man.
What is Inequality or Gini Index in Beecher Falls?
Inequality or Gini Index in Beecher Falls is 0.38.
What is the Total Population of Beecher Falls?
Total Population of Beecher Falls is 101.
What is the Total Male Population of Beecher Falls?
Total Male Population of Beecher Falls is 50.
What is the Total Female Population of Beecher Falls?
Total Female Population of Beecher Falls is 51.
What is the Ratio of Males per 100 Females in Beecher Falls?
There are 98.04 Males per 100 Females in Beecher Falls.
What is the Ratio of Females per 100 Males in Beecher Falls?
There are 102.00 Females per 100 Males in Beecher Falls.
What is the Median Population Age in Beecher Falls?
Median Population Age in Beecher Falls is 58.0 Years.
What is the Average Family Size in Beecher Falls
Average Family Size in Beecher Falls is 2.1 People.
What is the Average Household Size in Beecher Falls
Average Household Size in Beecher Falls is 1.8 People.
How Large is the Labor Force in Beecher Falls?
There are 46 People in the Labor Forcein in Beecher Falls.
What is the Percentage of People in the Labor Force in Beecher Falls?
51.7% of People are in the Labor Force in Beecher Falls.
What is the Unemployment Rate in Beecher Falls?
Unemployment Rate in Beecher Falls is 15.2%.