Zip Codes with the Highest Percentage of Population Employed in Manufacturing in Lynchburg, VA
RELATED REPORTS & OPTIONS
Manufacturing
Lynchburg
Compare Zip Codes
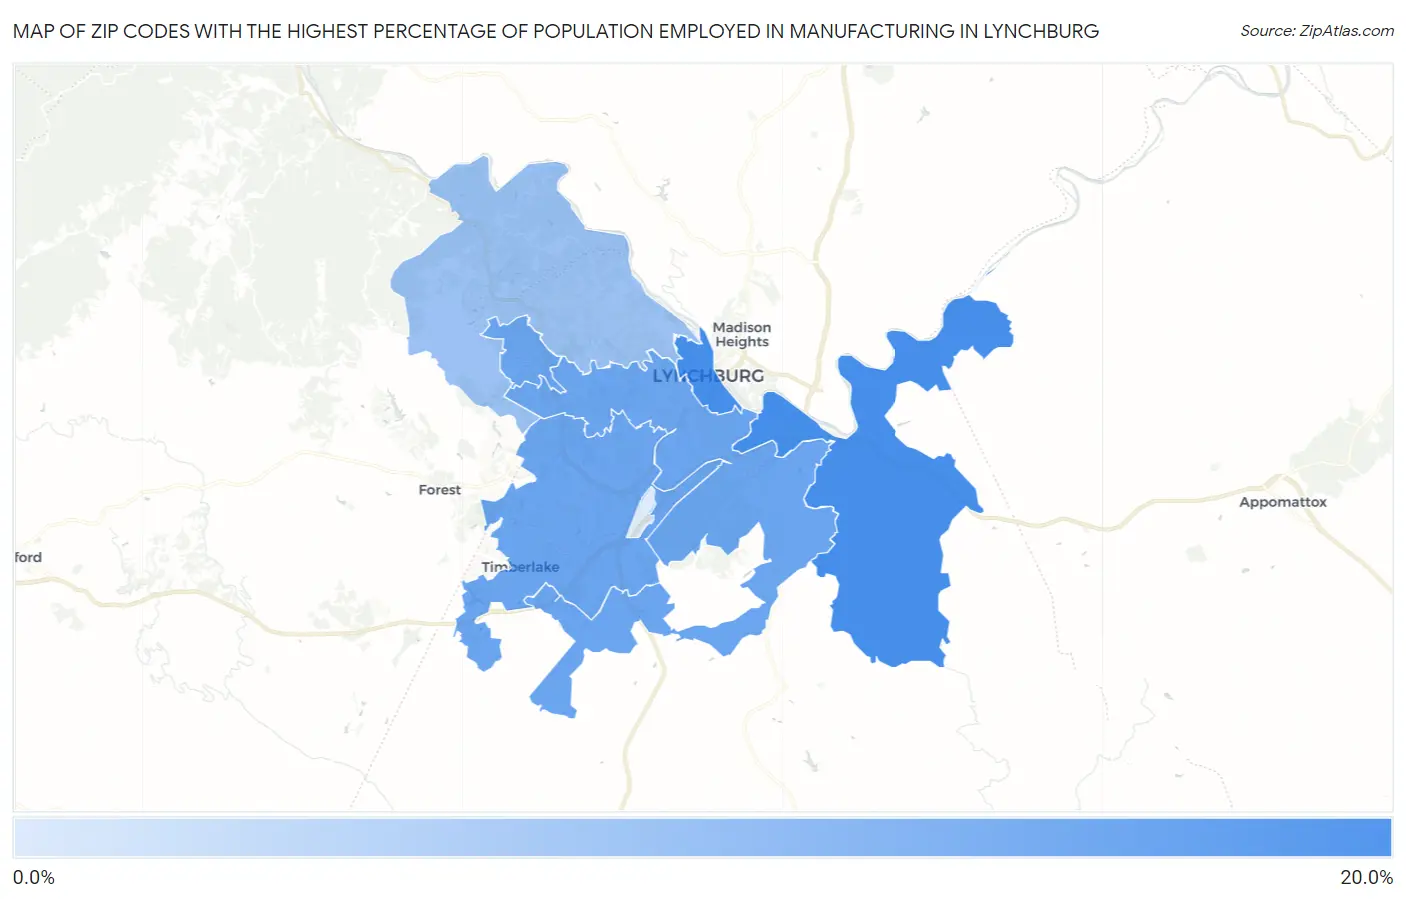
Map of Zip Codes with the Highest Percentage of Population Employed in Manufacturing in Lynchburg
0.0%
20.0%
Zip Codes with the Highest Percentage of Population Employed in Manufacturing in Lynchburg, VA
| Zip Code | % Employed | vs State | vs National | |
| 1. | 24504 | 16.0% | 7.1%(+8.94)#156 | 10.0%(+6.02)#8,007 |
| 2. | 24501 | 12.1% | 7.1%(+5.02)#277 | 10.0%(+2.10)#12,596 |
| 3. | 24502 | 12.0% | 7.1%(+4.88)#281 | 10.0%(+1.96)#12,787 |
| 4. | 24503 | 7.3% | 7.1%(+0.259)#456 | 10.0%(-2.66)#20,376 |
| 5. | 24515 | 0.68% | 7.1%(-6.38)#766 | 10.0%(-9.31)#29,346 |
1
Common Questions
What are the Top 3 Zip Codes with the Highest Percentage of Population Employed in Manufacturing in Lynchburg, VA?
Top 3 Zip Codes with the Highest Percentage of Population Employed in Manufacturing in Lynchburg, VA are:
What zip code has the Highest Percentage of Population Employed in Manufacturing in Lynchburg, VA?
24504 has the Highest Percentage of Population Employed in Manufacturing in Lynchburg, VA with 16.0%.
What is the Percentage of Population Employed in Manufacturing in Lynchburg, VA?
Percentage of Population Employed in Manufacturing in Lynchburg is 9.7%.
What is the Percentage of Population Employed in Manufacturing in Virginia?
Percentage of Population Employed in Manufacturing in Virginia is 7.1%.
What is the Percentage of Population Employed in Manufacturing in the United States?
Percentage of Population Employed in Manufacturing in the United States is 10.0%.