Zip Codes with the Highest Percentage of Owner-Occupied Units in Abingdon, VA
RELATED REPORTS & OPTIONS
Highest Owner-Occupied
Abingdon
Compare Zip Codes
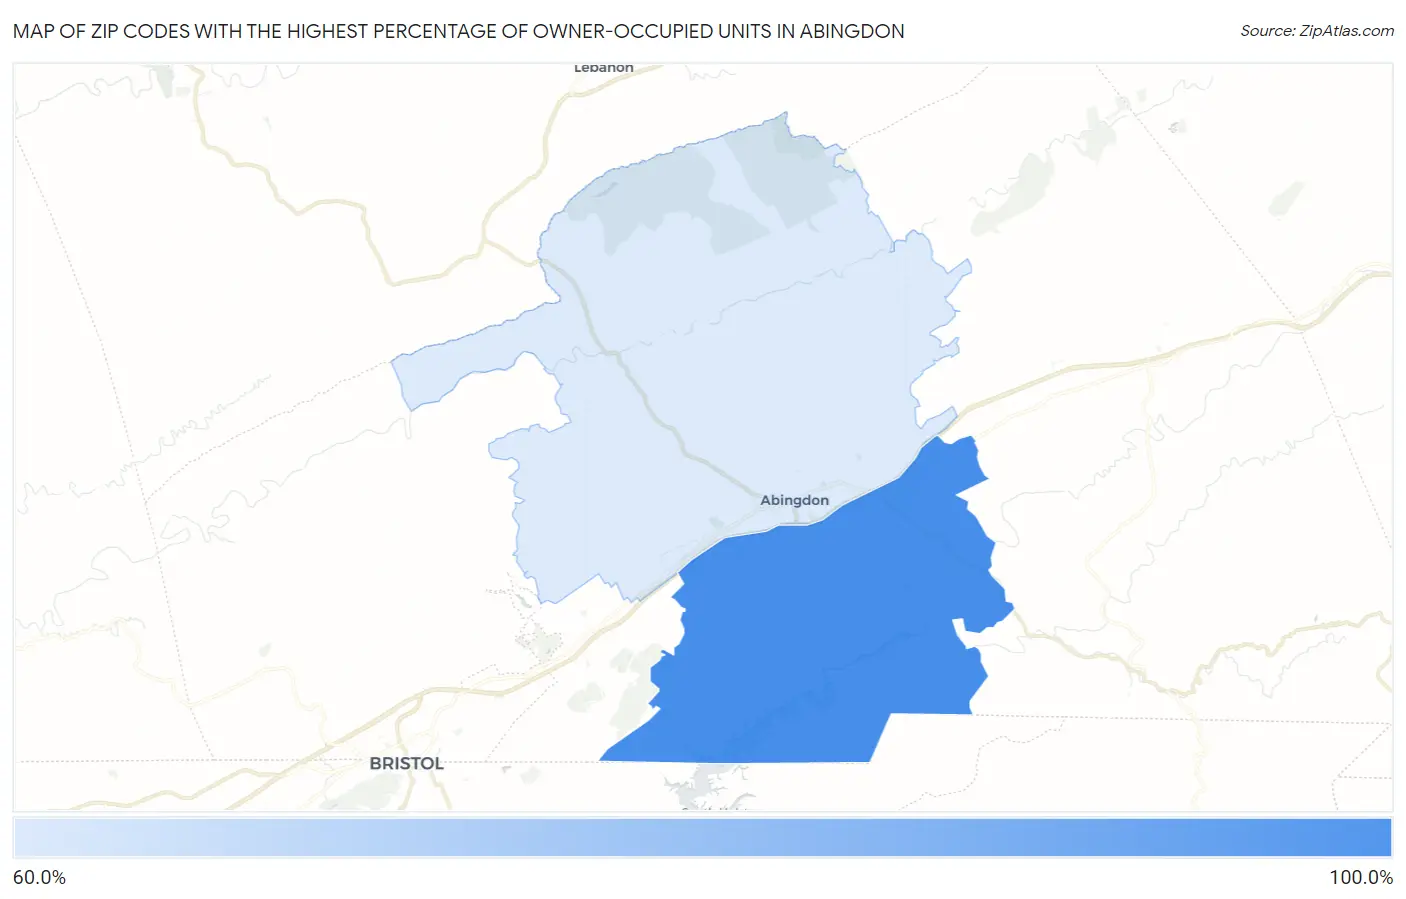
Map of Zip Codes with the Highest Percentage of Owner-Occupied Units in Abingdon
0.0%
100.0%
Zip Codes with the Highest Percentage of Owner-Occupied Units in Abingdon, VA
| Zip Code | % Owner-Occupied | vs State | vs National | |
| 1. | 24211 | 84.8% | 66.9%(+17.9)#293 | 64.8%(+20.0)#9,910 |
| 2. | 24210 | 66.7% | 66.9%(-0.181)#645 | 64.8%(+1.85)#24,656 |
1
Common Questions
What are the Top Zip Codes with the Highest Percentage of Owner-Occupied Units in Abingdon, VA?
Top Zip Codes with the Highest Percentage of Owner-Occupied Units in Abingdon, VA are:
What zip code has the Highest Percentage of Owner-Occupied Units in Abingdon, VA?
24211 has the Highest Percentage of Owner-Occupied Units in Abingdon, VA with 84.8%.
What is the Percentage of Owner-Occupied Units in Abingdon, VA?
Percentage of Owner-Occupied Units in Abingdon is 54.6%.
What is the Percentage of Owner-Occupied Units in Virginia?
Percentage of Owner-Occupied Units in Virginia is 66.9%.
What is the Percentage of Owner-Occupied Units in the United States?
Percentage of Owner-Occupied Units in the United States is 64.8%.