Zip Codes with the Highest Percentage of Population Employed in Farming, Fishing & Forestry in Abingdon, VA
RELATED REPORTS & OPTIONS
Farming, Fishing & Forestry
Abingdon
Compare Zip Codes
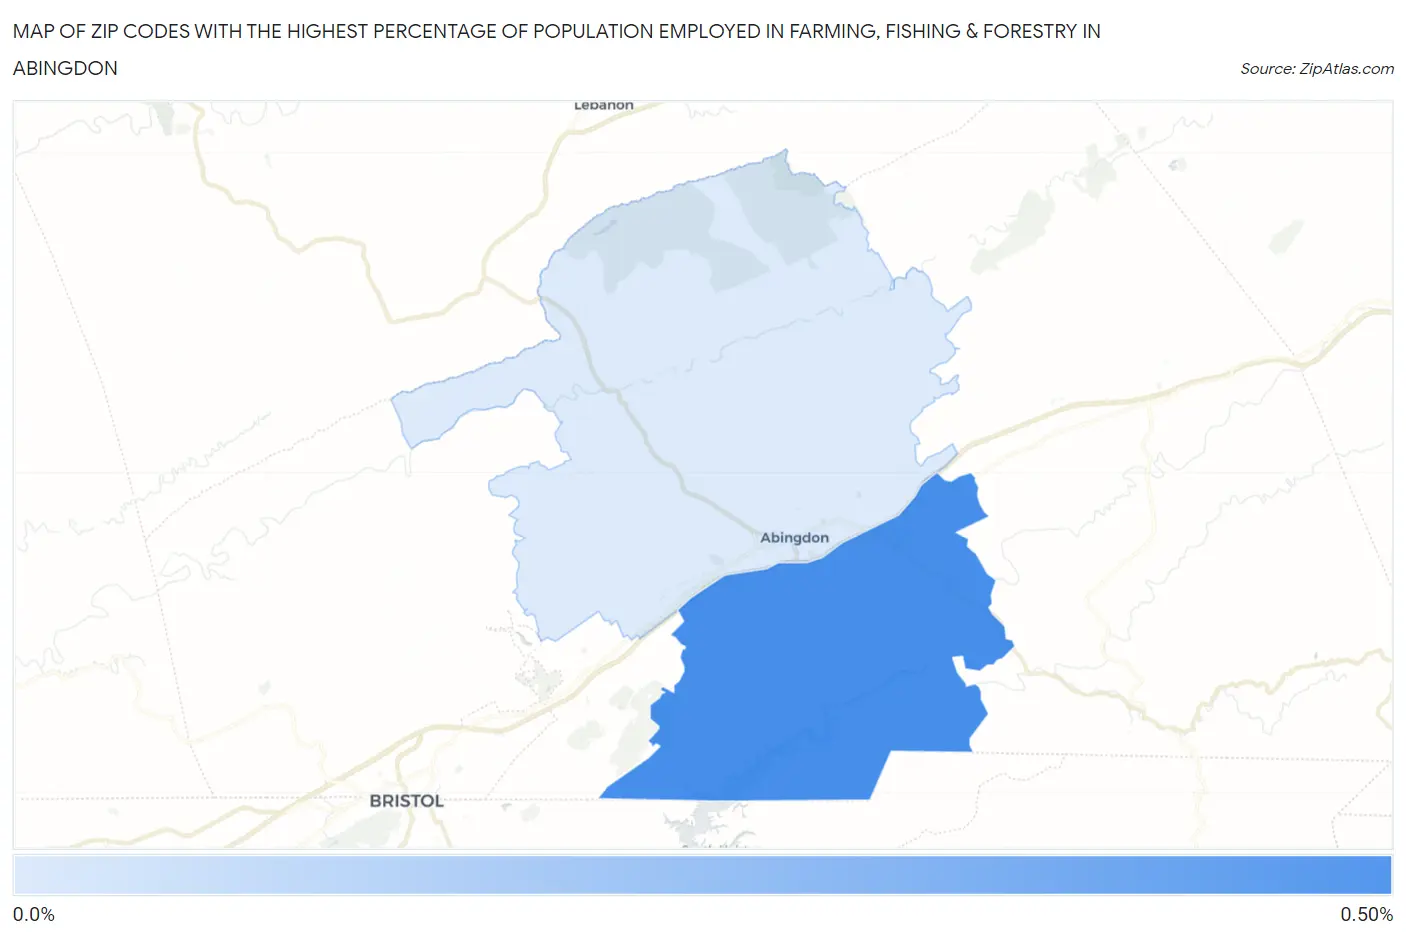
Map of Zip Codes with the Highest Percentage of Population Employed in Farming, Fishing & Forestry in Abingdon
0.086%
0.48%
Zip Codes with the Highest Percentage of Population Employed in Farming, Fishing & Forestry in Abingdon, VA
| Zip Code | % Employed | vs State | vs National | |
| 1. | 24211 | 0.48% | 0.33%(+0.147)#255 | 0.61%(-0.130)#13,062 |
| 2. | 24210 | 0.086% | 0.33%(-0.243)#366 | 0.61%(-0.520)#18,006 |
1
Common Questions
What are the Top Zip Codes with the Highest Percentage of Population Employed in Farming, Fishing & Forestry in Abingdon, VA?
Top Zip Codes with the Highest Percentage of Population Employed in Farming, Fishing & Forestry in Abingdon, VA are:
What zip code has the Highest Percentage of Population Employed in Farming, Fishing & Forestry in Abingdon, VA?
24211 has the Highest Percentage of Population Employed in Farming, Fishing & Forestry in Abingdon, VA with 0.48%.
What is the Percentage of Population Employed in Farming, Fishing & Forestry in Virginia?
Percentage of Population Employed in Farming, Fishing & Forestry in Virginia is 0.33%.
What is the Percentage of Population Employed in Farming, Fishing & Forestry in the United States?
Percentage of Population Employed in Farming, Fishing & Forestry in the United States is 0.61%.