Zip Codes with the Highest Percentage of Black / African American Population in Abingdon, VA
RELATED REPORTS & OPTIONS
Black / African American
Abingdon
Compare Zip Codes
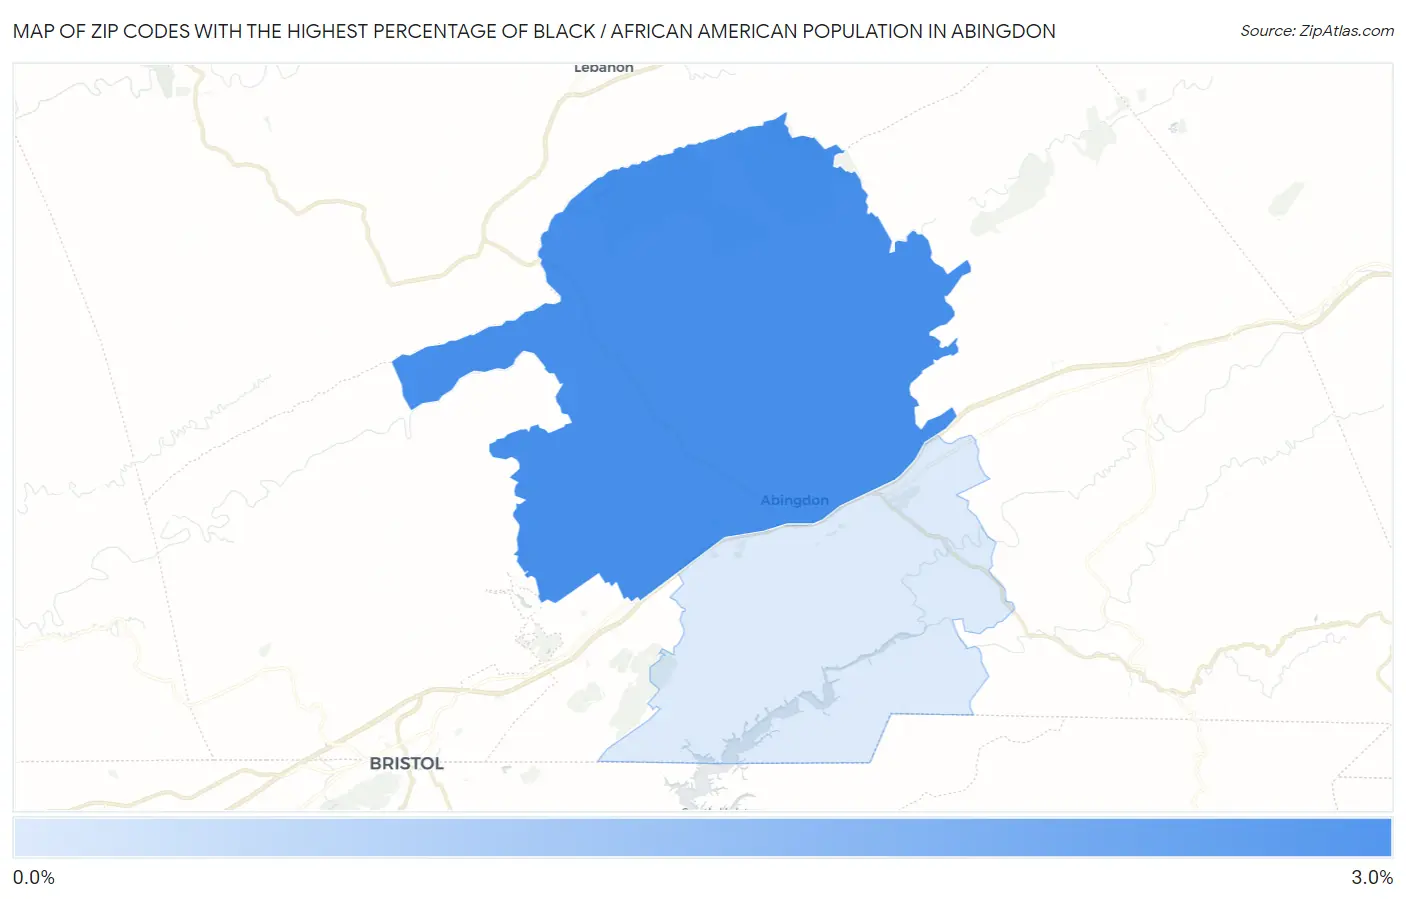
Map of Zip Codes with the Highest Percentage of Black / African American Population in Abingdon
0.56%
2.6%
Zip Codes with the Highest Percentage of Black / African American Population in Abingdon, VA
| Zip Code | Black / African American | vs State | vs National | |
| 1. | 24210 | 2.6% | 18.9%(-16.3)#624 | 12.5%(-9.85)#12,425 |
| 2. | 24211 | 0.56% | 18.9%(-18.3)#701 | 12.5%(-11.9)#18,741 |
1
Common Questions
What are the Top Zip Codes with the Highest Percentage of Black / African American Population in Abingdon, VA?
Top Zip Codes with the Highest Percentage of Black / African American Population in Abingdon, VA are:
What zip code has the Highest Percentage of Black / African American Population in Abingdon, VA?
24210 has the Highest Percentage of Black / African American Population in Abingdon, VA with 2.6%.
What is the Percentage of Black / African American Population in Abingdon, VA?
Percentage of Black / African American Population in Abingdon is 3.1%.
What is the Percentage of Black / African American Population in Virginia?
Percentage of Black / African American Population in Virginia is 18.9%.
What is the Percentage of Black / African American Population in the United States?
Percentage of Black / African American Population in the United States is 12.5%.