Zip Codes with the Highest Percentage of Population Employed in Office & Administration in West Jordan, UT
RELATED REPORTS & OPTIONS
Office & Administration
West Jordan
Compare Zip Codes
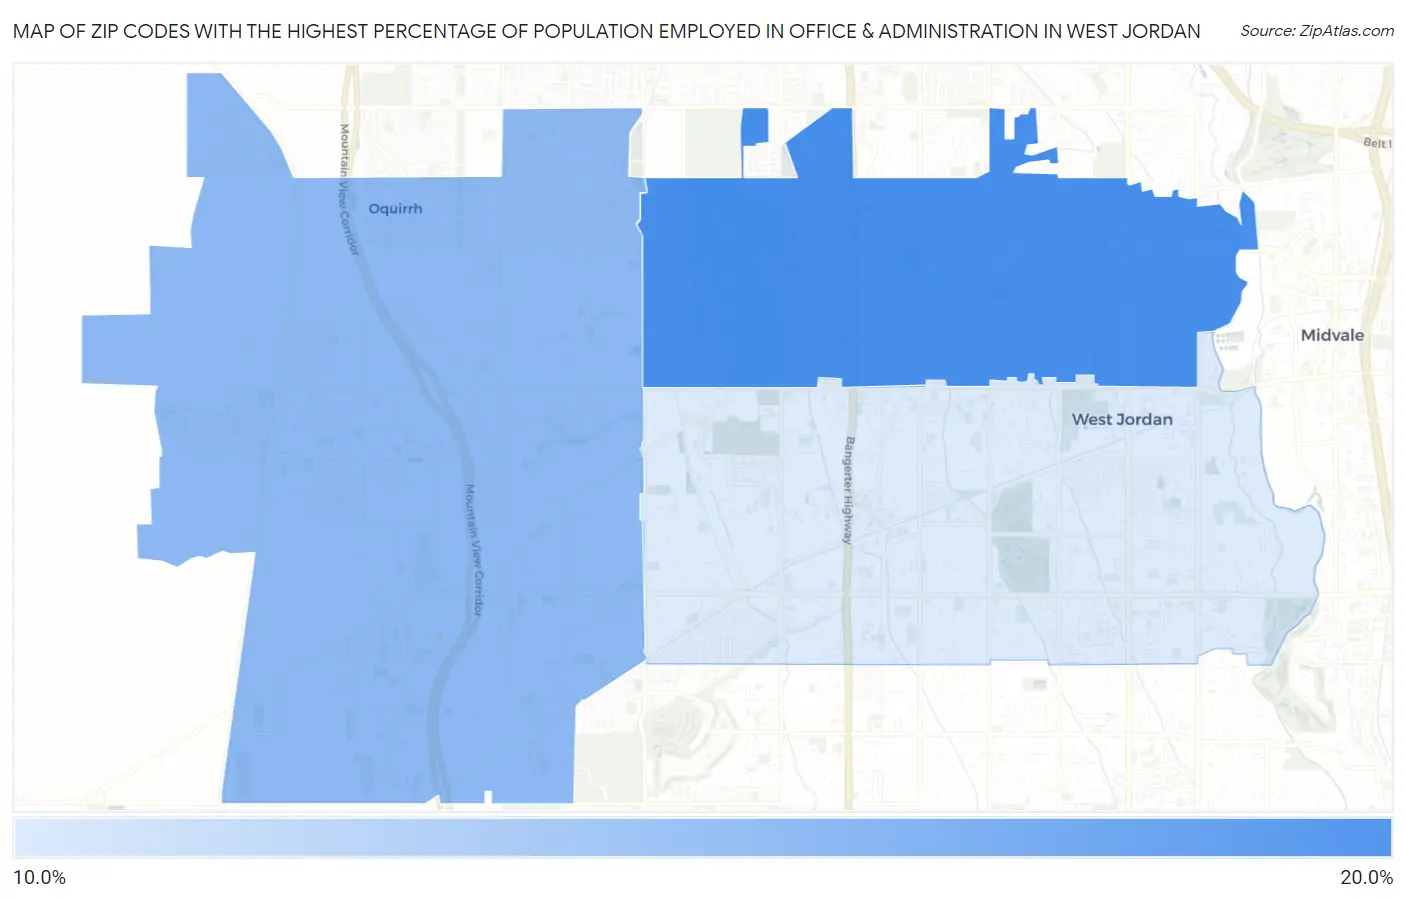
Map of Zip Codes with the Highest Percentage of Population Employed in Office & Administration in West Jordan
14.2%
16.1%
Zip Codes with the Highest Percentage of Population Employed in Office & Administration in West Jordan, UT
| Zip Code | % Employed | vs State | vs National | |
| 1. | 84084 | 16.1% | 12.7%(+3.46)#42 | 10.9%(+5.28)#3,459 |
| 2. | 84081 | 15.2% | 12.7%(+2.53)#60 | 10.9%(+4.36)#4,299 |
| 3. | 84088 | 14.2% | 12.7%(+1.50)#73 | 10.9%(+3.32)#5,739 |
1
Common Questions
What are the Top Zip Codes with the Highest Percentage of Population Employed in Office & Administration in West Jordan, UT?
Top Zip Codes with the Highest Percentage of Population Employed in Office & Administration in West Jordan, UT are:
What zip code has the Highest Percentage of Population Employed in Office & Administration in West Jordan, UT?
84084 has the Highest Percentage of Population Employed in Office & Administration in West Jordan, UT with 16.1%.
What is the Percentage of Population Employed in Office & Administration in West Jordan, UT?
Percentage of Population Employed in Office & Administration in West Jordan is 15.0%.
What is the Percentage of Population Employed in Office & Administration in Utah?
Percentage of Population Employed in Office & Administration in Utah is 12.7%.
What is the Percentage of Population Employed in Office & Administration in the United States?
Percentage of Population Employed in Office & Administration in the United States is 10.9%.