Zip Codes with the Highest Percentage of Population Employed in Food Preparation & Serving in West Jordan, UT
RELATED REPORTS & OPTIONS
Food Preparation & Serving
West Jordan
Compare Zip Codes
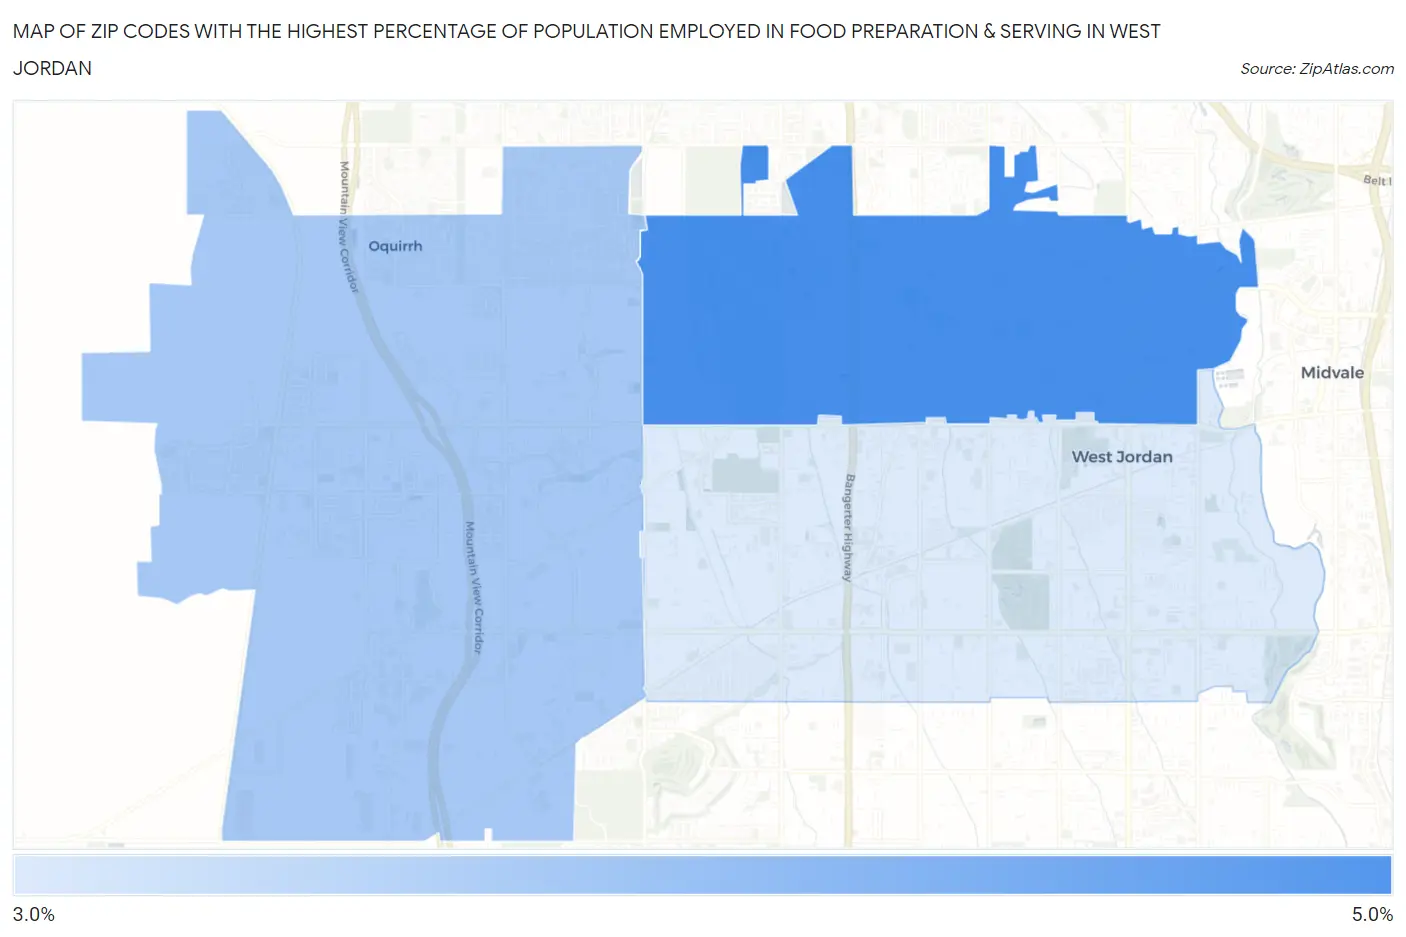
Map of Zip Codes with the Highest Percentage of Population Employed in Food Preparation & Serving in West Jordan
3.7%
4.0%
Zip Codes with the Highest Percentage of Population Employed in Food Preparation & Serving in West Jordan, UT
| Zip Code | % Employed | vs State | vs National | |
| 1. | 84084 | 4.0% | 4.5%(-0.525)#125 | 5.3%(-1.27)#17,082 |
| 2. | 84081 | 3.8% | 4.5%(-0.720)#137 | 5.3%(-1.47)#17,868 |
| 3. | 84088 | 3.7% | 4.5%(-0.835)#140 | 5.3%(-1.58)#18,345 |
1
Common Questions
What are the Top Zip Codes with the Highest Percentage of Population Employed in Food Preparation & Serving in West Jordan, UT?
Top Zip Codes with the Highest Percentage of Population Employed in Food Preparation & Serving in West Jordan, UT are:
What zip code has the Highest Percentage of Population Employed in Food Preparation & Serving in West Jordan, UT?
84084 has the Highest Percentage of Population Employed in Food Preparation & Serving in West Jordan, UT with 4.0%.
What is the Percentage of Population Employed in Food Preparation & Serving in West Jordan, UT?
Percentage of Population Employed in Food Preparation & Serving in West Jordan is 3.8%.
What is the Percentage of Population Employed in Food Preparation & Serving in Utah?
Percentage of Population Employed in Food Preparation & Serving in Utah is 4.5%.
What is the Percentage of Population Employed in Food Preparation & Serving in the United States?
Percentage of Population Employed in Food Preparation & Serving in the United States is 5.3%.