Zip Codes with the Highest Percentage of Black / African American Population in Weatherford, TX
RELATED REPORTS & OPTIONS
Black / African American
Weatherford
Compare Zip Codes
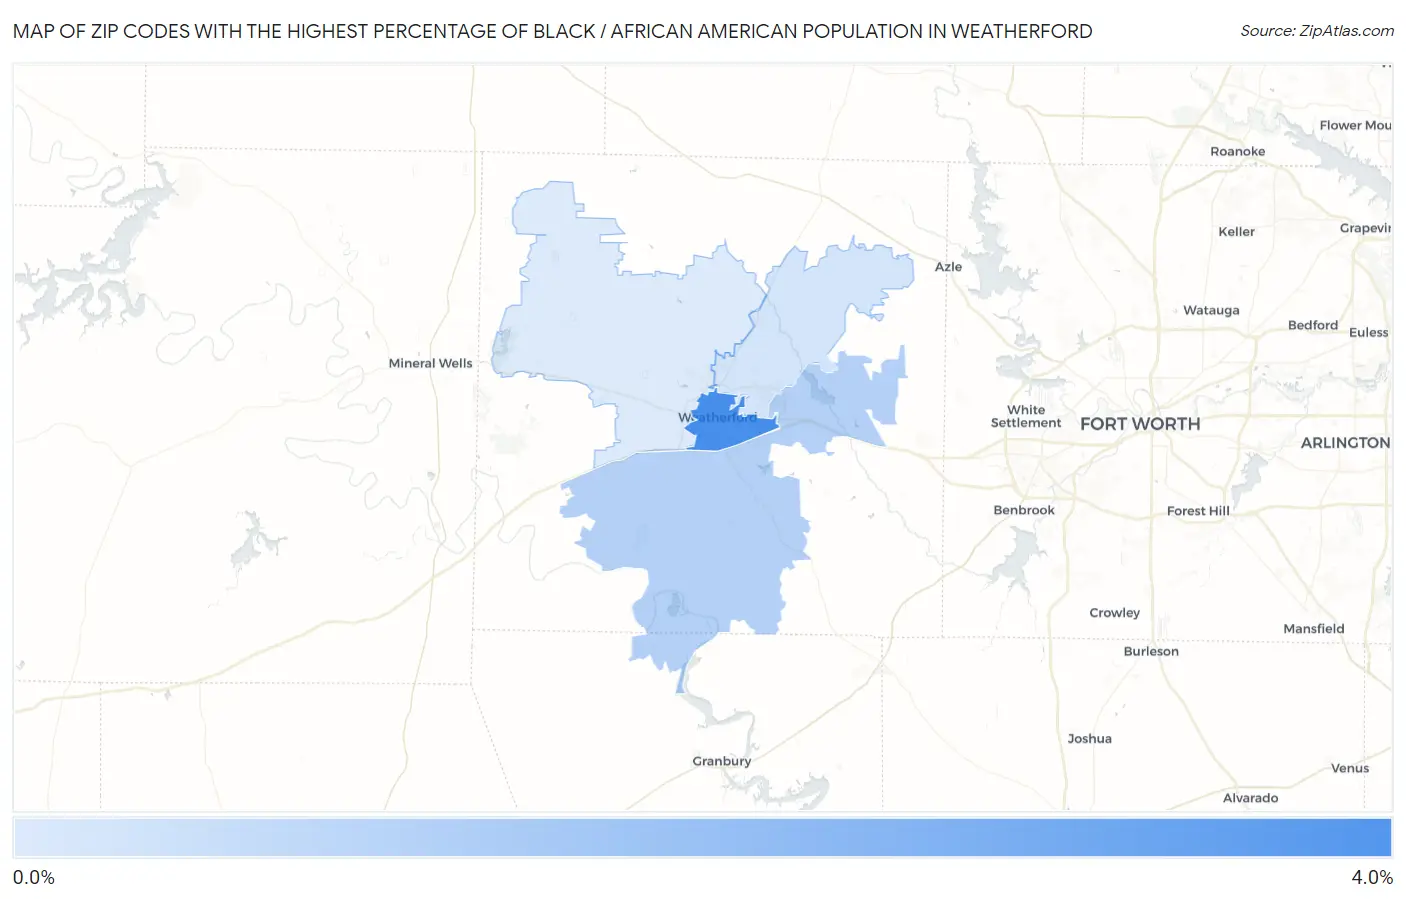
Map of Zip Codes with the Highest Percentage of Black / African American Population in Weatherford
0.0%
4.0%
Zip Codes with the Highest Percentage of Black / African American Population in Weatherford, TX
| Zip Code | Black / African American | vs State | vs National | |
| 1. | 76086 | 4.0% | 12.1%(-8.18)#931 | 12.5%(-8.50)#10,526 |
| 2. | 76087 | 1.1% | 12.1%(-11.0)#1,290 | 12.5%(-11.4)#16,058 |
| 3. | 76085 | 0.27% | 12.1%(-11.9)#1,454 | 12.5%(-12.2)#20,672 |
| 4. | 76088 | 0.041% | 12.1%(-12.1)#1,512 | 12.5%(-12.4)#22,433 |
1
Common Questions
What are the Top 3 Zip Codes with the Highest Percentage of Black / African American Population in Weatherford, TX?
Top 3 Zip Codes with the Highest Percentage of Black / African American Population in Weatherford, TX are:
What zip code has the Highest Percentage of Black / African American Population in Weatherford, TX?
76086 has the Highest Percentage of Black / African American Population in Weatherford, TX with 4.0%.
What is the Percentage of Black / African American Population in Weatherford, TX?
Percentage of Black / African American Population in Weatherford is 2.8%.
What is the Percentage of Black / African American Population in Texas?
Percentage of Black / African American Population in Texas is 12.1%.
What is the Percentage of Black / African American Population in the United States?
Percentage of Black / African American Population in the United States is 12.5%.