Zip Codes with the Highest Percentage of Population Employed in Agriculture, Fishing & Hunting in Odessa, TX
RELATED REPORTS & OPTIONS
Agriculture, Fishing & Hunting
Odessa
Compare Zip Codes
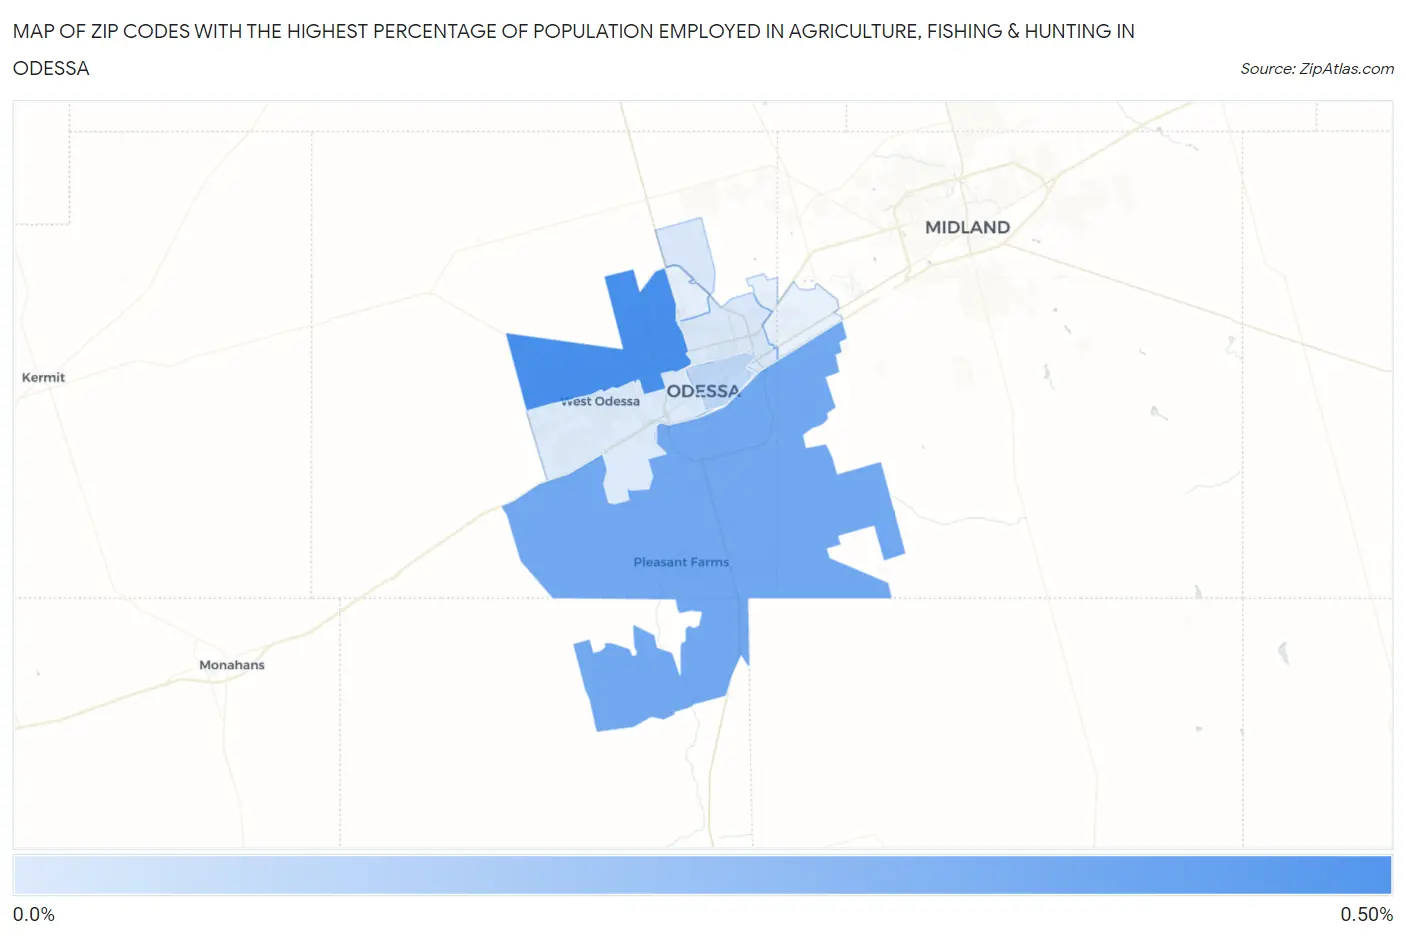
Map of Zip Codes with the Highest Percentage of Population Employed in Agriculture, Fishing & Hunting in Odessa
0.0%
0.50%
Zip Codes with the Highest Percentage of Population Employed in Agriculture, Fishing & Hunting in Odessa, TX
| Zip Code | % Employed | vs State | vs National | |
| 1. | 79764 | 0.43% | 0.75%(-0.317)#1,073 | 1.2%(-0.765)#19,847 |
| 2. | 79766 | 0.32% | 0.75%(-0.427)#1,139 | 1.2%(-0.875)#20,902 |
| 3. | 79761 | 0.11% | 0.75%(-0.637)#1,337 | 1.2%(-1.08)#23,486 |
| 4. | 79762 | 0.046% | 0.75%(-0.706)#1,434 | 1.2%(-1.15)#24,396 |
| 5. | 79763 | 0.034% | 0.75%(-0.718)#1,444 | 1.2%(-1.17)#24,510 |
1
Common Questions
What are the Top 5 Zip Codes with the Highest Percentage of Population Employed in Agriculture, Fishing & Hunting in Odessa, TX?
Top 5 Zip Codes with the Highest Percentage of Population Employed in Agriculture, Fishing & Hunting in Odessa, TX are:
What zip code has the Highest Percentage of Population Employed in Agriculture, Fishing & Hunting in Odessa, TX?
79764 has the Highest Percentage of Population Employed in Agriculture, Fishing & Hunting in Odessa, TX with 0.43%.
What is the Percentage of Population Employed in Agriculture, Fishing & Hunting in Odessa, TX?
Percentage of Population Employed in Agriculture, Fishing & Hunting in Odessa is 0.057%.
What is the Percentage of Population Employed in Agriculture, Fishing & Hunting in Texas?
Percentage of Population Employed in Agriculture, Fishing & Hunting in Texas is 0.75%.
What is the Percentage of Population Employed in Agriculture, Fishing & Hunting in the United States?
Percentage of Population Employed in Agriculture, Fishing & Hunting in the United States is 1.2%.