Winfield, TN Map & Demographics
Winfield Map
Winfield Overview
$19,960
PER CAPITA INCOME
$56,875
AVG FAMILY INCOME
$40,526
AVG HOUSEHOLD INCOME
25.6%
WAGE / INCOME GAP [ % ]
74.4¢/ $1
WAGE / INCOME GAP [ $ ]
0.41
INEQUALITY / GINI INDEX
1,306
TOTAL POPULATION
664
MALE POPULATION
642
FEMALE POPULATION
103.43
MALES / 100 FEMALES
96.69
FEMALES / 100 MALES
35.9
MEDIAN AGE
3.0
AVG FAMILY SIZE
2.5
AVG HOUSEHOLD SIZE
555
LABOR FORCE [ PEOPLE ]
57.1%
PERCENT IN LABOR FORCE
4.7%
UNEMPLOYMENT RATE
Winfield Zip Codes
Winfield Area Codes
Income in Winfield
Income Overview in Winfield
Per Capita Income in Winfield is $19,960, while median incomes of families and households are $56,875 and $40,526 respectively.
| Characteristic | Number | Measure |
| Per Capita Income | 1,306 | $19,960 |
| Median Family Income | 355 | $56,875 |
| Mean Family Income | 355 | $60,513 |
| Median Household Income | 518 | $40,526 |
| Mean Household Income | 518 | $48,774 |
| Income Deficit | 355 | $0 |
| Wage / Income Gap (%) | 1,306 | 25.63% |
| Wage / Income Gap ($) | 1,306 | 74.37¢ per $1 |
| Gini / Inequality Index | 1,306 | 0.41 |
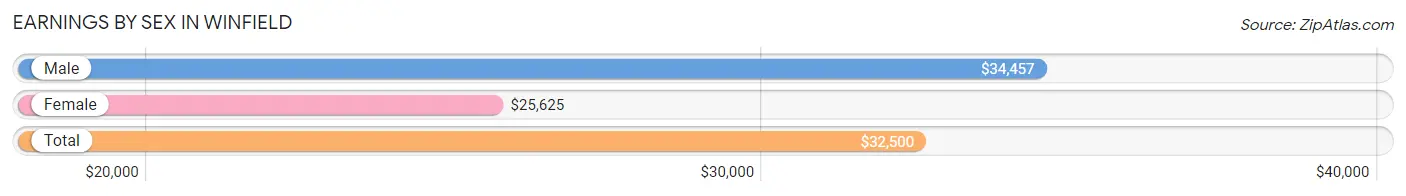
Earnings by Sex in Winfield
Average Earnings in Winfield are $32,500, $34,457 for men and $25,625 for women, a difference of 25.6%.
| Sex | Number | Average Earnings |
| Male | 296 (48.7%) | $34,457 |
| Female | 312 (51.3%) | $25,625 |
| Total | 608 (100.0%) | $32,500 |
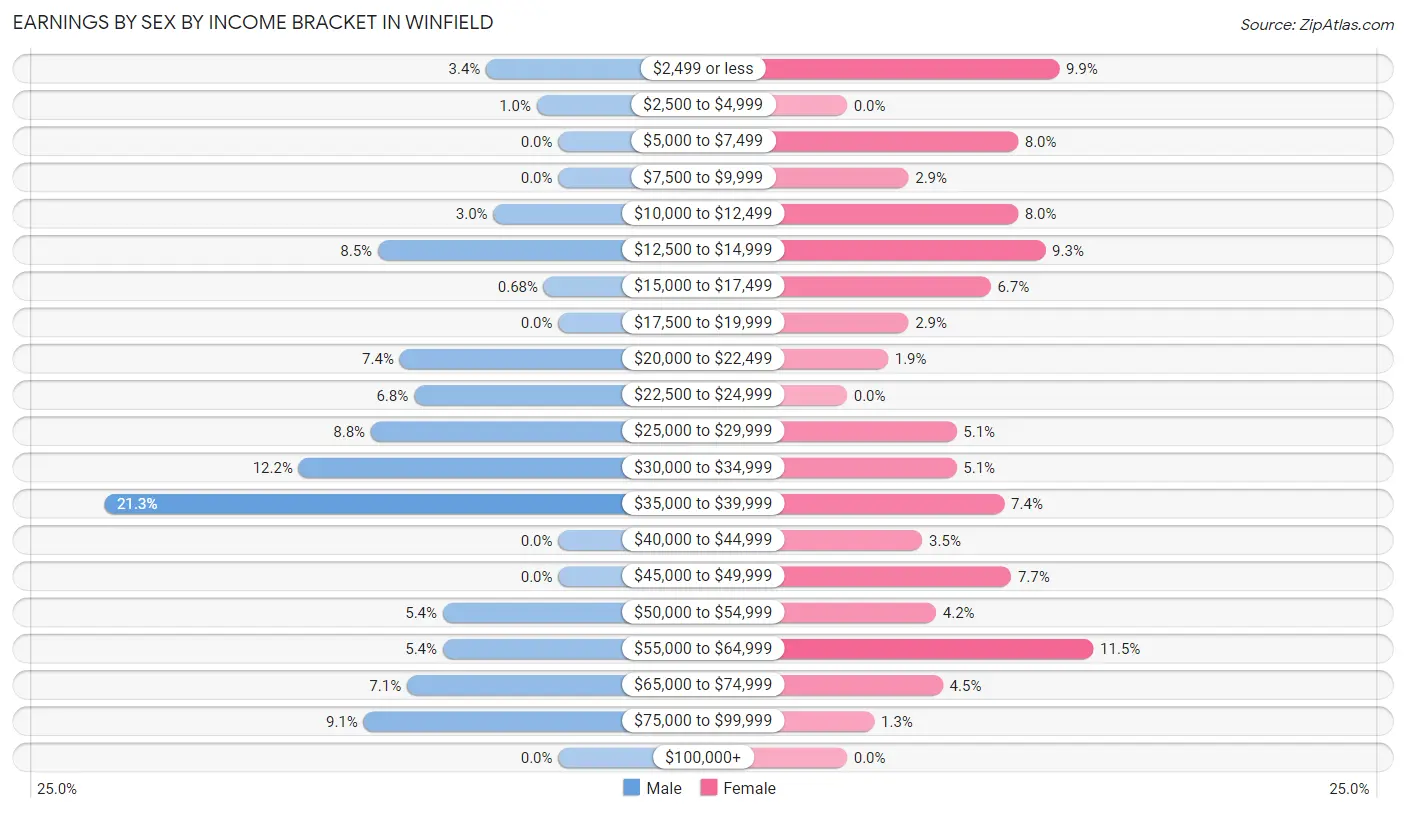
Earnings by Sex by Income Bracket in Winfield
The most common earnings brackets in Winfield are $35,000 to $39,999 for men (63 | 21.3%) and $55,000 to $64,999 for women (36 | 11.5%).
| Income | Male | Female |
| $2,499 or less | 10 (3.4%) | 31 (9.9%) |
| $2,500 to $4,999 | 3 (1.0%) | 0 (0.0%) |
| $5,000 to $7,499 | 0 (0.0%) | 25 (8.0%) |
| $7,500 to $9,999 | 0 (0.0%) | 9 (2.9%) |
| $10,000 to $12,499 | 9 (3.0%) | 25 (8.0%) |
| $12,500 to $14,999 | 25 (8.5%) | 29 (9.3%) |
| $15,000 to $17,499 | 2 (0.7%) | 21 (6.7%) |
| $17,500 to $19,999 | 0 (0.0%) | 9 (2.9%) |
| $20,000 to $22,499 | 22 (7.4%) | 6 (1.9%) |
| $22,500 to $24,999 | 20 (6.8%) | 0 (0.0%) |
| $25,000 to $29,999 | 26 (8.8%) | 16 (5.1%) |
| $30,000 to $34,999 | 36 (12.2%) | 16 (5.1%) |
| $35,000 to $39,999 | 63 (21.3%) | 23 (7.4%) |
| $40,000 to $44,999 | 0 (0.0%) | 11 (3.5%) |
| $45,000 to $49,999 | 0 (0.0%) | 24 (7.7%) |
| $50,000 to $54,999 | 16 (5.4%) | 13 (4.2%) |
| $55,000 to $64,999 | 16 (5.4%) | 36 (11.5%) |
| $65,000 to $74,999 | 21 (7.1%) | 14 (4.5%) |
| $75,000 to $99,999 | 27 (9.1%) | 4 (1.3%) |
| $100,000+ | 0 (0.0%) | 0 (0.0%) |
| Total | 296 (100.0%) | 312 (100.0%) |
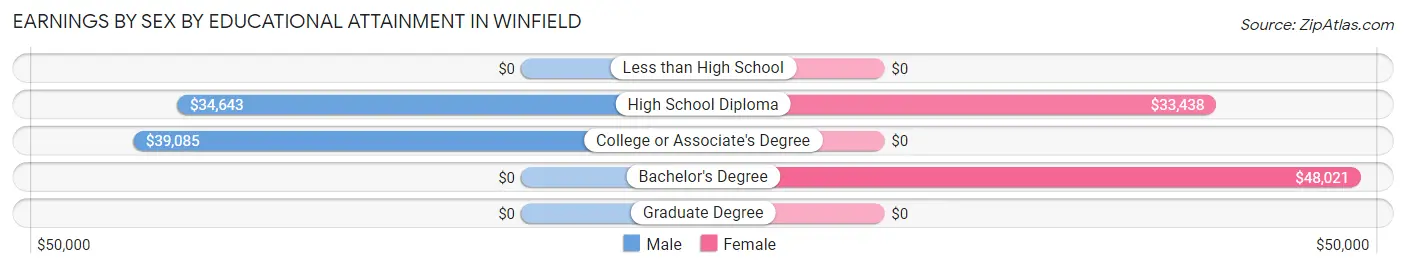
Earnings by Sex by Educational Attainment in Winfield
Average earnings in Winfield are $38,190 for men and $31,250 for women, a difference of 18.2%. Men with an educational attainment of college or associate's degree enjoy the highest average annual earnings of $39,085, while those with high school diploma education earn the least with $34,643. Women with an educational attainment of bachelor's degree earn the most with the average annual earnings of $48,021, while those with high school diploma education have the smallest earnings of $33,438.
| Educational Attainment | Male Income | Female Income |
| Less than High School | - | - |
| High School Diploma | $34,643 | $33,438 |
| College or Associate's Degree | $39,085 | $0 |
| Bachelor's Degree | - | - |
| Graduate Degree | - | - |
| Total | $38,190 | $31,250 |
Family Income in Winfield
Family Income Brackets in Winfield
According to the Winfield family income data, there are 81 families falling into the $75,000 to $99,999 income range, which is the most common income bracket and makes up 22.8% of all families.
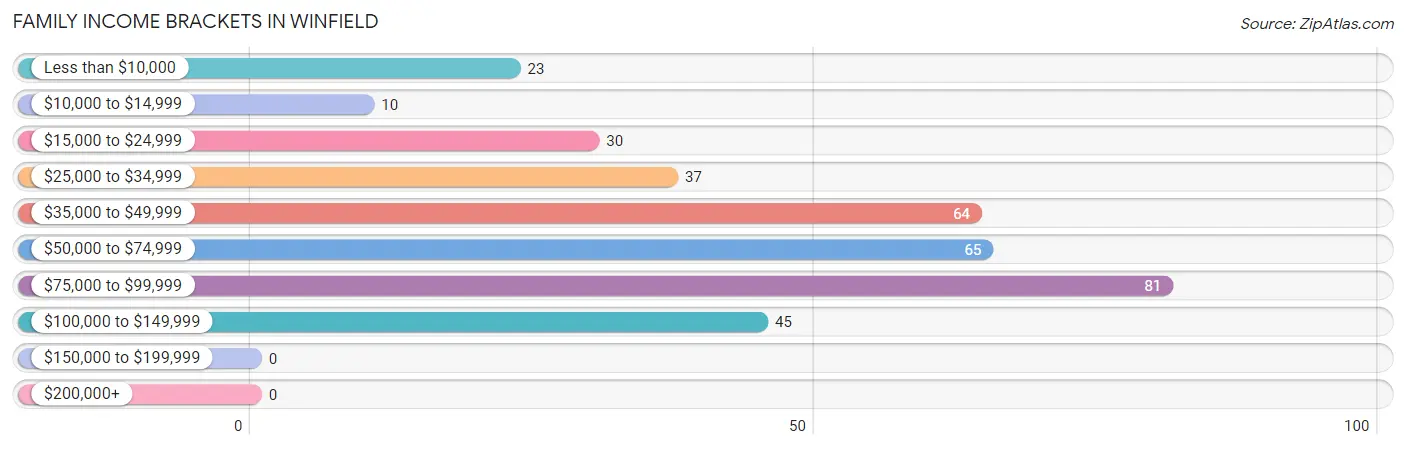
| Income Bracket | # Families | % Families |
| Less than $10,000 | 23 | 6.5% |
| $10,000 to $14,999 | 10 | 2.8% |
| $15,000 to $24,999 | 30 | 8.5% |
| $25,000 to $34,999 | 37 | 10.4% |
| $35,000 to $49,999 | 64 | 18.0% |
| $50,000 to $74,999 | 65 | 18.3% |
| $75,000 to $99,999 | 81 | 22.8% |
| $100,000 to $149,999 | 45 | 12.7% |
| $150,000 to $199,999 | 0 | 0.0% |
| $200,000+ | 0 | 0.0% |
Family Income by Famaliy Size in Winfield
4-person families (94 | 26.5%) account for the highest median family income in Winfield with $68,409 per family, while 2-person families (155 | 43.7%) have the highest median income of $32,422 per family member.
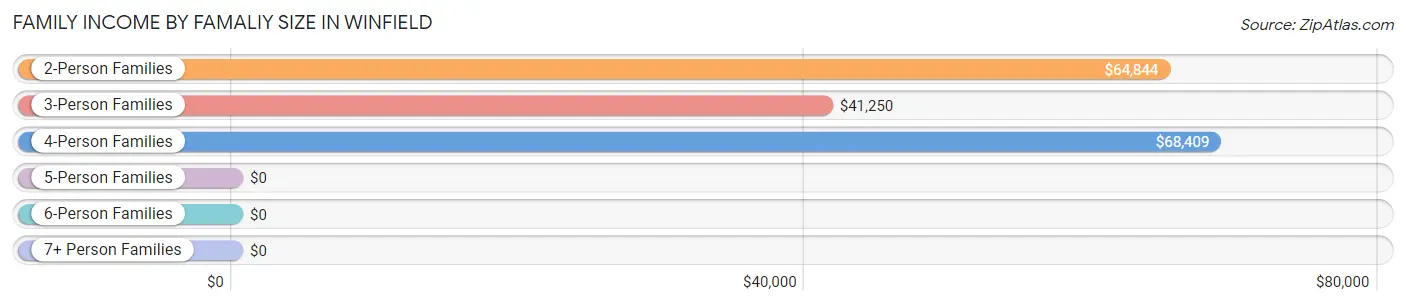
| Income Bracket | # Families | Median Income |
| 2-Person Families | 155 (43.7%) | $64,844 |
| 3-Person Families | 66 (18.6%) | $41,250 |
| 4-Person Families | 94 (26.5%) | $68,409 |
| 5-Person Families | 36 (10.1%) | $0 |
| 6-Person Families | 4 (1.1%) | $0 |
| 7+ Person Families | 0 (0.0%) | $0 |
| Total | 355 (100.0%) | $56,875 |
Family Income by Number of Earners in Winfield
The median family income in Winfield is $56,875, with families comprising 3+ earners (22) having the highest median family income of $81,250, while families with no earners (51) have the lowest median family income of $28,906, accounting for 6.2% and 14.4% of families, respectively.
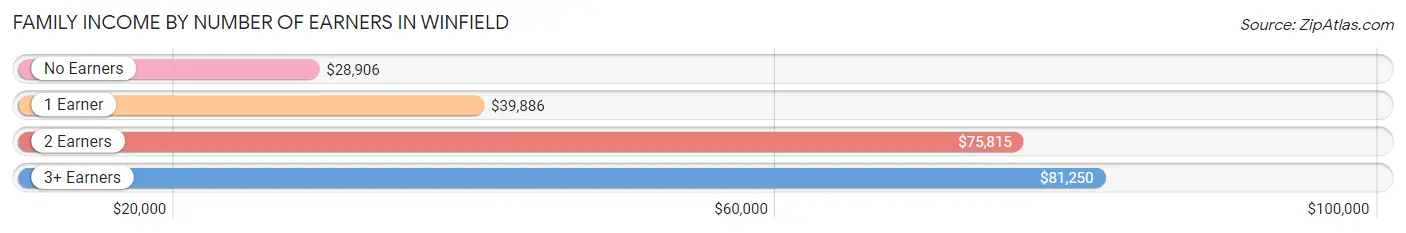
| Number of Earners | # Families | Median Income |
| No Earners | 51 (14.4%) | $28,906 |
| 1 Earner | 127 (35.8%) | $39,886 |
| 2 Earners | 155 (43.7%) | $75,815 |
| 3+ Earners | 22 (6.2%) | $81,250 |
| Total | 355 (100.0%) | $56,875 |
Household Income in Winfield
Household Income Brackets in Winfield
With 88 households falling in the category, the $50,000 to $74,999 income range is the most frequent in Winfield, accounting for 17.0% of all households.
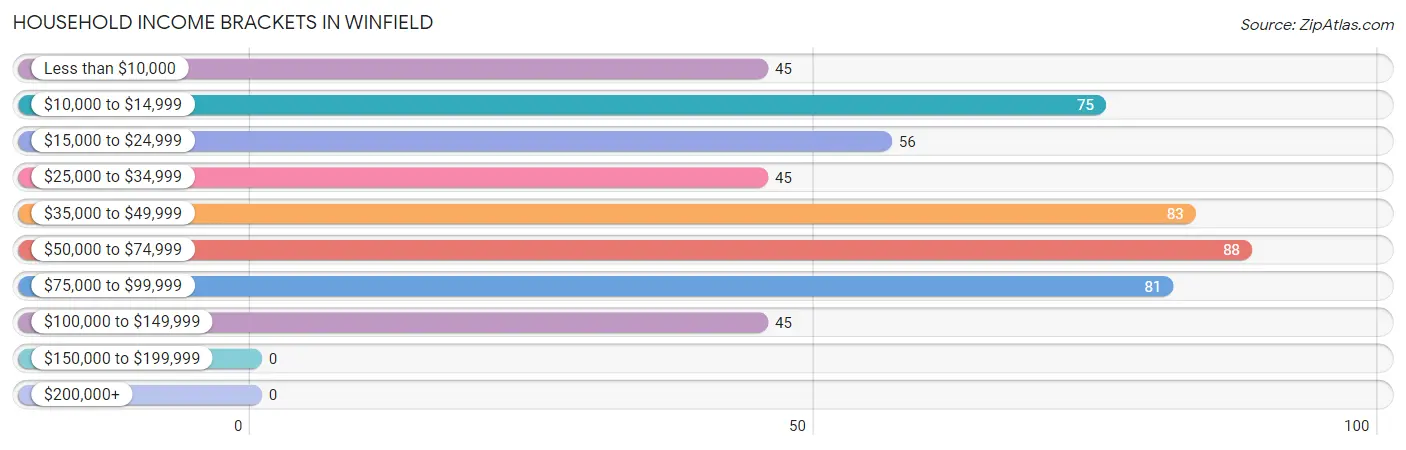
| Income Bracket | # Households | % Households |
| Less than $10,000 | 45 | 8.7% |
| $10,000 to $14,999 | 75 | 14.5% |
| $15,000 to $24,999 | 56 | 10.8% |
| $25,000 to $34,999 | 45 | 8.7% |
| $35,000 to $49,999 | 83 | 16.0% |
| $50,000 to $74,999 | 88 | 17.0% |
| $75,000 to $99,999 | 81 | 15.6% |
| $100,000 to $149,999 | 45 | 8.7% |
| $150,000 to $199,999 | 0 | 0.0% |
| $200,000+ | 0 | 0.0% |
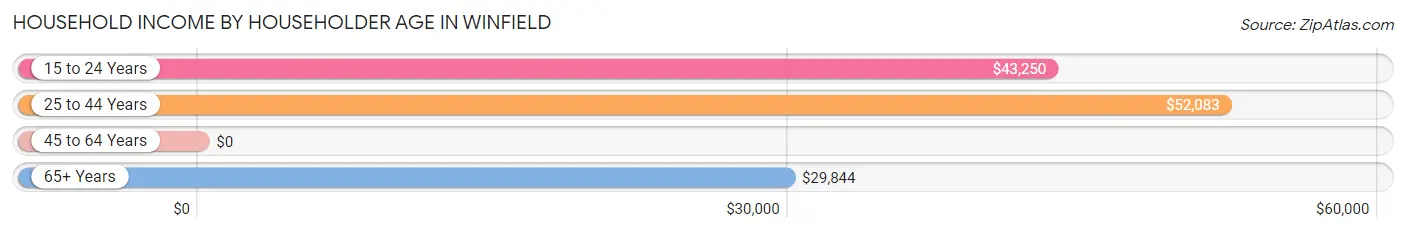
Household Income by Householder Age in Winfield
The median household income in Winfield is $40,526, with the highest median household income of $52,083 found in the 25 to 44 years age bracket for the primary householder. A total of 176 households (34.0%) fall into this category. Meanwhile, the 45 to 64 years age bracket for the primary householder has the lowest median household income of $0, with 225 households (43.4%) in this group.
| Income Bracket | # Households | Median Income |
| 15 to 24 Years | 38 (7.3%) | $43,250 |
| 25 to 44 Years | 176 (34.0%) | $52,083 |
| 45 to 64 Years | 225 (43.4%) | $0 |
| 65+ Years | 79 (15.2%) | $29,844 |
| Total | 518 (100.0%) | $40,526 |
Poverty in Winfield
Income Below Poverty by Sex and Age in Winfield
With 20.2% poverty level for males and 30.4% for females among the residents of Winfield, 6 to 11 year old males and 75 year old and over females are the most vulnerable to poverty, with 26 males (48.1%) and 5 females (100.0%) in their respective age groups living below the poverty level.
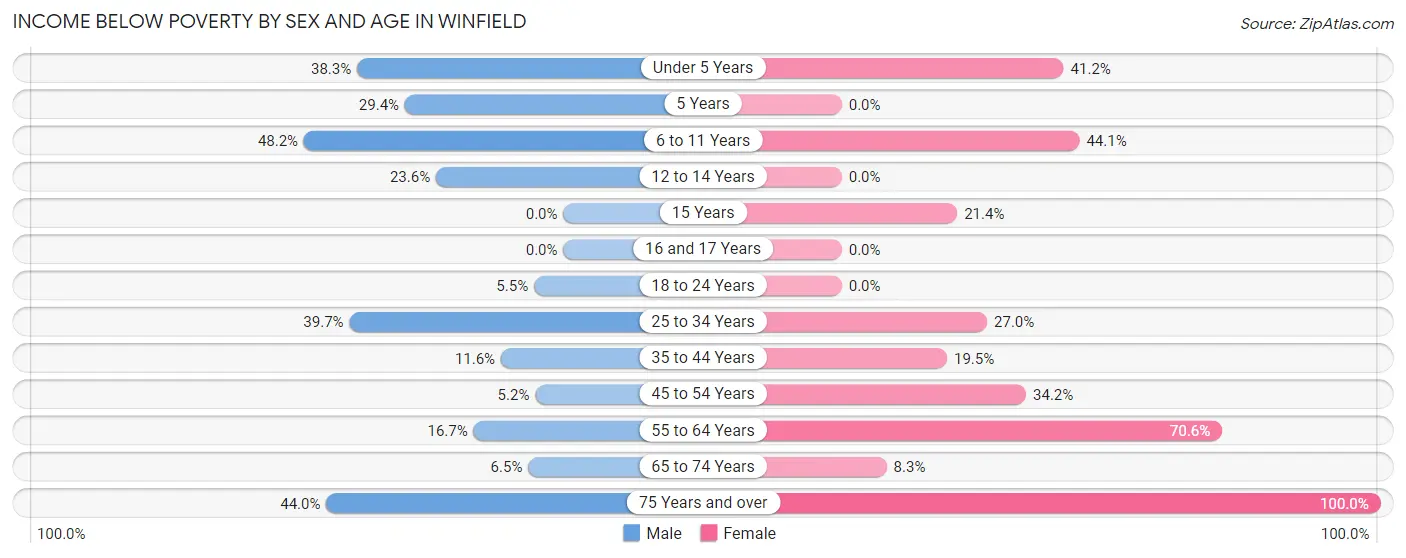
| Age Bracket | Male | Female |
| Under 5 Years | 18 (38.3%) | 21 (41.2%) |
| 5 Years | 10 (29.4%) | 0 (0.0%) |
| 6 to 11 Years | 26 (48.1%) | 15 (44.1%) |
| 12 to 14 Years | 13 (23.6%) | 0 (0.0%) |
| 15 Years | 0 (0.0%) | 3 (21.4%) |
| 16 and 17 Years | 0 (0.0%) | 0 (0.0%) |
| 18 to 24 Years | 3 (5.4%) | 0 (0.0%) |
| 25 to 34 Years | 27 (39.7%) | 24 (27.0%) |
| 35 to 44 Years | 11 (11.6%) | 25 (19.5%) |
| 45 to 54 Years | 6 (5.2%) | 26 (34.2%) |
| 55 to 64 Years | 5 (16.7%) | 72 (70.6%) |
| 65 to 74 Years | 3 (6.5%) | 4 (8.3%) |
| 75 Years and over | 11 (44.0%) | 5 (100.0%) |
| Total | 133 (20.2%) | 195 (30.4%) |
Income Above Poverty by Sex and Age in Winfield
According to the poverty statistics in Winfield, males aged 15 years and females aged 5 years are the age groups that are most secure financially, with 100.0% of males and 100.0% of females in these age groups living above the poverty line.
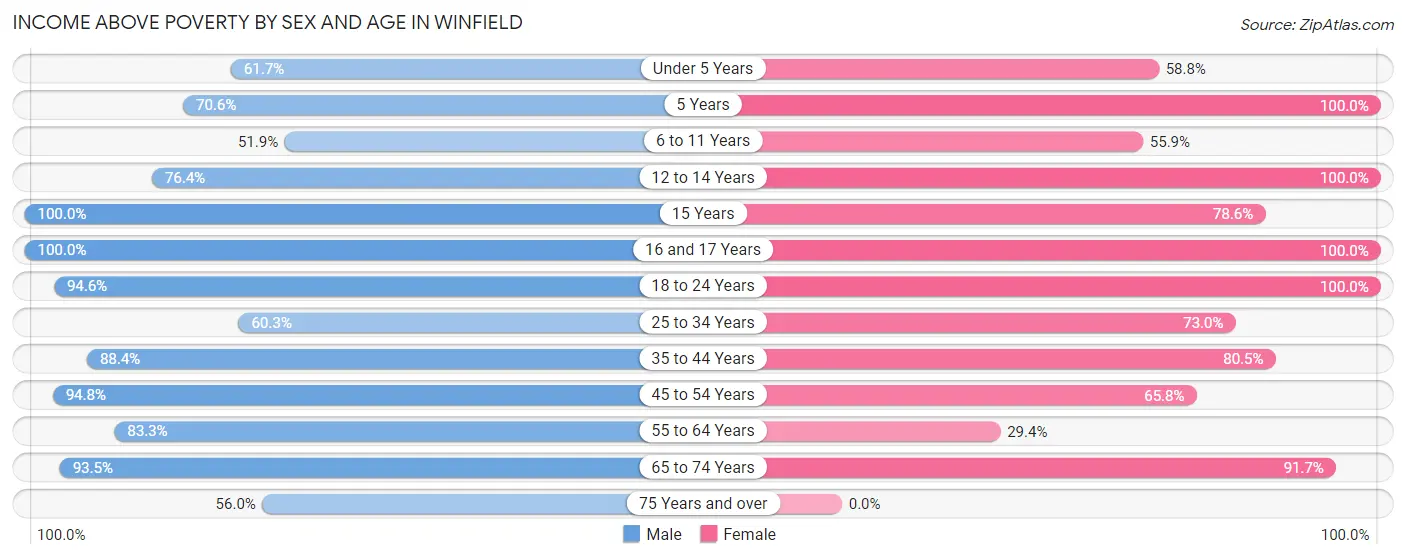
| Age Bracket | Male | Female |
| Under 5 Years | 29 (61.7%) | 30 (58.8%) |
| 5 Years | 24 (70.6%) | 8 (100.0%) |
| 6 to 11 Years | 28 (51.8%) | 19 (55.9%) |
| 12 to 14 Years | 42 (76.4%) | 19 (100.0%) |
| 15 Years | 14 (100.0%) | 11 (78.6%) |
| 16 and 17 Years | 22 (100.0%) | 11 (100.0%) |
| 18 to 24 Years | 52 (94.6%) | 57 (100.0%) |
| 25 to 34 Years | 41 (60.3%) | 65 (73.0%) |
| 35 to 44 Years | 84 (88.4%) | 103 (80.5%) |
| 45 to 54 Years | 109 (94.8%) | 50 (65.8%) |
| 55 to 64 Years | 25 (83.3%) | 30 (29.4%) |
| 65 to 74 Years | 43 (93.5%) | 44 (91.7%) |
| 75 Years and over | 14 (56.0%) | 0 (0.0%) |
| Total | 527 (79.8%) | 447 (69.6%) |
Income Below Poverty Among Married-Couple Families in Winfield
The poverty statistics for married-couple families in Winfield show that 7.1% or 17 of the total 238 families live below the poverty line. Families with 3 or 4 children have the highest poverty rate of 42.3%, comprising of 11 families. On the other hand, families with 1 or 2 children have the lowest poverty rate of 0.0%, which includes 0 families.
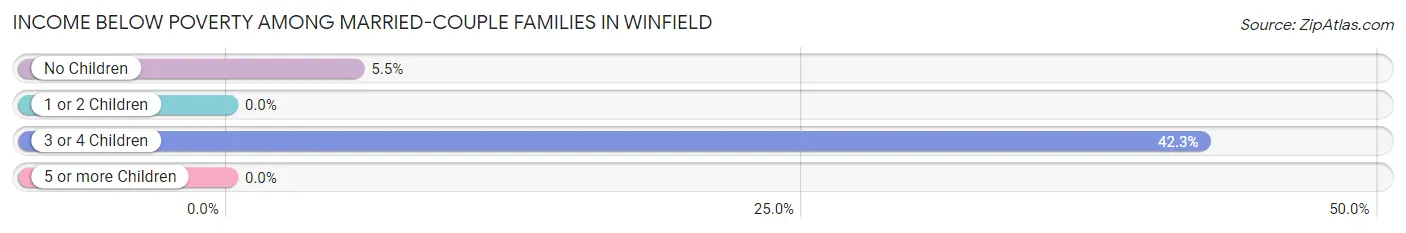
| Children | Above Poverty | Below Poverty |
| No Children | 103 (94.5%) | 6 (5.5%) |
| 1 or 2 Children | 103 (100.0%) | 0 (0.0%) |
| 3 or 4 Children | 15 (57.7%) | 11 (42.3%) |
| 5 or more Children | 0 (0.0%) | 0 (0.0%) |
| Total | 221 (92.9%) | 17 (7.1%) |
Income Below Poverty Among Single-Parent Households in Winfield
According to the poverty data in Winfield, 20.0% or 7 single-father households and 31.7% or 26 single-mother households are living below the poverty line. Among single-father households, those with 1 or 2 children have the highest poverty rate, with 7 households (50.0%) experiencing poverty. Likewise, among single-mother households, those with 3 or 4 children have the highest poverty rate, with 14 households (100.0%) falling below the poverty line.
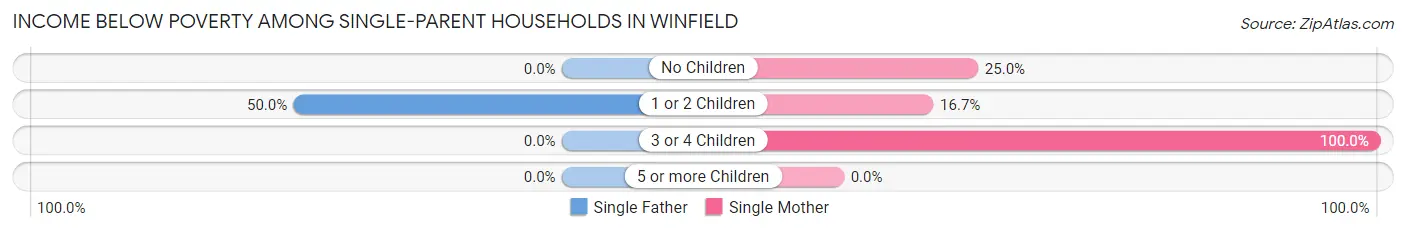
| Children | Single Father | Single Mother |
| No Children | 0 (0.0%) | 2 (25.0%) |
| 1 or 2 Children | 7 (50.0%) | 10 (16.7%) |
| 3 or 4 Children | 0 (0.0%) | 14 (100.0%) |
| 5 or more Children | 0 (0.0%) | 0 (0.0%) |
| Total | 7 (20.0%) | 26 (31.7%) |
Income Below Poverty Among Married-Couple vs Single-Parent Households in Winfield
The poverty data for Winfield shows that 17 of the married-couple family households (7.1%) and 33 of the single-parent households (28.2%) are living below the poverty level. Within the married-couple family households, those with 3 or 4 children have the highest poverty rate, with 11 households (42.3%) falling below the poverty line. Among the single-parent households, those with 3 or 4 children have the highest poverty rate, with 14 household (100.0%) living below poverty.
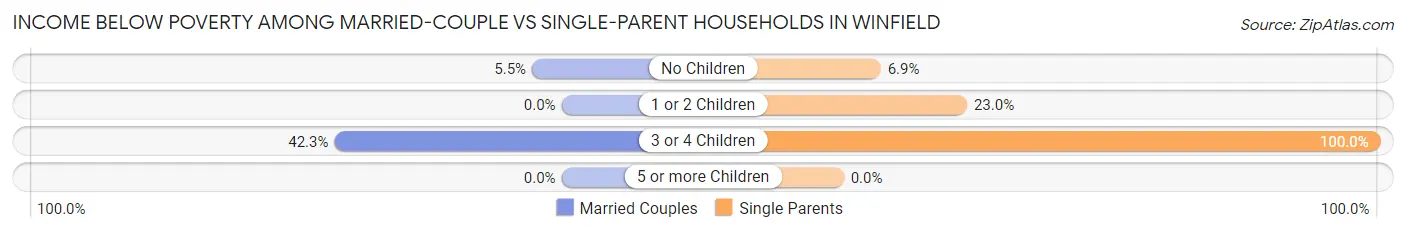
| Children | Married-Couple Families | Single-Parent Households |
| No Children | 6 (5.5%) | 2 (6.9%) |
| 1 or 2 Children | 0 (0.0%) | 17 (23.0%) |
| 3 or 4 Children | 11 (42.3%) | 14 (100.0%) |
| 5 or more Children | 0 (0.0%) | 0 (0.0%) |
| Total | 17 (7.1%) | 33 (28.2%) |
Race in Winfield
The most populous races in Winfield are White / Caucasian (1,297 | 99.3%), and Two or more Races (9 | 0.7%).
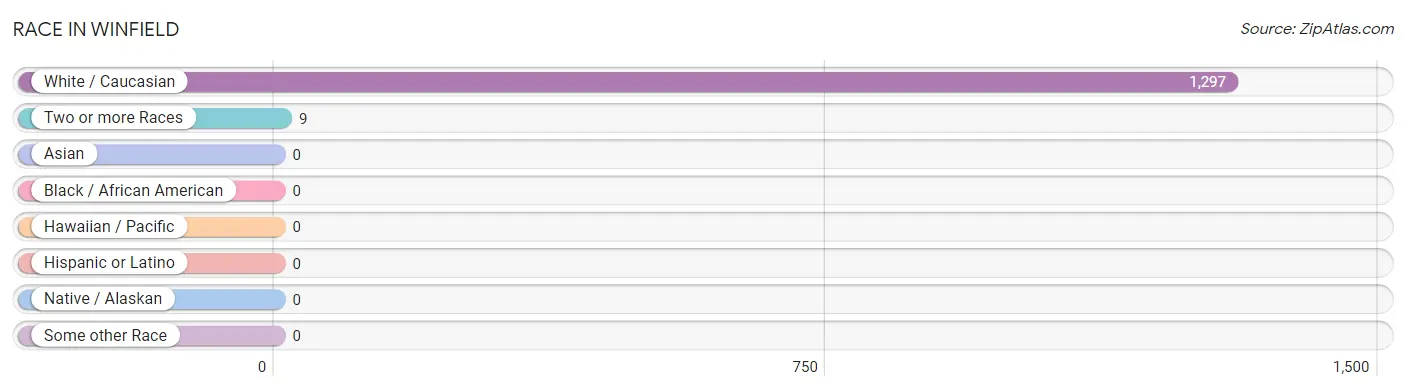
| Race | # Population | % Population |
| Asian | 0 | 0.0% |
| Black / African American | 0 | 0.0% |
| Hawaiian / Pacific | 0 | 0.0% |
| Hispanic or Latino | 0 | 0.0% |
| Native / Alaskan | 0 | 0.0% |
| White / Caucasian | 1,297 | 99.3% |
| Two or more Races | 9 | 0.7% |
| Some other Race | 0 | 0.0% |
| Total | 1,306 | 100.0% |
Ancestry in Winfield
The most populous ancestries reported in Winfield are English (129 | 9.9%), American (107 | 8.2%), Irish (70 | 5.4%), Scottish (43 | 3.3%), and German (24 | 1.8%), together accounting for 28.6% of all Winfield residents.
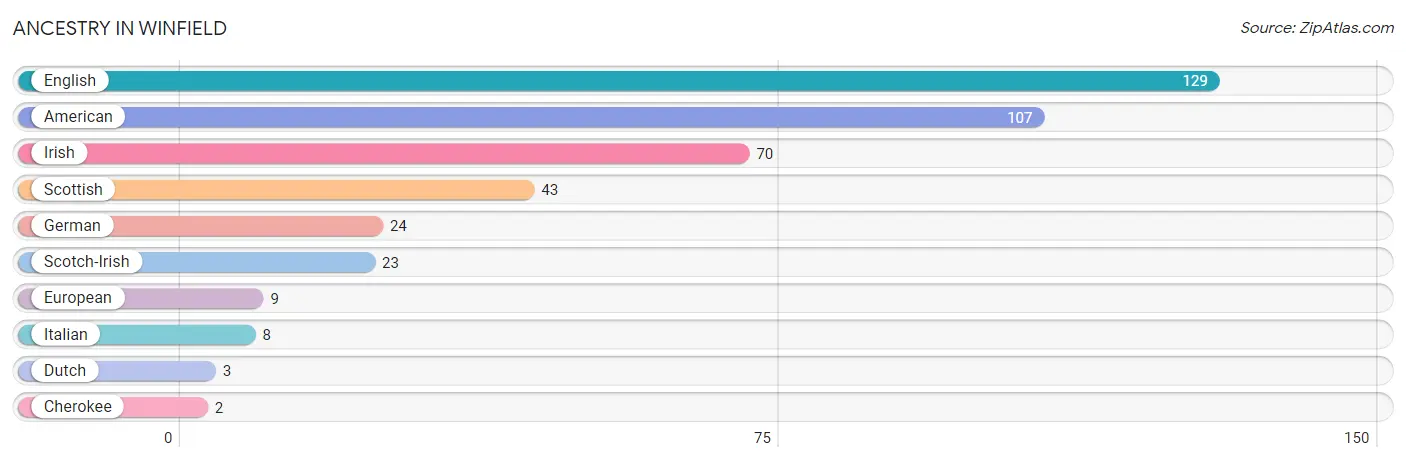
| Ancestry | # Population | % Population |
| American | 107 | 8.2% |
| Cherokee | 2 | 0.2% |
| Dutch | 3 | 0.2% |
| English | 129 | 9.9% |
| European | 9 | 0.7% |
| German | 24 | 1.8% |
| Irish | 70 | 5.4% |
| Italian | 8 | 0.6% |
| Scotch-Irish | 23 | 1.8% |
| Scottish | 43 | 3.3% | View All 10 Rows |
Immigrants in Winfield

| Immigration Origin | # Population | % Population | View All 0 Rows |
Sex and Age in Winfield
Sex and Age in Winfield
The most populous age groups in Winfield are 10 to 14 Years (82 | 12.3%) for men and 60 to 64 Years (76 | 11.8%) for women.
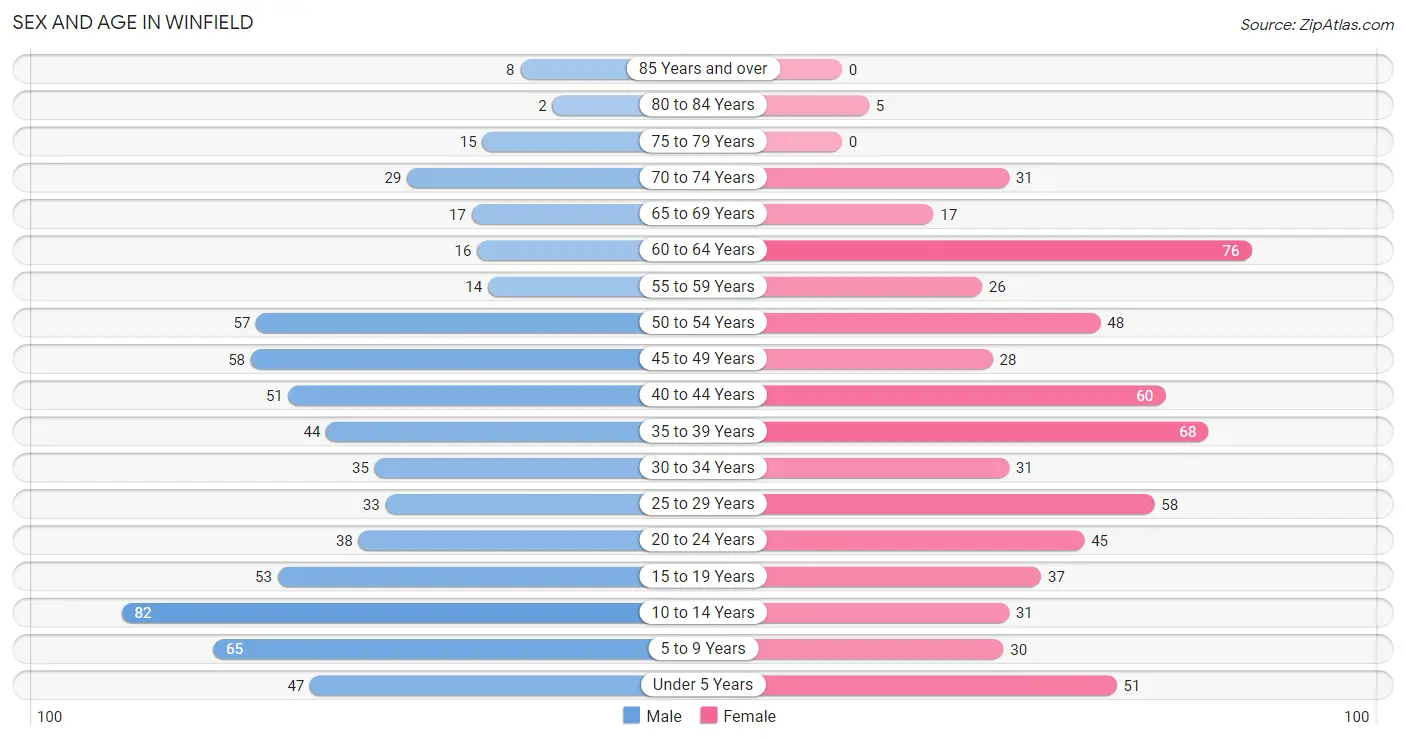
| Age Bracket | Male | Female |
| Under 5 Years | 47 (7.1%) | 51 (7.9%) |
| 5 to 9 Years | 65 (9.8%) | 30 (4.7%) |
| 10 to 14 Years | 82 (12.3%) | 31 (4.8%) |
| 15 to 19 Years | 53 (8.0%) | 37 (5.8%) |
| 20 to 24 Years | 38 (5.7%) | 45 (7.0%) |
| 25 to 29 Years | 33 (5.0%) | 58 (9.0%) |
| 30 to 34 Years | 35 (5.3%) | 31 (4.8%) |
| 35 to 39 Years | 44 (6.6%) | 68 (10.6%) |
| 40 to 44 Years | 51 (7.7%) | 60 (9.3%) |
| 45 to 49 Years | 58 (8.7%) | 28 (4.4%) |
| 50 to 54 Years | 57 (8.6%) | 48 (7.5%) |
| 55 to 59 Years | 14 (2.1%) | 26 (4.1%) |
| 60 to 64 Years | 16 (2.4%) | 76 (11.8%) |
| 65 to 69 Years | 17 (2.6%) | 17 (2.6%) |
| 70 to 74 Years | 29 (4.4%) | 31 (4.8%) |
| 75 to 79 Years | 15 (2.3%) | 0 (0.0%) |
| 80 to 84 Years | 2 (0.3%) | 5 (0.8%) |
| 85 Years and over | 8 (1.2%) | 0 (0.0%) |
| Total | 664 (100.0%) | 642 (100.0%) |
Families and Households in Winfield
Median Family Size in Winfield
The median family size in Winfield is 3.02 persons per family, with married-couple families (238 | 67.0%) accounting for the largest median family size of 3.18 persons per family. On the other hand, single male/father families (35 | 9.9%) represent the smallest median family size with 2.03 persons per family.
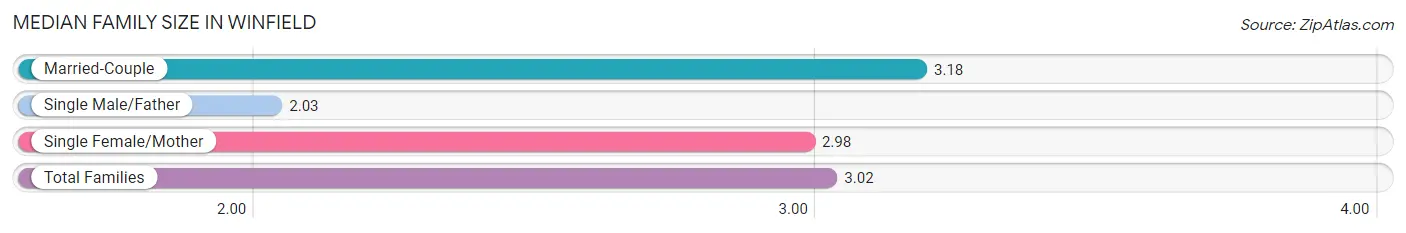
| Family Type | # Families | Family Size |
| Married-Couple | 238 (67.0%) | 3.18 |
| Single Male/Father | 35 (9.9%) | 2.03 |
| Single Female/Mother | 82 (23.1%) | 2.98 |
| Total Families | 355 (100.0%) | 3.02 |
Median Household Size in Winfield
The median household size in Winfield is 2.52 persons per household, with single female/mother households (82 | 15.8%) accounting for the largest median household size of 3.32 persons per household. non-family households (163 | 31.5%) represent the smallest median household size with 1.20 persons per household.
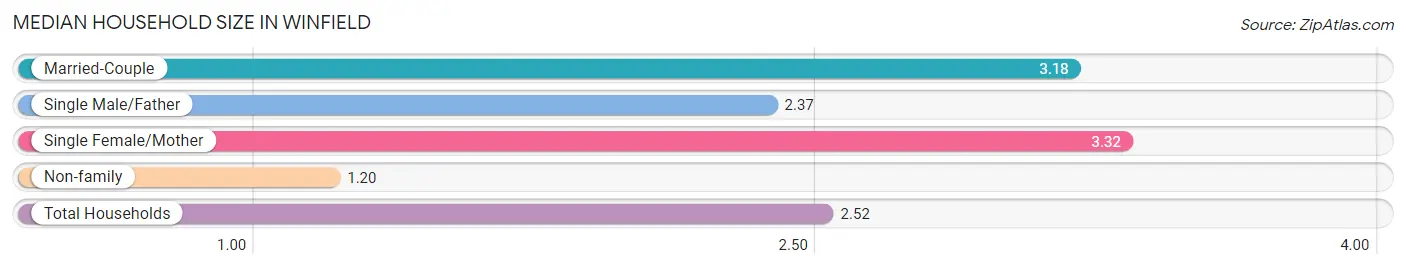
| Household Type | # Households | Household Size |
| Married-Couple | 238 (46.0%) | 3.18 |
| Single Male/Father | 35 (6.8%) | 2.37 |
| Single Female/Mother | 82 (15.8%) | 3.32 |
| Non-family | 163 (31.5%) | 1.20 |
| Total Households | 518 (100.0%) | 2.52 |
Household Size by Marriage Status in Winfield
Out of a total of 518 households in Winfield, 355 (68.5%) are family households, while 163 (31.5%) are nonfamily households. The most numerous type of family households are 2-person households, comprising 126, and the most common type of nonfamily households are 1-person households, comprising 139.
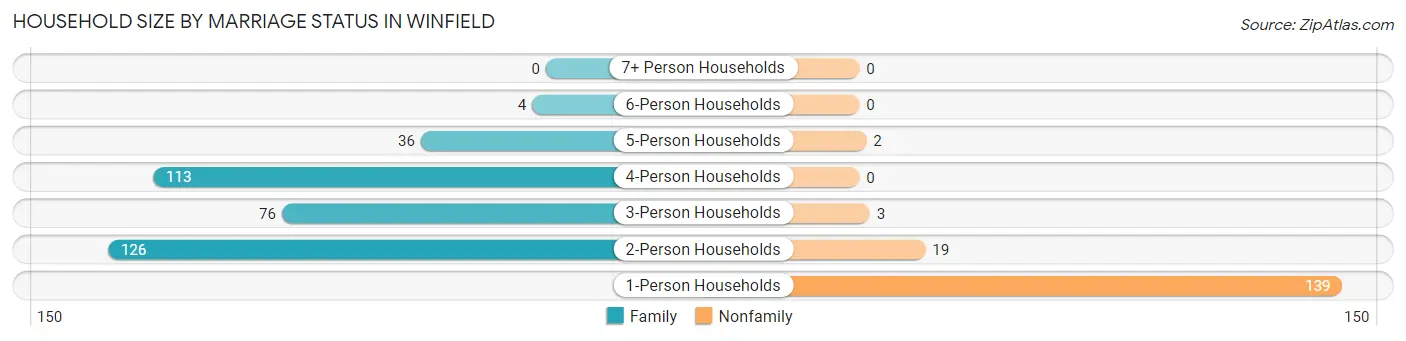
| Household Size | Family Households | Nonfamily Households |
| 1-Person Households | - | 139 (26.8%) |
| 2-Person Households | 126 (24.3%) | 19 (3.7%) |
| 3-Person Households | 76 (14.7%) | 3 (0.6%) |
| 4-Person Households | 113 (21.8%) | 0 (0.0%) |
| 5-Person Households | 36 (7.0%) | 2 (0.4%) |
| 6-Person Households | 4 (0.8%) | 0 (0.0%) |
| 7+ Person Households | 0 (0.0%) | 0 (0.0%) |
| Total | 355 (68.5%) | 163 (31.5%) |
Female Fertility in Winfield
Fertility by Age in Winfield
Average fertility rate in Winfield is 44.0 births per 1,000 women. Women in the age bracket of 20 to 34 years have the highest fertility rate with 119.0 births per 1,000 women. Women in the age bracket of 20 to 34 years acount for 100.0% of all women with births.
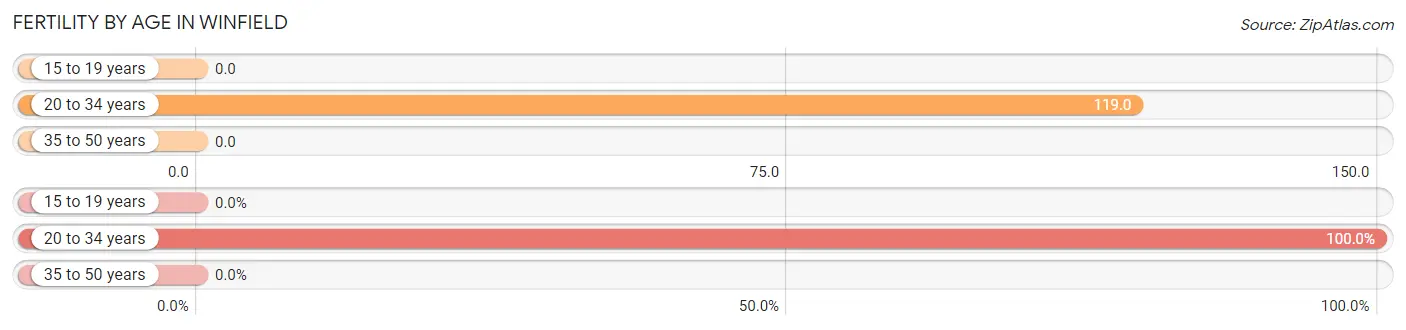
| Age Bracket | Women with Births | Births / 1,000 Women |
| 15 to 19 years | 0 (0.0%) | 0.0 |
| 20 to 34 years | 16 (100.0%) | 119.0 |
| 35 to 50 years | 0 (0.0%) | 0.0 |
| Total | 16 (100.0%) | 44.0 |
Fertility by Age by Marriage Status in Winfield
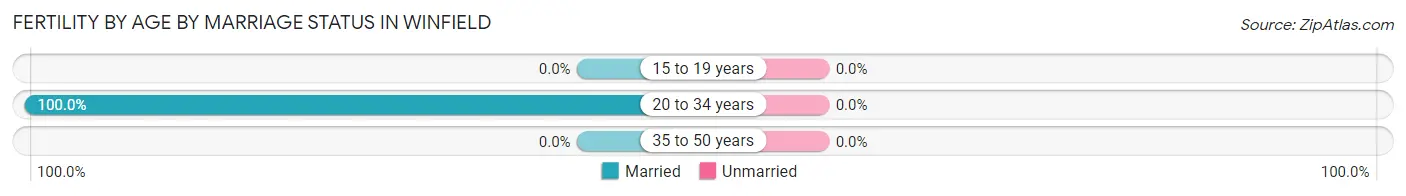
| Age Bracket | Married | Unmarried |
| 15 to 19 years | 0 (0.0%) | 0 (0.0%) |
| 20 to 34 years | 16 (100.0%) | 0 (0.0%) |
| 35 to 50 years | 0 (0.0%) | 0 (0.0%) |
| Total | 16 (100.0%) | 0 (0.0%) |
Fertility by Education in Winfield
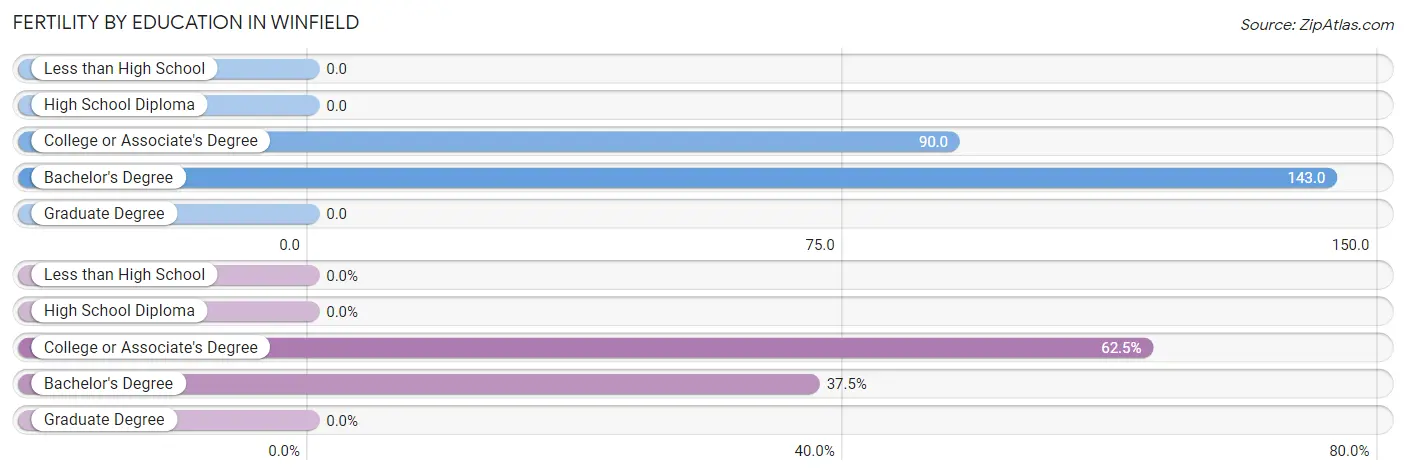
| Educational Attainment | Women with Births | Births / 1,000 Women |
| Less than High School | 0 (0.0%) | 0.0 |
| High School Diploma | 0 (0.0%) | 0.0 |
| College or Associate's Degree | 10 (62.5%) | 90.0 |
| Bachelor's Degree | 6 (37.5%) | 143.0 |
| Graduate Degree | 0 (0.0%) | 0.0 |
| Total | 16 (100.0%) | 44.0 |
Fertility by Education by Marriage Status in Winfield
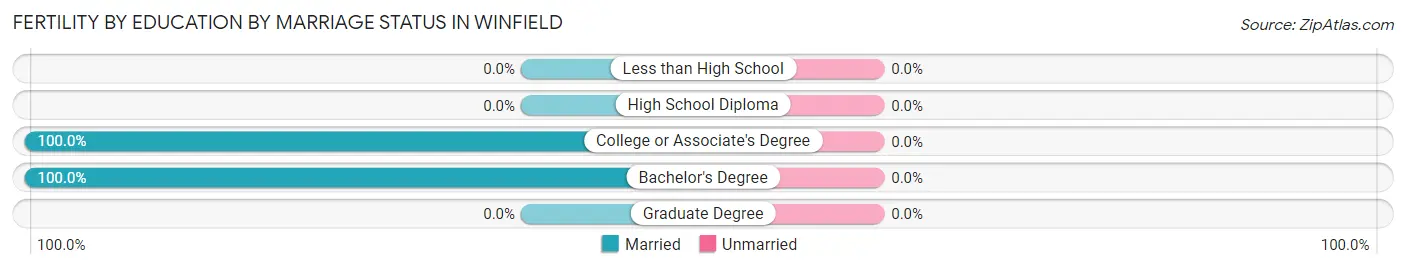
| Educational Attainment | Married | Unmarried |
| Less than High School | 0 (0.0%) | 0 (0.0%) |
| High School Diploma | 0 (0.0%) | 0 (0.0%) |
| College or Associate's Degree | 10 (100.0%) | 0 (0.0%) |
| Bachelor's Degree | 6 (100.0%) | 0 (0.0%) |
| Graduate Degree | 0 (0.0%) | 0 (0.0%) |
| Total | 16 (100.0%) | 0 (0.0%) |
Employment Characteristics in Winfield
Employment by Class of Employer in Winfield
Among the 523 employed individuals in Winfield, private company employees (339 | 64.8%), local government employees (81 | 15.5%), and self-employed (not incorporated) (45 | 8.6%) make up the most common classes of employment.
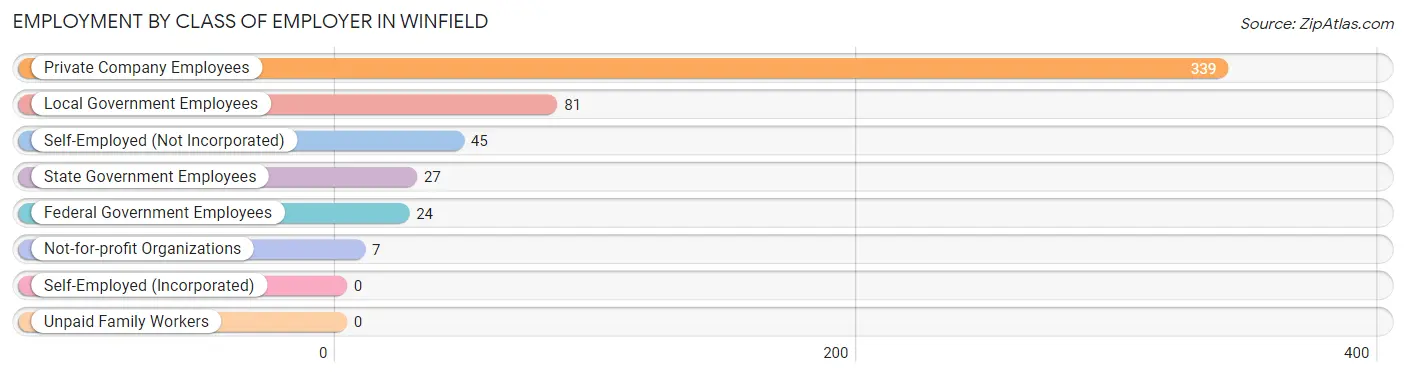
| Employer Class | # Employees | % Employees |
| Private Company Employees | 339 | 64.8% |
| Self-Employed (Incorporated) | 0 | 0.0% |
| Self-Employed (Not Incorporated) | 45 | 8.6% |
| Not-for-profit Organizations | 7 | 1.3% |
| Local Government Employees | 81 | 15.5% |
| State Government Employees | 27 | 5.2% |
| Federal Government Employees | 24 | 4.6% |
| Unpaid Family Workers | 0 | 0.0% |
| Total | 523 | 100.0% |
Employment Status by Age in Winfield
According to the labor force statistics for Winfield, out of the total population over 16 years of age (972), 57.1% or 555 individuals are in the labor force, with 4.7% or 26 of them unemployed. The age group with the highest labor force participation rate is 45 to 54 years, with 89.5% or 171 individuals in the labor force. Within the labor force, the 25 to 29 years age range has the highest percentage of unemployed individuals, with 17.5% or 7 of them being unemployed.
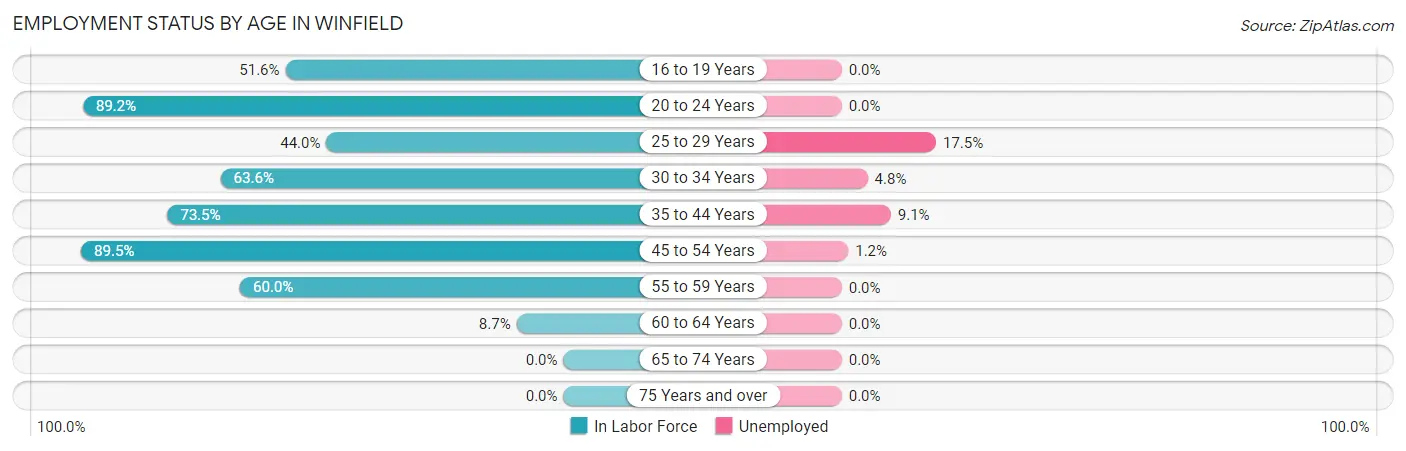
| Age Bracket | In Labor Force | Unemployed |
| 16 to 19 Years | 32 (51.6%) | 0 (0.0%) |
| 20 to 24 Years | 74 (89.2%) | 0 (0.0%) |
| 25 to 29 Years | 40 (44.0%) | 7 (17.5%) |
| 30 to 34 Years | 42 (63.6%) | 2 (4.8%) |
| 35 to 44 Years | 164 (73.5%) | 15 (9.1%) |
| 45 to 54 Years | 171 (89.5%) | 2 (1.2%) |
| 55 to 59 Years | 24 (60.0%) | 0 (0.0%) |
| 60 to 64 Years | 8 (8.7%) | 0 (0.0%) |
| 65 to 74 Years | 0 (0.0%) | 0 (0.0%) |
| 75 Years and over | 0 (0.0%) | 0 (0.0%) |
| Total | 555 (57.1%) | 26 (4.7%) |
Employment Status by Educational Attainment in Winfield
According to labor force statistics for Winfield, 63.9% of individuals (449) out of the total population between 25 and 64 years of age (703) are in the labor force, with 5.8% or 26 of them being unemployed. The group with the highest labor force participation rate are those with the educational attainment of bachelor's degree or higher, with 87.7% or 50 individuals in the labor force. Within the labor force, individuals with college / associate degree education have the highest percentage of unemployment, with 8.7% or 11 of them being unemployed.
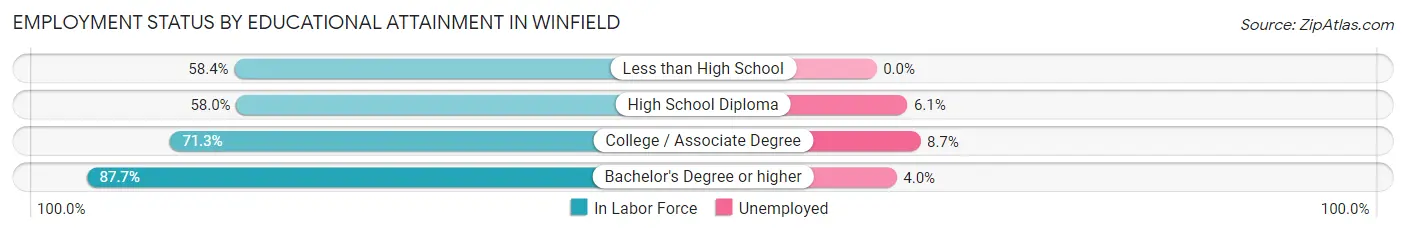
| Educational Attainment | In Labor Force | Unemployed |
| Less than High School | 59 (58.4%) | 0 (0.0%) |
| High School Diploma | 213 (58.0%) | 22 (6.1%) |
| College / Associate Degree | 127 (71.3%) | 15 (8.7%) |
| Bachelor's Degree or higher | 50 (87.7%) | 2 (4.0%) |
| Total | 449 (63.9%) | 41 (5.8%) |
Employment Occupations by Sex in Winfield
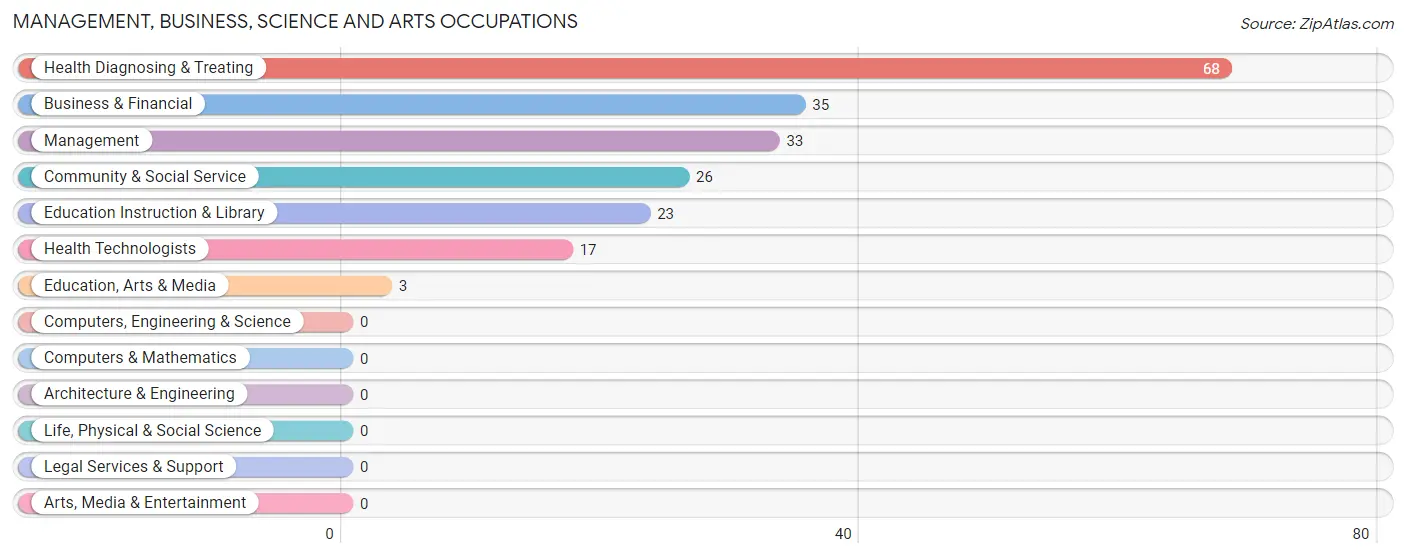
Management, Business, Science and Arts Occupations
The most common Management, Business, Science and Arts occupations in Winfield are Health Diagnosing & Treating (68 | 12.9%), Business & Financial (35 | 6.6%), Management (33 | 6.2%), Community & Social Service (26 | 4.9%), and Education Instruction & Library (23 | 4.3%).
Management, Business, Science and Arts Occupations by Sex
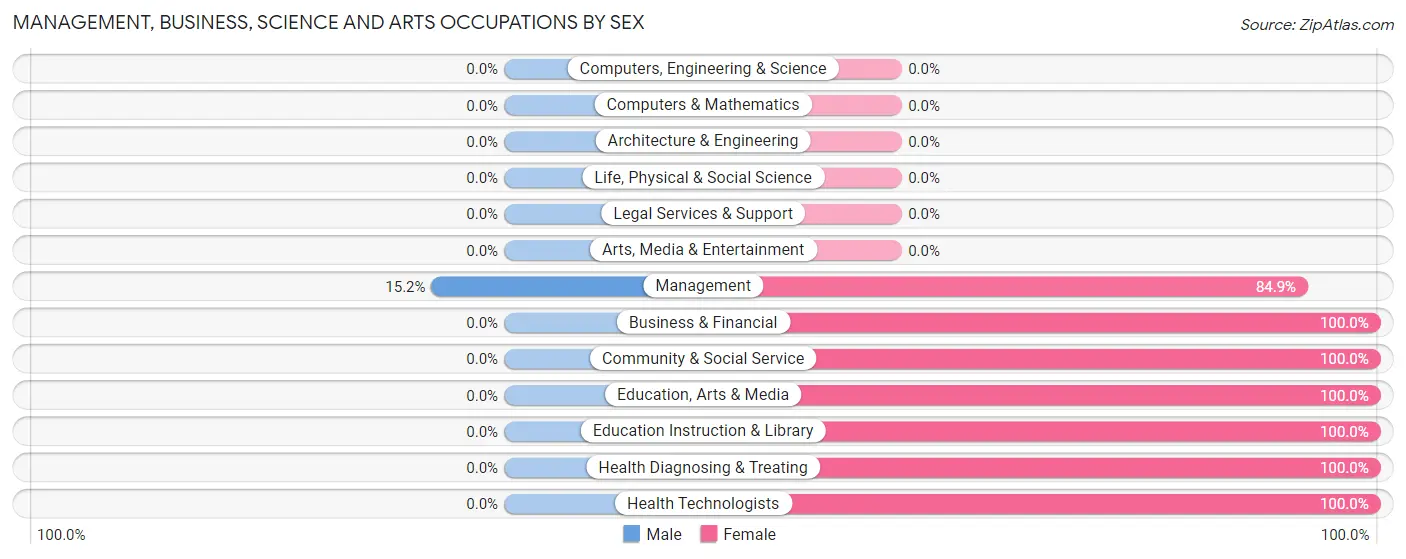
| Occupation | Male | Female |
| Management | 5 (15.1%) | 28 (84.9%) |
| Business & Financial | 0 (0.0%) | 35 (100.0%) |
| Computers, Engineering & Science | 0 (0.0%) | 0 (0.0%) |
| Computers & Mathematics | 0 (0.0%) | 0 (0.0%) |
| Architecture & Engineering | 0 (0.0%) | 0 (0.0%) |
| Life, Physical & Social Science | 0 (0.0%) | 0 (0.0%) |
| Community & Social Service | 0 (0.0%) | 26 (100.0%) |
| Education, Arts & Media | 0 (0.0%) | 3 (100.0%) |
| Legal Services & Support | 0 (0.0%) | 0 (0.0%) |
| Education Instruction & Library | 0 (0.0%) | 23 (100.0%) |
| Arts, Media & Entertainment | 0 (0.0%) | 0 (0.0%) |
| Health Diagnosing & Treating | 0 (0.0%) | 68 (100.0%) |
| Health Technologists | 0 (0.0%) | 17 (100.0%) |
| Total (Category) | 5 (3.1%) | 157 (96.9%) |
| Total (Overall) | 271 (51.2%) | 258 (48.8%) |
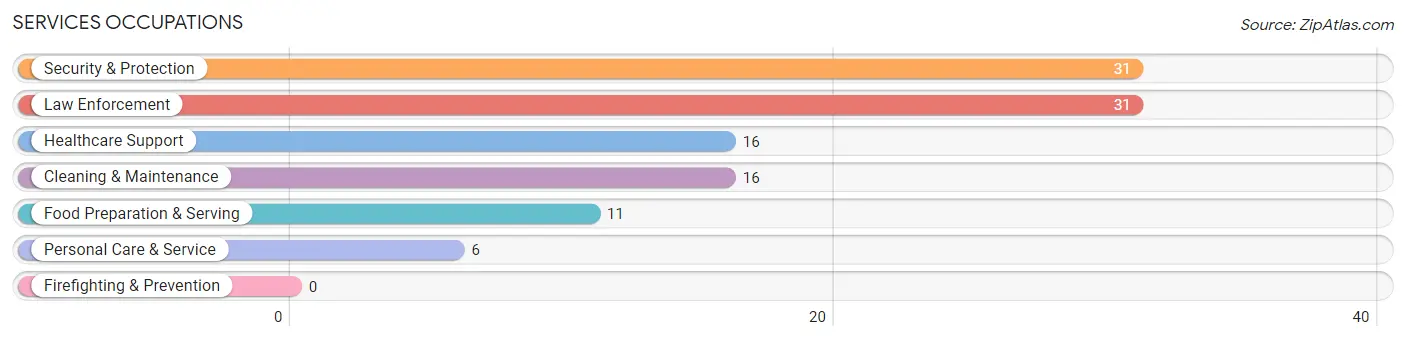
Services Occupations
The most common Services occupations in Winfield are Security & Protection (31 | 5.9%), Law Enforcement (31 | 5.9%), Healthcare Support (16 | 3.0%), Cleaning & Maintenance (16 | 3.0%), and Food Preparation & Serving (11 | 2.1%).
Services Occupations by Sex
Within the Services occupations in Winfield, the most male-oriented occupations are Cleaning & Maintenance (100.0%), Security & Protection (64.5%), and Law Enforcement (64.5%), while the most female-oriented occupations are Healthcare Support (100.0%), Food Preparation & Serving (100.0%), and Personal Care & Service (100.0%).
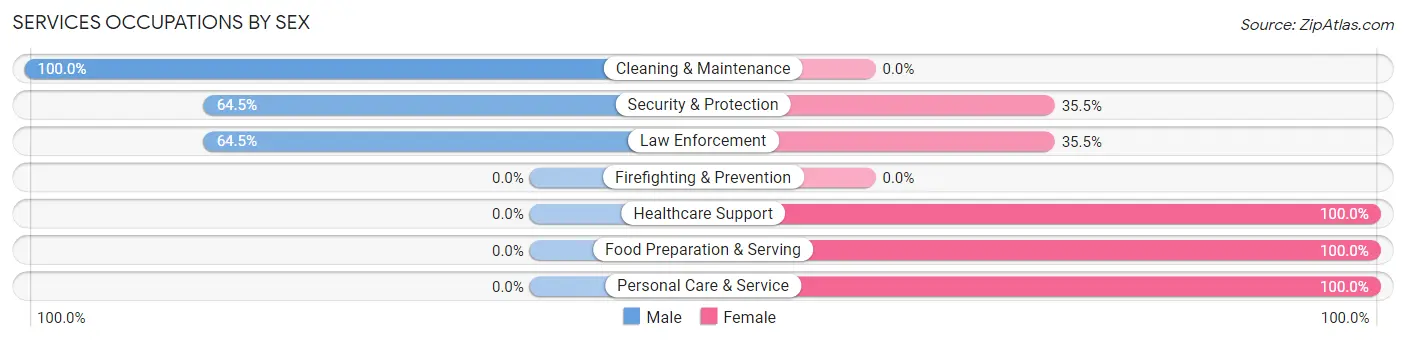
| Occupation | Male | Female |
| Healthcare Support | 0 (0.0%) | 16 (100.0%) |
| Security & Protection | 20 (64.5%) | 11 (35.5%) |
| Firefighting & Prevention | 0 (0.0%) | 0 (0.0%) |
| Law Enforcement | 20 (64.5%) | 11 (35.5%) |
| Food Preparation & Serving | 0 (0.0%) | 11 (100.0%) |
| Cleaning & Maintenance | 16 (100.0%) | 0 (0.0%) |
| Personal Care & Service | 0 (0.0%) | 6 (100.0%) |
| Total (Category) | 36 (45.0%) | 44 (55.0%) |
| Total (Overall) | 271 (51.2%) | 258 (48.8%) |
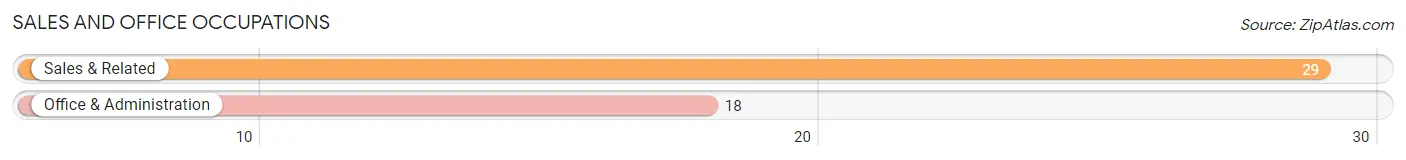
Sales and Office Occupations
The most common Sales and Office occupations in Winfield are Sales & Related (29 | 5.5%), and Office & Administration (18 | 3.4%).
Sales and Office Occupations by Sex
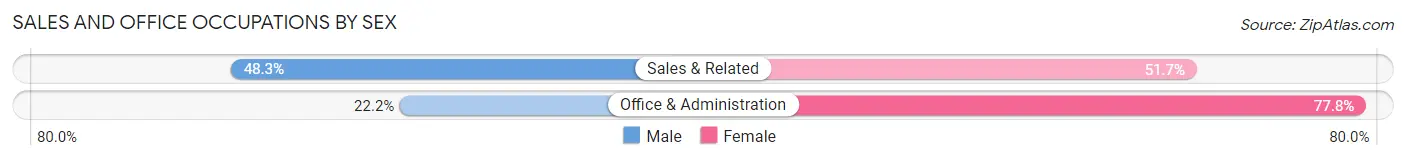
| Occupation | Male | Female |
| Sales & Related | 14 (48.3%) | 15 (51.7%) |
| Office & Administration | 4 (22.2%) | 14 (77.8%) |
| Total (Category) | 18 (38.3%) | 29 (61.7%) |
| Total (Overall) | 271 (51.2%) | 258 (48.8%) |
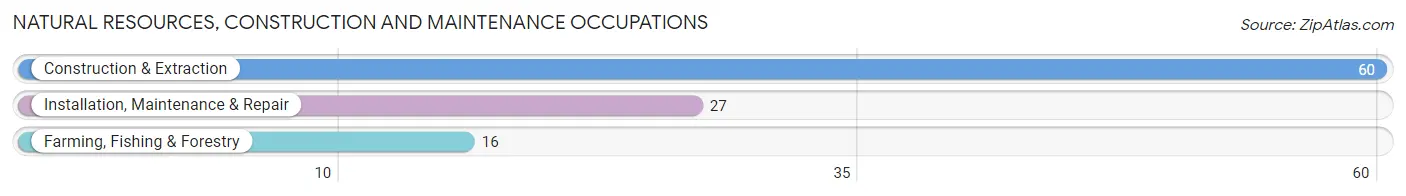
Natural Resources, Construction and Maintenance Occupations
The most common Natural Resources, Construction and Maintenance occupations in Winfield are Construction & Extraction (60 | 11.3%), Installation, Maintenance & Repair (27 | 5.1%), and Farming, Fishing & Forestry (16 | 3.0%).
Natural Resources, Construction and Maintenance Occupations by Sex
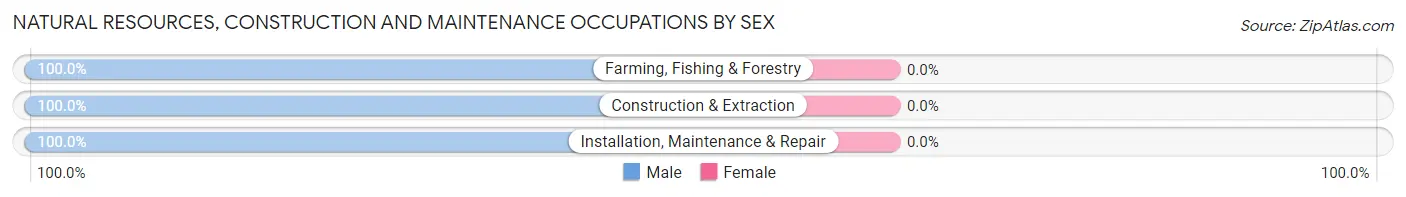
| Occupation | Male | Female |
| Farming, Fishing & Forestry | 16 (100.0%) | 0 (0.0%) |
| Construction & Extraction | 60 (100.0%) | 0 (0.0%) |
| Installation, Maintenance & Repair | 27 (100.0%) | 0 (0.0%) |
| Total (Category) | 103 (100.0%) | 0 (0.0%) |
| Total (Overall) | 271 (51.2%) | 258 (48.8%) |
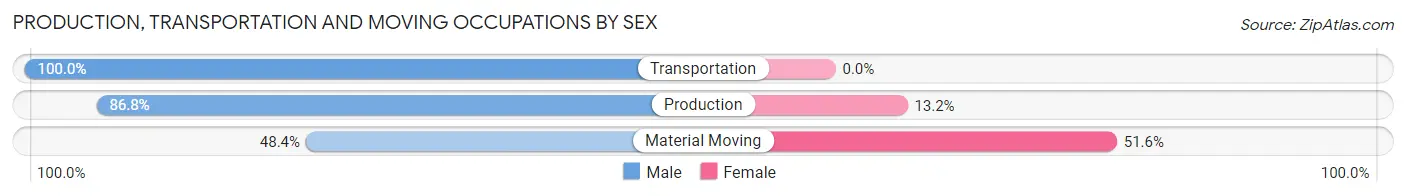
Production, Transportation and Moving Occupations
The most common Production, Transportation and Moving occupations in Winfield are Production (91 | 17.2%), Material Moving (31 | 5.9%), and Transportation (15 | 2.8%).
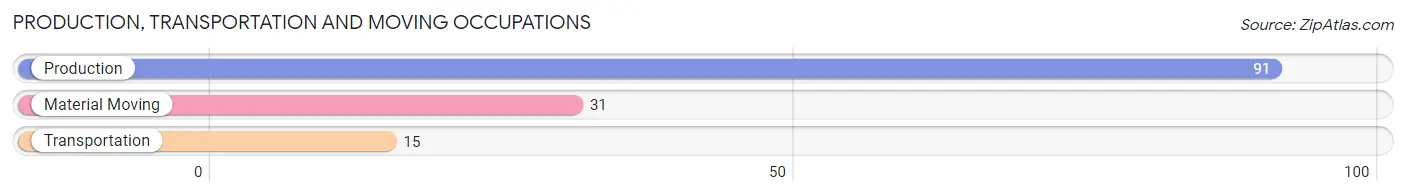
Production, Transportation and Moving Occupations by Sex
| Occupation | Male | Female |
| Production | 79 (86.8%) | 12 (13.2%) |
| Transportation | 15 (100.0%) | 0 (0.0%) |
| Material Moving | 15 (48.4%) | 16 (51.6%) |
| Total (Category) | 109 (79.6%) | 28 (20.4%) |
| Total (Overall) | 271 (51.2%) | 258 (48.8%) |
Employment Industries by Sex in Winfield
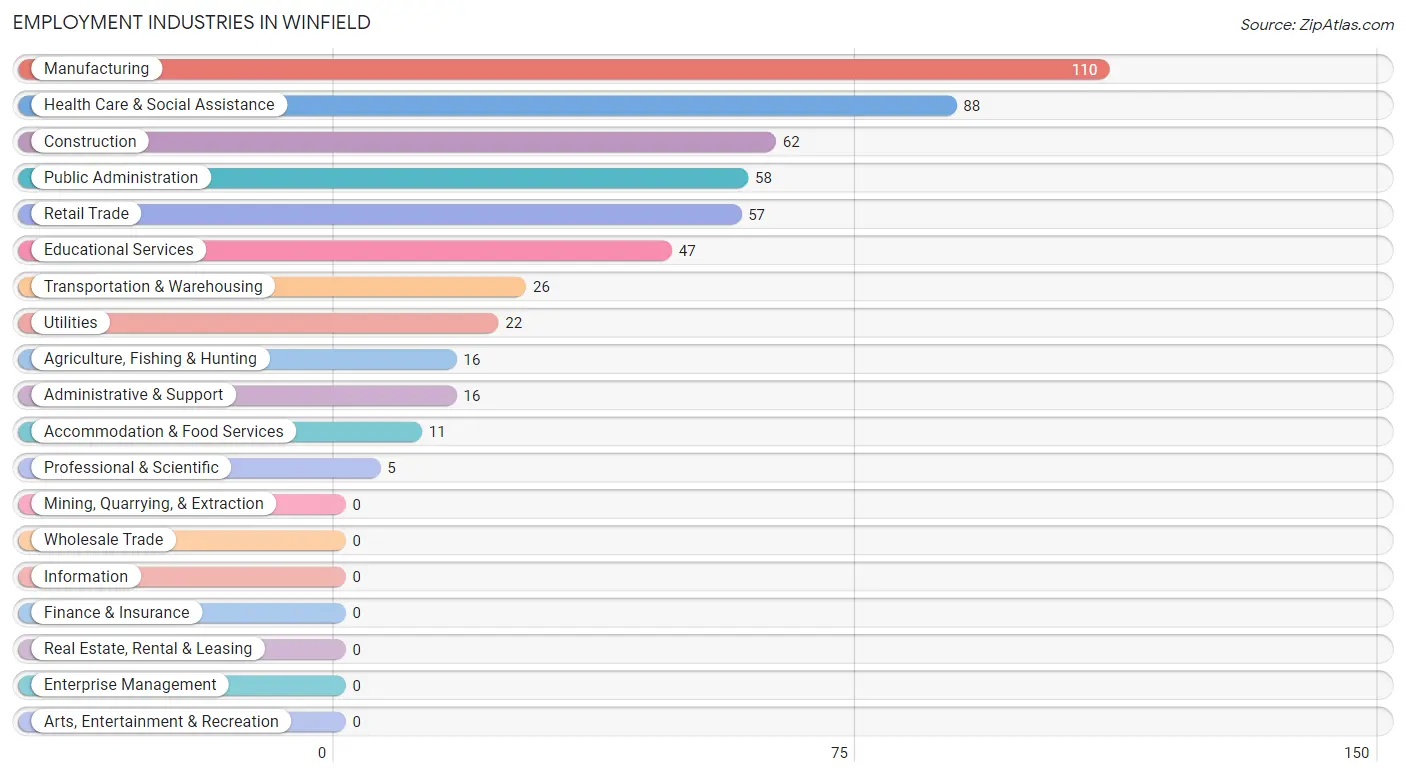
Employment Industries in Winfield
The major employment industries in Winfield include Manufacturing (110 | 20.8%), Health Care & Social Assistance (88 | 16.6%), Construction (62 | 11.7%), Public Administration (58 | 11.0%), and Retail Trade (57 | 10.8%).
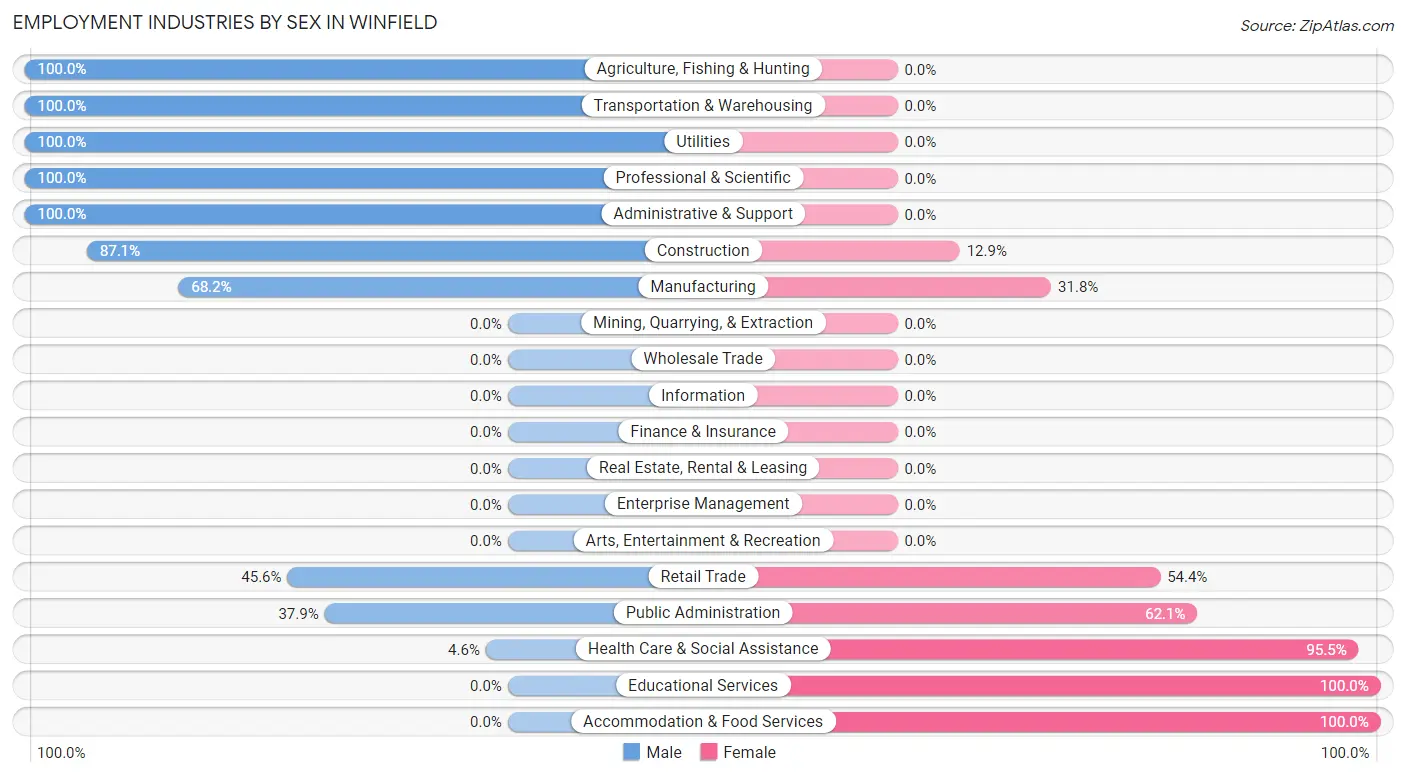
Employment Industries by Sex in Winfield
The Winfield industries that see more men than women are Agriculture, Fishing & Hunting (100.0%), Transportation & Warehousing (100.0%), and Utilities (100.0%), whereas the industries that tend to have a higher number of women are Educational Services (100.0%), Accommodation & Food Services (100.0%), and Health Care & Social Assistance (95.5%).
| Industry | Male | Female |
| Agriculture, Fishing & Hunting | 16 (100.0%) | 0 (0.0%) |
| Mining, Quarrying, & Extraction | 0 (0.0%) | 0 (0.0%) |
| Construction | 54 (87.1%) | 8 (12.9%) |
| Manufacturing | 75 (68.2%) | 35 (31.8%) |
| Wholesale Trade | 0 (0.0%) | 0 (0.0%) |
| Retail Trade | 26 (45.6%) | 31 (54.4%) |
| Transportation & Warehousing | 26 (100.0%) | 0 (0.0%) |
| Utilities | 22 (100.0%) | 0 (0.0%) |
| Information | 0 (0.0%) | 0 (0.0%) |
| Finance & Insurance | 0 (0.0%) | 0 (0.0%) |
| Real Estate, Rental & Leasing | 0 (0.0%) | 0 (0.0%) |
| Professional & Scientific | 5 (100.0%) | 0 (0.0%) |
| Enterprise Management | 0 (0.0%) | 0 (0.0%) |
| Administrative & Support | 16 (100.0%) | 0 (0.0%) |
| Educational Services | 0 (0.0%) | 47 (100.0%) |
| Health Care & Social Assistance | 4 (4.5%) | 84 (95.5%) |
| Arts, Entertainment & Recreation | 0 (0.0%) | 0 (0.0%) |
| Accommodation & Food Services | 0 (0.0%) | 11 (100.0%) |
| Public Administration | 22 (37.9%) | 36 (62.1%) |
| Total | 271 (51.2%) | 258 (48.8%) |
Education in Winfield
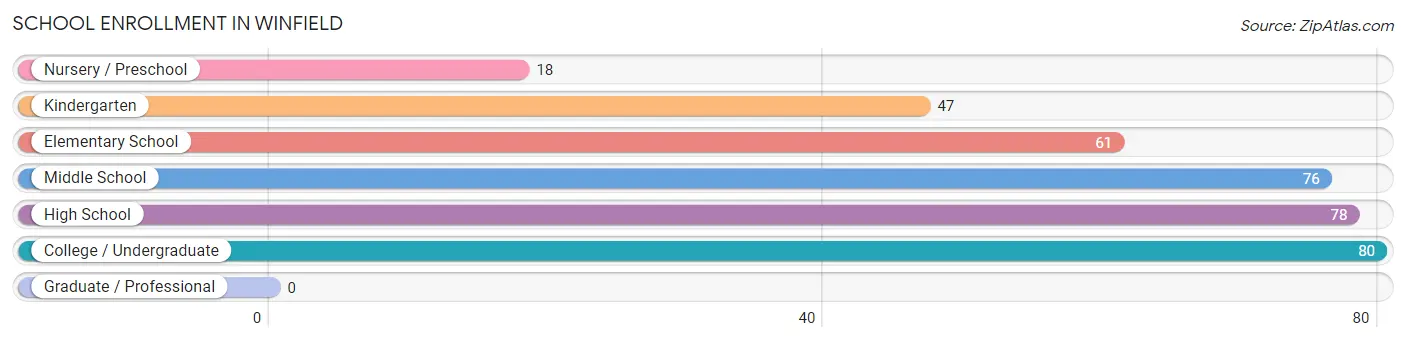
School Enrollment in Winfield
The most common levels of schooling among the 360 students in Winfield are college / undergraduate (80 | 22.2%), high school (78 | 21.7%), and middle school (76 | 21.1%).
| School Level | # Students | % Students |
| Nursery / Preschool | 18 | 5.0% |
| Kindergarten | 47 | 13.1% |
| Elementary School | 61 | 16.9% |
| Middle School | 76 | 21.1% |
| High School | 78 | 21.7% |
| College / Undergraduate | 80 | 22.2% |
| Graduate / Professional | 0 | 0.0% |
| Total | 360 | 100.0% |
School Enrollment by Age by Funding Source in Winfield
Out of a total of 360 students who are enrolled in schools in Winfield, 7 (1.9%) attend a private institution, while the remaining 353 (98.1%) are enrolled in public schools. The age group of 15 to 17 year olds has the highest likelihood of being enrolled in private schools, with 5 (8.2% in the age bracket) enrolled. Conversely, the age group of 3 to 4 year olds has the lowest likelihood of being enrolled in a private school, with 13 (100.0% in the age bracket) attending a public institution.
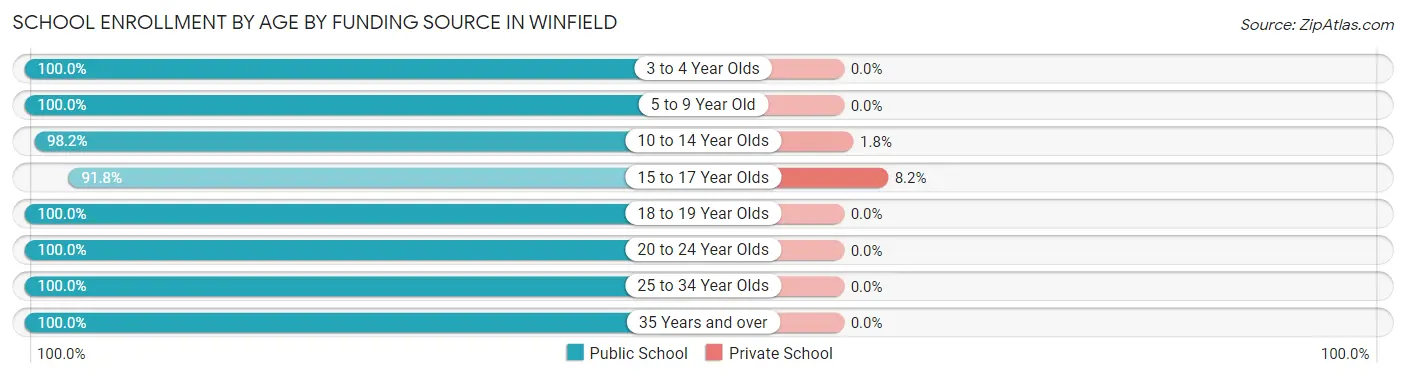
| Age Bracket | Public School | Private School |
| 3 to 4 Year Olds | 13 (100.0%) | 0 (0.0%) |
| 5 to 9 Year Old | 93 (100.0%) | 0 (0.0%) |
| 10 to 14 Year Olds | 111 (98.2%) | 2 (1.8%) |
| 15 to 17 Year Olds | 56 (91.8%) | 5 (8.2%) |
| 18 to 19 Year Olds | 10 (100.0%) | 0 (0.0%) |
| 20 to 24 Year Olds | 37 (100.0%) | 0 (0.0%) |
| 25 to 34 Year Olds | 28 (100.0%) | 0 (0.0%) |
| 35 Years and over | 5 (100.0%) | 0 (0.0%) |
| Total | 353 (98.1%) | 7 (1.9%) |
Educational Attainment by Field of Study in Winfield
Arts & humanities (22 | 22.5%), education (20 | 20.4%), business (15 | 15.3%), psychology (13 | 13.3%), and social sciences (8 | 8.2%) are the most common fields of study among 98 individuals in Winfield who have obtained a bachelor's degree or higher.
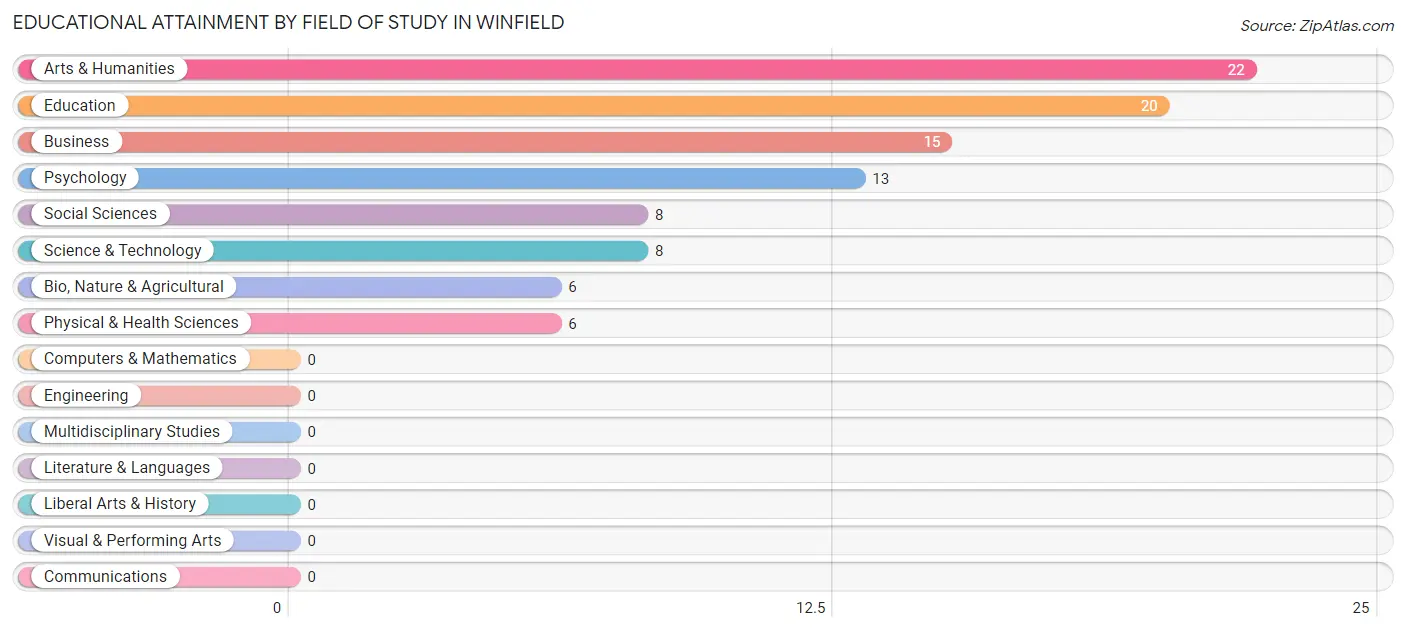
| Field of Study | # Graduates | % Graduates |
| Computers & Mathematics | 0 | 0.0% |
| Bio, Nature & Agricultural | 6 | 6.1% |
| Physical & Health Sciences | 6 | 6.1% |
| Psychology | 13 | 13.3% |
| Social Sciences | 8 | 8.2% |
| Engineering | 0 | 0.0% |
| Multidisciplinary Studies | 0 | 0.0% |
| Science & Technology | 8 | 8.2% |
| Business | 15 | 15.3% |
| Education | 20 | 20.4% |
| Literature & Languages | 0 | 0.0% |
| Liberal Arts & History | 0 | 0.0% |
| Visual & Performing Arts | 0 | 0.0% |
| Communications | 0 | 0.0% |
| Arts & Humanities | 22 | 22.5% |
| Total | 98 | 100.0% |
Transportation & Commute in Winfield
Vehicle Availability by Sex in Winfield
The most prevalent vehicle ownership categories in Winfield are males with 4 vehicles (121, accounting for 44.7%) and females with 4 vehicles (93, making up 48.0%).
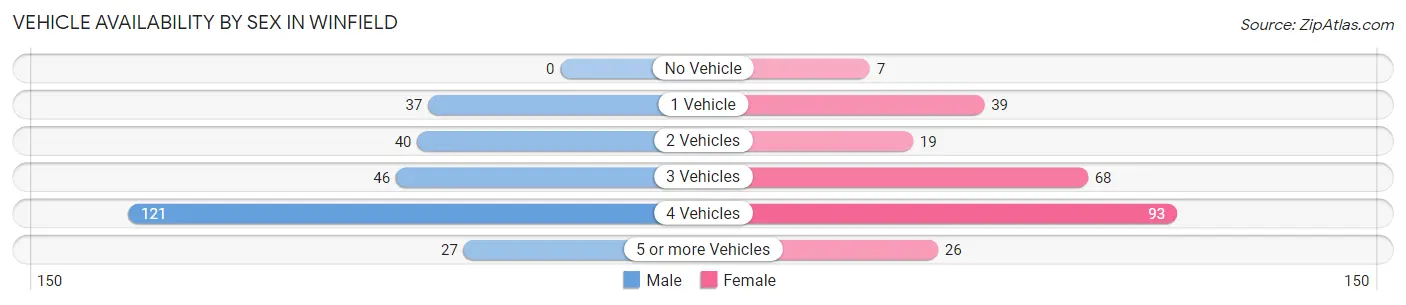
| Vehicles Available | Male | Female |
| No Vehicle | 0 (0.0%) | 7 (2.8%) |
| 1 Vehicle | 37 (13.7%) | 39 (15.5%) |
| 2 Vehicles | 40 (14.8%) | 19 (7.5%) |
| 3 Vehicles | 46 (17.0%) | 68 (27.0%) |
| 4 Vehicles | 121 (44.7%) | 93 (36.9%) |
| 5 or more Vehicles | 27 (10.0%) | 26 (10.3%) |
| Total | 271 (100.0%) | 252 (100.0%) |
Commute Time in Winfield
The most frequently occuring commute durations in Winfield are 10 to 14 minutes (95 commuters, 18.8%), 20 to 24 minutes (84 commuters, 16.6%), and 15 to 19 minutes (72 commuters, 14.3%).
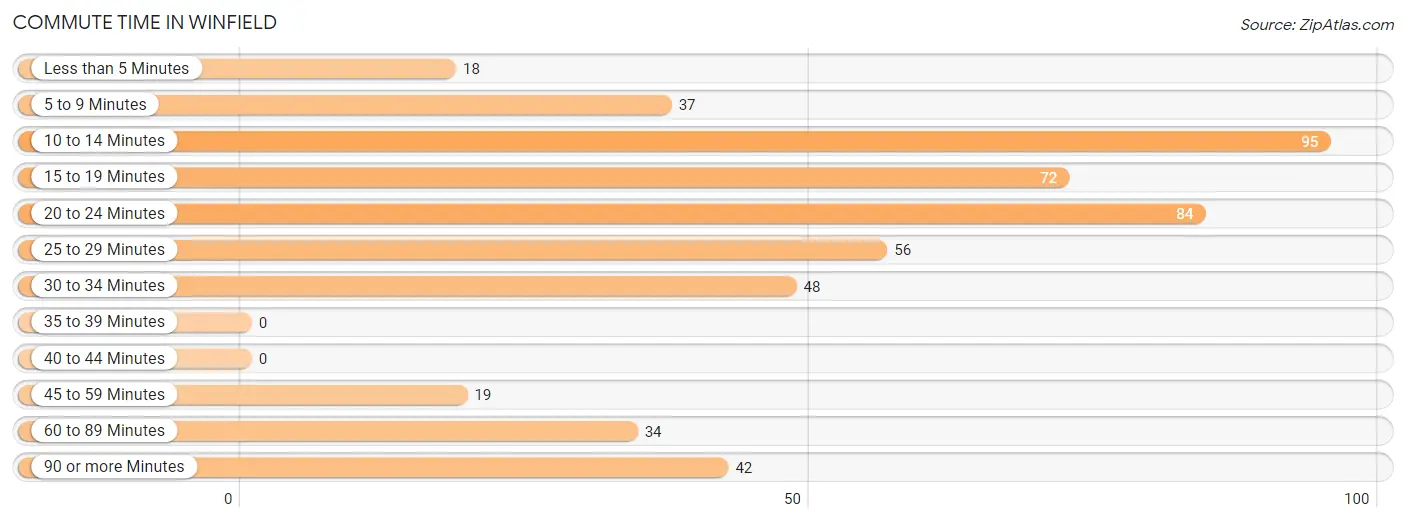
| Commute Time | # Commuters | % Commuters |
| Less than 5 Minutes | 18 | 3.6% |
| 5 to 9 Minutes | 37 | 7.3% |
| 10 to 14 Minutes | 95 | 18.8% |
| 15 to 19 Minutes | 72 | 14.3% |
| 20 to 24 Minutes | 84 | 16.6% |
| 25 to 29 Minutes | 56 | 11.1% |
| 30 to 34 Minutes | 48 | 9.5% |
| 35 to 39 Minutes | 0 | 0.0% |
| 40 to 44 Minutes | 0 | 0.0% |
| 45 to 59 Minutes | 19 | 3.8% |
| 60 to 89 Minutes | 34 | 6.7% |
| 90 or more Minutes | 42 | 8.3% |
Commute Time by Sex in Winfield
The most common commute times in Winfield are 10 to 14 minutes (80 commuters, 31.6%) for males and 20 to 24 minutes (51 commuters, 20.2%) for females.
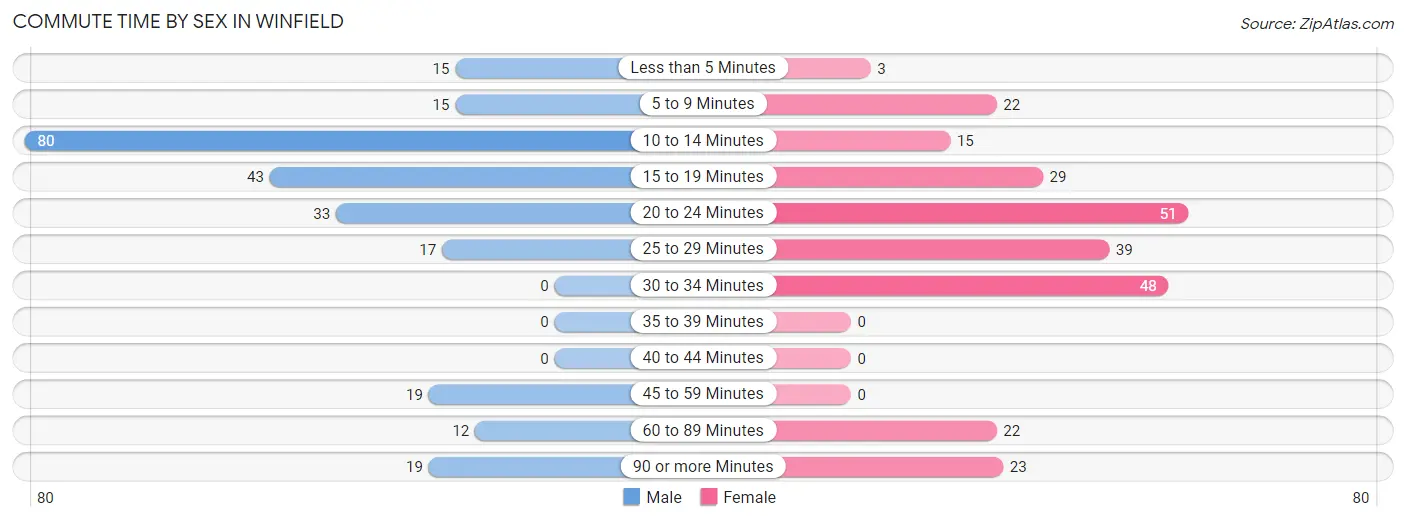
| Commute Time | Male | Female |
| Less than 5 Minutes | 15 (5.9%) | 3 (1.2%) |
| 5 to 9 Minutes | 15 (5.9%) | 22 (8.7%) |
| 10 to 14 Minutes | 80 (31.6%) | 15 (5.9%) |
| 15 to 19 Minutes | 43 (17.0%) | 29 (11.5%) |
| 20 to 24 Minutes | 33 (13.0%) | 51 (20.2%) |
| 25 to 29 Minutes | 17 (6.7%) | 39 (15.5%) |
| 30 to 34 Minutes | 0 (0.0%) | 48 (19.1%) |
| 35 to 39 Minutes | 0 (0.0%) | 0 (0.0%) |
| 40 to 44 Minutes | 0 (0.0%) | 0 (0.0%) |
| 45 to 59 Minutes | 19 (7.5%) | 0 (0.0%) |
| 60 to 89 Minutes | 12 (4.7%) | 22 (8.7%) |
| 90 or more Minutes | 19 (7.5%) | 23 (9.1%) |
Time of Departure to Work by Sex in Winfield
The most frequent times of departure to work in Winfield are 6:30 AM to 6:59 AM (79, 31.2%) for males and 7:00 AM to 7:29 AM (47, 18.6%) for females.
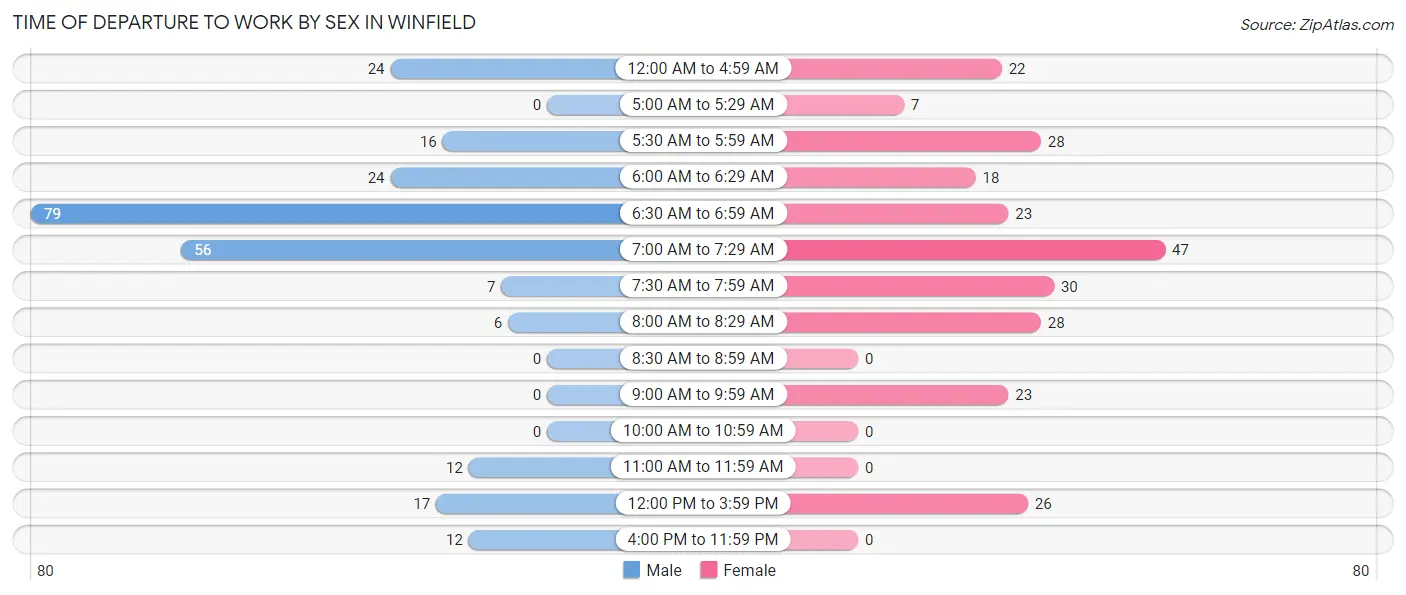
| Time of Departure | Male | Female |
| 12:00 AM to 4:59 AM | 24 (9.5%) | 22 (8.7%) |
| 5:00 AM to 5:29 AM | 0 (0.0%) | 7 (2.8%) |
| 5:30 AM to 5:59 AM | 16 (6.3%) | 28 (11.1%) |
| 6:00 AM to 6:29 AM | 24 (9.5%) | 18 (7.1%) |
| 6:30 AM to 6:59 AM | 79 (31.2%) | 23 (9.1%) |
| 7:00 AM to 7:29 AM | 56 (22.1%) | 47 (18.6%) |
| 7:30 AM to 7:59 AM | 7 (2.8%) | 30 (11.9%) |
| 8:00 AM to 8:29 AM | 6 (2.4%) | 28 (11.1%) |
| 8:30 AM to 8:59 AM | 0 (0.0%) | 0 (0.0%) |
| 9:00 AM to 9:59 AM | 0 (0.0%) | 23 (9.1%) |
| 10:00 AM to 10:59 AM | 0 (0.0%) | 0 (0.0%) |
| 11:00 AM to 11:59 AM | 12 (4.7%) | 0 (0.0%) |
| 12:00 PM to 3:59 PM | 17 (6.7%) | 26 (10.3%) |
| 4:00 PM to 11:59 PM | 12 (4.7%) | 0 (0.0%) |
| Total | 253 (100.0%) | 252 (100.0%) |
Housing Occupancy in Winfield
Occupancy by Ownership in Winfield
Of the total 518 dwellings in Winfield, owner-occupied units account for 376 (72.6%), while renter-occupied units make up 142 (27.4%).
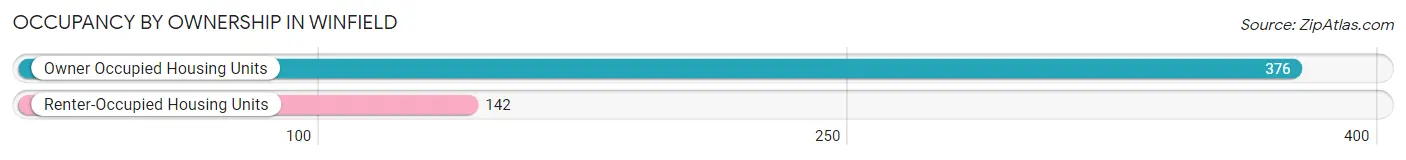
| Occupancy | # Housing Units | % Housing Units |
| Owner Occupied Housing Units | 376 | 72.6% |
| Renter-Occupied Housing Units | 142 | 27.4% |
| Total Occupied Housing Units | 518 | 100.0% |
Occupancy by Household Size in Winfield
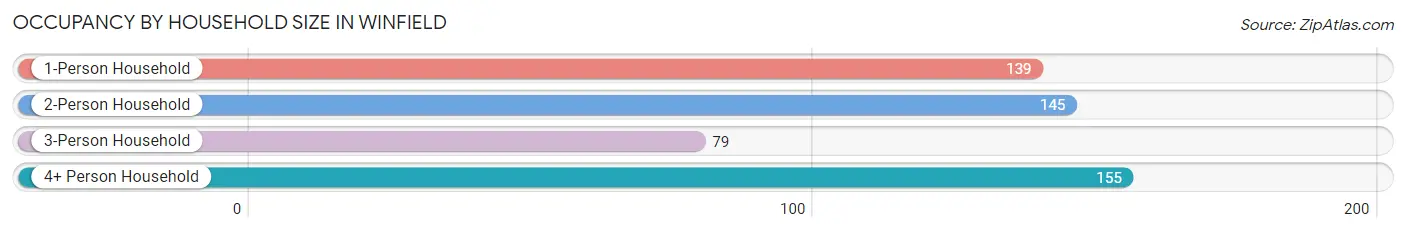
| Household Size | # Housing Units | % Housing Units |
| 1-Person Household | 139 | 26.8% |
| 2-Person Household | 145 | 28.0% |
| 3-Person Household | 79 | 15.2% |
| 4+ Person Household | 155 | 29.9% |
| Total Housing Units | 518 | 100.0% |
Occupancy by Ownership by Household Size in Winfield
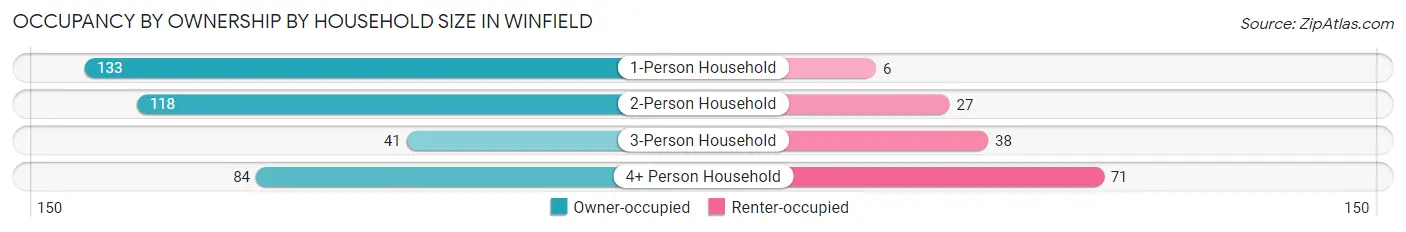
| Household Size | Owner-occupied | Renter-occupied |
| 1-Person Household | 133 (95.7%) | 6 (4.3%) |
| 2-Person Household | 118 (81.4%) | 27 (18.6%) |
| 3-Person Household | 41 (51.9%) | 38 (48.1%) |
| 4+ Person Household | 84 (54.2%) | 71 (45.8%) |
| Total Housing Units | 376 (72.6%) | 142 (27.4%) |
Occupancy by Educational Attainment in Winfield
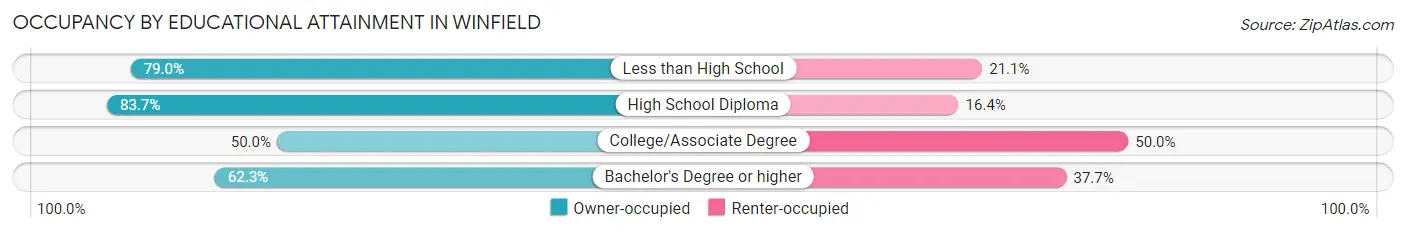
| Household Size | Owner-occupied | Renter-occupied |
| Less than High School | 60 (78.9%) | 16 (21.0%) |
| High School Diploma | 220 (83.7%) | 43 (16.4%) |
| College/Associate Degree | 63 (50.0%) | 63 (50.0%) |
| Bachelor's Degree or higher | 33 (62.3%) | 20 (37.7%) |
Occupancy by Age of Householder in Winfield
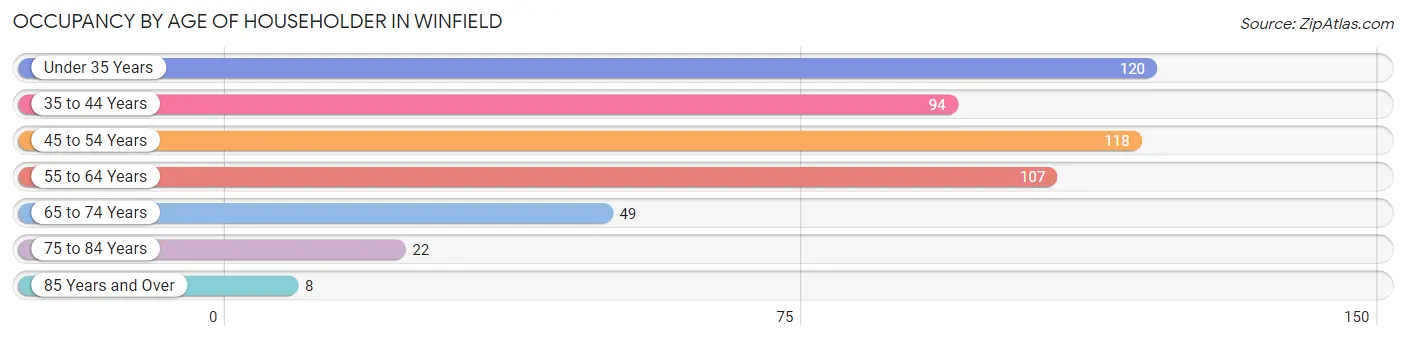
| Age Bracket | # Households | % Households |
| Under 35 Years | 120 | 23.2% |
| 35 to 44 Years | 94 | 18.1% |
| 45 to 54 Years | 118 | 22.8% |
| 55 to 64 Years | 107 | 20.7% |
| 65 to 74 Years | 49 | 9.5% |
| 75 to 84 Years | 22 | 4.3% |
| 85 Years and Over | 8 | 1.5% |
| Total | 518 | 100.0% |
Housing Finances in Winfield
Median Income by Occupancy in Winfield
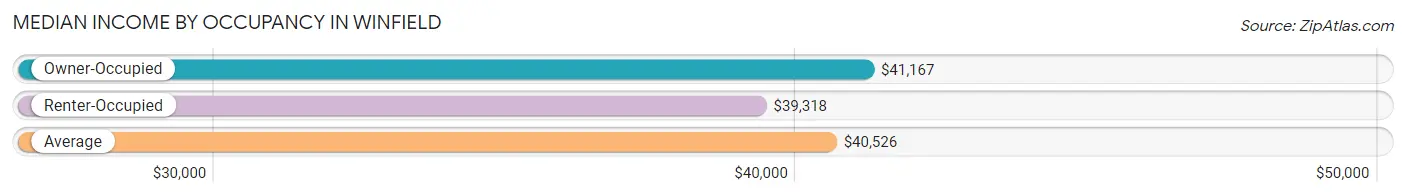
| Occupancy Type | # Households | Median Income |
| Owner-Occupied | 376 (72.6%) | $41,167 |
| Renter-Occupied | 142 (27.4%) | $39,318 |
| Average | 518 (100.0%) | $40,526 |
Occupancy by Householder Income Bracket in Winfield
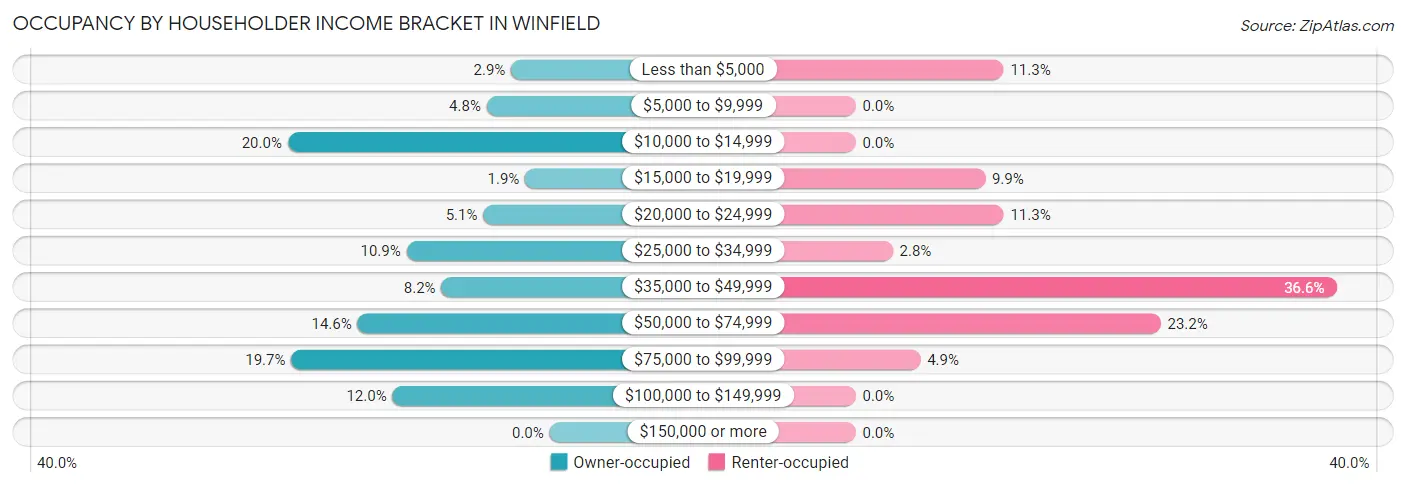
| Income Bracket | Owner-occupied | Renter-occupied |
| Less than $5,000 | 11 (2.9%) | 16 (11.3%) |
| $5,000 to $9,999 | 18 (4.8%) | 0 (0.0%) |
| $10,000 to $14,999 | 75 (20.0%) | 0 (0.0%) |
| $15,000 to $19,999 | 7 (1.9%) | 14 (9.9%) |
| $20,000 to $24,999 | 19 (5.1%) | 16 (11.3%) |
| $25,000 to $34,999 | 41 (10.9%) | 4 (2.8%) |
| $35,000 to $49,999 | 31 (8.2%) | 52 (36.6%) |
| $50,000 to $74,999 | 55 (14.6%) | 33 (23.2%) |
| $75,000 to $99,999 | 74 (19.7%) | 7 (4.9%) |
| $100,000 to $149,999 | 45 (12.0%) | 0 (0.0%) |
| $150,000 or more | 0 (0.0%) | 0 (0.0%) |
| Total | 376 (100.0%) | 142 (100.0%) |
Monthly Housing Cost Tiers in Winfield
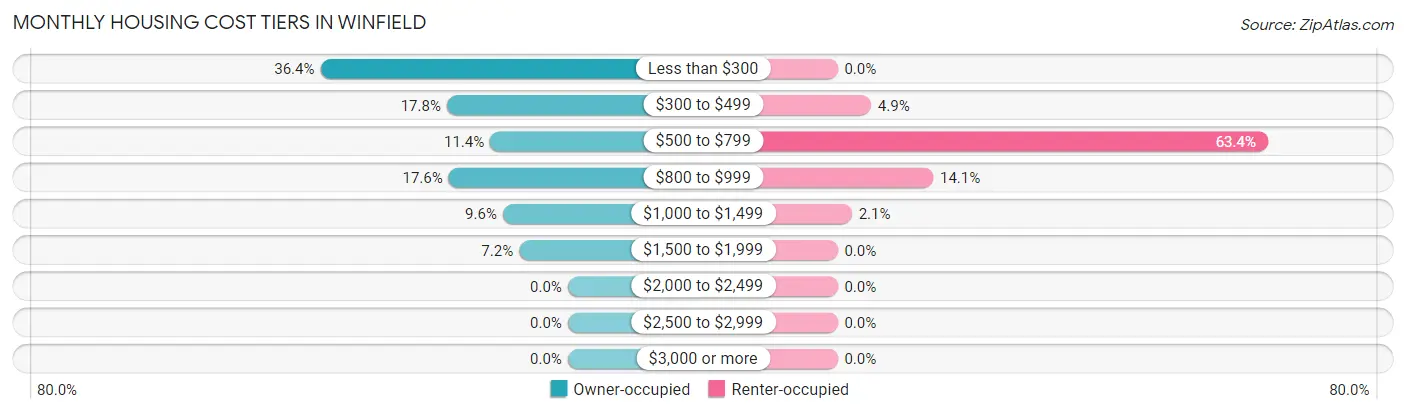
| Monthly Cost | Owner-occupied | Renter-occupied |
| Less than $300 | 137 (36.4%) | 0 (0.0%) |
| $300 to $499 | 67 (17.8%) | 7 (4.9%) |
| $500 to $799 | 43 (11.4%) | 90 (63.4%) |
| $800 to $999 | 66 (17.5%) | 20 (14.1%) |
| $1,000 to $1,499 | 36 (9.6%) | 3 (2.1%) |
| $1,500 to $1,999 | 27 (7.2%) | 0 (0.0%) |
| $2,000 to $2,499 | 0 (0.0%) | 0 (0.0%) |
| $2,500 to $2,999 | 0 (0.0%) | 0 (0.0%) |
| $3,000 or more | 0 (0.0%) | 0 (0.0%) |
| Total | 376 (100.0%) | 142 (100.0%) |
Physical Housing Characteristics in Winfield
Housing Structures in Winfield
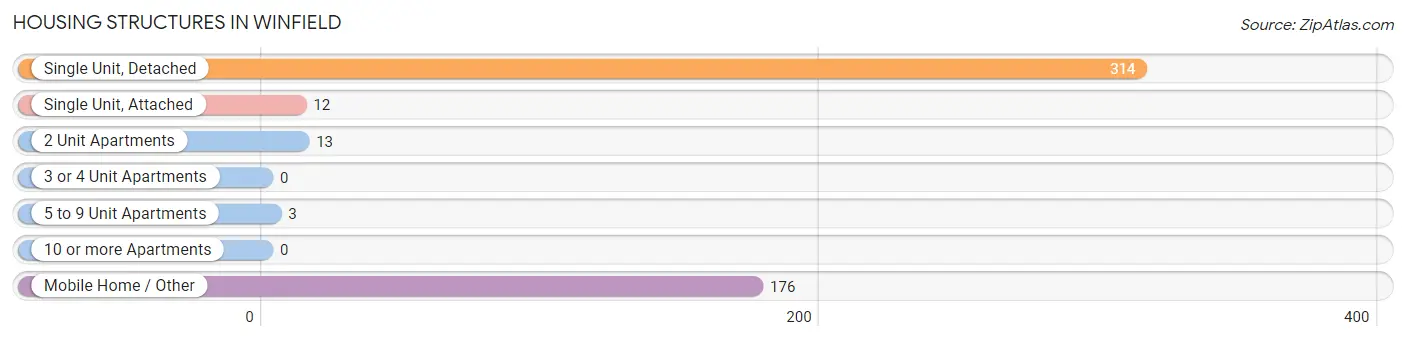
| Structure Type | # Housing Units | % Housing Units |
| Single Unit, Detached | 314 | 60.6% |
| Single Unit, Attached | 12 | 2.3% |
| 2 Unit Apartments | 13 | 2.5% |
| 3 or 4 Unit Apartments | 0 | 0.0% |
| 5 to 9 Unit Apartments | 3 | 0.6% |
| 10 or more Apartments | 0 | 0.0% |
| Mobile Home / Other | 176 | 34.0% |
| Total | 518 | 100.0% |
Housing Structures by Occupancy in Winfield
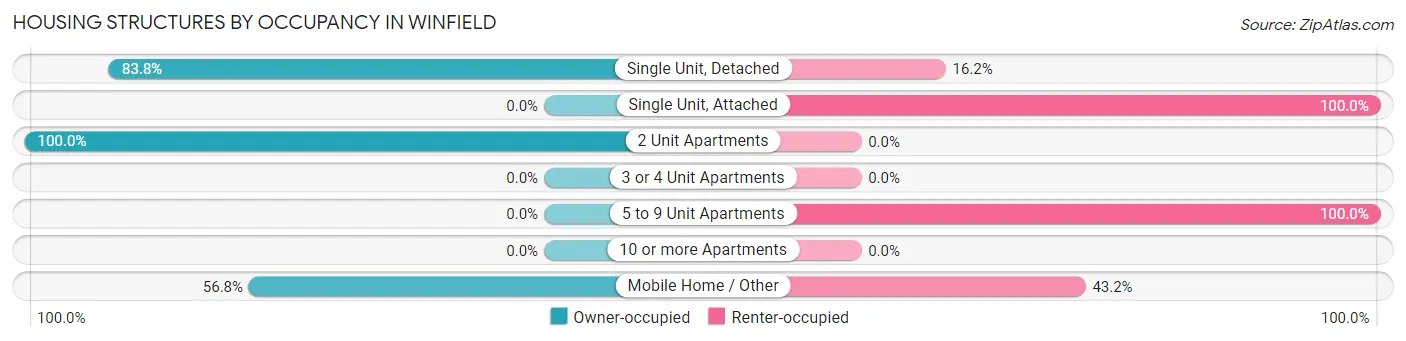
| Structure Type | Owner-occupied | Renter-occupied |
| Single Unit, Detached | 263 (83.8%) | 51 (16.2%) |
| Single Unit, Attached | 0 (0.0%) | 12 (100.0%) |
| 2 Unit Apartments | 13 (100.0%) | 0 (0.0%) |
| 3 or 4 Unit Apartments | 0 (0.0%) | 0 (0.0%) |
| 5 to 9 Unit Apartments | 0 (0.0%) | 3 (100.0%) |
| 10 or more Apartments | 0 (0.0%) | 0 (0.0%) |
| Mobile Home / Other | 100 (56.8%) | 76 (43.2%) |
| Total | 376 (72.6%) | 142 (27.4%) |
Housing Structures by Number of Rooms in Winfield
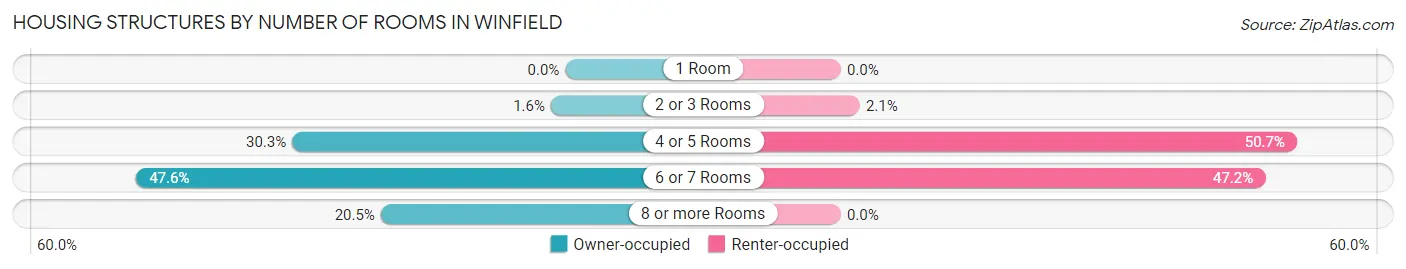
| Number of Rooms | Owner-occupied | Renter-occupied |
| 1 Room | 0 (0.0%) | 0 (0.0%) |
| 2 or 3 Rooms | 6 (1.6%) | 3 (2.1%) |
| 4 or 5 Rooms | 114 (30.3%) | 72 (50.7%) |
| 6 or 7 Rooms | 179 (47.6%) | 67 (47.2%) |
| 8 or more Rooms | 77 (20.5%) | 0 (0.0%) |
| Total | 376 (100.0%) | 142 (100.0%) |
Housing Structure by Heating Type in Winfield
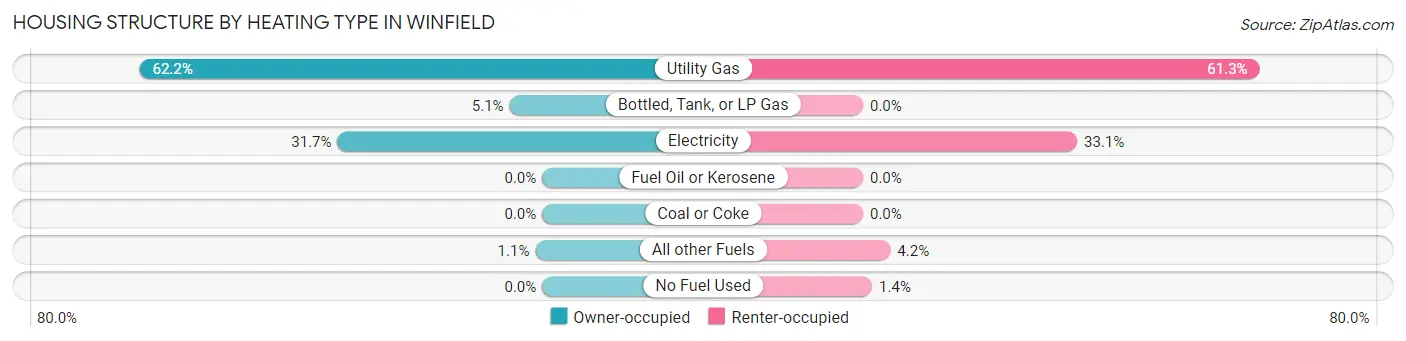
| Heating Type | Owner-occupied | Renter-occupied |
| Utility Gas | 234 (62.2%) | 87 (61.3%) |
| Bottled, Tank, or LP Gas | 19 (5.1%) | 0 (0.0%) |
| Electricity | 119 (31.7%) | 47 (33.1%) |
| Fuel Oil or Kerosene | 0 (0.0%) | 0 (0.0%) |
| Coal or Coke | 0 (0.0%) | 0 (0.0%) |
| All other Fuels | 4 (1.1%) | 6 (4.2%) |
| No Fuel Used | 0 (0.0%) | 2 (1.4%) |
| Total | 376 (100.0%) | 142 (100.0%) |
Household Vehicle Usage in Winfield
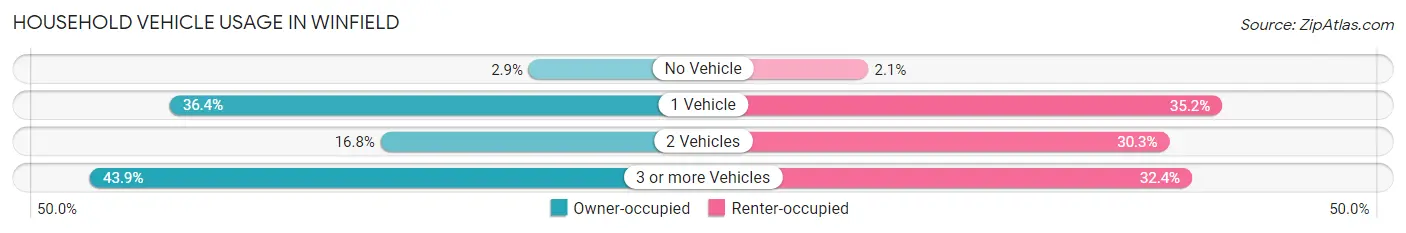
| Vehicles per Household | Owner-occupied | Renter-occupied |
| No Vehicle | 11 (2.9%) | 3 (2.1%) |
| 1 Vehicle | 137 (36.4%) | 50 (35.2%) |
| 2 Vehicles | 63 (16.8%) | 43 (30.3%) |
| 3 or more Vehicles | 165 (43.9%) | 46 (32.4%) |
| Total | 376 (100.0%) | 142 (100.0%) |
Real Estate & Mortgages in Winfield
Real Estate and Mortgage Overview in Winfield
| Characteristic | Without Mortgage | With Mortgage |
| Housing Units | 227 | 149 |
| Median Property Value | $100,500 | $99,400 |
| Median Household Income | $29,531 | $0 |
| Monthly Housing Costs | $240 | $0 |
| Real Estate Taxes | $378 | $10 |
Property Value by Mortgage Status in Winfield
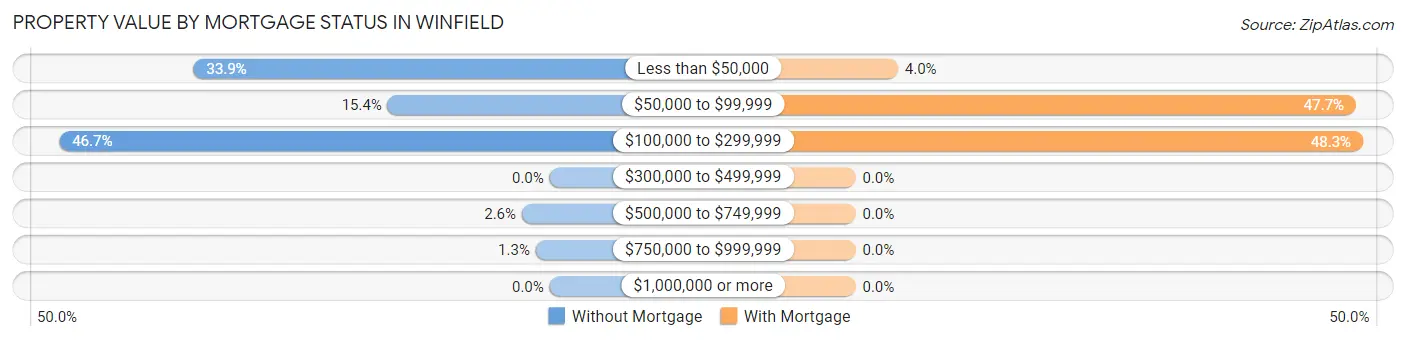
| Property Value | Without Mortgage | With Mortgage |
| Less than $50,000 | 77 (33.9%) | 6 (4.0%) |
| $50,000 to $99,999 | 35 (15.4%) | 71 (47.6%) |
| $100,000 to $299,999 | 106 (46.7%) | 72 (48.3%) |
| $300,000 to $499,999 | 0 (0.0%) | 0 (0.0%) |
| $500,000 to $749,999 | 6 (2.6%) | 0 (0.0%) |
| $750,000 to $999,999 | 3 (1.3%) | 0 (0.0%) |
| $1,000,000 or more | 0 (0.0%) | 0 (0.0%) |
| Total | 227 (100.0%) | 149 (100.0%) |
Household Income by Mortgage Status in Winfield
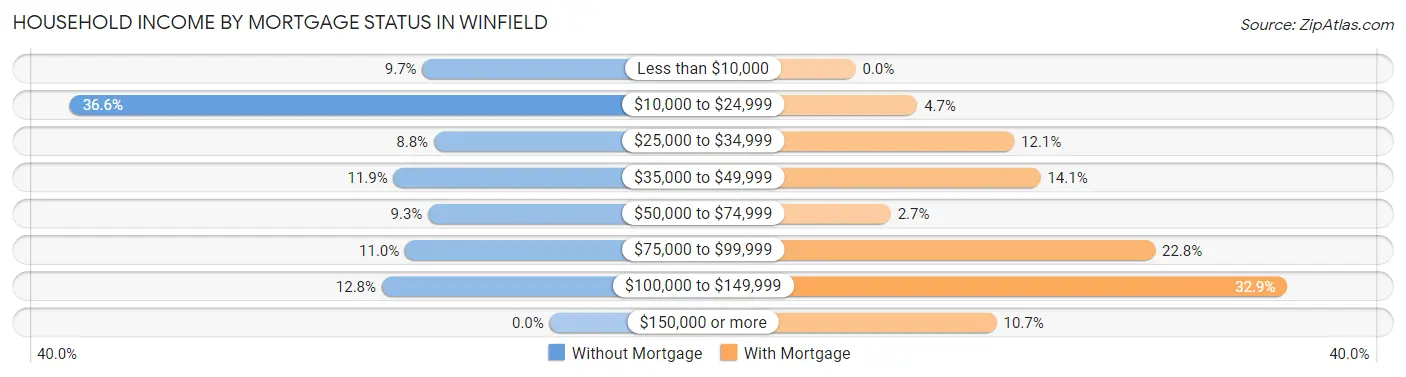
| Household Income | Without Mortgage | With Mortgage |
| Less than $10,000 | 22 (9.7%) | 0 (0.0%) |
| $10,000 to $24,999 | 83 (36.6%) | 7 (4.7%) |
| $25,000 to $34,999 | 20 (8.8%) | 18 (12.1%) |
| $35,000 to $49,999 | 27 (11.9%) | 21 (14.1%) |
| $50,000 to $74,999 | 21 (9.2%) | 4 (2.7%) |
| $75,000 to $99,999 | 25 (11.0%) | 34 (22.8%) |
| $100,000 to $149,999 | 29 (12.8%) | 49 (32.9%) |
| $150,000 or more | 0 (0.0%) | 16 (10.7%) |
| Total | 227 (100.0%) | 149 (100.0%) |
Property Value to Household Income Ratio in Winfield
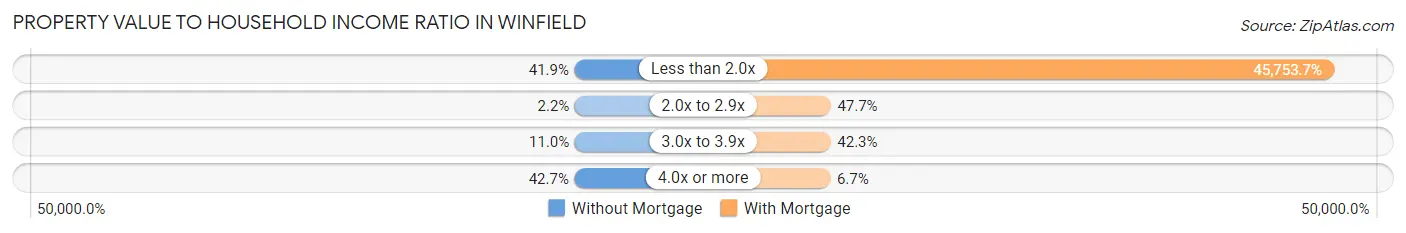
| Value-to-Income Ratio | Without Mortgage | With Mortgage |
| Less than 2.0x | 95 (41.8%) | 68,173 (45,753.7%) |
| 2.0x to 2.9x | 5 (2.2%) | 71 (47.6%) |
| 3.0x to 3.9x | 25 (11.0%) | 63 (42.3%) |
| 4.0x or more | 97 (42.7%) | 10 (6.7%) |
| Total | 227 (100.0%) | 149 (100.0%) |
Real Estate Taxes by Mortgage Status in Winfield
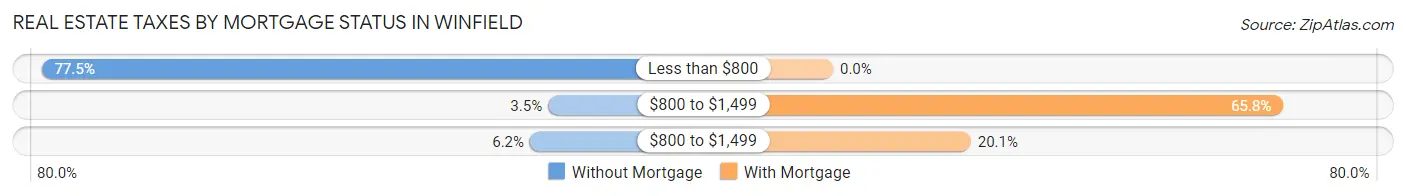
| Property Taxes | Without Mortgage | With Mortgage |
| Less than $800 | 176 (77.5%) | 0 (0.0%) |
| $800 to $1,499 | 8 (3.5%) | 98 (65.8%) |
| $800 to $1,499 | 14 (6.2%) | 30 (20.1%) |
| Total | 227 (100.0%) | 149 (100.0%) |
Health & Disability in Winfield
Health Insurance Coverage by Age in Winfield
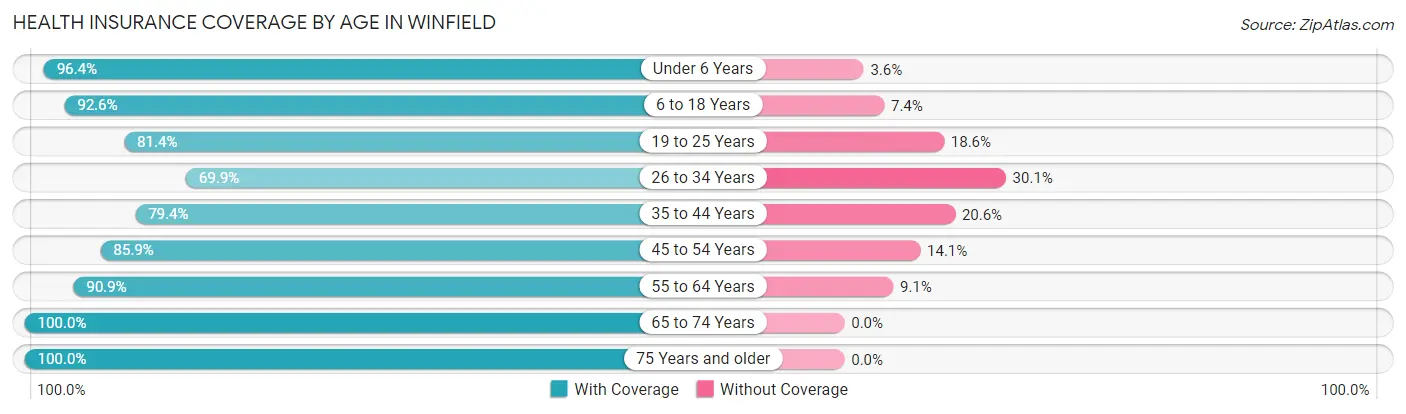
| Age Bracket | With Coverage | Without Coverage |
| Under 6 Years | 135 (96.4%) | 5 (3.6%) |
| 6 to 18 Years | 225 (92.6%) | 18 (7.4%) |
| 19 to 25 Years | 114 (81.4%) | 26 (18.6%) |
| 26 to 34 Years | 79 (69.9%) | 34 (30.1%) |
| 35 to 44 Years | 177 (79.4%) | 46 (20.6%) |
| 45 to 54 Years | 164 (85.9%) | 27 (14.1%) |
| 55 to 64 Years | 120 (90.9%) | 12 (9.1%) |
| 65 to 74 Years | 94 (100.0%) | 0 (0.0%) |
| 75 Years and older | 30 (100.0%) | 0 (0.0%) |
| Total | 1,138 (87.1%) | 168 (12.9%) |
Health Insurance Coverage by Citizenship Status in Winfield
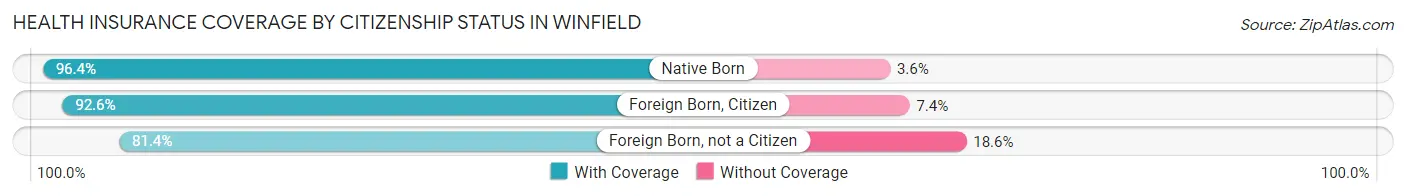
| Citizenship Status | With Coverage | Without Coverage |
| Native Born | 135 (96.4%) | 5 (3.6%) |
| Foreign Born, Citizen | 225 (92.6%) | 18 (7.4%) |
| Foreign Born, not a Citizen | 114 (81.4%) | 26 (18.6%) |
Health Insurance Coverage by Household Income in Winfield
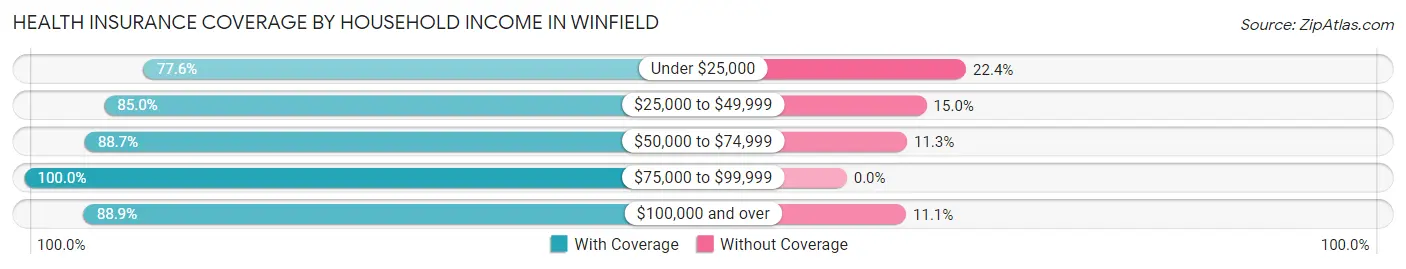
| Household Income | With Coverage | Without Coverage |
| Under $25,000 | 250 (77.6%) | 72 (22.4%) |
| $25,000 to $49,999 | 290 (85.0%) | 51 (15.0%) |
| $50,000 to $74,999 | 220 (88.7%) | 28 (11.3%) |
| $75,000 to $99,999 | 242 (100.0%) | 0 (0.0%) |
| $100,000 and over | 136 (88.9%) | 17 (11.1%) |
Public vs Private Health Insurance Coverage by Age in Winfield
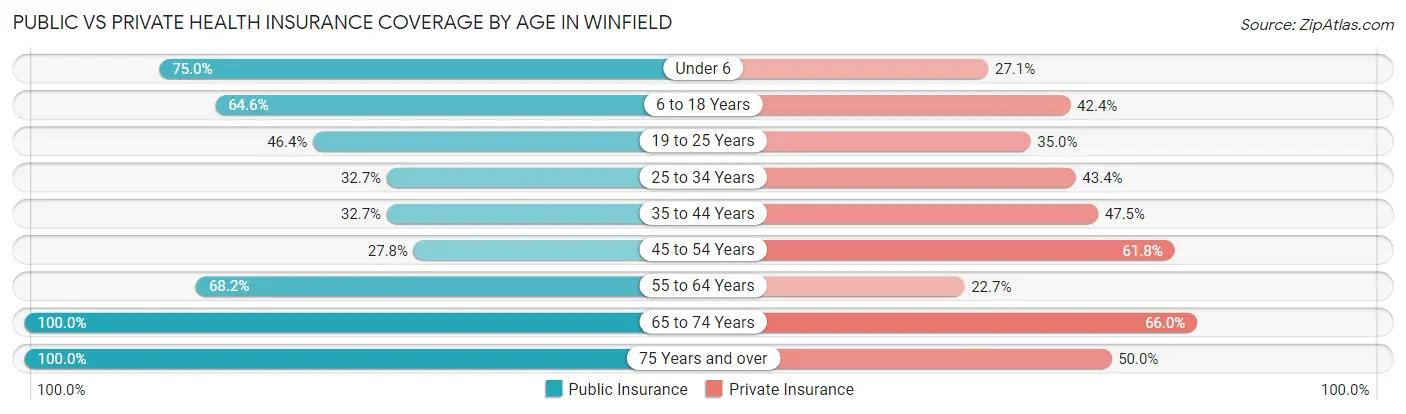
| Age Bracket | Public Insurance | Private Insurance |
| Under 6 | 105 (75.0%) | 38 (27.1%) |
| 6 to 18 Years | 157 (64.6%) | 103 (42.4%) |
| 19 to 25 Years | 65 (46.4%) | 49 (35.0%) |
| 25 to 34 Years | 37 (32.7%) | 49 (43.4%) |
| 35 to 44 Years | 73 (32.7%) | 106 (47.5%) |
| 45 to 54 Years | 53 (27.8%) | 118 (61.8%) |
| 55 to 64 Years | 90 (68.2%) | 30 (22.7%) |
| 65 to 74 Years | 94 (100.0%) | 62 (66.0%) |
| 75 Years and over | 30 (100.0%) | 15 (50.0%) |
| Total | 704 (53.9%) | 570 (43.6%) |
Disability Status by Sex by Age in Winfield
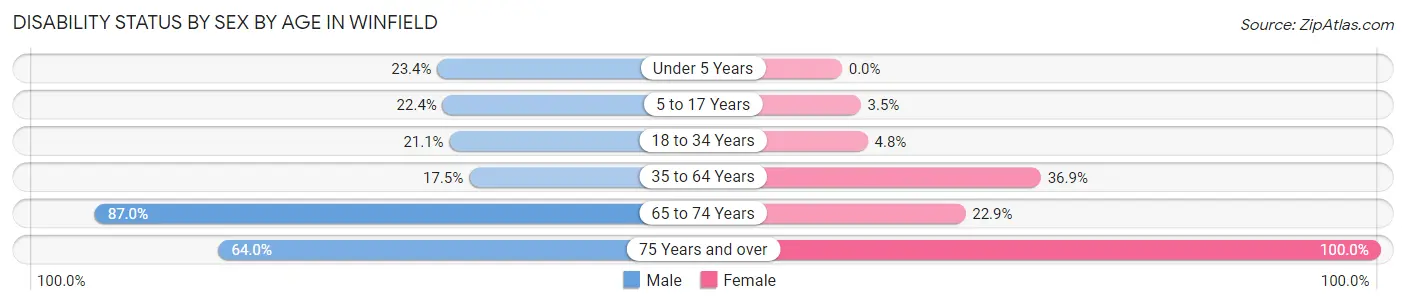
| Age Bracket | Male | Female |
| Under 5 Years | 11 (23.4%) | 0 (0.0%) |
| 5 to 17 Years | 41 (22.4%) | 3 (3.5%) |
| 18 to 34 Years | 26 (21.1%) | 7 (4.8%) |
| 35 to 64 Years | 42 (17.5%) | 113 (36.9%) |
| 65 to 74 Years | 40 (87.0%) | 11 (22.9%) |
| 75 Years and over | 16 (64.0%) | 5 (100.0%) |
Disability Class by Sex by Age in Winfield
Disability Class: Hearing Difficulty
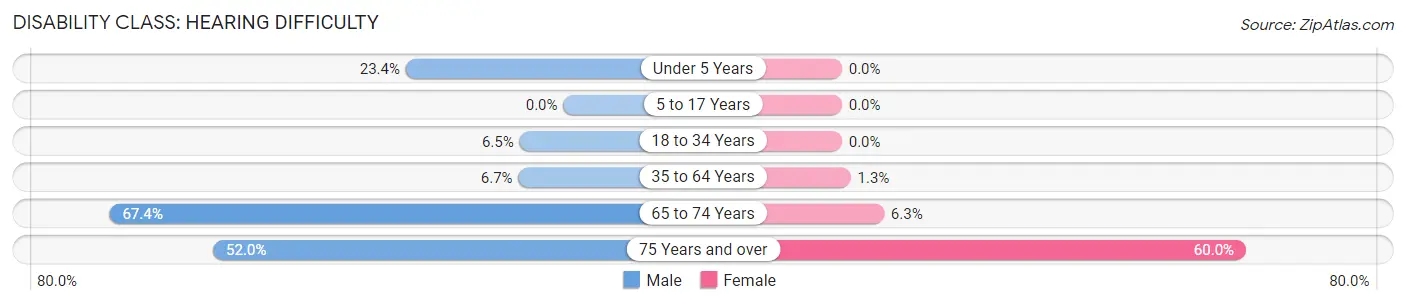
| Age Bracket | Male | Female |
| Under 5 Years | 11 (23.4%) | 0 (0.0%) |
| 5 to 17 Years | 0 (0.0%) | 0 (0.0%) |
| 18 to 34 Years | 8 (6.5%) | 0 (0.0%) |
| 35 to 64 Years | 16 (6.7%) | 4 (1.3%) |
| 65 to 74 Years | 31 (67.4%) | 3 (6.2%) |
| 75 Years and over | 13 (52.0%) | 3 (60.0%) |
Disability Class: Vision Difficulty
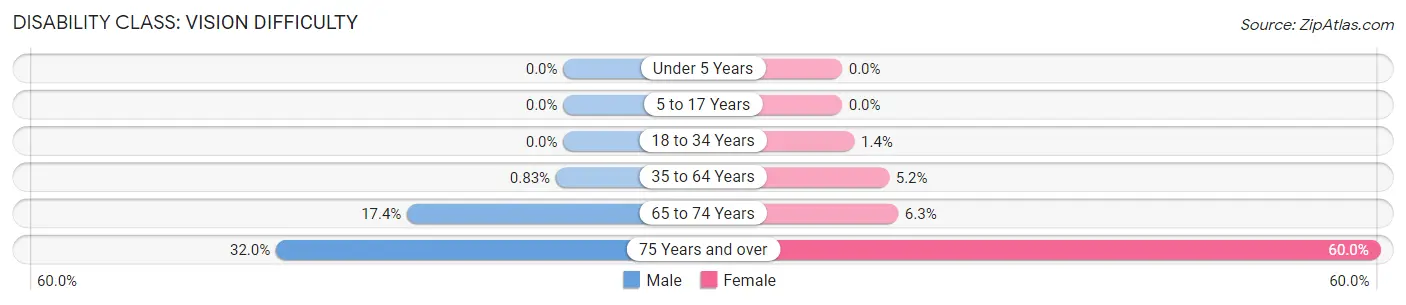
| Age Bracket | Male | Female |
| Under 5 Years | 0 (0.0%) | 0 (0.0%) |
| 5 to 17 Years | 0 (0.0%) | 0 (0.0%) |
| 18 to 34 Years | 0 (0.0%) | 2 (1.4%) |
| 35 to 64 Years | 2 (0.8%) | 16 (5.2%) |
| 65 to 74 Years | 8 (17.4%) | 3 (6.2%) |
| 75 Years and over | 8 (32.0%) | 3 (60.0%) |
Disability Class: Cognitive Difficulty
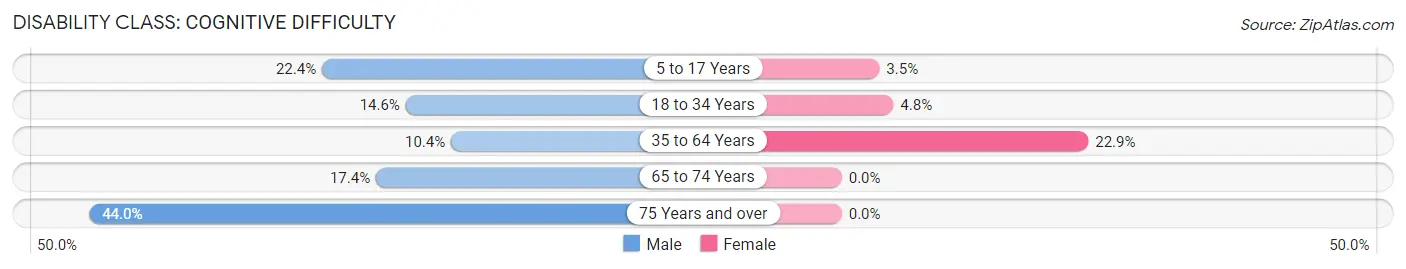
| Age Bracket | Male | Female |
| 5 to 17 Years | 41 (22.4%) | 3 (3.5%) |
| 18 to 34 Years | 18 (14.6%) | 7 (4.8%) |
| 35 to 64 Years | 25 (10.4%) | 70 (22.9%) |
| 65 to 74 Years | 8 (17.4%) | 0 (0.0%) |
| 75 Years and over | 11 (44.0%) | 0 (0.0%) |
Disability Class: Ambulatory Difficulty
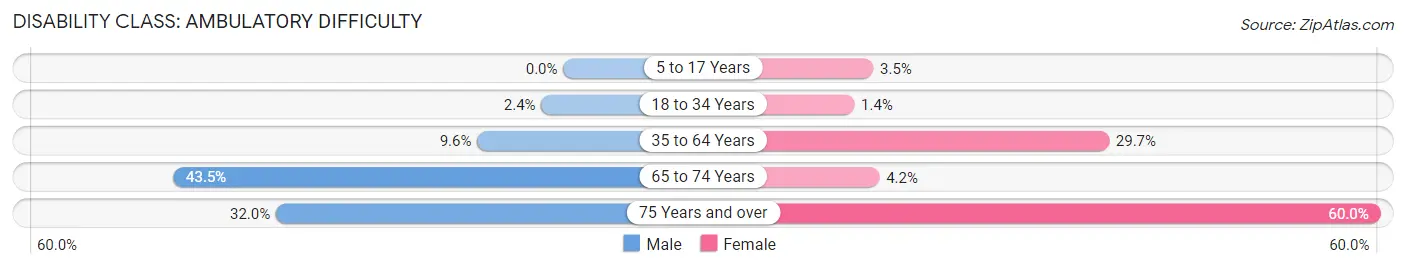
| Age Bracket | Male | Female |
| 5 to 17 Years | 0 (0.0%) | 3 (3.5%) |
| 18 to 34 Years | 3 (2.4%) | 2 (1.4%) |
| 35 to 64 Years | 23 (9.6%) | 91 (29.7%) |
| 65 to 74 Years | 20 (43.5%) | 2 (4.2%) |
| 75 Years and over | 8 (32.0%) | 3 (60.0%) |
Disability Class: Self-Care Difficulty
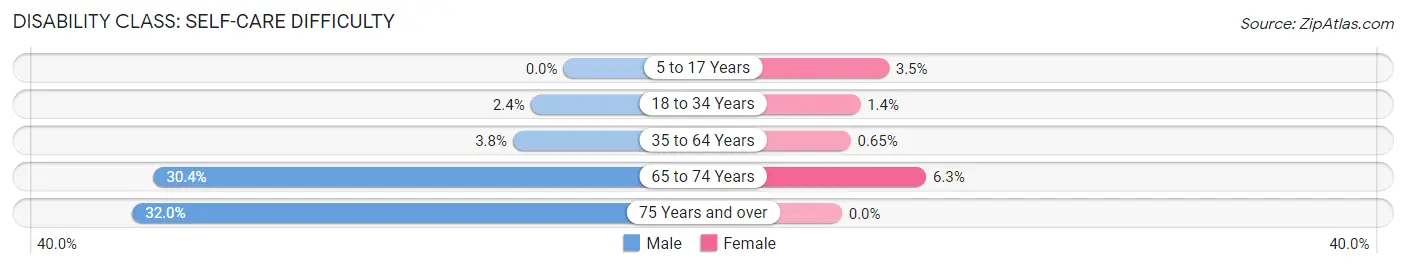
| Age Bracket | Male | Female |
| 5 to 17 Years | 0 (0.0%) | 3 (3.5%) |
| 18 to 34 Years | 3 (2.4%) | 2 (1.4%) |
| 35 to 64 Years | 9 (3.7%) | 2 (0.6%) |
| 65 to 74 Years | 14 (30.4%) | 3 (6.2%) |
| 75 Years and over | 8 (32.0%) | 0 (0.0%) |
Technology Access in Winfield
Computing Device Access in Winfield
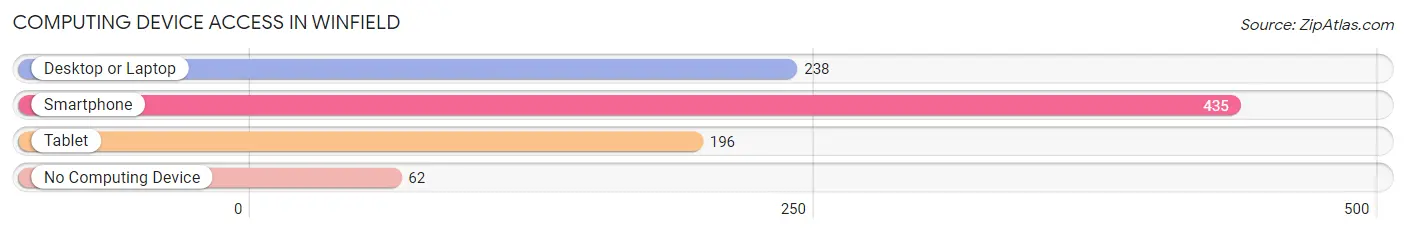
| Device Type | # Households | % Households |
| Desktop or Laptop | 238 | 46.0% |
| Smartphone | 435 | 84.0% |
| Tablet | 196 | 37.8% |
| No Computing Device | 62 | 12.0% |
| Total | 518 | 100.0% |
Internet Access in Winfield
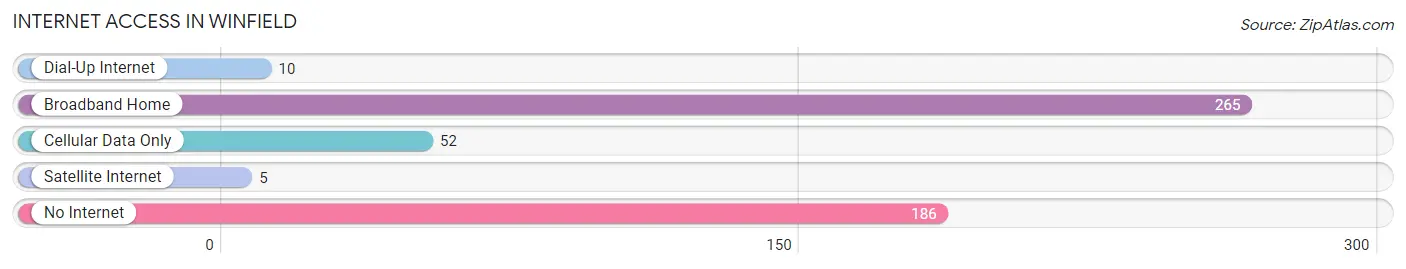
| Internet Type | # Households | % Households |
| Dial-Up Internet | 10 | 1.9% |
| Broadband Home | 265 | 51.2% |
| Cellular Data Only | 52 | 10.0% |
| Satellite Internet | 5 | 1.0% |
| No Internet | 186 | 35.9% |
| Total | 518 | 100.0% |
Winfield Summary
Winfield, Tennessee is a small town located in the western part of the state, in the foothills of the Appalachian Mountains. It is situated in the county of Fayette, and is part of the Memphis metropolitan area. The town has a population of just over 1,000 people, and is known for its rural charm and friendly atmosphere.
History
The area that is now Winfield was first settled in the early 1800s by a group of settlers from North Carolina. The town was originally known as “Winfield Station”, and was named after a local landowner, William Winfield. The town was officially incorporated in 1887, and the first post office was established in 1888.
In the early 1900s, the town began to grow and develop, and by the 1920s it had become a thriving agricultural community. The town was home to several cotton gins, a sawmill, and a grist mill. The town also had a number of stores, churches, and a school.
In the 1950s, the town began to decline as the local economy shifted away from agriculture. The town’s population began to decline, and by the 1970s the town had become a virtual ghost town. In the 1980s, the town began to experience a resurgence, as new businesses and residents began to move into the area.
Geography
Winfield is located in the western part of Fayette County, in the foothills of the Appalachian Mountains. The town is situated at an elevation of 830 feet above sea level, and is located about 25 miles east of Memphis. The town is surrounded by rolling hills and farmland, and is home to several small lakes and streams.
Economy
The economy of Winfield is largely based on agriculture and tourism. The town is home to several farms, which produce a variety of crops, including corn, soybeans, and cotton. The town is also home to several small businesses, including restaurants, stores, and a few manufacturing plants.
The town is also a popular tourist destination, as it is located close to several popular attractions, including the Great Smoky Mountains National Park and the Natchez Trace Parkway. The town is also home to several festivals and events throughout the year, including the Winfield Music Festival and the Winfield Bluegrass Festival.
Demographics
As of the 2010 census, the population of Winfield was 1,072. The racial makeup of the town was 95.3% White, 1.2% African American, 0.3% Native American, 0.2% Asian, 0.1% Pacific Islander, and 2.9% from other races. The median household income was $37,917, and the median family income was $45,625.
Conclusion
Winfield, Tennessee is a small town located in the western part of the state, in the foothills of the Appalachian Mountains. It is a rural community with a population of just over 1,000 people, and is known for its friendly atmosphere and rural charm. The town’s economy is largely based on agriculture and tourism, and the town is home to several small businesses, farms, and festivals. The town has a diverse population, with a median household income of $37,917.
Common Questions
What is Per Capita Income in Winfield?
Per Capita income in Winfield is $19,960.
What is the Median Family Income in Winfield?
Median Family Income in Winfield is $56,875.
What is the Median Household income in Winfield?
Median Household Income in Winfield is $40,526.
What is Income or Wage Gap in Winfield?
Income or Wage Gap in Winfield is 25.6%.
Women in Winfield earn 74.4 cents for every dollar earned by a man.
What is Inequality or Gini Index in Winfield?
Inequality or Gini Index in Winfield is 0.41.
What is the Total Population of Winfield?
Total Population of Winfield is 1,306.
What is the Total Male Population of Winfield?
Total Male Population of Winfield is 664.
What is the Total Female Population of Winfield?
Total Female Population of Winfield is 642.
What is the Ratio of Males per 100 Females in Winfield?
There are 103.43 Males per 100 Females in Winfield.
What is the Ratio of Females per 100 Males in Winfield?
There are 96.69 Females per 100 Males in Winfield.
What is the Median Population Age in Winfield?
Median Population Age in Winfield is 35.9 Years.
What is the Average Family Size in Winfield
Average Family Size in Winfield is 3.0 People.
What is the Average Household Size in Winfield
Average Household Size in Winfield is 2.5 People.
How Large is the Labor Force in Winfield?
There are 555 People in the Labor Forcein in Winfield.
What is the Percentage of People in the Labor Force in Winfield?
57.1% of People are in the Labor Force in Winfield.
What is the Unemployment Rate in Winfield?
Unemployment Rate in Winfield is 4.7%.