Watauga, TN Map & Demographics
Watauga Map

Watauga Overview
$33,335
PER CAPITA INCOME
$71,000
AVG FAMILY INCOME
$58,125
AVG HOUSEHOLD INCOME
21.3%
WAGE / INCOME GAP [ % ]
78.7¢/ $1
WAGE / INCOME GAP [ $ ]
0.38
INEQUALITY / GINI INDEX
714
TOTAL POPULATION
396
MALE POPULATION
318
FEMALE POPULATION
124.53
MALES / 100 FEMALES
80.30
FEMALES / 100 MALES
49.0
MEDIAN AGE
2.9
AVG FAMILY SIZE
2.2
AVG HOUSEHOLD SIZE
303
LABOR FORCE [ PEOPLE ]
49.3%
PERCENT IN LABOR FORCE
22.4%
UNEMPLOYMENT RATE
Watauga Zip Codes
Income in Watauga
Income Overview in Watauga
Per Capita Income in Watauga is $33,335, while median incomes of families and households are $71,000 and $58,125 respectively.
| Characteristic | Number | Measure |
| Per Capita Income | 714 | $33,335 |
| Median Family Income | 190 | $71,000 |
| Mean Family Income | 190 | $81,847 |
| Median Household Income | 323 | $58,125 |
| Mean Household Income | 323 | $72,973 |
| Income Deficit | 190 | $0 |
| Wage / Income Gap (%) | 714 | 21.32% |
| Wage / Income Gap ($) | 714 | 78.68¢ per $1 |
| Gini / Inequality Index | 714 | 0.38 |
Earnings by Sex in Watauga
Average Earnings in Watauga are $47,500, $48,356 for men and $38,047 for women, a difference of 21.3%.
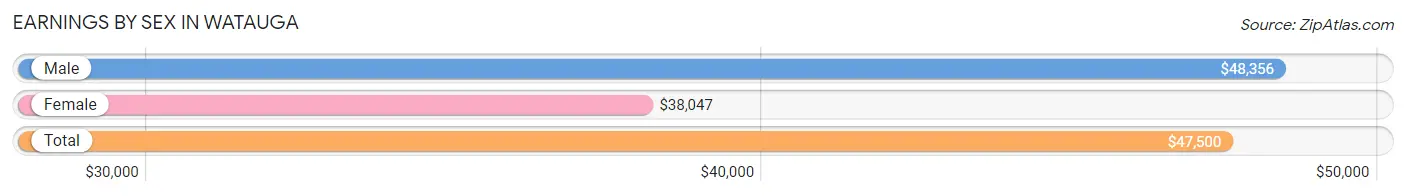
| Sex | Number | Average Earnings |
| Male | 173 (54.1%) | $48,356 |
| Female | 147 (45.9%) | $38,047 |
| Total | 320 (100.0%) | $47,500 |
Earnings by Sex by Income Bracket in Watauga
The most common earnings brackets in Watauga are $45,000 to $49,999 for men (56 | 32.4%) and $50,000 to $54,999 for women (44 | 29.9%).
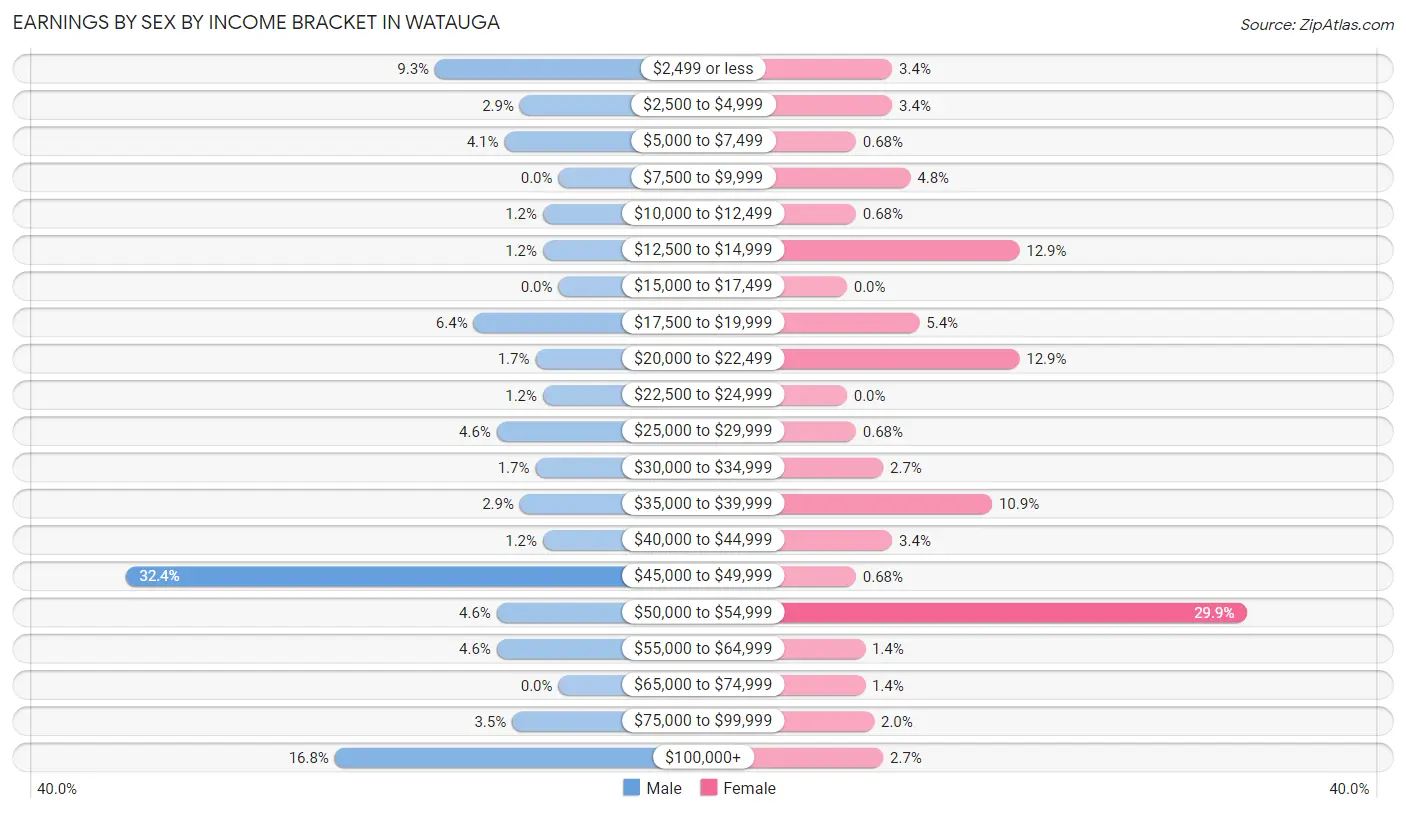
| Income | Male | Female |
| $2,499 or less | 16 (9.2%) | 5 (3.4%) |
| $2,500 to $4,999 | 5 (2.9%) | 5 (3.4%) |
| $5,000 to $7,499 | 7 (4.1%) | 1 (0.7%) |
| $7,500 to $9,999 | 0 (0.0%) | 7 (4.8%) |
| $10,000 to $12,499 | 2 (1.2%) | 1 (0.7%) |
| $12,500 to $14,999 | 2 (1.2%) | 19 (12.9%) |
| $15,000 to $17,499 | 0 (0.0%) | 0 (0.0%) |
| $17,500 to $19,999 | 11 (6.4%) | 8 (5.4%) |
| $20,000 to $22,499 | 3 (1.7%) | 19 (12.9%) |
| $22,500 to $24,999 | 2 (1.2%) | 0 (0.0%) |
| $25,000 to $29,999 | 8 (4.6%) | 1 (0.7%) |
| $30,000 to $34,999 | 3 (1.7%) | 4 (2.7%) |
| $35,000 to $39,999 | 5 (2.9%) | 16 (10.9%) |
| $40,000 to $44,999 | 2 (1.2%) | 5 (3.4%) |
| $45,000 to $49,999 | 56 (32.4%) | 1 (0.7%) |
| $50,000 to $54,999 | 8 (4.6%) | 44 (29.9%) |
| $55,000 to $64,999 | 8 (4.6%) | 2 (1.4%) |
| $65,000 to $74,999 | 0 (0.0%) | 2 (1.4%) |
| $75,000 to $99,999 | 6 (3.5%) | 3 (2.0%) |
| $100,000+ | 29 (16.8%) | 4 (2.7%) |
| Total | 173 (100.0%) | 147 (100.0%) |
Earnings by Sex by Educational Attainment in Watauga
Average earnings in Watauga are $48,819 for men and $41,250 for women, a difference of 15.5%. Men with an educational attainment of graduate degree enjoy the highest average annual earnings of $48,702, while those with graduate degree education earn the least with $48,702. Women with an educational attainment of college or associate's degree earn the most with the average annual earnings of $50,923, while those with high school diploma education have the smallest earnings of $21,042.
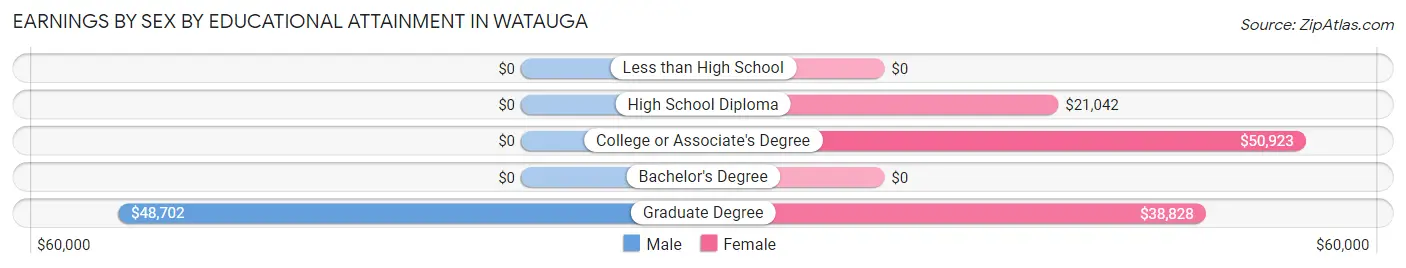
| Educational Attainment | Male Income | Female Income |
| Less than High School | - | - |
| High School Diploma | - | - |
| College or Associate's Degree | - | - |
| Bachelor's Degree | - | - |
| Graduate Degree | $48,702 | $38,828 |
| Total | $48,819 | $41,250 |
Family Income in Watauga
Family Income Brackets in Watauga
According to the Watauga family income data, there are 76 families falling into the $100,000 to $149,999 income range, which is the most common income bracket and makes up 40.0% of all families.
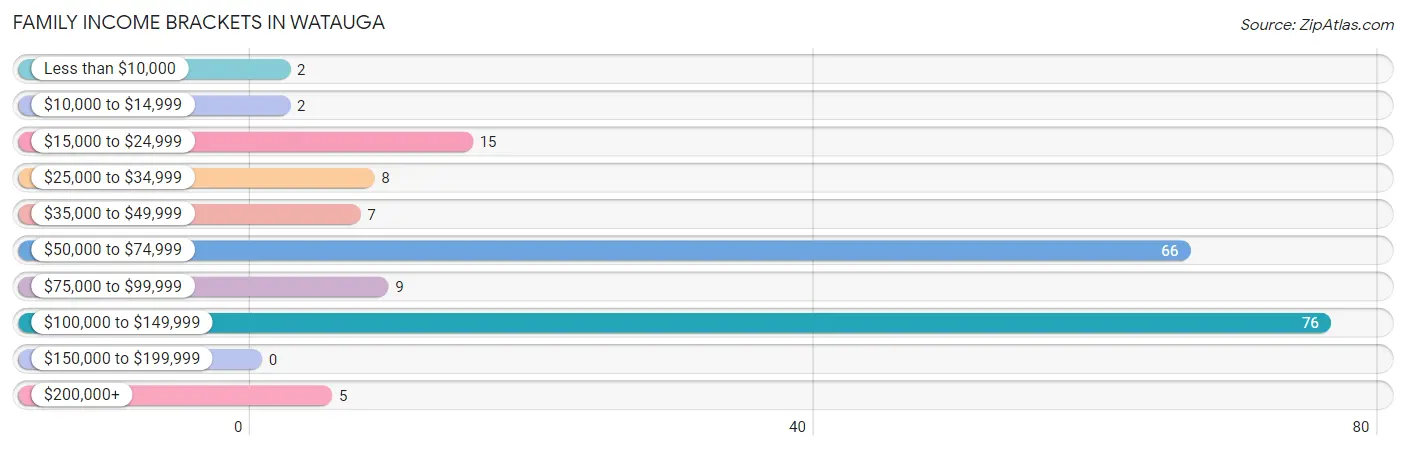
| Income Bracket | # Families | % Families |
| Less than $10,000 | 2 | 1.1% |
| $10,000 to $14,999 | 2 | 1.1% |
| $15,000 to $24,999 | 15 | 7.9% |
| $25,000 to $34,999 | 8 | 4.2% |
| $35,000 to $49,999 | 7 | 3.7% |
| $50,000 to $74,999 | 66 | 34.7% |
| $75,000 to $99,999 | 9 | 4.7% |
| $100,000 to $149,999 | 76 | 40.0% |
| $150,000 to $199,999 | 0 | 0.0% |
| $200,000+ | 5 | 2.6% |
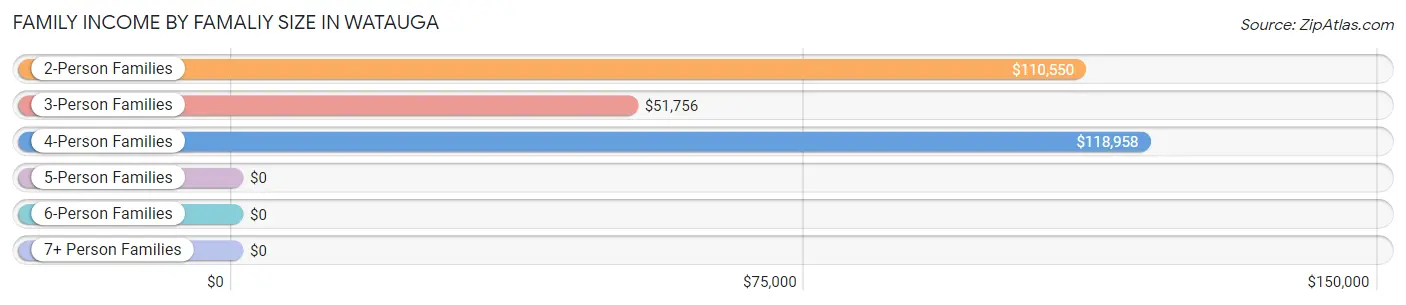
Family Income by Famaliy Size in Watauga
4-person families (23 | 12.1%) account for the highest median family income in Watauga with $118,958 per family, while 2-person families (82 | 43.2%) have the highest median income of $55,275 per family member.
| Income Bracket | # Families | Median Income |
| 2-Person Families | 82 (43.2%) | $110,550 |
| 3-Person Families | 61 (32.1%) | $51,756 |
| 4-Person Families | 23 (12.1%) | $118,958 |
| 5-Person Families | 10 (5.3%) | $0 |
| 6-Person Families | 7 (3.7%) | $0 |
| 7+ Person Families | 7 (3.7%) | $0 |
| Total | 190 (100.0%) | $71,000 |
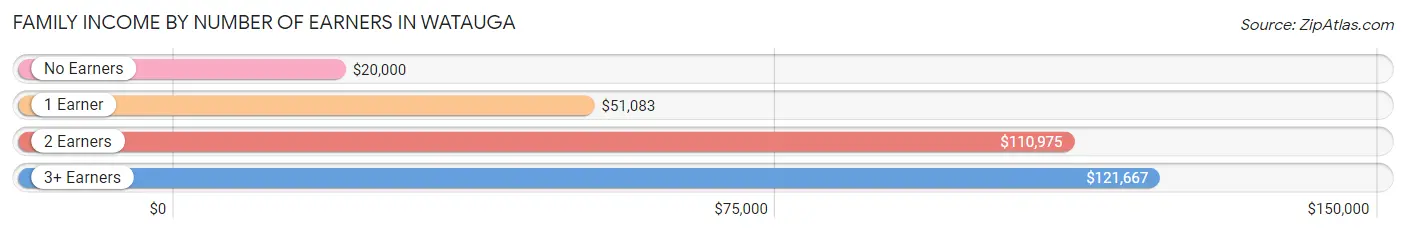
Family Income by Number of Earners in Watauga
The median family income in Watauga is $71,000, with families comprising 3+ earners (18) having the highest median family income of $121,667, while families with no earners (22) have the lowest median family income of $20,000, accounting for 9.5% and 11.6% of families, respectively.
| Number of Earners | # Families | Median Income |
| No Earners | 22 (11.6%) | $20,000 |
| 1 Earner | 67 (35.3%) | $51,083 |
| 2 Earners | 83 (43.7%) | $110,975 |
| 3+ Earners | 18 (9.5%) | $121,667 |
| Total | 190 (100.0%) | $71,000 |
Household Income in Watauga
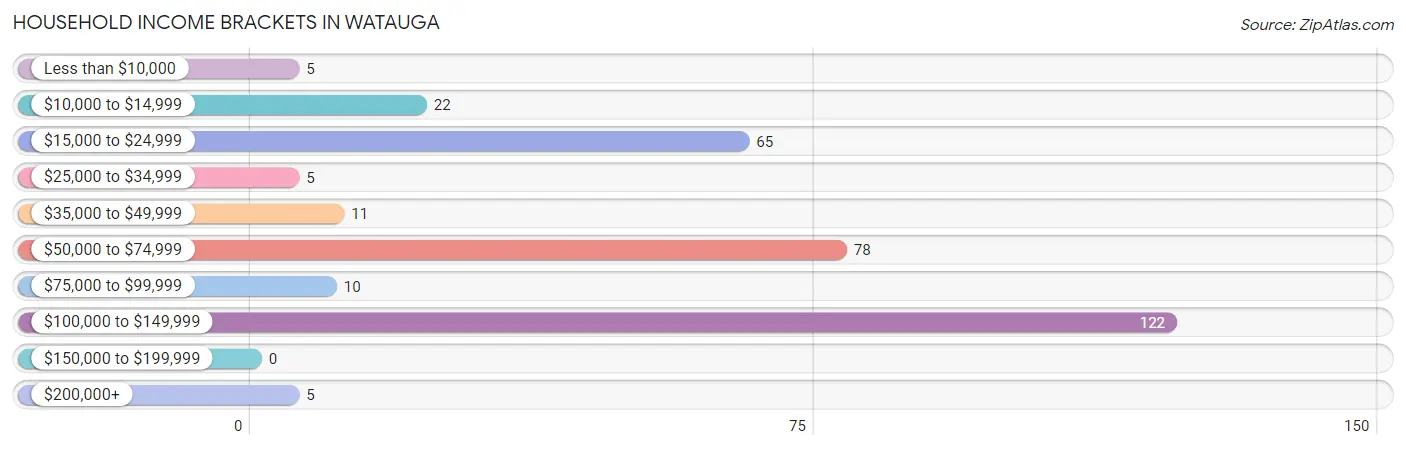
Household Income Brackets in Watauga
With 122 households falling in the category, the $100,000 to $149,999 income range is the most frequent in Watauga, accounting for 37.8% of all households.
| Income Bracket | # Households | % Households |
| Less than $10,000 | 5 | 1.5% |
| $10,000 to $14,999 | 22 | 6.8% |
| $15,000 to $24,999 | 65 | 20.1% |
| $25,000 to $34,999 | 5 | 1.5% |
| $35,000 to $49,999 | 11 | 3.4% |
| $50,000 to $74,999 | 78 | 24.1% |
| $75,000 to $99,999 | 10 | 3.1% |
| $100,000 to $149,999 | 122 | 37.8% |
| $150,000 to $199,999 | 0 | 0.0% |
| $200,000+ | 5 | 1.5% |
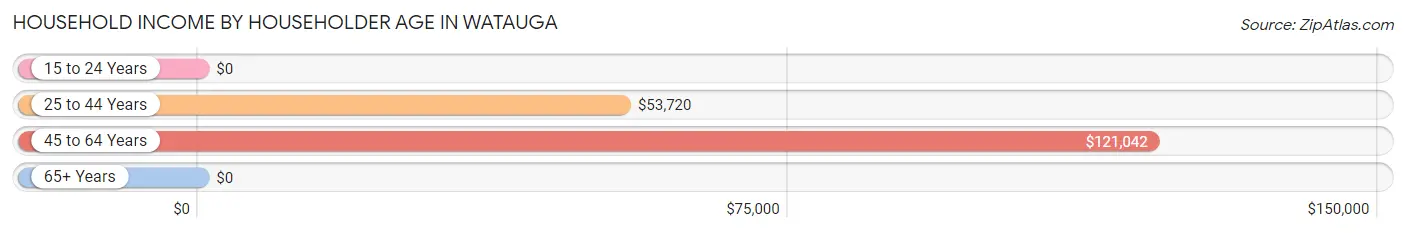
Household Income by Householder Age in Watauga
The median household income in Watauga is $58,125, with the highest median household income of $121,042 found in the 45 to 64 years age bracket for the primary householder. A total of 129 households (39.9%) fall into this category.
| Income Bracket | # Households | Median Income |
| 15 to 24 Years | 0 (0.0%) | $0 |
| 25 to 44 Years | 67 (20.7%) | $53,720 |
| 45 to 64 Years | 129 (39.9%) | $121,042 |
| 65+ Years | 127 (39.3%) | $0 |
| Total | 323 (100.0%) | $58,125 |
Poverty in Watauga
Income Below Poverty by Sex and Age in Watauga
With 23.0% poverty level for males and 15.7% for females among the residents of Watauga, under 5 year old males and 12 to 14 year old females are the most vulnerable to poverty, with 10 males (58.8%) and 2 females (100.0%) in their respective age groups living below the poverty level.
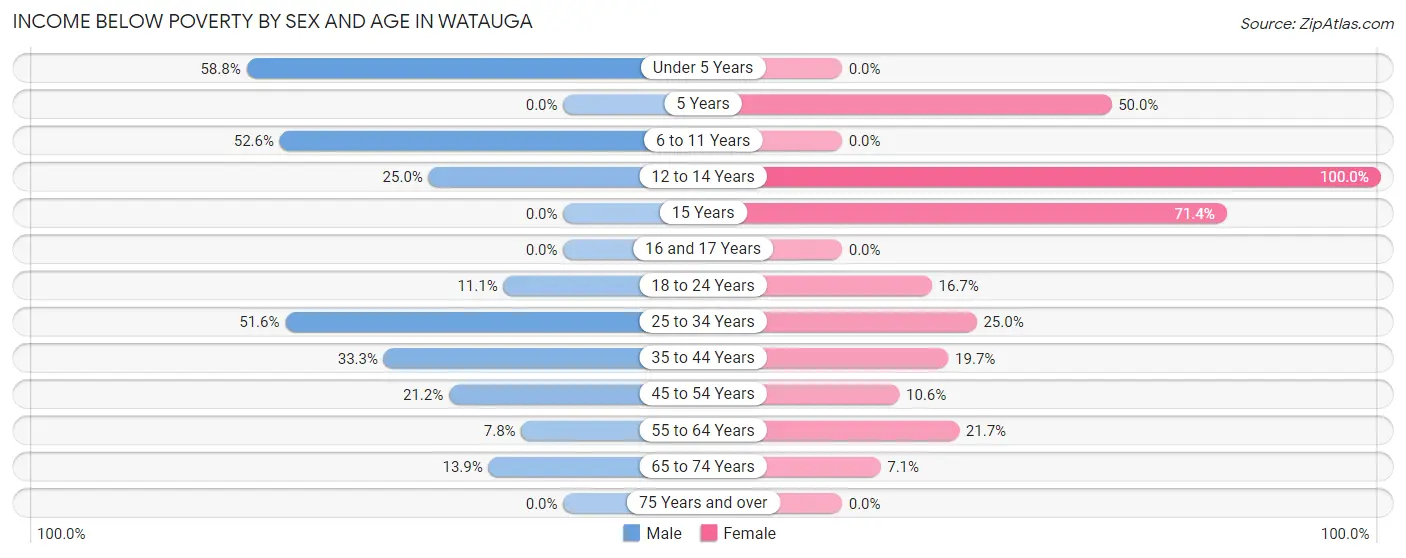
| Age Bracket | Male | Female |
| Under 5 Years | 10 (58.8%) | 0 (0.0%) |
| 5 Years | 0 (0.0%) | 4 (50.0%) |
| 6 to 11 Years | 20 (52.6%) | 0 (0.0%) |
| 12 to 14 Years | 1 (25.0%) | 2 (100.0%) |
| 15 Years | 0 (0.0%) | 5 (71.4%) |
| 16 and 17 Years | 0 (0.0%) | 0 (0.0%) |
| 18 to 24 Years | 5 (11.1%) | 4 (16.7%) |
| 25 to 34 Years | 16 (51.6%) | 4 (25.0%) |
| 35 to 44 Years | 15 (33.3%) | 15 (19.7%) |
| 45 to 54 Years | 7 (21.2%) | 5 (10.6%) |
| 55 to 64 Years | 7 (7.8%) | 10 (21.7%) |
| 65 to 74 Years | 10 (13.9%) | 1 (7.1%) |
| 75 Years and over | 0 (0.0%) | 0 (0.0%) |
| Total | 91 (23.0%) | 50 (15.7%) |
Income Above Poverty by Sex and Age in Watauga
According to the poverty statistics in Watauga, males aged 16 and 17 years and females aged 6 to 11 years are the age groups that are most secure financially, with 100.0% of males and 100.0% of females in these age groups living above the poverty line.
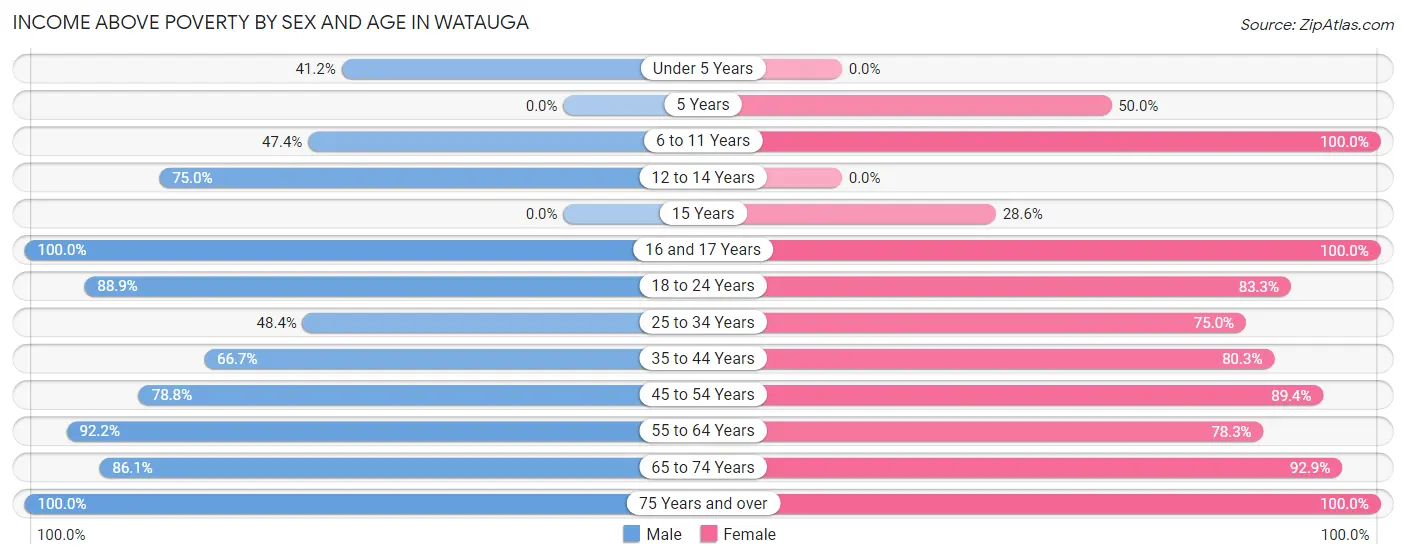
| Age Bracket | Male | Female |
| Under 5 Years | 7 (41.2%) | 0 (0.0%) |
| 5 Years | 0 (0.0%) | 4 (50.0%) |
| 6 to 11 Years | 18 (47.4%) | 24 (100.0%) |
| 12 to 14 Years | 3 (75.0%) | 0 (0.0%) |
| 15 Years | 0 (0.0%) | 2 (28.6%) |
| 16 and 17 Years | 2 (100.0%) | 10 (100.0%) |
| 18 to 24 Years | 40 (88.9%) | 20 (83.3%) |
| 25 to 34 Years | 15 (48.4%) | 12 (75.0%) |
| 35 to 44 Years | 30 (66.7%) | 61 (80.3%) |
| 45 to 54 Years | 26 (78.8%) | 42 (89.4%) |
| 55 to 64 Years | 83 (92.2%) | 36 (78.3%) |
| 65 to 74 Years | 62 (86.1%) | 13 (92.9%) |
| 75 Years and over | 19 (100.0%) | 44 (100.0%) |
| Total | 305 (77.0%) | 268 (84.3%) |
Income Below Poverty Among Married-Couple Families in Watauga
The poverty statistics for married-couple families in Watauga show that 3.4% or 4 of the total 119 families live below the poverty line. Families with 3 or 4 children have the highest poverty rate of 50.0%, comprising of 2 families. On the other hand, families with 1 or 2 children have the lowest poverty rate of 0.0%, which includes 0 families.
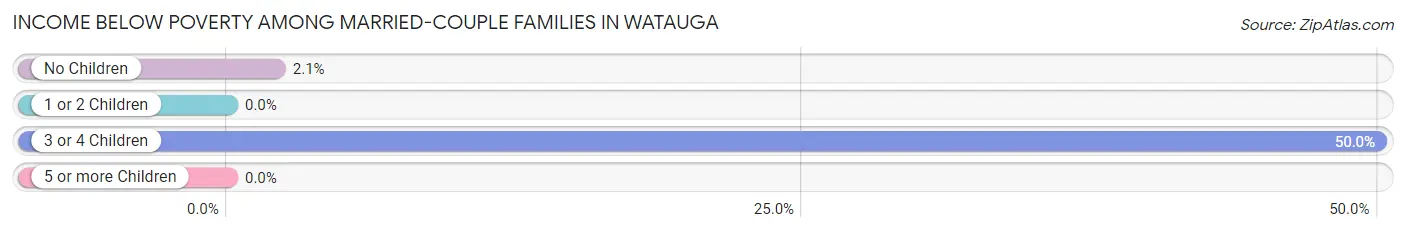
| Children | Above Poverty | Below Poverty |
| No Children | 94 (97.9%) | 2 (2.1%) |
| 1 or 2 Children | 19 (100.0%) | 0 (0.0%) |
| 3 or 4 Children | 2 (50.0%) | 2 (50.0%) |
| 5 or more Children | 0 (0.0%) | 0 (0.0%) |
| Total | 115 (96.6%) | 4 (3.4%) |
Income Below Poverty Among Single-Parent Households in Watauga
According to the poverty data in Watauga, 71.4% or 5 single-father households and 17.2% or 11 single-mother households are living below the poverty line. Among single-father households, those with 1 or 2 children have the highest poverty rate, with 5 households (71.4%) experiencing poverty. Likewise, among single-mother households, those with 3 or 4 children have the highest poverty rate, with 4 households (100.0%) falling below the poverty line.
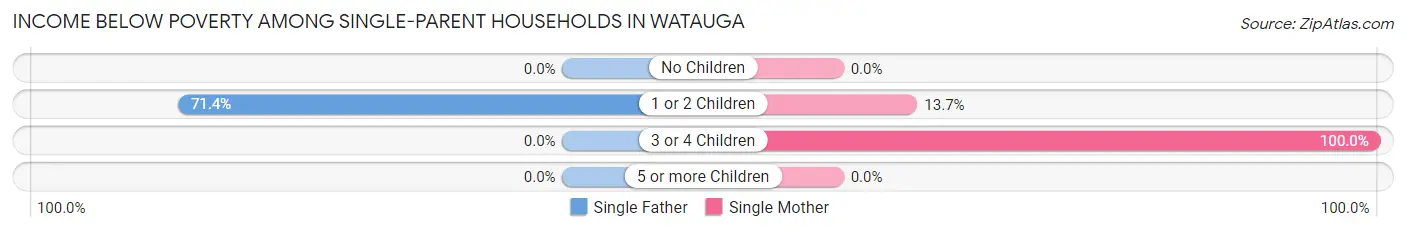
| Children | Single Father | Single Mother |
| No Children | 0 (0.0%) | 0 (0.0%) |
| 1 or 2 Children | 5 (71.4%) | 7 (13.7%) |
| 3 or 4 Children | 0 (0.0%) | 4 (100.0%) |
| 5 or more Children | 0 (0.0%) | 0 (0.0%) |
| Total | 5 (71.4%) | 11 (17.2%) |
Income Below Poverty Among Married-Couple vs Single-Parent Households in Watauga
The poverty data for Watauga shows that 4 of the married-couple family households (3.4%) and 16 of the single-parent households (22.5%) are living below the poverty level. Within the married-couple family households, those with 3 or 4 children have the highest poverty rate, with 2 households (50.0%) falling below the poverty line. Among the single-parent households, those with 3 or 4 children have the highest poverty rate, with 4 household (100.0%) living below poverty.
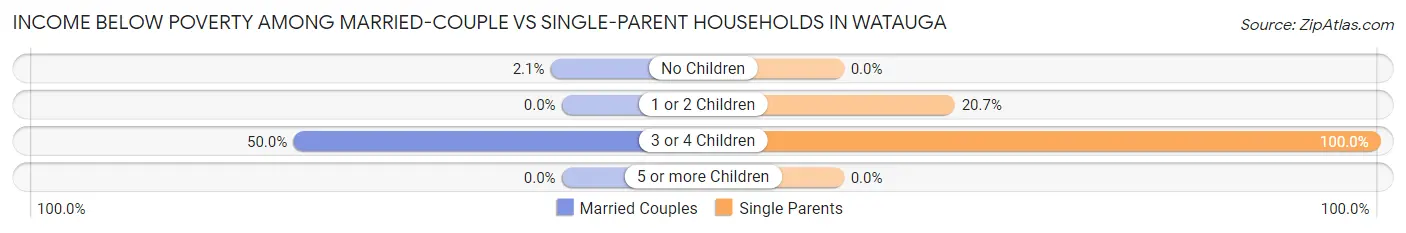
| Children | Married-Couple Families | Single-Parent Households |
| No Children | 2 (2.1%) | 0 (0.0%) |
| 1 or 2 Children | 0 (0.0%) | 12 (20.7%) |
| 3 or 4 Children | 2 (50.0%) | 4 (100.0%) |
| 5 or more Children | 0 (0.0%) | 0 (0.0%) |
| Total | 4 (3.4%) | 16 (22.5%) |
Race in Watauga
The most populous races in Watauga are White / Caucasian (588 | 82.4%), Hispanic or Latino (84 | 11.8%), and Two or more Races (78 | 10.9%).
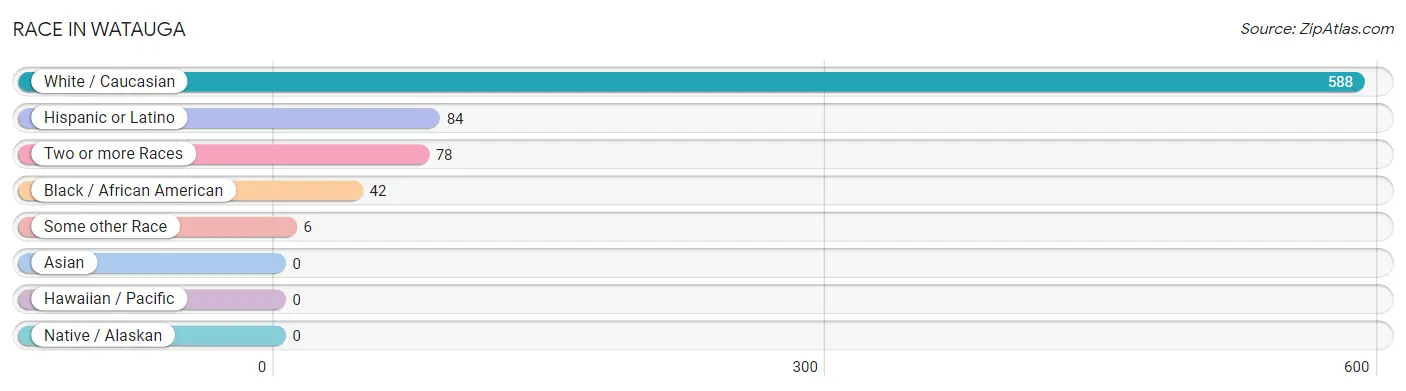
| Race | # Population | % Population |
| Asian | 0 | 0.0% |
| Black / African American | 42 | 5.9% |
| Hawaiian / Pacific | 0 | 0.0% |
| Hispanic or Latino | 84 | 11.8% |
| Native / Alaskan | 0 | 0.0% |
| White / Caucasian | 588 | 82.4% |
| Two or more Races | 78 | 10.9% |
| Some other Race | 6 | 0.8% |
| Total | 714 | 100.0% |
Ancestry in Watauga
The most populous ancestries reported in Watauga are American (259 | 36.3%), Irish (127 | 17.8%), Spaniard (50 | 7.0%), English (47 | 6.6%), and African (42 | 5.9%), together accounting for 73.5% of all Watauga residents.
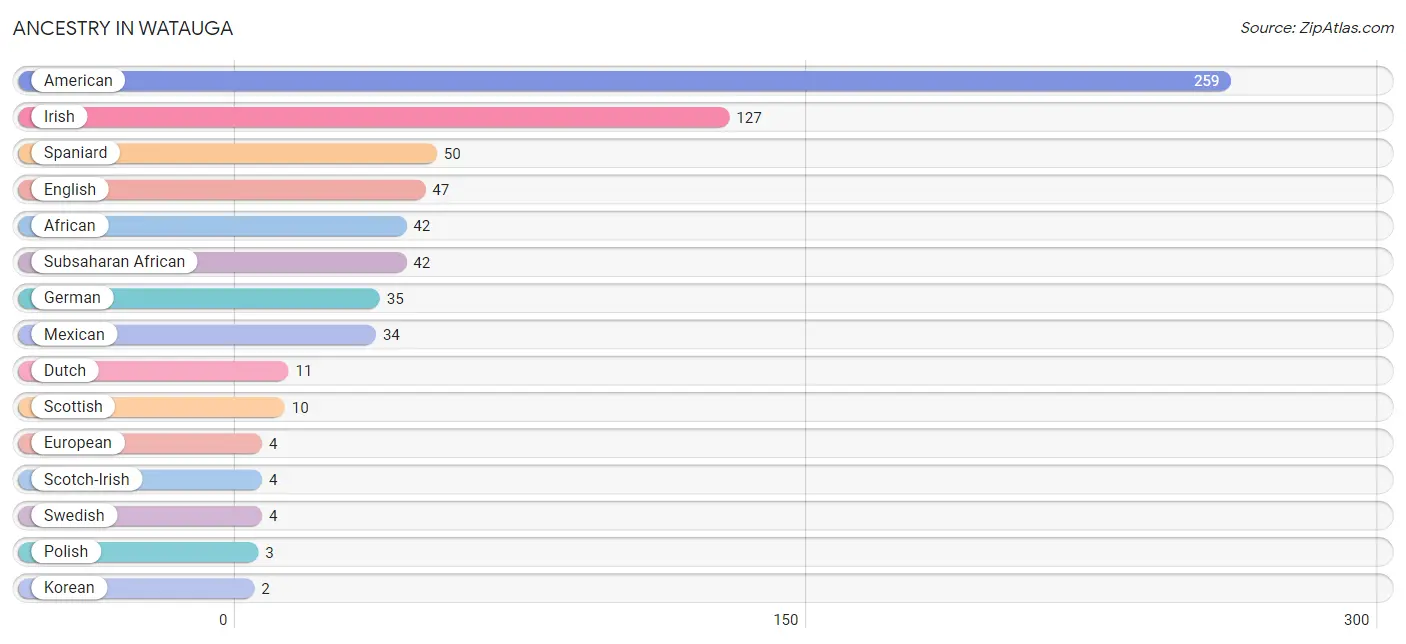
| Ancestry | # Population | % Population |
| African | 42 | 5.9% |
| American | 259 | 36.3% |
| Cherokee | 1 | 0.1% |
| Dutch | 11 | 1.5% |
| English | 47 | 6.6% |
| European | 4 | 0.6% |
| German | 35 | 4.9% |
| Irish | 127 | 17.8% |
| Korean | 2 | 0.3% |
| Mexican | 34 | 4.8% |
| Polish | 3 | 0.4% |
| Scotch-Irish | 4 | 0.6% |
| Scottish | 10 | 1.4% |
| Spaniard | 50 | 7.0% |
| Subsaharan African | 42 | 5.9% |
| Swedish | 4 | 0.6% |
| Welsh | 1 | 0.1% | View All 17 Rows |
Immigrants in Watauga
The most numerous immigrant groups reported in Watauga came from Europe (52 | 7.3%), Southern Europe (50 | 7.0%), Spain (50 | 7.0%), Central America (16 | 2.2%), and Latin America (16 | 2.2%), together accounting for 25.8% of all Watauga residents.

| Immigration Origin | # Population | % Population |
| Central America | 16 | 2.2% |
| England | 2 | 0.3% |
| Europe | 52 | 7.3% |
| Latin America | 16 | 2.2% |
| Mexico | 16 | 2.2% |
| Northern Europe | 2 | 0.3% |
| Southern Europe | 50 | 7.0% |
| Spain | 50 | 7.0% | View All 8 Rows |
Sex and Age in Watauga
Sex and Age in Watauga
The most populous age groups in Watauga are 55 to 59 Years (70 | 17.7%) for men and 40 to 44 Years (54 | 17.0%) for women.
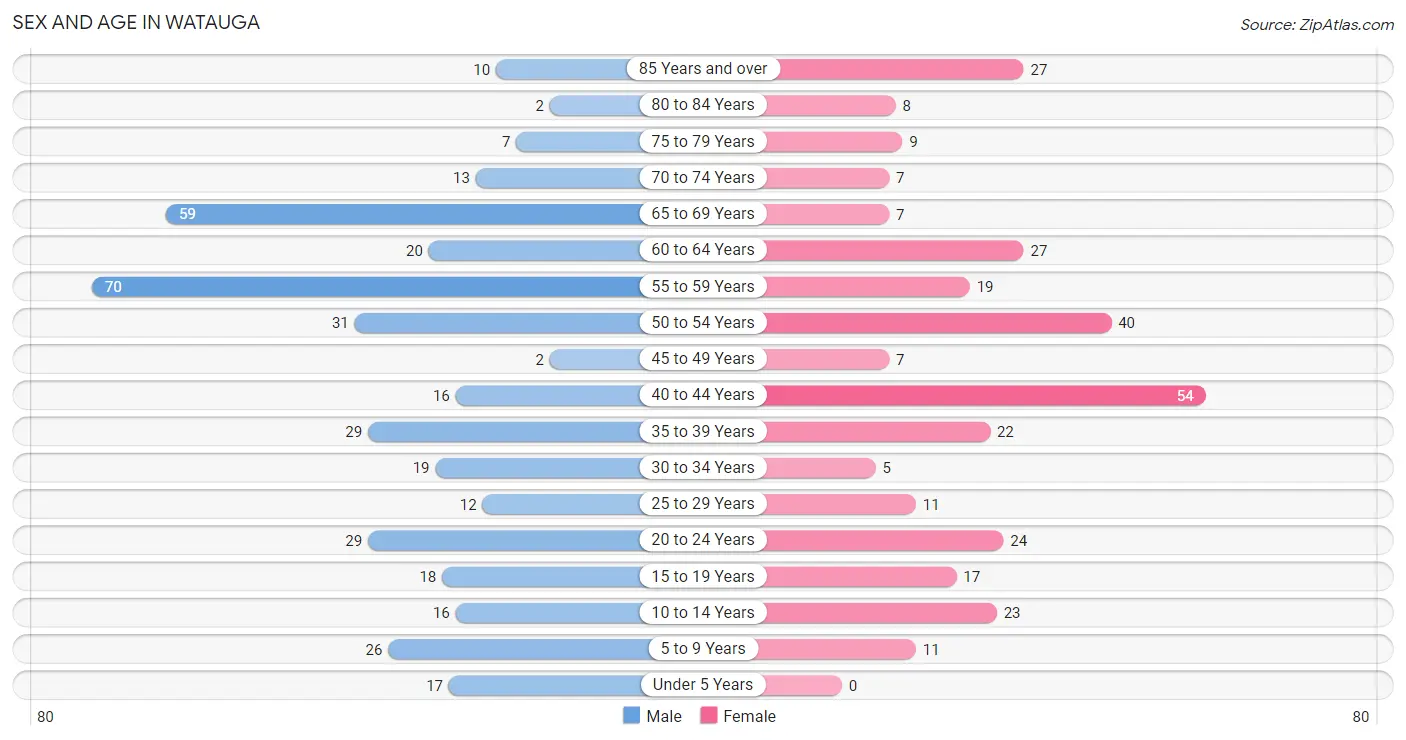
| Age Bracket | Male | Female |
| Under 5 Years | 17 (4.3%) | 0 (0.0%) |
| 5 to 9 Years | 26 (6.6%) | 11 (3.5%) |
| 10 to 14 Years | 16 (4.0%) | 23 (7.2%) |
| 15 to 19 Years | 18 (4.5%) | 17 (5.3%) |
| 20 to 24 Years | 29 (7.3%) | 24 (7.5%) |
| 25 to 29 Years | 12 (3.0%) | 11 (3.5%) |
| 30 to 34 Years | 19 (4.8%) | 5 (1.6%) |
| 35 to 39 Years | 29 (7.3%) | 22 (6.9%) |
| 40 to 44 Years | 16 (4.0%) | 54 (17.0%) |
| 45 to 49 Years | 2 (0.5%) | 7 (2.2%) |
| 50 to 54 Years | 31 (7.8%) | 40 (12.6%) |
| 55 to 59 Years | 70 (17.7%) | 19 (6.0%) |
| 60 to 64 Years | 20 (5.1%) | 27 (8.5%) |
| 65 to 69 Years | 59 (14.9%) | 7 (2.2%) |
| 70 to 74 Years | 13 (3.3%) | 7 (2.2%) |
| 75 to 79 Years | 7 (1.8%) | 9 (2.8%) |
| 80 to 84 Years | 2 (0.5%) | 8 (2.5%) |
| 85 Years and over | 10 (2.5%) | 27 (8.5%) |
| Total | 396 (100.0%) | 318 (100.0%) |
Families and Households in Watauga
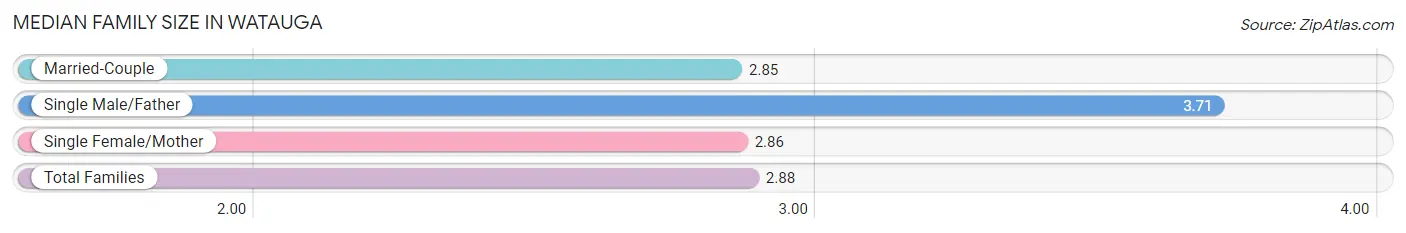
Median Family Size in Watauga
The median family size in Watauga is 2.88 persons per family, with single male/father families (7 | 3.7%) accounting for the largest median family size of 3.71 persons per family. On the other hand, married-couple families (119 | 62.6%) represent the smallest median family size with 2.85 persons per family.
| Family Type | # Families | Family Size |
| Married-Couple | 119 (62.6%) | 2.85 |
| Single Male/Father | 7 (3.7%) | 3.71 |
| Single Female/Mother | 64 (33.7%) | 2.86 |
| Total Families | 190 (100.0%) | 2.88 |
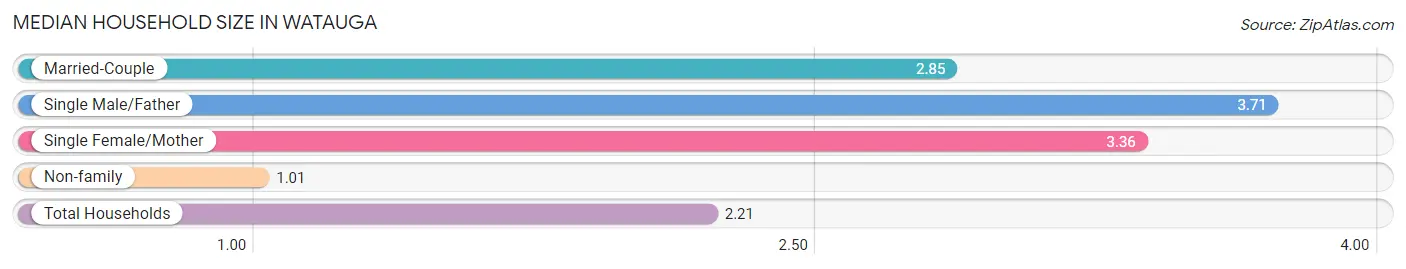
Median Household Size in Watauga
The median household size in Watauga is 2.21 persons per household, with single male/father households (7 | 2.2%) accounting for the largest median household size of 3.71 persons per household. non-family households (133 | 41.2%) represent the smallest median household size with 1.01 persons per household.
| Household Type | # Households | Household Size |
| Married-Couple | 119 (36.8%) | 2.85 |
| Single Male/Father | 7 (2.2%) | 3.71 |
| Single Female/Mother | 64 (19.8%) | 3.36 |
| Non-family | 133 (41.2%) | 1.01 |
| Total Households | 323 (100.0%) | 2.21 |
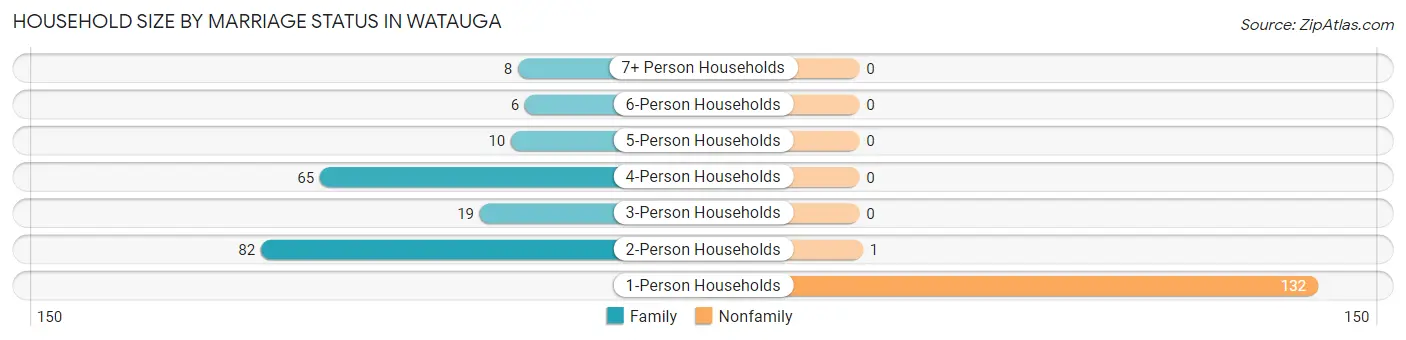
Household Size by Marriage Status in Watauga
Out of a total of 323 households in Watauga, 190 (58.8%) are family households, while 133 (41.2%) are nonfamily households. The most numerous type of family households are 2-person households, comprising 82, and the most common type of nonfamily households are 1-person households, comprising 132.
| Household Size | Family Households | Nonfamily Households |
| 1-Person Households | - | 132 (40.9%) |
| 2-Person Households | 82 (25.4%) | 1 (0.3%) |
| 3-Person Households | 19 (5.9%) | 0 (0.0%) |
| 4-Person Households | 65 (20.1%) | 0 (0.0%) |
| 5-Person Households | 10 (3.1%) | 0 (0.0%) |
| 6-Person Households | 6 (1.9%) | 0 (0.0%) |
| 7+ Person Households | 8 (2.5%) | 0 (0.0%) |
| Total | 190 (58.8%) | 133 (41.2%) |
Female Fertility in Watauga
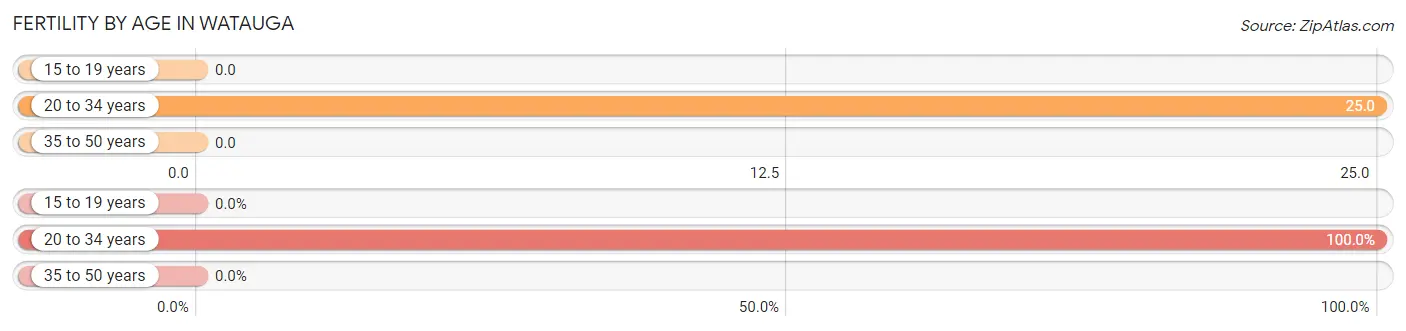
Fertility by Age in Watauga
Average fertility rate in Watauga is 7.0 births per 1,000 women. Women in the age bracket of 20 to 34 years have the highest fertility rate with 25.0 births per 1,000 women. Women in the age bracket of 20 to 34 years acount for 100.0% of all women with births.
| Age Bracket | Women with Births | Births / 1,000 Women |
| 15 to 19 years | 0 (0.0%) | 0.0 |
| 20 to 34 years | 1 (100.0%) | 25.0 |
| 35 to 50 years | 0 (0.0%) | 0.0 |
| Total | 1 (100.0%) | 7.0 |
Fertility by Age by Marriage Status in Watauga
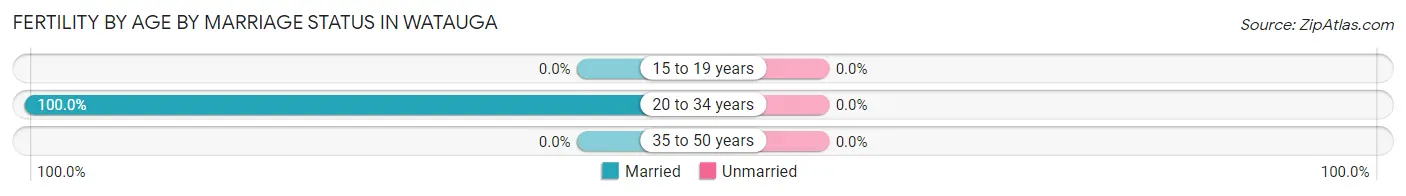
| Age Bracket | Married | Unmarried |
| 15 to 19 years | 0 (0.0%) | 0 (0.0%) |
| 20 to 34 years | 1 (100.0%) | 0 (0.0%) |
| 35 to 50 years | 0 (0.0%) | 0 (0.0%) |
| Total | 1 (100.0%) | 0 (0.0%) |
Fertility by Education in Watauga
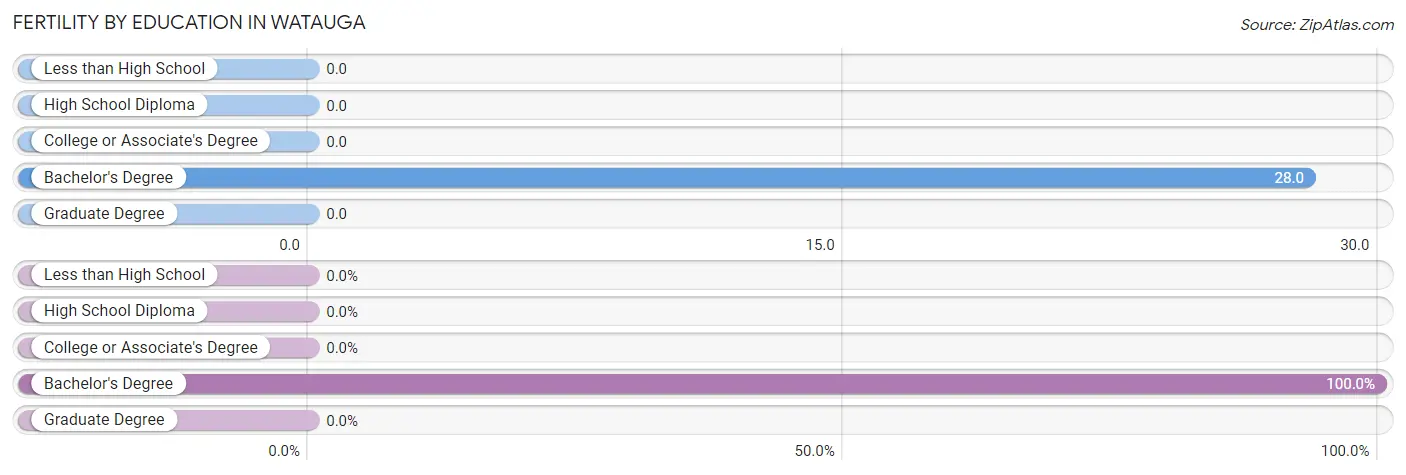
| Educational Attainment | Women with Births | Births / 1,000 Women |
| Less than High School | 0 (0.0%) | 0.0 |
| High School Diploma | 0 (0.0%) | 0.0 |
| College or Associate's Degree | 0 (0.0%) | 0.0 |
| Bachelor's Degree | 1 (100.0%) | 28.0 |
| Graduate Degree | 0 (0.0%) | 0.0 |
| Total | 1 (100.0%) | 7.0 |
Fertility by Education by Marriage Status in Watauga
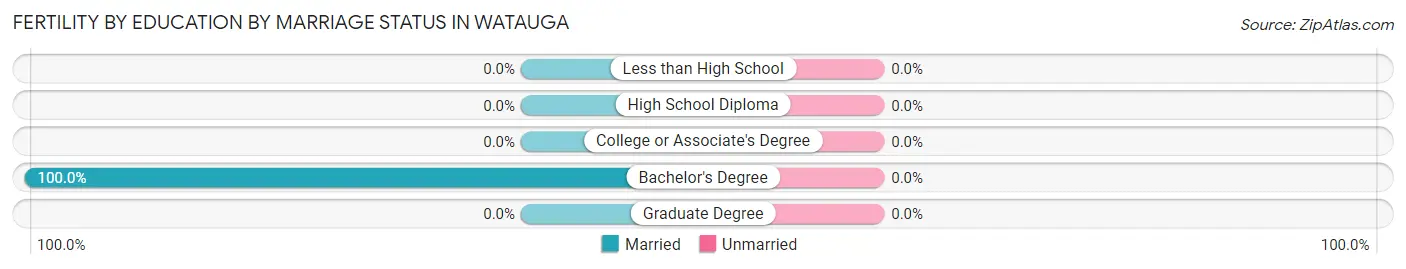
| Educational Attainment | Married | Unmarried |
| Less than High School | 0 (0.0%) | 0 (0.0%) |
| High School Diploma | 0 (0.0%) | 0 (0.0%) |
| College or Associate's Degree | 0 (0.0%) | 0 (0.0%) |
| Bachelor's Degree | 1 (100.0%) | 0 (0.0%) |
| Graduate Degree | 0 (0.0%) | 0 (0.0%) |
| Total | 1 (100.0%) | 0 (0.0%) |
Employment Characteristics in Watauga
Employment by Class of Employer in Watauga
Among the 234 employed individuals in Watauga, private company employees (149 | 63.7%), self-employed (not incorporated) (27 | 11.5%), and local government employees (25 | 10.7%) make up the most common classes of employment.
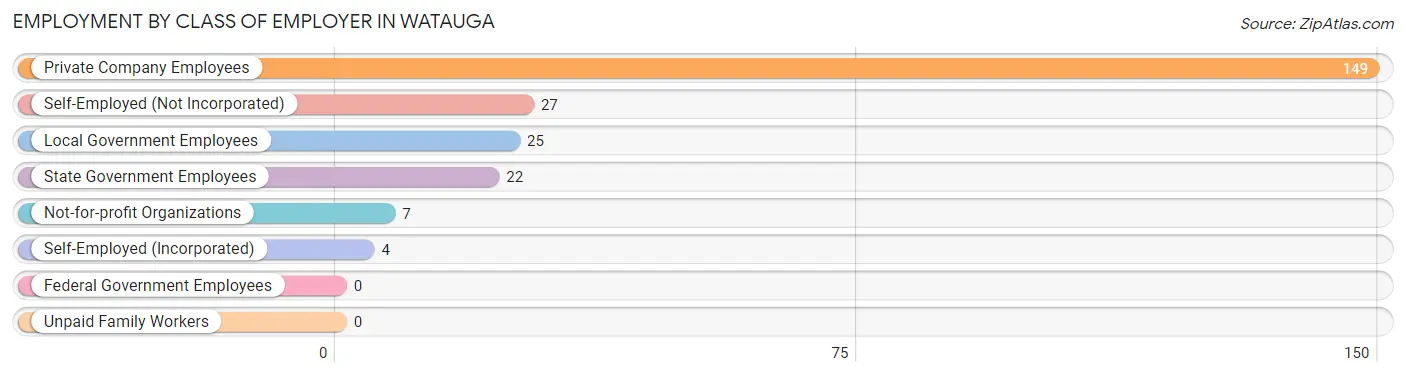
| Employer Class | # Employees | % Employees |
| Private Company Employees | 149 | 63.7% |
| Self-Employed (Incorporated) | 4 | 1.7% |
| Self-Employed (Not Incorporated) | 27 | 11.5% |
| Not-for-profit Organizations | 7 | 3.0% |
| Local Government Employees | 25 | 10.7% |
| State Government Employees | 22 | 9.4% |
| Federal Government Employees | 0 | 0.0% |
| Unpaid Family Workers | 0 | 0.0% |
| Total | 234 | 100.0% |
Employment Status by Age in Watauga
According to the labor force statistics for Watauga, out of the total population over 16 years of age (614), 49.3% or 303 individuals are in the labor force, with 22.4% or 68 of them unemployed. The age group with the highest labor force participation rate is 20 to 24 years, with 81.1% or 43 individuals in the labor force. Within the labor force, the 65 to 74 years age range has the highest percentage of unemployed individuals, with 87.7% or 50 of them being unemployed.
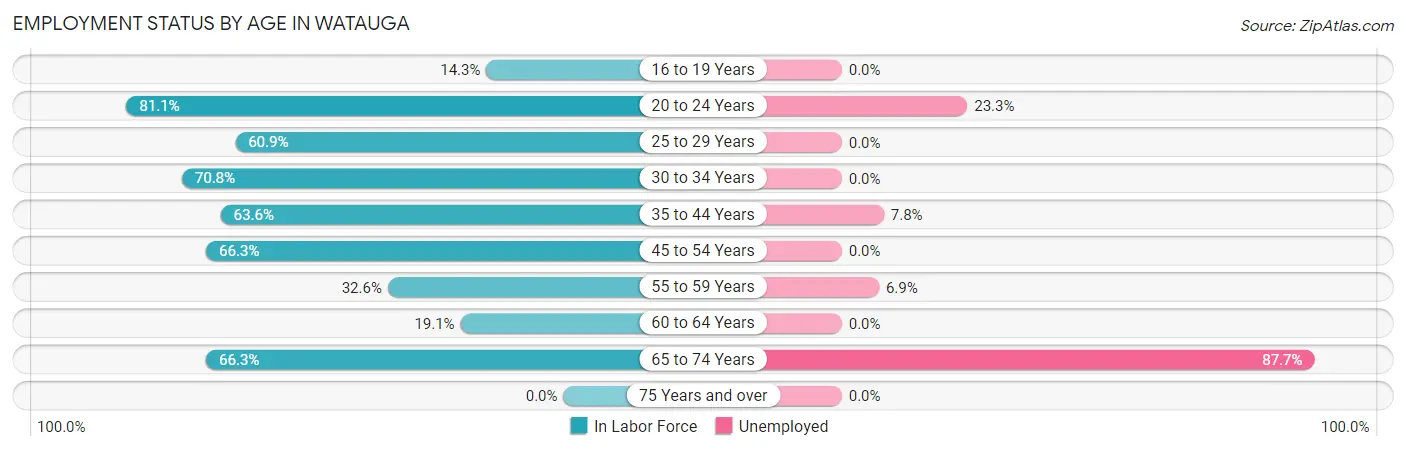
| Age Bracket | In Labor Force | Unemployed |
| 16 to 19 Years | 4 (14.3%) | 0 (0.0%) |
| 20 to 24 Years | 43 (81.1%) | 10 (23.3%) |
| 25 to 29 Years | 14 (60.9%) | 0 (0.0%) |
| 30 to 34 Years | 17 (70.8%) | 0 (0.0%) |
| 35 to 44 Years | 77 (63.6%) | 6 (7.8%) |
| 45 to 54 Years | 53 (66.3%) | 0 (0.0%) |
| 55 to 59 Years | 29 (32.6%) | 2 (6.9%) |
| 60 to 64 Years | 9 (19.1%) | 0 (0.0%) |
| 65 to 74 Years | 57 (66.3%) | 50 (87.7%) |
| 75 Years and over | 0 (0.0%) | 0 (0.0%) |
| Total | 303 (49.3%) | 68 (22.4%) |
Employment Status by Educational Attainment in Watauga
According to labor force statistics for Watauga, 51.8% of individuals (199) out of the total population between 25 and 64 years of age (384) are in the labor force, with 4.0% or 8 of them being unemployed. The group with the highest labor force participation rate are those with the educational attainment of college / associate degree, with 79.4% or 85 individuals in the labor force. Within the labor force, individuals with less than high school education have the highest percentage of unemployment, with 20.0% or 2 of them being unemployed.
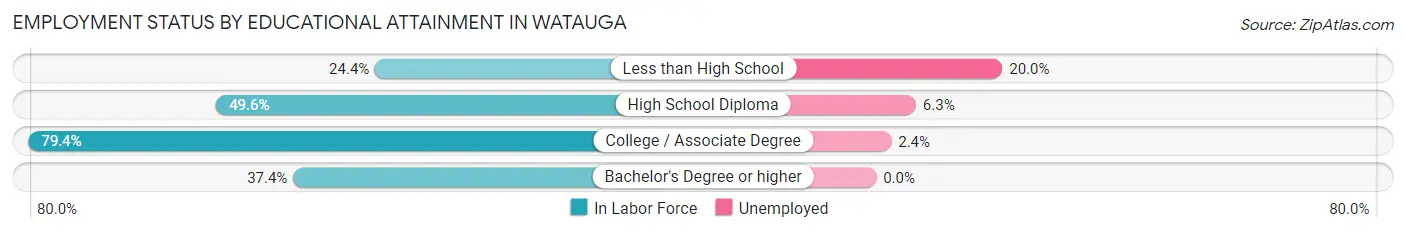
| Educational Attainment | In Labor Force | Unemployed |
| Less than High School | 10 (24.4%) | 8 (20.0%) |
| High School Diploma | 64 (49.6%) | 8 (6.3%) |
| College / Associate Degree | 85 (79.4%) | 3 (2.4%) |
| Bachelor's Degree or higher | 40 (37.4%) | 0 (0.0%) |
| Total | 199 (51.8%) | 15 (4.0%) |
Employment Occupations by Sex in Watauga
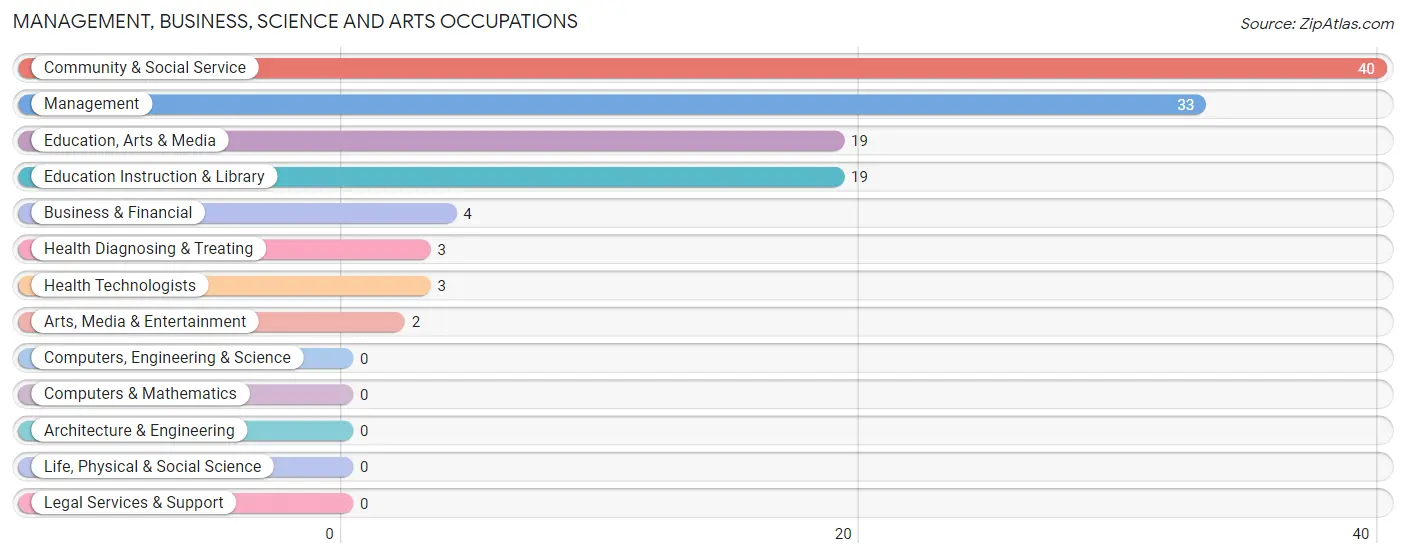
Management, Business, Science and Arts Occupations
The most common Management, Business, Science and Arts occupations in Watauga are Community & Social Service (40 | 17.0%), Management (33 | 14.0%), Education, Arts & Media (19 | 8.1%), Education Instruction & Library (19 | 8.1%), and Business & Financial (4 | 1.7%).
Management, Business, Science and Arts Occupations by Sex
Within the Management, Business, Science and Arts occupations in Watauga, the most male-oriented occupations are Arts, Media & Entertainment (100.0%), Health Diagnosing & Treating (66.7%), and Health Technologists (66.7%), while the most female-oriented occupations are Education, Arts & Media (100.0%), Education Instruction & Library (100.0%), and Community & Social Service (95.0%).
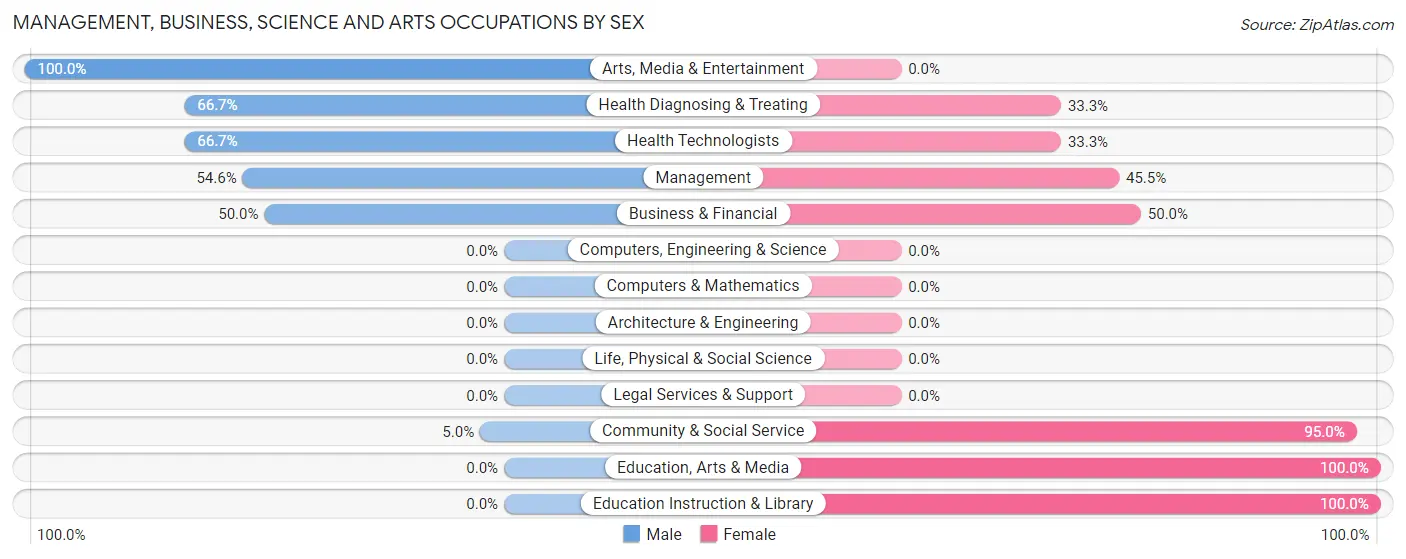
| Occupation | Male | Female |
| Management | 18 (54.5%) | 15 (45.5%) |
| Business & Financial | 2 (50.0%) | 2 (50.0%) |
| Computers, Engineering & Science | 0 (0.0%) | 0 (0.0%) |
| Computers & Mathematics | 0 (0.0%) | 0 (0.0%) |
| Architecture & Engineering | 0 (0.0%) | 0 (0.0%) |
| Life, Physical & Social Science | 0 (0.0%) | 0 (0.0%) |
| Community & Social Service | 2 (5.0%) | 38 (95.0%) |
| Education, Arts & Media | 0 (0.0%) | 19 (100.0%) |
| Legal Services & Support | 0 (0.0%) | 0 (0.0%) |
| Education Instruction & Library | 0 (0.0%) | 19 (100.0%) |
| Arts, Media & Entertainment | 2 (100.0%) | 0 (0.0%) |
| Health Diagnosing & Treating | 2 (66.7%) | 1 (33.3%) |
| Health Technologists | 2 (66.7%) | 1 (33.3%) |
| Total (Category) | 24 (30.0%) | 56 (70.0%) |
| Total (Overall) | 103 (43.8%) | 132 (56.2%) |
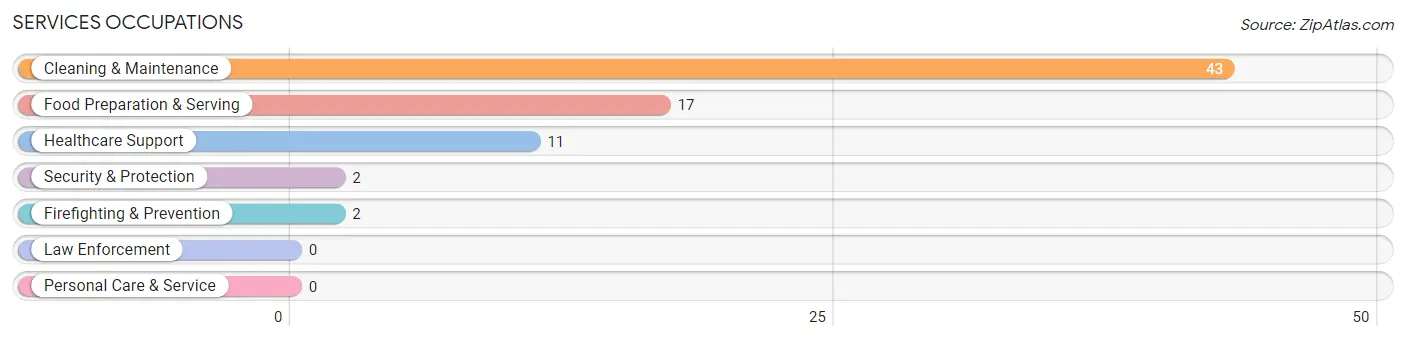
Services Occupations
The most common Services occupations in Watauga are Cleaning & Maintenance (43 | 18.3%), Food Preparation & Serving (17 | 7.2%), Healthcare Support (11 | 4.7%), Security & Protection (2 | 0.9%), and Firefighting & Prevention (2 | 0.9%).
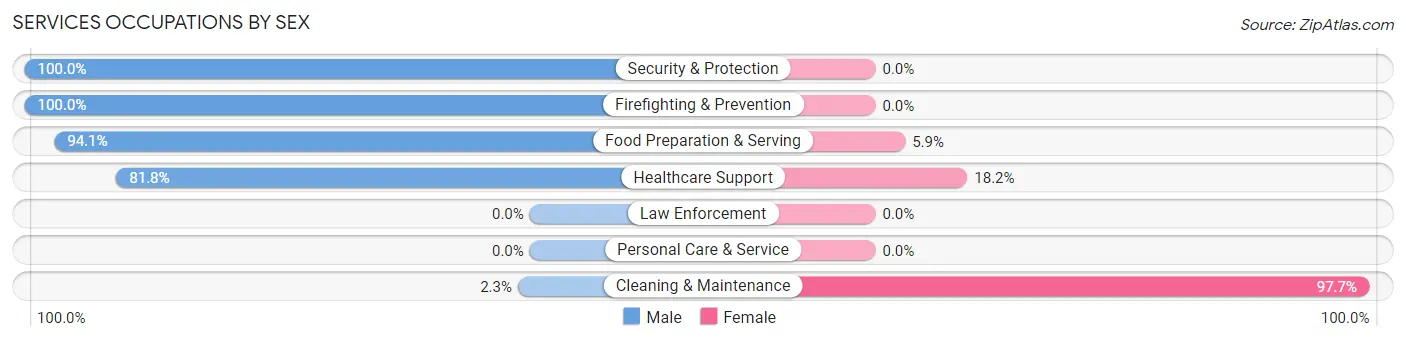
Services Occupations by Sex
Within the Services occupations in Watauga, the most male-oriented occupations are Security & Protection (100.0%), Firefighting & Prevention (100.0%), and Food Preparation & Serving (94.1%), while the most female-oriented occupations are Cleaning & Maintenance (97.7%), Healthcare Support (18.2%), and Food Preparation & Serving (5.9%).
| Occupation | Male | Female |
| Healthcare Support | 9 (81.8%) | 2 (18.2%) |
| Security & Protection | 2 (100.0%) | 0 (0.0%) |
| Firefighting & Prevention | 2 (100.0%) | 0 (0.0%) |
| Law Enforcement | 0 (0.0%) | 0 (0.0%) |
| Food Preparation & Serving | 16 (94.1%) | 1 (5.9%) |
| Cleaning & Maintenance | 1 (2.3%) | 42 (97.7%) |
| Personal Care & Service | 0 (0.0%) | 0 (0.0%) |
| Total (Category) | 28 (38.4%) | 45 (61.6%) |
| Total (Overall) | 103 (43.8%) | 132 (56.2%) |
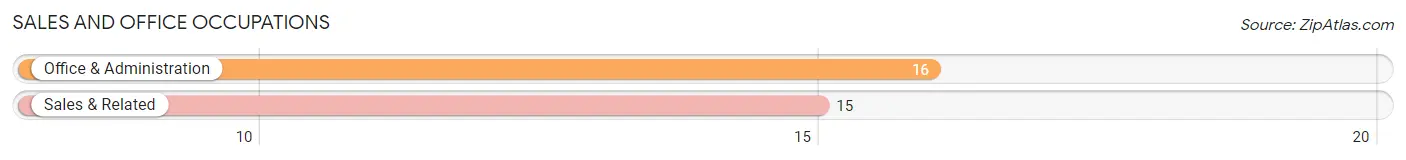
Sales and Office Occupations
The most common Sales and Office occupations in Watauga are Office & Administration (16 | 6.8%), and Sales & Related (15 | 6.4%).
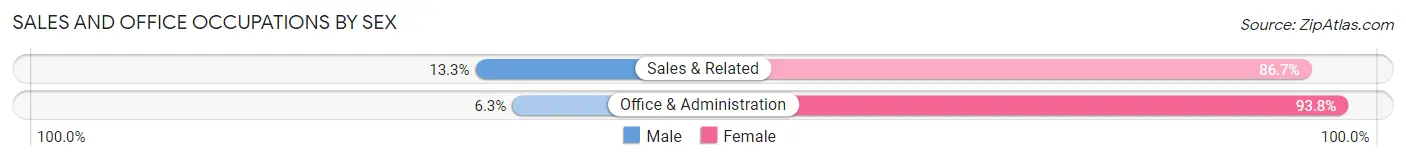
Sales and Office Occupations by Sex
| Occupation | Male | Female |
| Sales & Related | 2 (13.3%) | 13 (86.7%) |
| Office & Administration | 1 (6.2%) | 15 (93.8%) |
| Total (Category) | 3 (9.7%) | 28 (90.3%) |
| Total (Overall) | 103 (43.8%) | 132 (56.2%) |
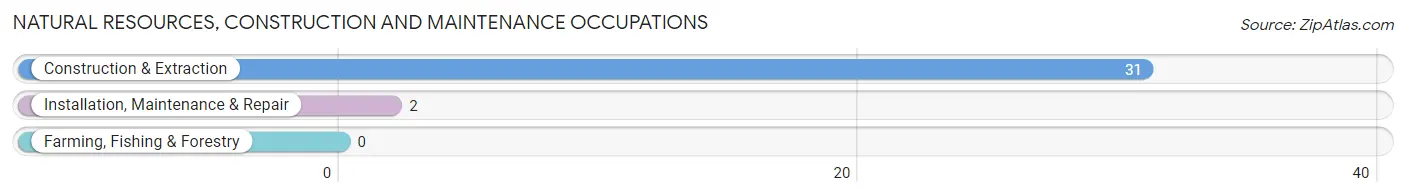
Natural Resources, Construction and Maintenance Occupations
The most common Natural Resources, Construction and Maintenance occupations in Watauga are Construction & Extraction (31 | 13.2%), and Installation, Maintenance & Repair (2 | 0.9%).
Natural Resources, Construction and Maintenance Occupations by Sex
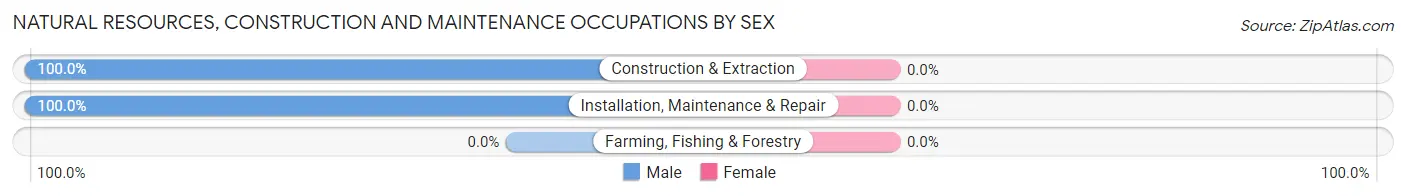
| Occupation | Male | Female |
| Farming, Fishing & Forestry | 0 (0.0%) | 0 (0.0%) |
| Construction & Extraction | 31 (100.0%) | 0 (0.0%) |
| Installation, Maintenance & Repair | 2 (100.0%) | 0 (0.0%) |
| Total (Category) | 33 (100.0%) | 0 (0.0%) |
| Total (Overall) | 103 (43.8%) | 132 (56.2%) |
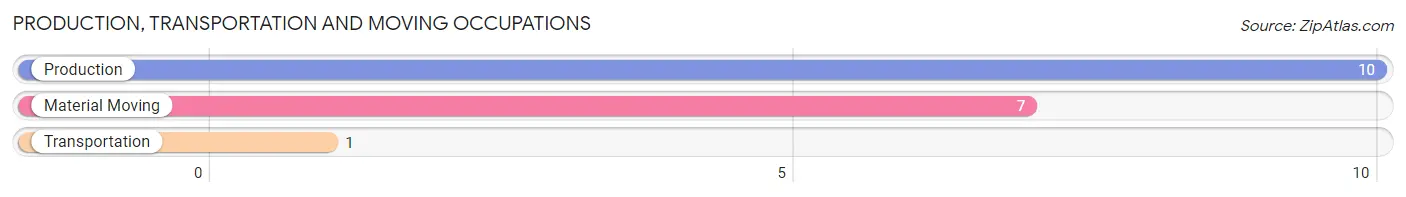
Production, Transportation and Moving Occupations
The most common Production, Transportation and Moving occupations in Watauga are Production (10 | 4.3%), Material Moving (7 | 3.0%), and Transportation (1 | 0.4%).
Production, Transportation and Moving Occupations by Sex
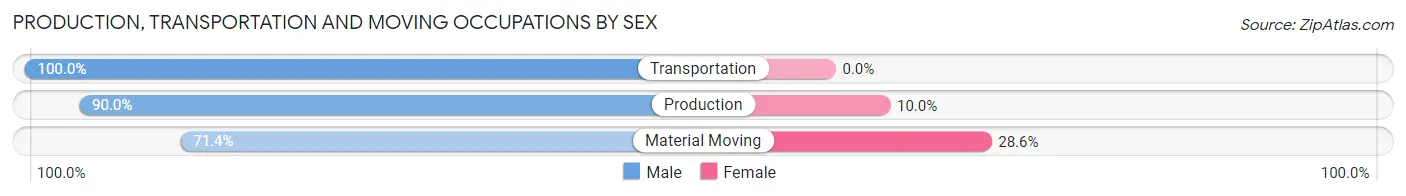
| Occupation | Male | Female |
| Production | 9 (90.0%) | 1 (10.0%) |
| Transportation | 1 (100.0%) | 0 (0.0%) |
| Material Moving | 5 (71.4%) | 2 (28.6%) |
| Total (Category) | 15 (83.3%) | 3 (16.7%) |
| Total (Overall) | 103 (43.8%) | 132 (56.2%) |
Employment Industries by Sex in Watauga
Employment Industries in Watauga
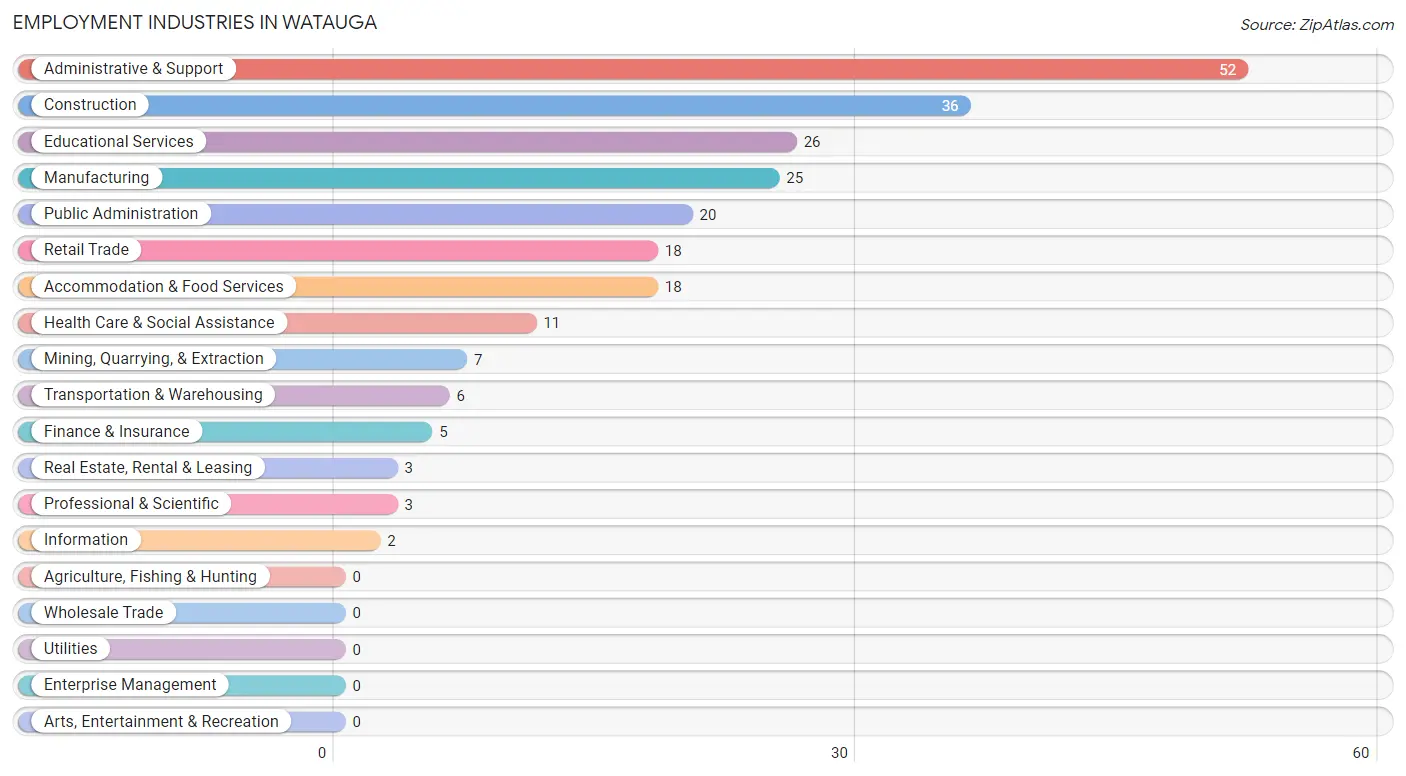
The major employment industries in Watauga include Administrative & Support (52 | 22.1%), Construction (36 | 15.3%), Educational Services (26 | 11.1%), Manufacturing (25 | 10.6%), and Public Administration (20 | 8.5%).
Employment Industries by Sex in Watauga
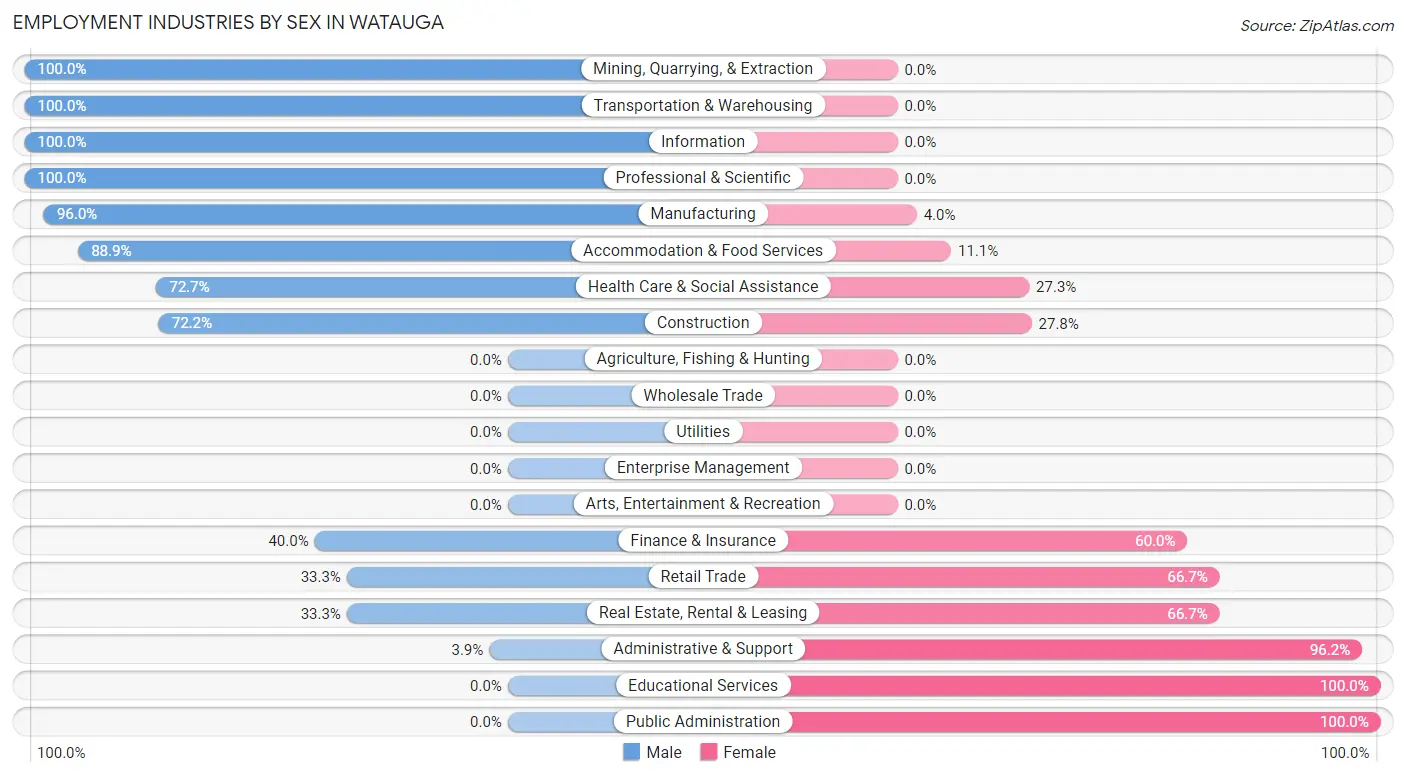
The Watauga industries that see more men than women are Mining, Quarrying, & Extraction (100.0%), Transportation & Warehousing (100.0%), and Information (100.0%), whereas the industries that tend to have a higher number of women are Educational Services (100.0%), Public Administration (100.0%), and Administrative & Support (96.2%).
| Industry | Male | Female |
| Agriculture, Fishing & Hunting | 0 (0.0%) | 0 (0.0%) |
| Mining, Quarrying, & Extraction | 7 (100.0%) | 0 (0.0%) |
| Construction | 26 (72.2%) | 10 (27.8%) |
| Manufacturing | 24 (96.0%) | 1 (4.0%) |
| Wholesale Trade | 0 (0.0%) | 0 (0.0%) |
| Retail Trade | 6 (33.3%) | 12 (66.7%) |
| Transportation & Warehousing | 6 (100.0%) | 0 (0.0%) |
| Utilities | 0 (0.0%) | 0 (0.0%) |
| Information | 2 (100.0%) | 0 (0.0%) |
| Finance & Insurance | 2 (40.0%) | 3 (60.0%) |
| Real Estate, Rental & Leasing | 1 (33.3%) | 2 (66.7%) |
| Professional & Scientific | 3 (100.0%) | 0 (0.0%) |
| Enterprise Management | 0 (0.0%) | 0 (0.0%) |
| Administrative & Support | 2 (3.8%) | 50 (96.2%) |
| Educational Services | 0 (0.0%) | 26 (100.0%) |
| Health Care & Social Assistance | 8 (72.7%) | 3 (27.3%) |
| Arts, Entertainment & Recreation | 0 (0.0%) | 0 (0.0%) |
| Accommodation & Food Services | 16 (88.9%) | 2 (11.1%) |
| Public Administration | 0 (0.0%) | 20 (100.0%) |
| Total | 103 (43.8%) | 132 (56.2%) |
Education in Watauga
School Enrollment in Watauga
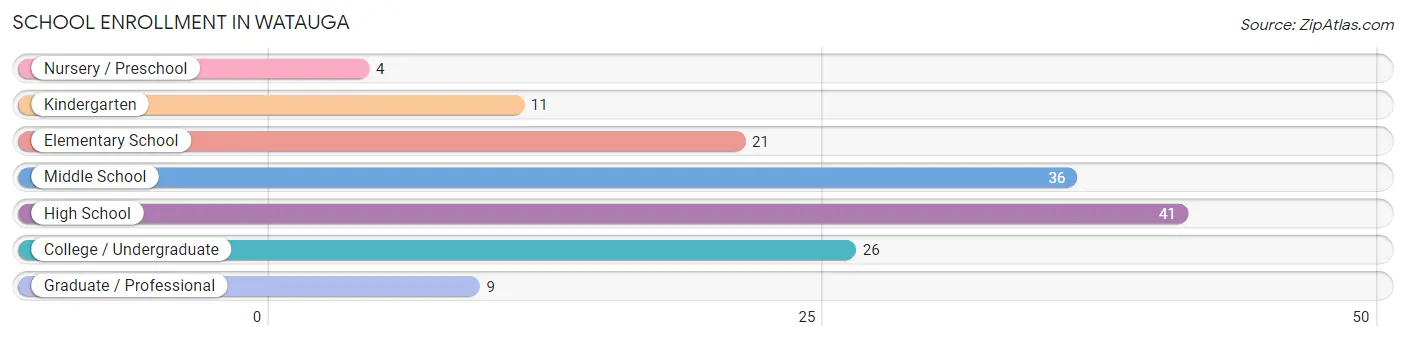
The most common levels of schooling among the 148 students in Watauga are high school (41 | 27.7%), middle school (36 | 24.3%), and college / undergraduate (26 | 17.6%).
| School Level | # Students | % Students |
| Nursery / Preschool | 4 | 2.7% |
| Kindergarten | 11 | 7.4% |
| Elementary School | 21 | 14.2% |
| Middle School | 36 | 24.3% |
| High School | 41 | 27.7% |
| College / Undergraduate | 26 | 17.6% |
| Graduate / Professional | 9 | 6.1% |
| Total | 148 | 100.0% |
School Enrollment by Age by Funding Source in Watauga
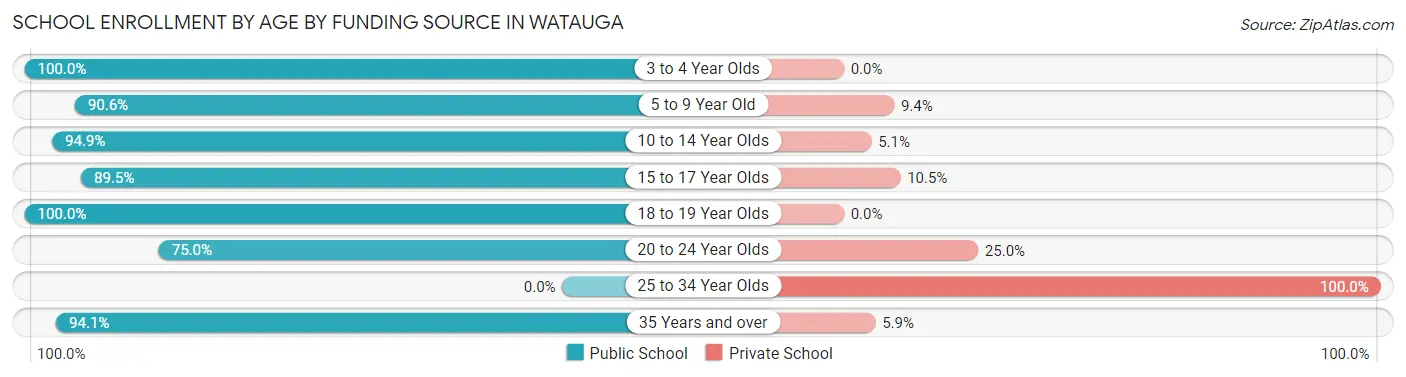
Out of a total of 148 students who are enrolled in schools in Watauga, 12 (8.1%) attend a private institution, while the remaining 136 (91.9%) are enrolled in public schools. The age group of 25 to 34 year olds has the highest likelihood of being enrolled in private schools, with 2 (100.0% in the age bracket) enrolled. Conversely, the age group of 3 to 4 year olds has the lowest likelihood of being enrolled in a private school, with 2 (100.0% in the age bracket) attending a public institution.
| Age Bracket | Public School | Private School |
| 3 to 4 Year Olds | 2 (100.0%) | 0 (0.0%) |
| 5 to 9 Year Old | 29 (90.6%) | 3 (9.4%) |
| 10 to 14 Year Olds | 37 (94.9%) | 2 (5.1%) |
| 15 to 17 Year Olds | 17 (89.5%) | 2 (10.5%) |
| 18 to 19 Year Olds | 16 (100.0%) | 0 (0.0%) |
| 20 to 24 Year Olds | 3 (75.0%) | 1 (25.0%) |
| 25 to 34 Year Olds | 0 (0.0%) | 2 (100.0%) |
| 35 Years and over | 32 (94.1%) | 2 (5.9%) |
| Total | 136 (91.9%) | 12 (8.1%) |
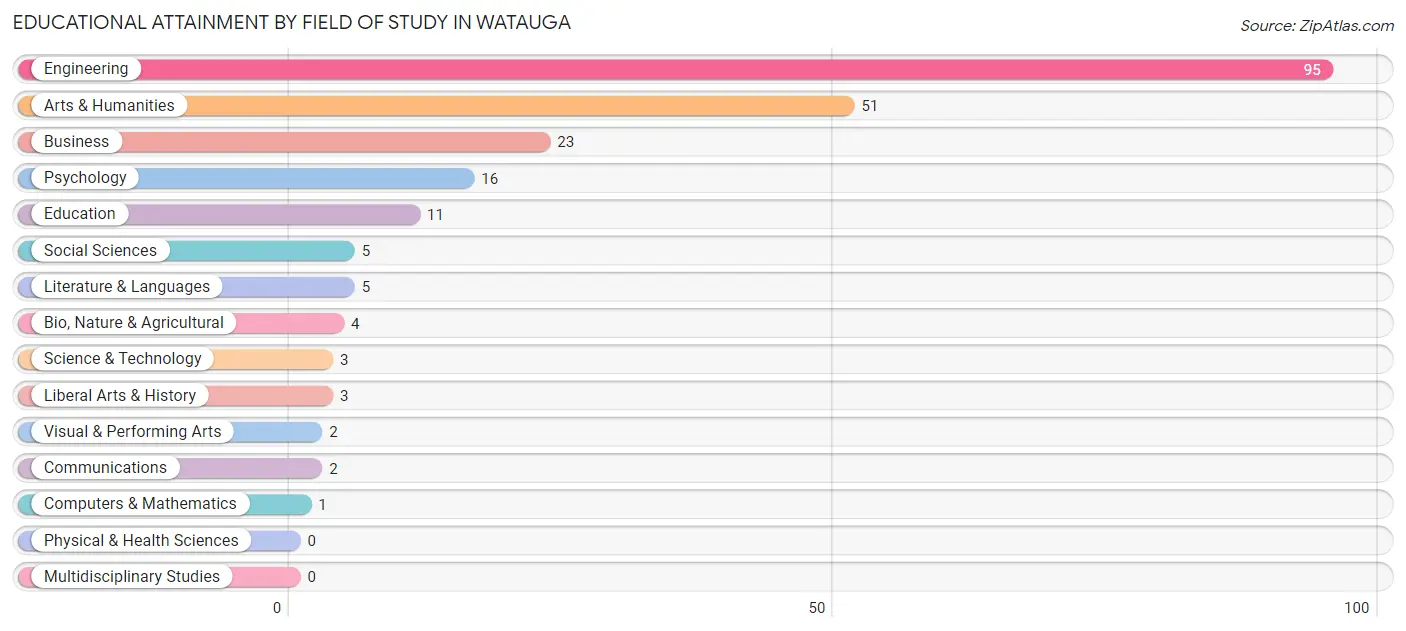
Educational Attainment by Field of Study in Watauga
Engineering (95 | 43.0%), arts & humanities (51 | 23.1%), business (23 | 10.4%), psychology (16 | 7.2%), and education (11 | 5.0%) are the most common fields of study among 221 individuals in Watauga who have obtained a bachelor's degree or higher.
| Field of Study | # Graduates | % Graduates |
| Computers & Mathematics | 1 | 0.4% |
| Bio, Nature & Agricultural | 4 | 1.8% |
| Physical & Health Sciences | 0 | 0.0% |
| Psychology | 16 | 7.2% |
| Social Sciences | 5 | 2.3% |
| Engineering | 95 | 43.0% |
| Multidisciplinary Studies | 0 | 0.0% |
| Science & Technology | 3 | 1.4% |
| Business | 23 | 10.4% |
| Education | 11 | 5.0% |
| Literature & Languages | 5 | 2.3% |
| Liberal Arts & History | 3 | 1.4% |
| Visual & Performing Arts | 2 | 0.9% |
| Communications | 2 | 0.9% |
| Arts & Humanities | 51 | 23.1% |
| Total | 221 | 100.0% |
Transportation & Commute in Watauga
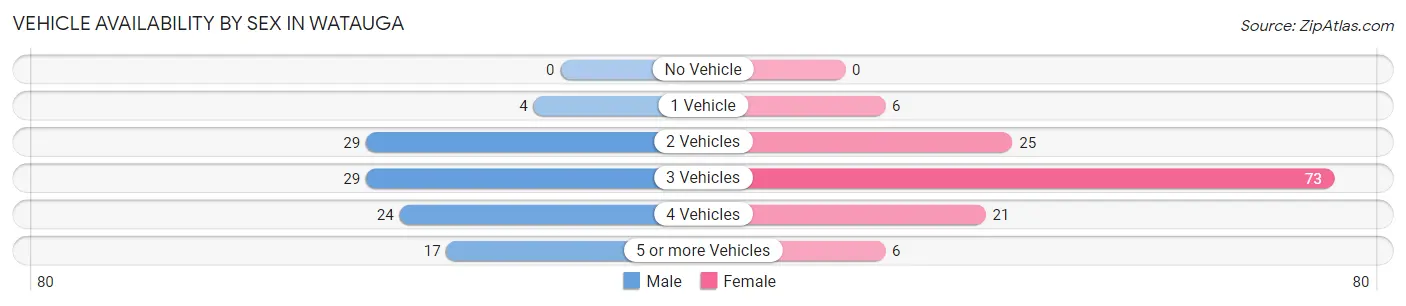
Vehicle Availability by Sex in Watauga
The most prevalent vehicle ownership categories in Watauga are males with 2 vehicles (29, accounting for 28.2%) and females with 2 vehicles (25, making up 22.1%).
| Vehicles Available | Male | Female |
| No Vehicle | 0 (0.0%) | 0 (0.0%) |
| 1 Vehicle | 4 (3.9%) | 6 (4.6%) |
| 2 Vehicles | 29 (28.2%) | 25 (19.1%) |
| 3 Vehicles | 29 (28.2%) | 73 (55.7%) |
| 4 Vehicles | 24 (23.3%) | 21 (16.0%) |
| 5 or more Vehicles | 17 (16.5%) | 6 (4.6%) |
| Total | 103 (100.0%) | 131 (100.0%) |
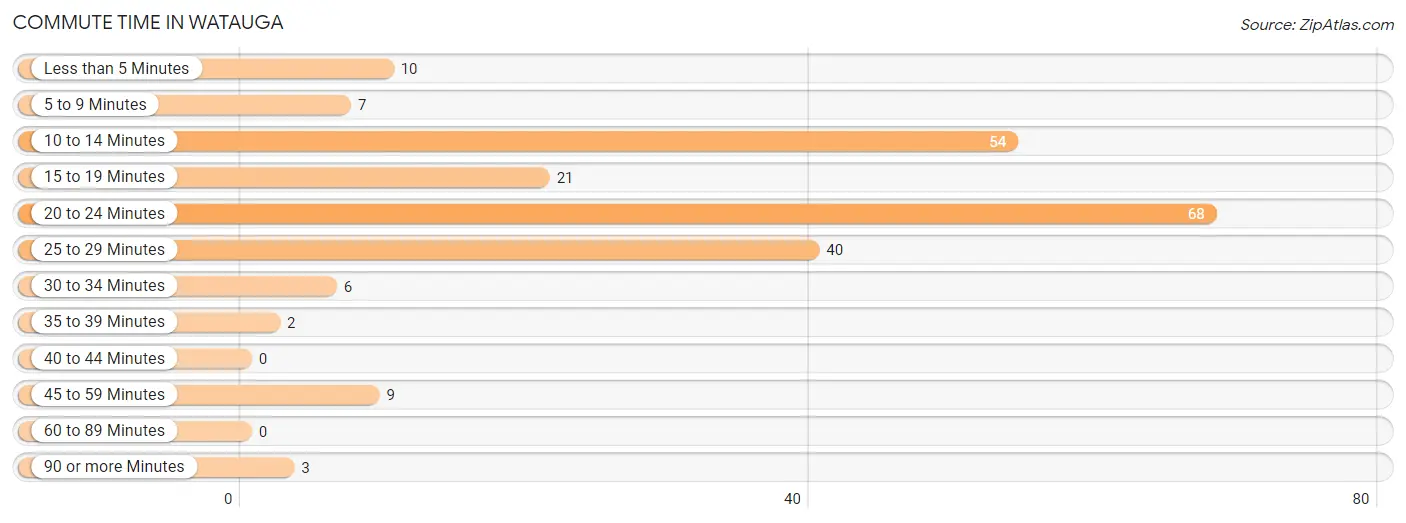
Commute Time in Watauga
The most frequently occuring commute durations in Watauga are 20 to 24 minutes (68 commuters, 30.9%), 10 to 14 minutes (54 commuters, 24.5%), and 25 to 29 minutes (40 commuters, 18.2%).
| Commute Time | # Commuters | % Commuters |
| Less than 5 Minutes | 10 | 4.5% |
| 5 to 9 Minutes | 7 | 3.2% |
| 10 to 14 Minutes | 54 | 24.5% |
| 15 to 19 Minutes | 21 | 9.6% |
| 20 to 24 Minutes | 68 | 30.9% |
| 25 to 29 Minutes | 40 | 18.2% |
| 30 to 34 Minutes | 6 | 2.7% |
| 35 to 39 Minutes | 2 | 0.9% |
| 40 to 44 Minutes | 0 | 0.0% |
| 45 to 59 Minutes | 9 | 4.1% |
| 60 to 89 Minutes | 0 | 0.0% |
| 90 or more Minutes | 3 | 1.4% |
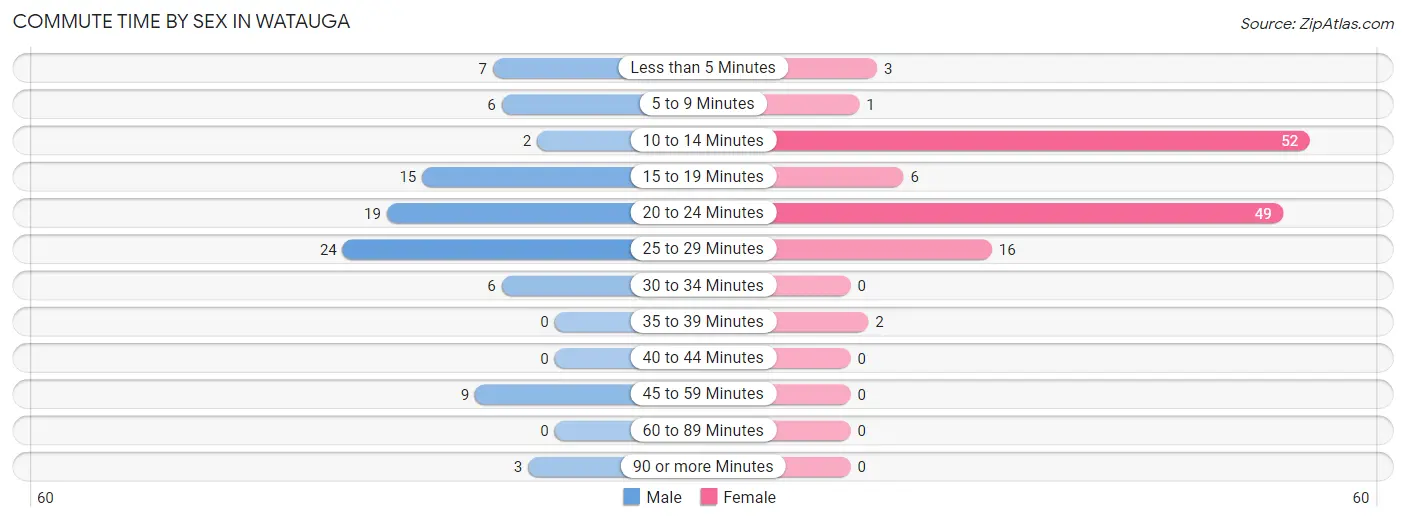
Commute Time by Sex in Watauga
The most common commute times in Watauga are 25 to 29 minutes (24 commuters, 26.4%) for males and 10 to 14 minutes (52 commuters, 40.3%) for females.
| Commute Time | Male | Female |
| Less than 5 Minutes | 7 (7.7%) | 3 (2.3%) |
| 5 to 9 Minutes | 6 (6.6%) | 1 (0.8%) |
| 10 to 14 Minutes | 2 (2.2%) | 52 (40.3%) |
| 15 to 19 Minutes | 15 (16.5%) | 6 (4.6%) |
| 20 to 24 Minutes | 19 (20.9%) | 49 (38.0%) |
| 25 to 29 Minutes | 24 (26.4%) | 16 (12.4%) |
| 30 to 34 Minutes | 6 (6.6%) | 0 (0.0%) |
| 35 to 39 Minutes | 0 (0.0%) | 2 (1.5%) |
| 40 to 44 Minutes | 0 (0.0%) | 0 (0.0%) |
| 45 to 59 Minutes | 9 (9.9%) | 0 (0.0%) |
| 60 to 89 Minutes | 0 (0.0%) | 0 (0.0%) |
| 90 or more Minutes | 3 (3.3%) | 0 (0.0%) |
Time of Departure to Work by Sex in Watauga
The most frequent times of departure to work in Watauga are 6:30 AM to 6:59 AM (27, 29.7%) for males and 12:00 PM to 3:59 PM (45, 34.9%) for females.
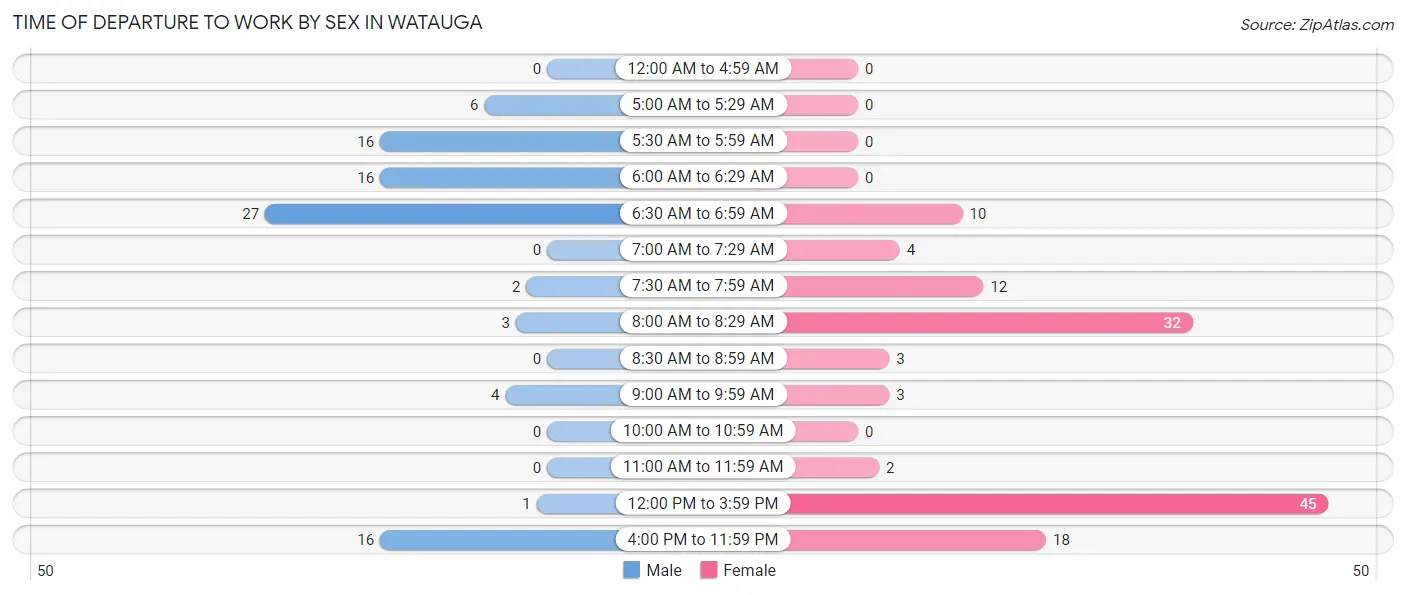
| Time of Departure | Male | Female |
| 12:00 AM to 4:59 AM | 0 (0.0%) | 0 (0.0%) |
| 5:00 AM to 5:29 AM | 6 (6.6%) | 0 (0.0%) |
| 5:30 AM to 5:59 AM | 16 (17.6%) | 0 (0.0%) |
| 6:00 AM to 6:29 AM | 16 (17.6%) | 0 (0.0%) |
| 6:30 AM to 6:59 AM | 27 (29.7%) | 10 (7.7%) |
| 7:00 AM to 7:29 AM | 0 (0.0%) | 4 (3.1%) |
| 7:30 AM to 7:59 AM | 2 (2.2%) | 12 (9.3%) |
| 8:00 AM to 8:29 AM | 3 (3.3%) | 32 (24.8%) |
| 8:30 AM to 8:59 AM | 0 (0.0%) | 3 (2.3%) |
| 9:00 AM to 9:59 AM | 4 (4.4%) | 3 (2.3%) |
| 10:00 AM to 10:59 AM | 0 (0.0%) | 0 (0.0%) |
| 11:00 AM to 11:59 AM | 0 (0.0%) | 2 (1.5%) |
| 12:00 PM to 3:59 PM | 1 (1.1%) | 45 (34.9%) |
| 4:00 PM to 11:59 PM | 16 (17.6%) | 18 (14.0%) |
| Total | 91 (100.0%) | 129 (100.0%) |
Housing Occupancy in Watauga
Occupancy by Ownership in Watauga
Of the total 323 dwellings in Watauga, owner-occupied units account for 300 (92.9%), while renter-occupied units make up 23 (7.1%).
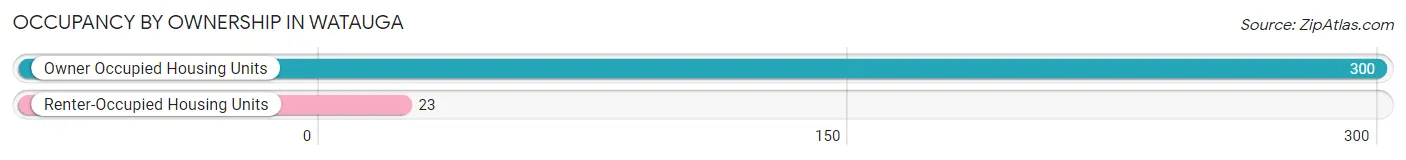
| Occupancy | # Housing Units | % Housing Units |
| Owner Occupied Housing Units | 300 | 92.9% |
| Renter-Occupied Housing Units | 23 | 7.1% |
| Total Occupied Housing Units | 323 | 100.0% |
Occupancy by Household Size in Watauga
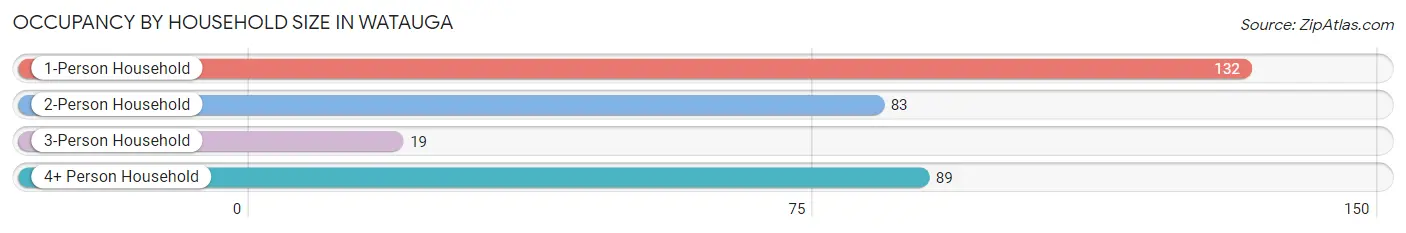
| Household Size | # Housing Units | % Housing Units |
| 1-Person Household | 132 | 40.9% |
| 2-Person Household | 83 | 25.7% |
| 3-Person Household | 19 | 5.9% |
| 4+ Person Household | 89 | 27.6% |
| Total Housing Units | 323 | 100.0% |
Occupancy by Ownership by Household Size in Watauga
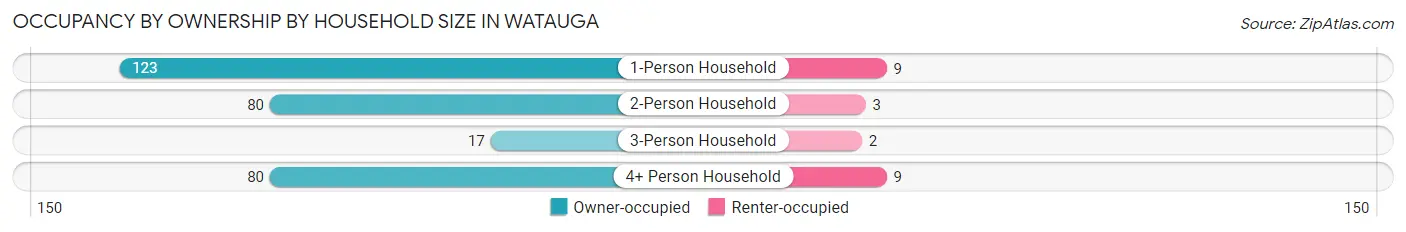
| Household Size | Owner-occupied | Renter-occupied |
| 1-Person Household | 123 (93.2%) | 9 (6.8%) |
| 2-Person Household | 80 (96.4%) | 3 (3.6%) |
| 3-Person Household | 17 (89.5%) | 2 (10.5%) |
| 4+ Person Household | 80 (89.9%) | 9 (10.1%) |
| Total Housing Units | 300 (92.9%) | 23 (7.1%) |
Occupancy by Educational Attainment in Watauga
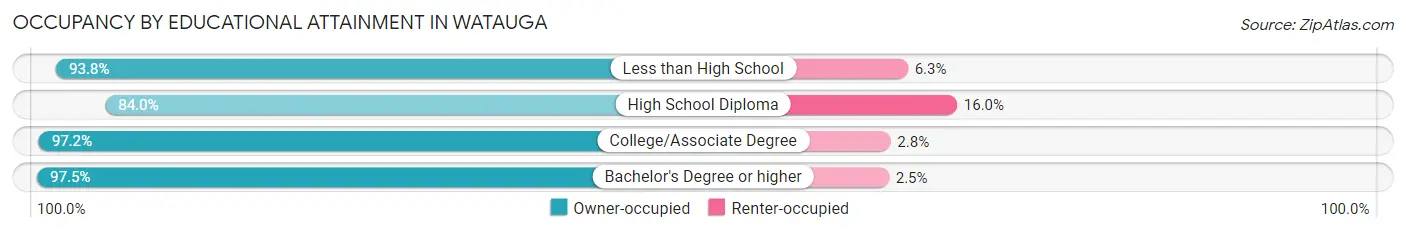
| Household Size | Owner-occupied | Renter-occupied |
| Less than High School | 30 (93.8%) | 2 (6.2%) |
| High School Diploma | 84 (84.0%) | 16 (16.0%) |
| College/Associate Degree | 69 (97.2%) | 2 (2.8%) |
| Bachelor's Degree or higher | 117 (97.5%) | 3 (2.5%) |
Occupancy by Age of Householder in Watauga
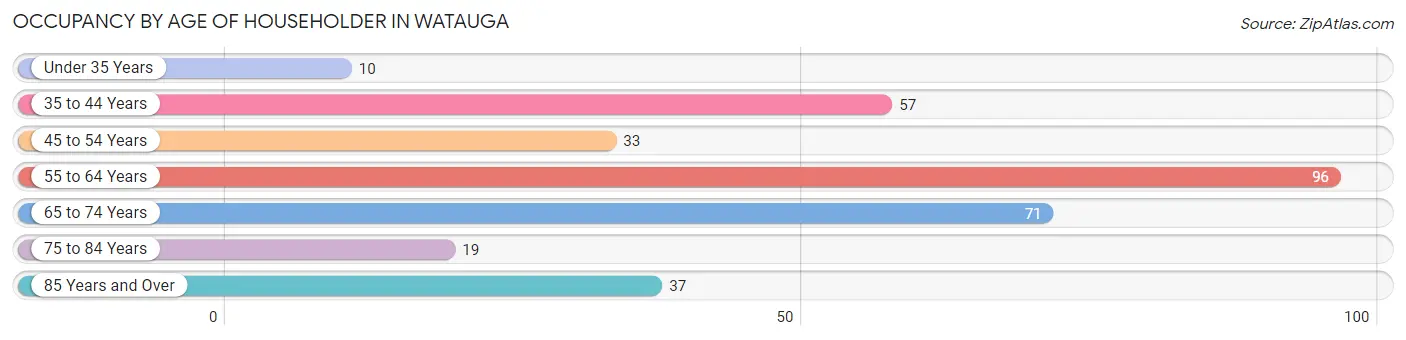
| Age Bracket | # Households | % Households |
| Under 35 Years | 10 | 3.1% |
| 35 to 44 Years | 57 | 17.6% |
| 45 to 54 Years | 33 | 10.2% |
| 55 to 64 Years | 96 | 29.7% |
| 65 to 74 Years | 71 | 22.0% |
| 75 to 84 Years | 19 | 5.9% |
| 85 Years and Over | 37 | 11.5% |
| Total | 323 | 100.0% |
Housing Finances in Watauga
Median Income by Occupancy in Watauga
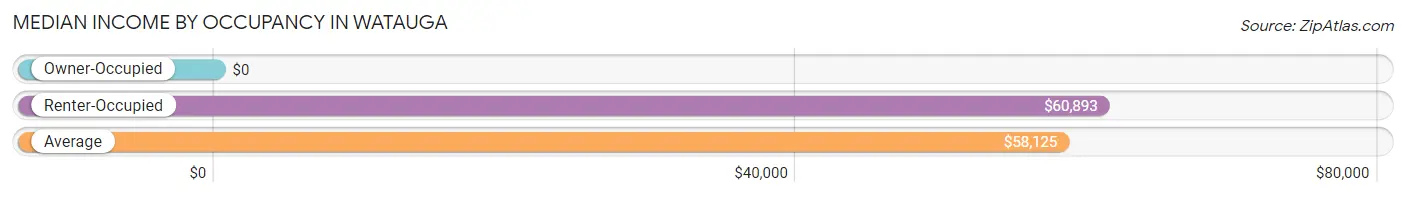
| Occupancy Type | # Households | Median Income |
| Owner-Occupied | 300 (92.9%) | $0 |
| Renter-Occupied | 23 (7.1%) | $60,893 |
| Average | 323 (100.0%) | $58,125 |
Occupancy by Householder Income Bracket in Watauga
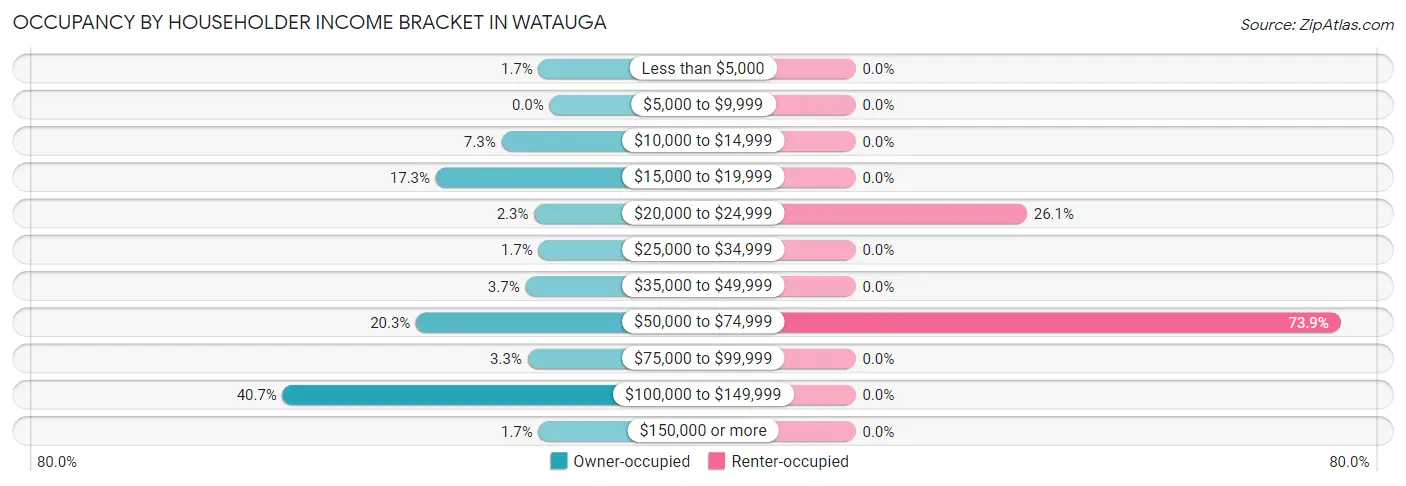
| Income Bracket | Owner-occupied | Renter-occupied |
| Less than $5,000 | 5 (1.7%) | 0 (0.0%) |
| $5,000 to $9,999 | 0 (0.0%) | 0 (0.0%) |
| $10,000 to $14,999 | 22 (7.3%) | 0 (0.0%) |
| $15,000 to $19,999 | 52 (17.3%) | 0 (0.0%) |
| $20,000 to $24,999 | 7 (2.3%) | 6 (26.1%) |
| $25,000 to $34,999 | 5 (1.7%) | 0 (0.0%) |
| $35,000 to $49,999 | 11 (3.7%) | 0 (0.0%) |
| $50,000 to $74,999 | 61 (20.3%) | 17 (73.9%) |
| $75,000 to $99,999 | 10 (3.3%) | 0 (0.0%) |
| $100,000 to $149,999 | 122 (40.7%) | 0 (0.0%) |
| $150,000 or more | 5 (1.7%) | 0 (0.0%) |
| Total | 300 (100.0%) | 23 (100.0%) |
Monthly Housing Cost Tiers in Watauga
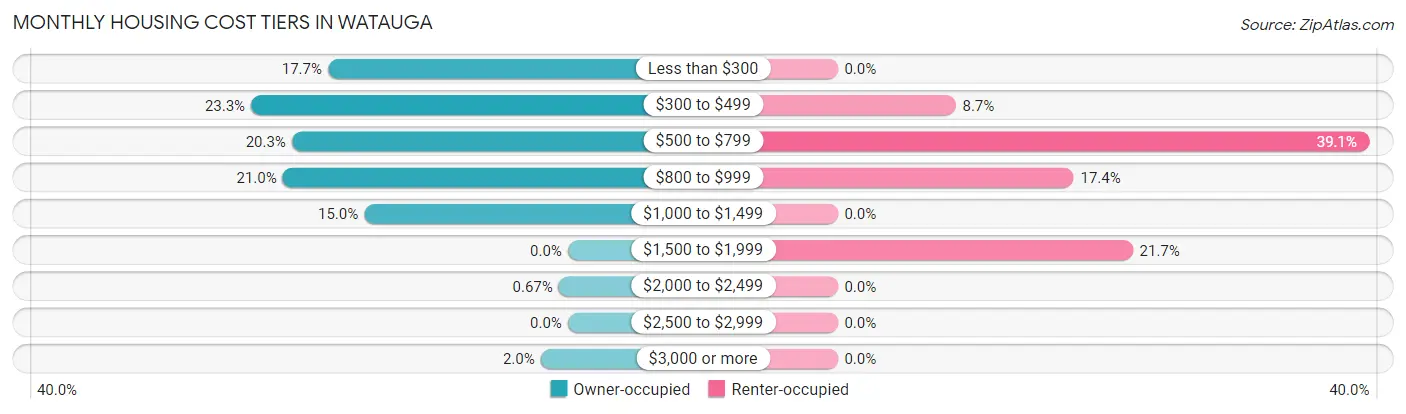
| Monthly Cost | Owner-occupied | Renter-occupied |
| Less than $300 | 53 (17.7%) | 0 (0.0%) |
| $300 to $499 | 70 (23.3%) | 2 (8.7%) |
| $500 to $799 | 61 (20.3%) | 9 (39.1%) |
| $800 to $999 | 63 (21.0%) | 4 (17.4%) |
| $1,000 to $1,499 | 45 (15.0%) | 0 (0.0%) |
| $1,500 to $1,999 | 0 (0.0%) | 5 (21.7%) |
| $2,000 to $2,499 | 2 (0.7%) | 0 (0.0%) |
| $2,500 to $2,999 | 0 (0.0%) | 0 (0.0%) |
| $3,000 or more | 6 (2.0%) | 0 (0.0%) |
| Total | 300 (100.0%) | 23 (100.0%) |
Physical Housing Characteristics in Watauga
Housing Structures in Watauga
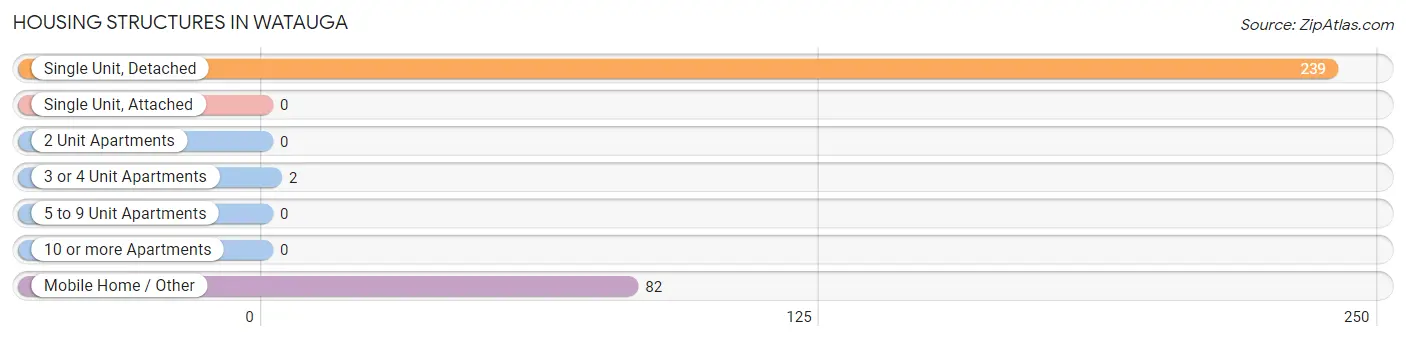
| Structure Type | # Housing Units | % Housing Units |
| Single Unit, Detached | 239 | 74.0% |
| Single Unit, Attached | 0 | 0.0% |
| 2 Unit Apartments | 0 | 0.0% |
| 3 or 4 Unit Apartments | 2 | 0.6% |
| 5 to 9 Unit Apartments | 0 | 0.0% |
| 10 or more Apartments | 0 | 0.0% |
| Mobile Home / Other | 82 | 25.4% |
| Total | 323 | 100.0% |
Housing Structures by Occupancy in Watauga
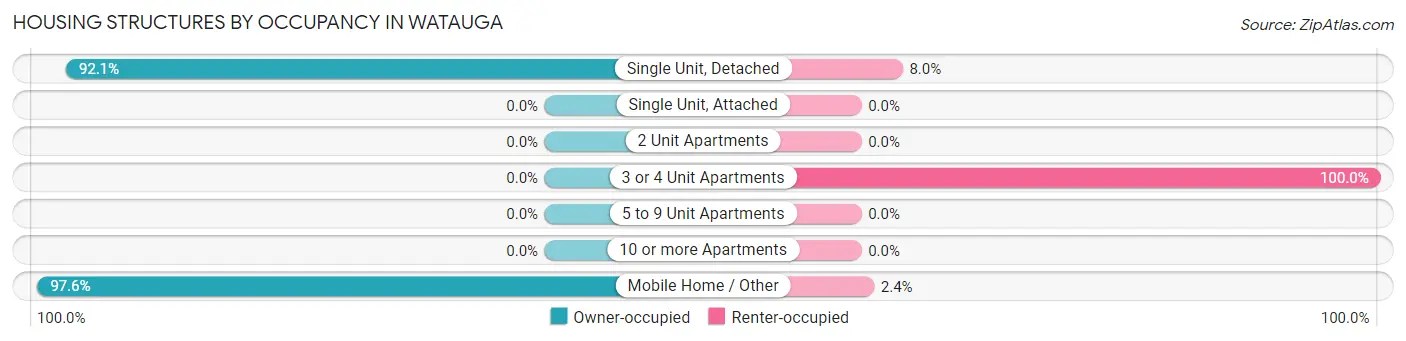
| Structure Type | Owner-occupied | Renter-occupied |
| Single Unit, Detached | 220 (92.0%) | 19 (8.0%) |
| Single Unit, Attached | 0 (0.0%) | 0 (0.0%) |
| 2 Unit Apartments | 0 (0.0%) | 0 (0.0%) |
| 3 or 4 Unit Apartments | 0 (0.0%) | 2 (100.0%) |
| 5 to 9 Unit Apartments | 0 (0.0%) | 0 (0.0%) |
| 10 or more Apartments | 0 (0.0%) | 0 (0.0%) |
| Mobile Home / Other | 80 (97.6%) | 2 (2.4%) |
| Total | 300 (92.9%) | 23 (7.1%) |
Housing Structures by Number of Rooms in Watauga
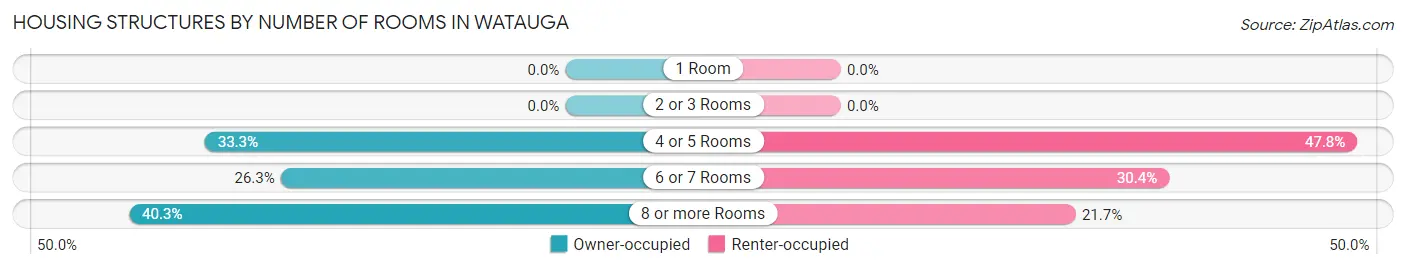
| Number of Rooms | Owner-occupied | Renter-occupied |
| 1 Room | 0 (0.0%) | 0 (0.0%) |
| 2 or 3 Rooms | 0 (0.0%) | 0 (0.0%) |
| 4 or 5 Rooms | 100 (33.3%) | 11 (47.8%) |
| 6 or 7 Rooms | 79 (26.3%) | 7 (30.4%) |
| 8 or more Rooms | 121 (40.3%) | 5 (21.7%) |
| Total | 300 (100.0%) | 23 (100.0%) |
Housing Structure by Heating Type in Watauga
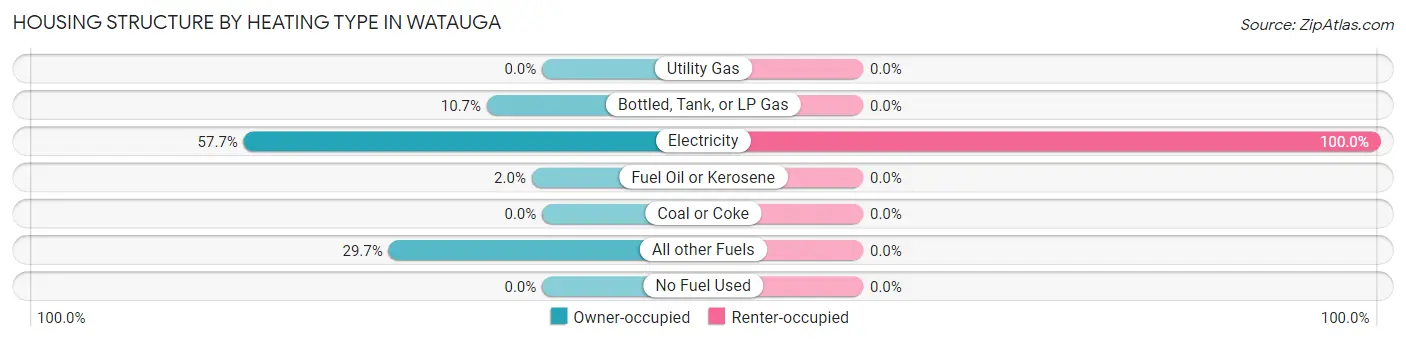
| Heating Type | Owner-occupied | Renter-occupied |
| Utility Gas | 0 (0.0%) | 0 (0.0%) |
| Bottled, Tank, or LP Gas | 32 (10.7%) | 0 (0.0%) |
| Electricity | 173 (57.7%) | 23 (100.0%) |
| Fuel Oil or Kerosene | 6 (2.0%) | 0 (0.0%) |
| Coal or Coke | 0 (0.0%) | 0 (0.0%) |
| All other Fuels | 89 (29.7%) | 0 (0.0%) |
| No Fuel Used | 0 (0.0%) | 0 (0.0%) |
| Total | 300 (100.0%) | 23 (100.0%) |
Household Vehicle Usage in Watauga
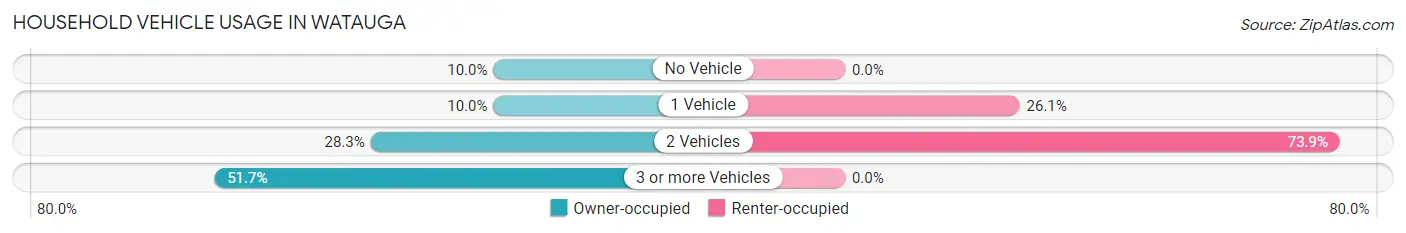
| Vehicles per Household | Owner-occupied | Renter-occupied |
| No Vehicle | 30 (10.0%) | 0 (0.0%) |
| 1 Vehicle | 30 (10.0%) | 6 (26.1%) |
| 2 Vehicles | 85 (28.3%) | 17 (73.9%) |
| 3 or more Vehicles | 155 (51.7%) | 0 (0.0%) |
| Total | 300 (100.0%) | 23 (100.0%) |
Real Estate & Mortgages in Watauga
Real Estate and Mortgage Overview in Watauga
| Characteristic | Without Mortgage | With Mortgage |
| Housing Units | 174 | 126 |
| Median Property Value | $139,200 | $127,200 |
| Median Household Income | - | - |
| Monthly Housing Costs | $395 | $6 |
| Real Estate Taxes | $887 | $2 |
Property Value by Mortgage Status in Watauga
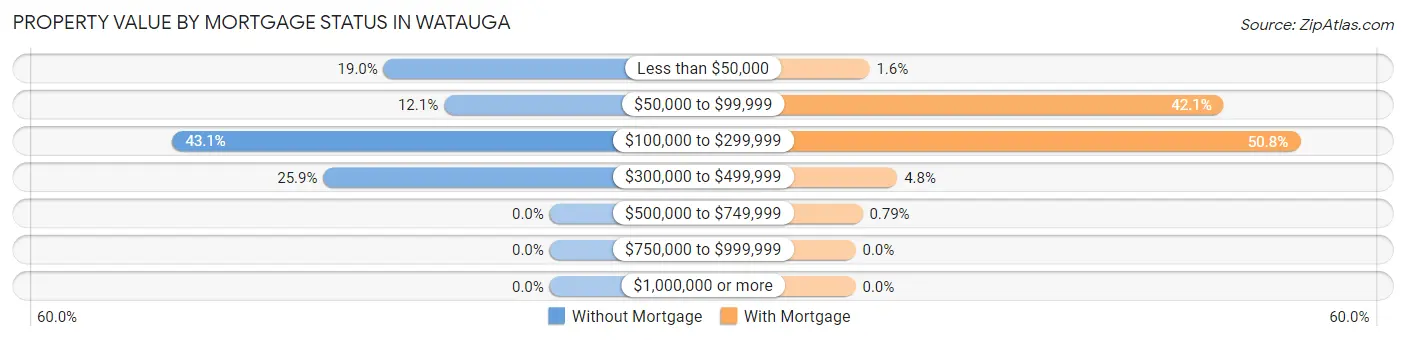
| Property Value | Without Mortgage | With Mortgage |
| Less than $50,000 | 33 (19.0%) | 2 (1.6%) |
| $50,000 to $99,999 | 21 (12.1%) | 53 (42.1%) |
| $100,000 to $299,999 | 75 (43.1%) | 64 (50.8%) |
| $300,000 to $499,999 | 45 (25.9%) | 6 (4.8%) |
| $500,000 to $749,999 | 0 (0.0%) | 1 (0.8%) |
| $750,000 to $999,999 | 0 (0.0%) | 0 (0.0%) |
| $1,000,000 or more | 0 (0.0%) | 0 (0.0%) |
| Total | 174 (100.0%) | 126 (100.0%) |
Household Income by Mortgage Status in Watauga
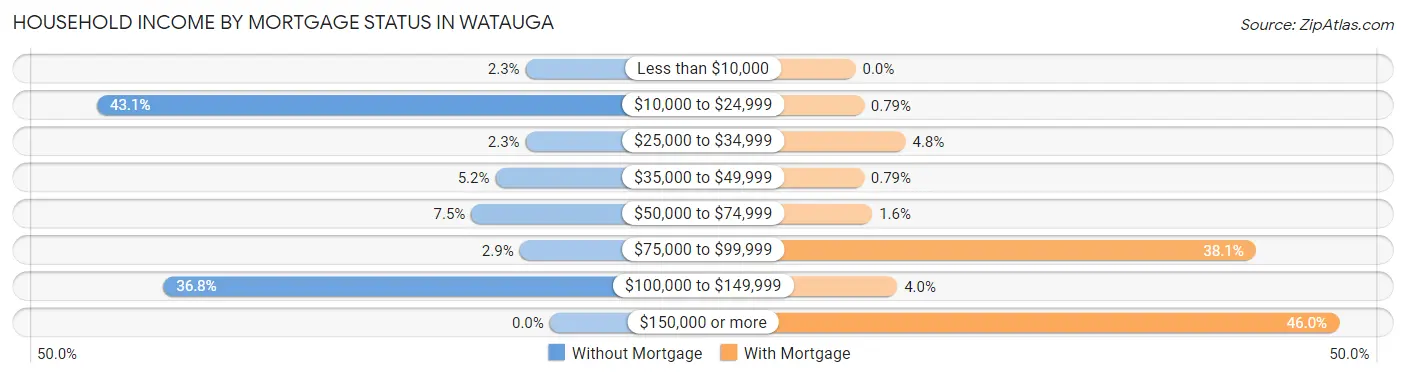
| Household Income | Without Mortgage | With Mortgage |
| Less than $10,000 | 4 (2.3%) | 0 (0.0%) |
| $10,000 to $24,999 | 75 (43.1%) | 1 (0.8%) |
| $25,000 to $34,999 | 4 (2.3%) | 6 (4.8%) |
| $35,000 to $49,999 | 9 (5.2%) | 1 (0.8%) |
| $50,000 to $74,999 | 13 (7.5%) | 2 (1.6%) |
| $75,000 to $99,999 | 5 (2.9%) | 48 (38.1%) |
| $100,000 to $149,999 | 64 (36.8%) | 5 (4.0%) |
| $150,000 or more | 0 (0.0%) | 58 (46.0%) |
| Total | 174 (100.0%) | 126 (100.0%) |
Property Value to Household Income Ratio in Watauga
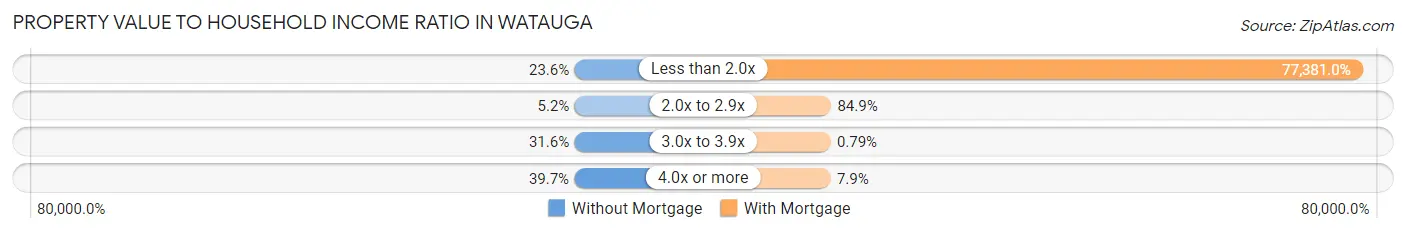
| Value-to-Income Ratio | Without Mortgage | With Mortgage |
| Less than 2.0x | 41 (23.6%) | 97,500 (77,380.9%) |
| 2.0x to 2.9x | 9 (5.2%) | 107 (84.9%) |
| 3.0x to 3.9x | 55 (31.6%) | 1 (0.8%) |
| 4.0x or more | 69 (39.7%) | 10 (7.9%) |
| Total | 174 (100.0%) | 126 (100.0%) |
Real Estate Taxes by Mortgage Status in Watauga
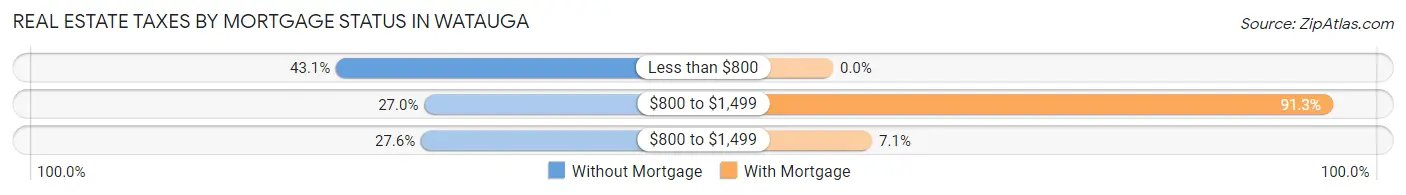
| Property Taxes | Without Mortgage | With Mortgage |
| Less than $800 | 75 (43.1%) | 0 (0.0%) |
| $800 to $1,499 | 47 (27.0%) | 115 (91.3%) |
| $800 to $1,499 | 48 (27.6%) | 9 (7.1%) |
| Total | 174 (100.0%) | 126 (100.0%) |
Health & Disability in Watauga
Health Insurance Coverage by Age in Watauga
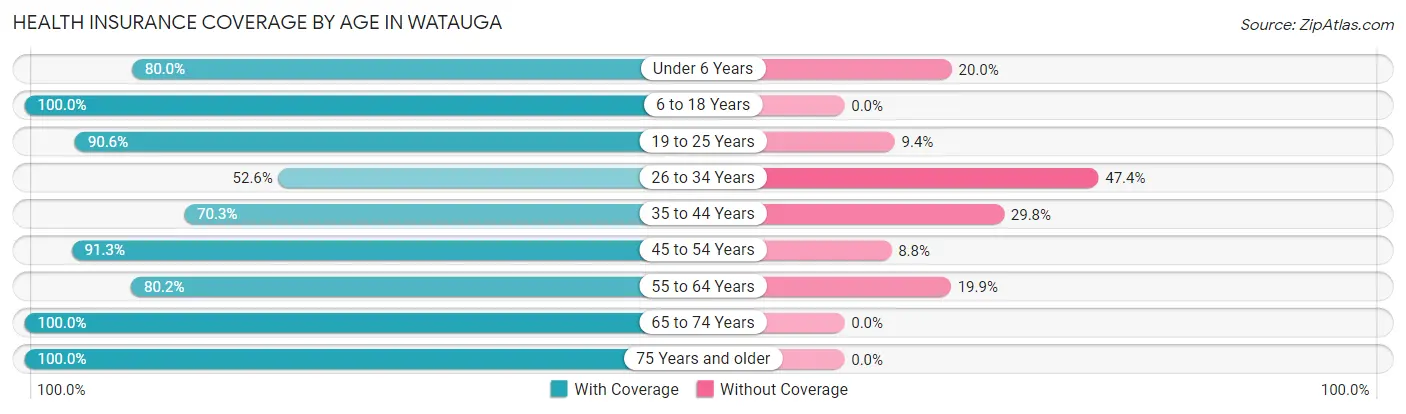
| Age Bracket | With Coverage | Without Coverage |
| Under 6 Years | 20 (80.0%) | 5 (20.0%) |
| 6 to 18 Years | 101 (100.0%) | 0 (0.0%) |
| 19 to 25 Years | 58 (90.6%) | 6 (9.4%) |
| 26 to 34 Years | 20 (52.6%) | 18 (47.4%) |
| 35 to 44 Years | 85 (70.3%) | 36 (29.7%) |
| 45 to 54 Years | 73 (91.2%) | 7 (8.7%) |
| 55 to 64 Years | 109 (80.1%) | 27 (19.9%) |
| 65 to 74 Years | 86 (100.0%) | 0 (0.0%) |
| 75 Years and older | 63 (100.0%) | 0 (0.0%) |
| Total | 615 (86.1%) | 99 (13.9%) |
Health Insurance Coverage by Citizenship Status in Watauga
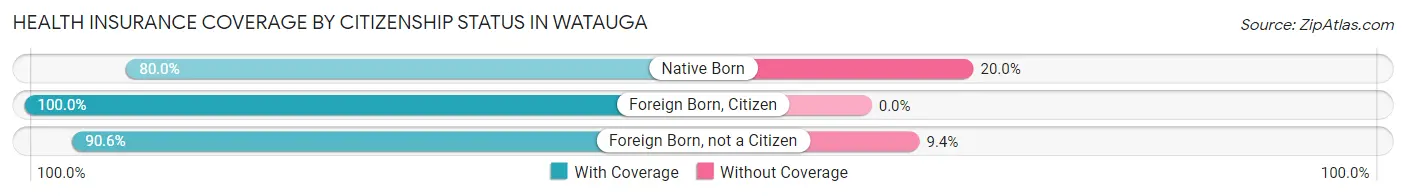
| Citizenship Status | With Coverage | Without Coverage |
| Native Born | 20 (80.0%) | 5 (20.0%) |
| Foreign Born, Citizen | 101 (100.0%) | 0 (0.0%) |
| Foreign Born, not a Citizen | 58 (90.6%) | 6 (9.4%) |
Health Insurance Coverage by Household Income in Watauga
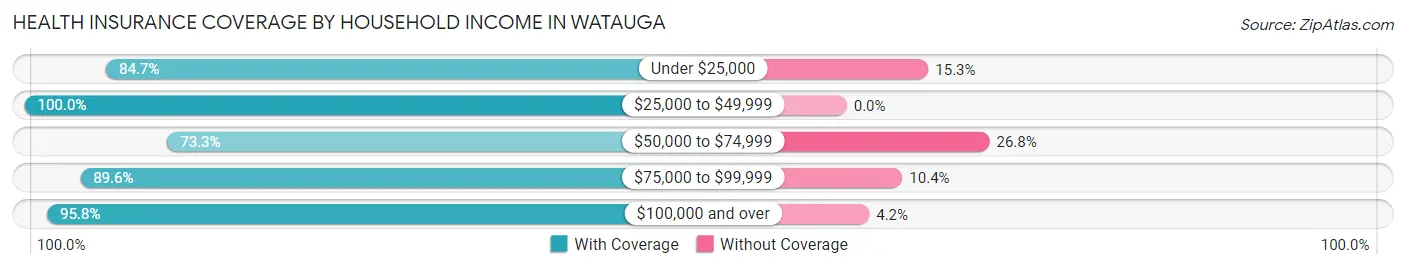
| Household Income | With Coverage | Without Coverage |
| Under $25,000 | 122 (84.7%) | 22 (15.3%) |
| $25,000 to $49,999 | 33 (100.0%) | 0 (0.0%) |
| $50,000 to $74,999 | 167 (73.3%) | 61 (26.8%) |
| $75,000 to $99,999 | 43 (89.6%) | 5 (10.4%) |
| $100,000 and over | 250 (95.8%) | 11 (4.2%) |
Public vs Private Health Insurance Coverage by Age in Watauga
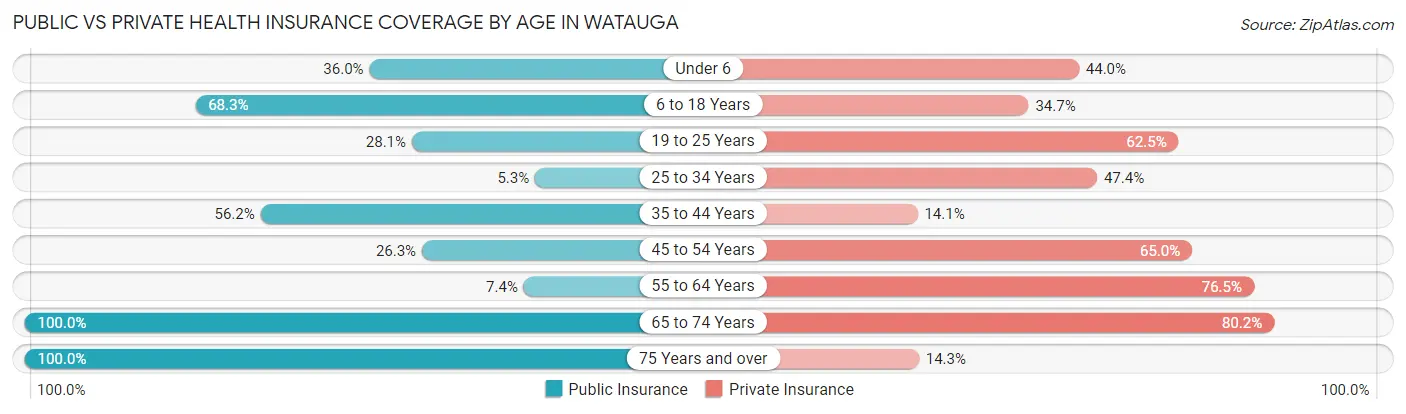
| Age Bracket | Public Insurance | Private Insurance |
| Under 6 | 9 (36.0%) | 11 (44.0%) |
| 6 to 18 Years | 69 (68.3%) | 35 (34.6%) |
| 19 to 25 Years | 18 (28.1%) | 40 (62.5%) |
| 25 to 34 Years | 2 (5.3%) | 18 (47.4%) |
| 35 to 44 Years | 68 (56.2%) | 17 (14.1%) |
| 45 to 54 Years | 21 (26.3%) | 52 (65.0%) |
| 55 to 64 Years | 10 (7.3%) | 104 (76.5%) |
| 65 to 74 Years | 86 (100.0%) | 69 (80.2%) |
| 75 Years and over | 63 (100.0%) | 9 (14.3%) |
| Total | 346 (48.5%) | 355 (49.7%) |
Disability Status by Sex by Age in Watauga
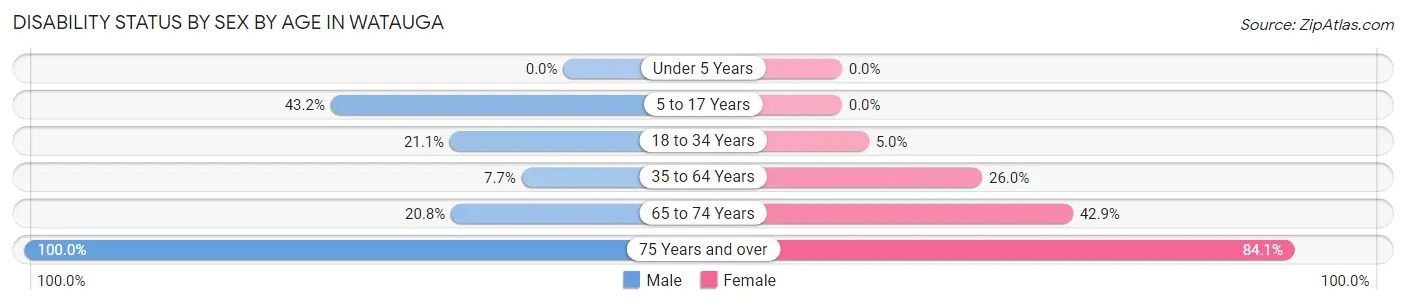
| Age Bracket | Male | Female |
| Under 5 Years | 0 (0.0%) | 0 (0.0%) |
| 5 to 17 Years | 19 (43.2%) | 0 (0.0%) |
| 18 to 34 Years | 16 (21.0%) | 2 (5.0%) |
| 35 to 64 Years | 13 (7.7%) | 44 (26.0%) |
| 65 to 74 Years | 15 (20.8%) | 6 (42.9%) |
| 75 Years and over | 19 (100.0%) | 37 (84.1%) |
Disability Class by Sex by Age in Watauga
Disability Class: Hearing Difficulty
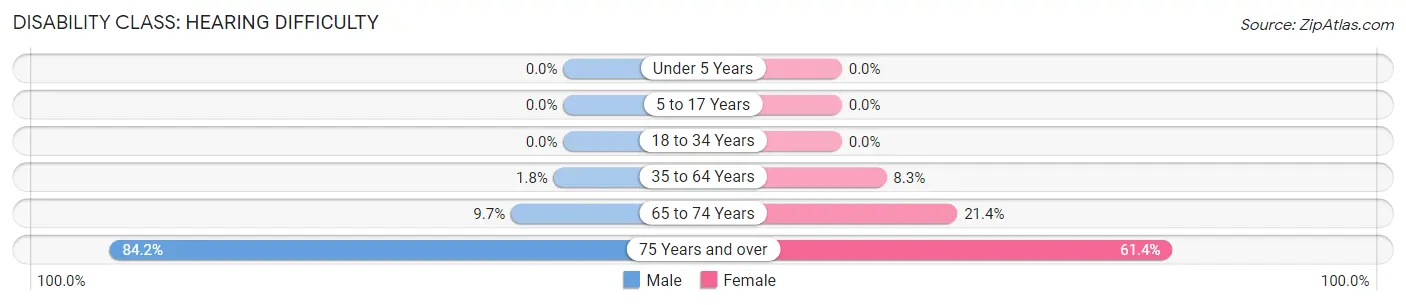
| Age Bracket | Male | Female |
| Under 5 Years | 0 (0.0%) | 0 (0.0%) |
| 5 to 17 Years | 0 (0.0%) | 0 (0.0%) |
| 18 to 34 Years | 0 (0.0%) | 0 (0.0%) |
| 35 to 64 Years | 3 (1.8%) | 14 (8.3%) |
| 65 to 74 Years | 7 (9.7%) | 3 (21.4%) |
| 75 Years and over | 16 (84.2%) | 27 (61.4%) |
Disability Class: Vision Difficulty
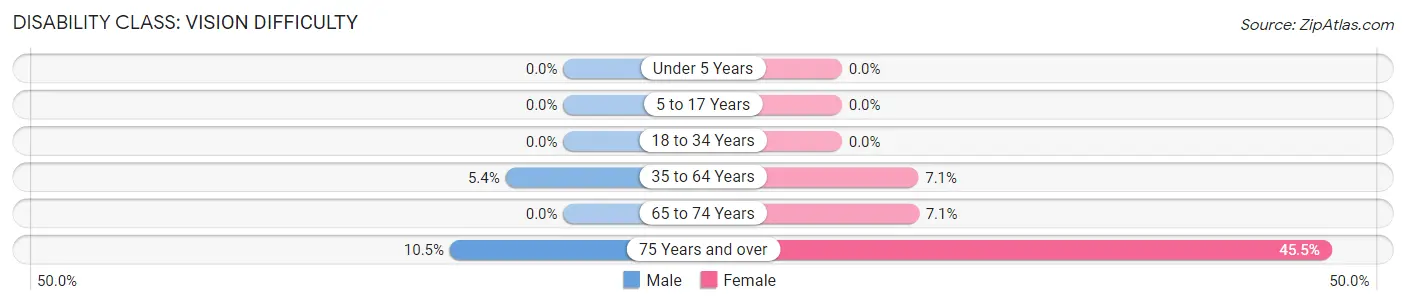
| Age Bracket | Male | Female |
| Under 5 Years | 0 (0.0%) | 0 (0.0%) |
| 5 to 17 Years | 0 (0.0%) | 0 (0.0%) |
| 18 to 34 Years | 0 (0.0%) | 0 (0.0%) |
| 35 to 64 Years | 9 (5.4%) | 12 (7.1%) |
| 65 to 74 Years | 0 (0.0%) | 1 (7.1%) |
| 75 Years and over | 2 (10.5%) | 20 (45.5%) |
Disability Class: Cognitive Difficulty
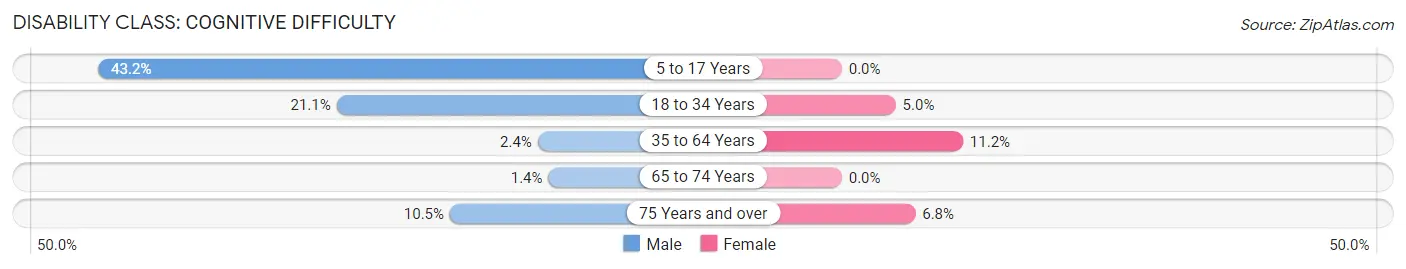
| Age Bracket | Male | Female |
| 5 to 17 Years | 19 (43.2%) | 0 (0.0%) |
| 18 to 34 Years | 16 (21.0%) | 2 (5.0%) |
| 35 to 64 Years | 4 (2.4%) | 19 (11.2%) |
| 65 to 74 Years | 1 (1.4%) | 0 (0.0%) |
| 75 Years and over | 2 (10.5%) | 3 (6.8%) |
Disability Class: Ambulatory Difficulty
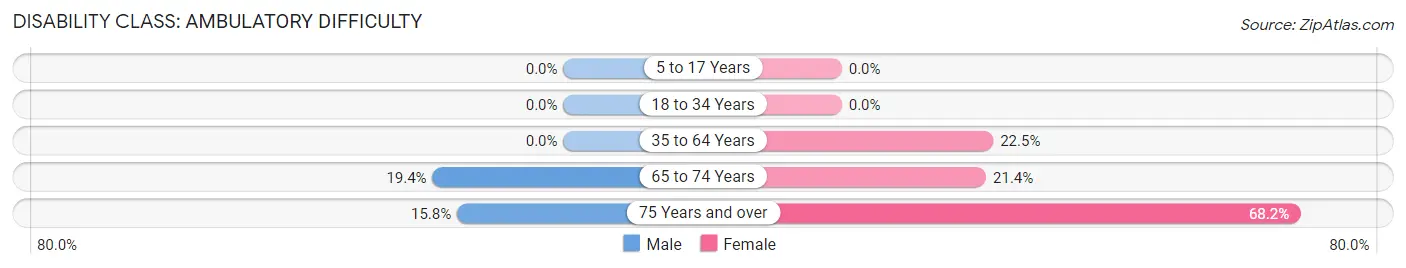
| Age Bracket | Male | Female |
| 5 to 17 Years | 0 (0.0%) | 0 (0.0%) |
| 18 to 34 Years | 0 (0.0%) | 0 (0.0%) |
| 35 to 64 Years | 0 (0.0%) | 38 (22.5%) |
| 65 to 74 Years | 14 (19.4%) | 3 (21.4%) |
| 75 Years and over | 3 (15.8%) | 30 (68.2%) |
Disability Class: Self-Care Difficulty
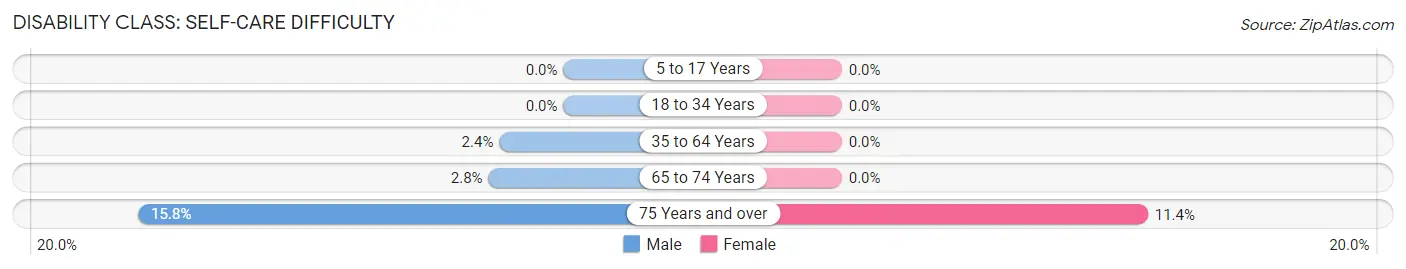
| Age Bracket | Male | Female |
| 5 to 17 Years | 0 (0.0%) | 0 (0.0%) |
| 18 to 34 Years | 0 (0.0%) | 0 (0.0%) |
| 35 to 64 Years | 4 (2.4%) | 0 (0.0%) |
| 65 to 74 Years | 2 (2.8%) | 0 (0.0%) |
| 75 Years and over | 3 (15.8%) | 5 (11.4%) |
Technology Access in Watauga
Computing Device Access in Watauga
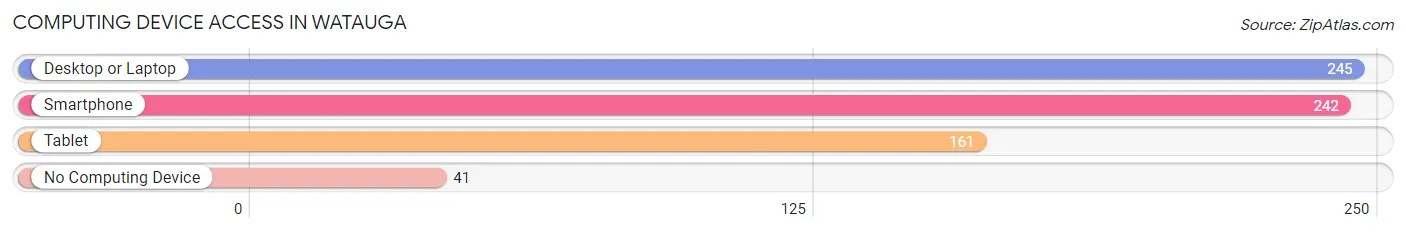
| Device Type | # Households | % Households |
| Desktop or Laptop | 245 | 75.8% |
| Smartphone | 242 | 74.9% |
| Tablet | 161 | 49.8% |
| No Computing Device | 41 | 12.7% |
| Total | 323 | 100.0% |
Internet Access in Watauga
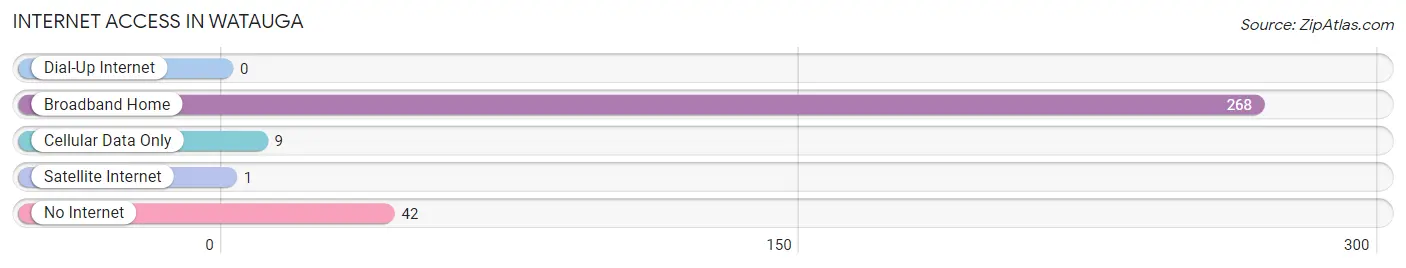
| Internet Type | # Households | % Households |
| Dial-Up Internet | 0 | 0.0% |
| Broadband Home | 268 | 83.0% |
| Cellular Data Only | 9 | 2.8% |
| Satellite Internet | 1 | 0.3% |
| No Internet | 42 | 13.0% |
| Total | 323 | 100.0% |
Watauga Summary
Watauga is a small town located in Carter County, Tennessee. It is situated in the Appalachian Mountains, and is part of the Tri-Cities region of northeast Tennessee. The town has a population of approximately 1,500 people, and is known for its rural charm and friendly atmosphere.
History
Watauga was first settled in the early 1800s by settlers from North Carolina. The town was named after the Watauga River, which runs through the area. The river was named after the Watauga Association, a group of settlers who had established a government in the area in 1772.
The town was officially incorporated in 1887. During the late 19th and early 20th centuries, Watauga was a thriving agricultural community. The town was home to several mills, including a cotton mill, a sawmill, and a gristmill.
Geography
Watauga is located in the Appalachian Mountains of northeast Tennessee. The town is situated in the Watauga Valley, which is surrounded by the Cherokee National Forest. The town is located at the intersection of US Highway 321 and State Route 67.
The Watauga River runs through the town, and is a popular destination for fishing and canoeing. The town is also home to several parks, including Watauga Lake Park and Watauga River Park.
Economy
The economy of Watauga is largely based on agriculture and tourism. The town is home to several farms, which produce a variety of crops, including corn, soybeans, and hay. The town is also home to several wineries, which produce a variety of wines.
Tourism is an important part of the local economy. The town is home to several attractions, including the Watauga Valley Railroad Museum, the Watauga Valley Art Center, and the Watauga County Historical Museum. The town is also home to several festivals, including the Watauga County Fair and the Watauga Valley Bluegrass Festival.
Demographics
As of the 2010 census, Watauga had a population of 1,500 people. The racial makeup of the town was 95.3% White, 0.7% African American, 0.7% Native American, 0.3% Asian, 0.3% from other races, and 2.7% from two or more races. Hispanic or Latino of any race were 1.3% of the population.
The median income for a household in Watauga was $30,000, and the median income for a family was $35,000. The per capita income for the town was $15,000. About 15.7% of families and 19.3% of the population were below the poverty line, including 25.0% of those under age 18 and 10.0% of those age 65 or over.
Conclusion
Watauga is a small town located in Carter County, Tennessee. It is situated in the Appalachian Mountains, and is part of the Tri-Cities region of northeast Tennessee. The town has a population of approximately 1,500 people, and is known for its rural charm and friendly atmosphere. The economy of Watauga is largely based on agriculture and tourism, and the town is home to several attractions, including the Watauga Valley Railroad Museum, the Watauga Valley Art Center, and the Watauga County Historical Museum. The racial makeup of the town is predominantly White, with a small percentage of African American, Native American, and Asian residents. The median income for a household in Watauga is $30,000, and the median income for a family is $35,000.
Common Questions
What is Per Capita Income in Watauga?
Per Capita income in Watauga is $33,335.
What is the Median Family Income in Watauga?
Median Family Income in Watauga is $71,000.
What is the Median Household income in Watauga?
Median Household Income in Watauga is $58,125.
What is Income or Wage Gap in Watauga?
Income or Wage Gap in Watauga is 21.3%.
Women in Watauga earn 78.7 cents for every dollar earned by a man.
What is Inequality or Gini Index in Watauga?
Inequality or Gini Index in Watauga is 0.38.
What is the Total Population of Watauga?
Total Population of Watauga is 714.
What is the Total Male Population of Watauga?
Total Male Population of Watauga is 396.
What is the Total Female Population of Watauga?
Total Female Population of Watauga is 318.
What is the Ratio of Males per 100 Females in Watauga?
There are 124.53 Males per 100 Females in Watauga.
What is the Ratio of Females per 100 Males in Watauga?
There are 80.30 Females per 100 Males in Watauga.
What is the Median Population Age in Watauga?
Median Population Age in Watauga is 49.0 Years.
What is the Average Family Size in Watauga
Average Family Size in Watauga is 2.9 People.
What is the Average Household Size in Watauga
Average Household Size in Watauga is 2.2 People.
How Large is the Labor Force in Watauga?
There are 303 People in the Labor Forcein in Watauga.
What is the Percentage of People in the Labor Force in Watauga?
49.3% of People are in the Labor Force in Watauga.
What is the Unemployment Rate in Watauga?
Unemployment Rate in Watauga is 22.4%.